A Balanced Approach: Beating Deficit Targets, While Investing in Priority Programs
The government is implementing a balanced and prudent plan to build Ontario together. It is a plan that will make life more affordable for individuals and families by putting more money back in people’s pockets. It is a plan that will ensure tax dollars are invested responsibly and critical services are improved not only for those who need them today, but also for future generations. The government’s plan harnesses Ontario’s tremendous potential to create a more competitive business environment, which will allow the province to compete with the world and win. To that end, the government is committed to building a province where everyone can have the opportunity to share in economic prosperity, no matter their background or the region of the province that they live in.
The government’s balanced plan rests on establishing a robust and comprehensive fiscal foundation. The government inherited a challenging fiscal situation from the previous government — for most of the past 15 years, unsustainable spending has resulted in structural deficits and an unprecedented increase in public debt, leaving the Province vulnerable to future economic shocks.
The Province last balanced its budget in 2007–08. Since then, annual deficits have added $107.3 billion in accumulated debt, bringing the Province’s total net debt to $353.7 billion. The $12.9 billion in interest the Province is forecast to pay on that debt this year is money that is not being used on people’s priorities instead. As a result of past fiscal decisions, interest on debt is the government’s fourth largest expense item. Balancing the budget reduces interest costs and frees up more money for priority programs.
Over the last 16 months, the government has taken deliberate steps to balance the Province’s books. It implemented a process to help modernize government, find efficiencies and focus spending on priority areas such as health care and education. Additionally, the 2019 Budget set out a comprehensive five-year path to balance by 2023–24.
As a result, Ontario’s credit rating has been reaffirmed by all four rating agencies, including an improved outlook by Fitch Ratings. Ontario’s responsible and prudent approach to managing the Province’s finances has sent a positive signal to investors and businesses regionally, nationally and internationally.
The government has made steady progress and its plan is working. This year, the Province is projected to beat the deficit target set out in the 2019 Budget by $1.3 billion, an improvement to $9.0 billion from $10.3 billion. This reflects the benefits of a strong economy and revenue outlook, and prudent fiscal planning. As a result of the hard work by Ontarians to grow the economy and the government’s efforts to eliminate wasteful spending, the Province is able to allocate an additional $1.3 billion towards critical services such as health care, education, child care and social programs. A stronger balance sheet supports a competitive economy and the sustainability of government services.
Although the Province is now heading in the right direction, there is still much work to be done. With this 2019 Ontario Economic Outlook and Fiscal Review, the government is demonstrating that it is listening to the people of Ontario — making positive changes to ensure the sustainability of critical public services and investing an additional $1.3 billion in priority programs this year, while at the same time reducing the deficit.
The government’s plan is also setting Ontario on a course to a better quality of life that hard-working individuals and families deserve.
Ontario’s Fiscal Outlook
As part of its plan to build Ontario’s future, the government has been responsive by making changes since the 2019 Budget in a way that ensures critical public services are supported on an ongoing basis, while maintaining its commitment to balance the budget by 2023. By adopting a prudent approach to financial management, Ontario’s finances are on a path towards fiscal sustainability.
Over the outlook, the government is projecting deficits of $9.0 billion in 2019–20, $6.7 billion in 2020–21 and $5.4 billion in 2021–22. Improvements are primarily the result of higher revenues. Reduced interest on debt costs are due to the reduction in the 2018–19 and 2019–20 deficits and lower interest rates.
In 2019–20, the net debt-to-GDP ratio is projected to be 40.0 per cent, or 0.7 percentage points lower than the 40.7 per cent forecast in the 2019 Budget.
See Chapter 3: Ontario’s Fiscal Plan and Outlook for more details on the Province’s fiscal outlook.
| Actual 2018–19 |
Current Outlook 2019–20 |
Medium-Term Outlook 2020–21 |
Medium-Term Outlook 2021–22 |
|
|---|---|---|---|---|
| Revenue — Personal Income Tax | 35.4 | 37.1 | 38.6 | 39.4 |
| Revenue — Sales Tax | 27.8 | 28.1 | 28.9 | 29.9 |
| Revenue — Corporations Tax | 16.6 | 16.1 | 16.7 | 17.3 |
| Revenue — Other Taxes | 25.7 | 26.4 | 27.2 | 27.0 |
| Total Taxation | 105.5 | 107.7 | 111.5 | 113.6 |
| Government of Canada | 25.1 | 25.5 | 26.6 | 27.2 |
| Income from Government Business Enterprises | 5.5 | 5.8 | 6.3 | 6.9 |
| Other Non-Tax Revenue | 17.6 | 16.7 | 17.2 | 17.6 |
| Total Revenue | 153.7 | 155.8 | 161.5 | 165.4 |
| Expense — Programs | 148.8 | 150.9 | 154.0 | 155.9 |
| Expense — Interest on Debt | 12.4 | 12.9 | 13.2 | 13.9 |
| Total Expense | 161.1 | 163.8 | 167.2 | 169.8 |
| Surplus/(Deficit) Before Reserve | (7.4) | (8.0) | (5.7) | (4.4) |
| Reserve | – | 1.0 | 1.0 | 1.0 |
| Surplus/(Deficit) | (7.4) | (9.0) | (6.7) | (5.4) |
| Net Debt as a Per Cent of GDP | 39.6 | 40.0 | 40.1 | 39.8 |
Note: Numbers may not add due to rounding.
Source: Ontario Ministry of Finance.
Ontario’s Economic Outlook
Ontario’s economy has continued to expand, supported by the government’s plan to help businesses invest, grow and create good jobs. Since June 2018, more than 272,000 net new jobs have been created and the unemployment rate is near historical lows. Ontario’s real gross domestic product (GDP) continues to rise, averaging 0.5 per cent growth over the last four quarters.
Ontario is expected to experience continued economic growth over the 2019 to 2022 period. The Ministry of Finance projects Ontario’s real GDP to grow by 1.4 per cent in 2019, 1.5 per cent in 2020, 1.5 per cent in 2021 and 1.9 per cent in 2022. These growth forecasts are below the average among private-sector economic forecasts for the province and demonstrate prudence.
There is a wide range of risks around Ontario’s economic growth outlook, including heightened global trade and political tensions, slowing global growth, elevated household debt levels, and financial market volatility. In a sea of global uncertainty, Ontario remains focused on being an island of stability and prosperity.
A summary of Ontario’s economic outlook is presented below. See Chapter 2: Economic Outlook for more details.
| 2018 | 2019p | 2020p | 2021p | 2022p | |
|---|---|---|---|---|---|
| Real GDP Growth | 2.3 | 1.4 | 1.5 | 1.5 | 1.9 |
| Nominal GDP Growth | 3.5 | 3.4 | 3.3 | 3.3 | 3.6 |
| Employment Growth | 1.6 | 2.6 | 1.2 | 1.0 | 1.1 |
| CPI Inflation | 2.4 | 2.0 | 2.0 | 1.9 | 1.9 |
p = Ontario Ministry of Finance planning projection based on information up to October 9, 2019.
Sources: Statistics Canada and Ontario Ministry of Finance.
Ontario’s Debt Challenge
The Province’s net debt is projected to reach $353.7 billion by the end of 2019–20, with interest payments to service that debt forecast at $12.9 billion. The government is committed to addressing the debt burden, put the Province’s finances on a more sustainable path and balance the budget by 2023.
Through the implementation of the debt burden reduction strategy, the government’s objective is to keep the net debt-to-GDP ratio, through to 2022–23, to less than the Independent Financial Commission of Inquiry’s forecast for 2018–19 of 40.8 per cent. The net debt-to-GDP ratio is forecast to fall to 39.8 per cent in 2021–22, lower than the 40.6 per cent forecast at the time of the 2019 Budget.
As of October 24, 2019, $21.3 billion, or 67 per cent, of this year’s $31.9 billion long-term public borrowing was completed. The borrowing program is forecast to be $31.7 billion in 2020–21 and $31.2 billion in 2021–22.
| 2019 Budget |
In-Year Change | Current Outlook 2019–20 | Medium-Term Outlook 2020–21 |
Medium-Term Outlook 2021–22 |
|
|---|---|---|---|---|---|
| Deficit/(Surplus) | 10.3 | (1.3) | 9.0 | 6.7 | 5.4 |
| Investment in Capital Assets | 11.6 | – | 11.6 | 11.0 | 10.4 |
| Non-Cash Adjustments | (7.7) | – | (7.7) | (7.7) | (7.7) |
| Loans to Infrastructure Ontario | 0.2 | – | 0.2 | 0.1 | 0.2 |
| Other Net Loans/Investments | 0.7 | 0.0 | 0.7 | 0.5 | (0.1) |
| Debt Maturities/Redemptions | 27.5 | (0.1) | 27.4 | 26.6 | 24.0 |
| Total Funding Requirement | 42.5 | (1.3) | 41.2 | 37.2 | 32.2 |
| Decrease/(Increase) in Short-Term Borrowing | (1.2) | – | (1.2) | (1.0) | (1.0) |
| Increase/(Decrease) in Cash and Cash Equivalents | (5.3) | (2.8) | (8.1) | (4.5) | – |
| Total Long-Term Public Borrowing | 36.0 | (4.1) | 31.9 | 31.7 | 31.2 |
Note: Numbers may not add due to rounding.
Source: Ontario Financing Authority.
Ontario’s Capital Plan Outlook
The government is making strategic investments in the province’s infrastructure, including transit, highways, schools and hospitals. The planned outlook reflects a more sustainable level of investment of $144 billion over 10 years.
Key highlights of the capital plan include investments of:
- $67 billion in provincially owned and municipal transit priorities, including four new subway projects in the Greater Toronto Area and Stage 2 of the Ottawa Light Rail Transit project;
- $22 billion in highway improvements and expansion, including the QEW Credit River Bridge Improvement project, widening Highway 3 between the Town of Essex and the Municipality of Leamington, and four-laning Highways 11 and 17, including stretches between Kenora and the Manitoba border;
- $27 billion, including $17 billion in capital grants over the next 10 years to help end hallway health care by modernizing and increasing capacity in more than 60 major hospital projects that are currently under construction or in various stages of planning, including the Hamilton Health Sciences - West Lincoln Memorial Hospital, and the Ottawa Hospital - Civic Campus;
- $19 billion, including $13 billion in capital grants over the next 10 years to help build new schools in high-growth areas and improve the condition of existing schools. For example, construction is underway on a new elementary school in north Ajax and the new Georgian Bay Community School in Meaford;
- More than $3 billion to renew postsecondary infrastructure in colleges and universities and for state-of-the-art equipment for apprenticeship training;
- $2.5 billion to enhance social service infrastructure, including funding for two new children’s treatment centres in Ottawa and Ajax and for the National Housing Strategy; and
- $3.9 billion in justice infrastructure, including funding for new courthouses in Toronto and Halton Region; the modernization and replacement of aging Ontario Provincial Police (OPP) detachments across Ontario, and a new modernized correctional centre and jail in Thunder Bay.
The capital plan outlook includes more than $10.2 billion in Provincial funding to support infrastructure projects across the province through the Investing in Canada Infrastructure Program. Funding will be distributed between four streams: Public Transit, Rural and Northern, Green Infrastructure, and Community, Culture and Recreation.
| Sector | Current Outlook 2019–20 |
Medium-Term Outlook 2020–21 |
Medium-Term Outlook 2021–22 |
10-Year Total |
|---|---|---|---|---|
| Transportation — Transit | 5,527 | 5,731 | 5,205 | 66,669 |
| Transportation — Provincial Highways | 2,737 | 2,723 | 2,538 | 22,069 |
| Transportation — Other Transportation, Property and Planning | 284 | 213 | 167 | 1,722 |
| Health — Hospitals | 2,357 | 2,214 | 2,724 | 26,989 |
| Health — Other Health | 237 | 231 | 269 | 3,288 |
| Education | 2,426 | 2,196 | 2,073 | 19,393 |
| Postsecondary Education and Training — Colleges and Other | 299 | 327 | 278 | 2,115 |
| Postsecondary Education and Training — Universities | 52 | 71 | 64 | 1,077 |
| Social | 297 | 174 | 239 | 2,487 |
| Justice | 617 | 709 | 628 | 3,903 |
| Other Sectors2 | 1,789 | 2,085 | 2,167 | 13,876 |
| Total Infrastructure Expenditures | 16,623 | 16,676 | 16,351 | 163,587 |
| Less: Other Partner Funding3 | 1,891 | 2,050 | 2,033 | 19,433 |
| Total4 | 14,732 | 14,627 | 14,318 | 144,154 |
Table footnotes:
[1] Includes interest capitalized during construction; third-party investments in hospitals, colleges and schools; federal and municipal contributions to provincially owned infrastructure investments; and transfers to municipalities, universities and non-consolidated agencies.
[2] Includes government administration, natural resources, and the culture and tourism industries.
[3] Other Partner Funding refers to third-party investments primarily in hospitals, colleges and schools.
[4] Includes federal/municipal contributions to provincial infrastructure investments.
Note: Numbers may not add due to rounding.
Chart Descriptions
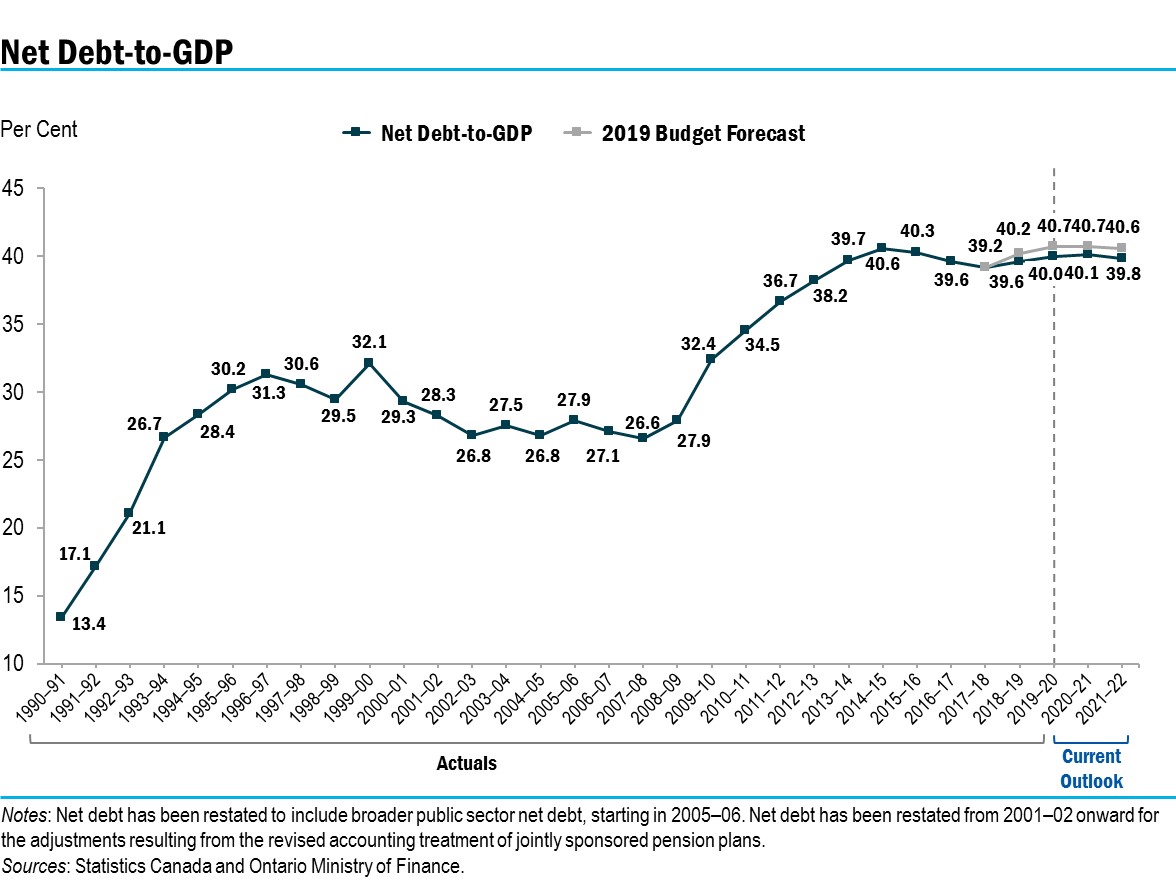
Chart: Net Debt-to-GDP
Ontario’s net debt-to-GDP ratio is forecast to be 40.0 per cent in 2019–20.
| Year | Net Debt-to-GDP (%) |
2019 Budget Forecast (%) |
|---|---|---|
| 1990–91 | 13.4 | |
| 1991–92 | 17.1 | |
| 1992–93 | 21.1 | |
| 1993–94 | 26.7 | |
| 1994–95 | 28.4 | |
| 1995–96 | 30.2 | |
| 1996–97 | 31.3 | |
| 1997–98 | 30.6 | |
| 1998–99 | 29.5 | |
| 1999–00 | 32.1 | |
| 2000–01 | 29.3 | |
| 2001–02 | 28.3 | |
| 2002–03 | 26.8 | |
| 2003–04 | 27.5 | |
| 2004–05 | 26.8 | |
| 2005–06 | 27.9 | |
| 2006–07 | 27.1 | |
| 2007–08 | 26.6 | |
| 2008–09 | 27.9 | |
| 2009–10 | 32.4 | |
| 2010–11 | 34.5 | |
| 2011–12 | 36.7 | |
| 2012–13 | 38.2 | |
| 2013–14 | 39.7 | |
| 2014–15 | 40.6 | |
| 2015–16 | 40.3 | |
| 2016–17 | 39.6 | |
| 2017–18 | 39.2 | 39.2 |
| 2018–19 | 39.6 | 40.2 |
| 2019–20 | 40.0 | 40.7 |
| 2020–21 | 40.1 | 40.7 |
| 2021–22 | 39.8 | 40.6 |
Notes: Net debt has been restated to include broader public-sector net debt, starting in 2005–06. Net debt has been restated from 2001–02 onward for the adjustments resulting from the revised accounting treatment of jointly sponsored pension plans.
Sources: Statistics Canada and Ontario Ministry of Finance.