Introduction
The COVID‑19 pandemic is having unprecedented impacts on economies around the world, including in Ontario. Between February and May, employment declined by nearly 1.2 million jobs in Ontario. In the second quarter (April to June) of this year, Ontario’s real Gross Domestic Product (GDP) declined by 12.3 per cent — about four times greater than the next largest quarterly decline in the early 1990s.
Although uncertainty caused by COVID‑19 remains, recent economic indicators point to a strong resumption of growth in the third quarter of 2020. As of September, employment has rebounded by 838,000 net jobs. Strong coordinated actions by governments to help people, families and businesses are supporting the recovery. See Chapter 1: Ontario’s Action Plan: Protect, Support, Recover for more details.
Ontario’s real GDP is projected to decline by 6.5 per cent in 2020 and rise 4.9 per cent in 2021, then gradually slow to growth of 3.5 per cent in 2022 and 2.0 per cent in 2023. For the purposes of prudent fiscal planning, these projections are slightly below the average of private-sector forecasts available at the time the planning projection was finalized. An extraordinary degree of uncertainty prevails regarding the economic outlook as it will be heavily influenced by the evolution of the COVID‑19 pandemic and its impacts on Ontario, Canada and the world.
| 2019 | 2020p | 2021p | 2022p | 2023p | |
|---|---|---|---|---|---|
| Real GDP Growth | 1.7 | (6.5) | 4.9 | 3.5 | 2.0 |
| Nominal GDP Growth | 3.9 | (5.0) | 6.6 | 5.7 | 4.2 |
| Employment Growth | 2.9 | (5.4) | 5.0 | 2.5 | 1.9 |
| CPI Inflation | 1.9 | 0.5 | 1.7 | 2.0 | 1.9 |
Table 2.1 footnotes:
p = Ontario Ministry of Finance planning projection based on information up to October 2, 2020.
Sources: Statistics Canada and Ontario Ministry of Finance.
Recent Economic Performance
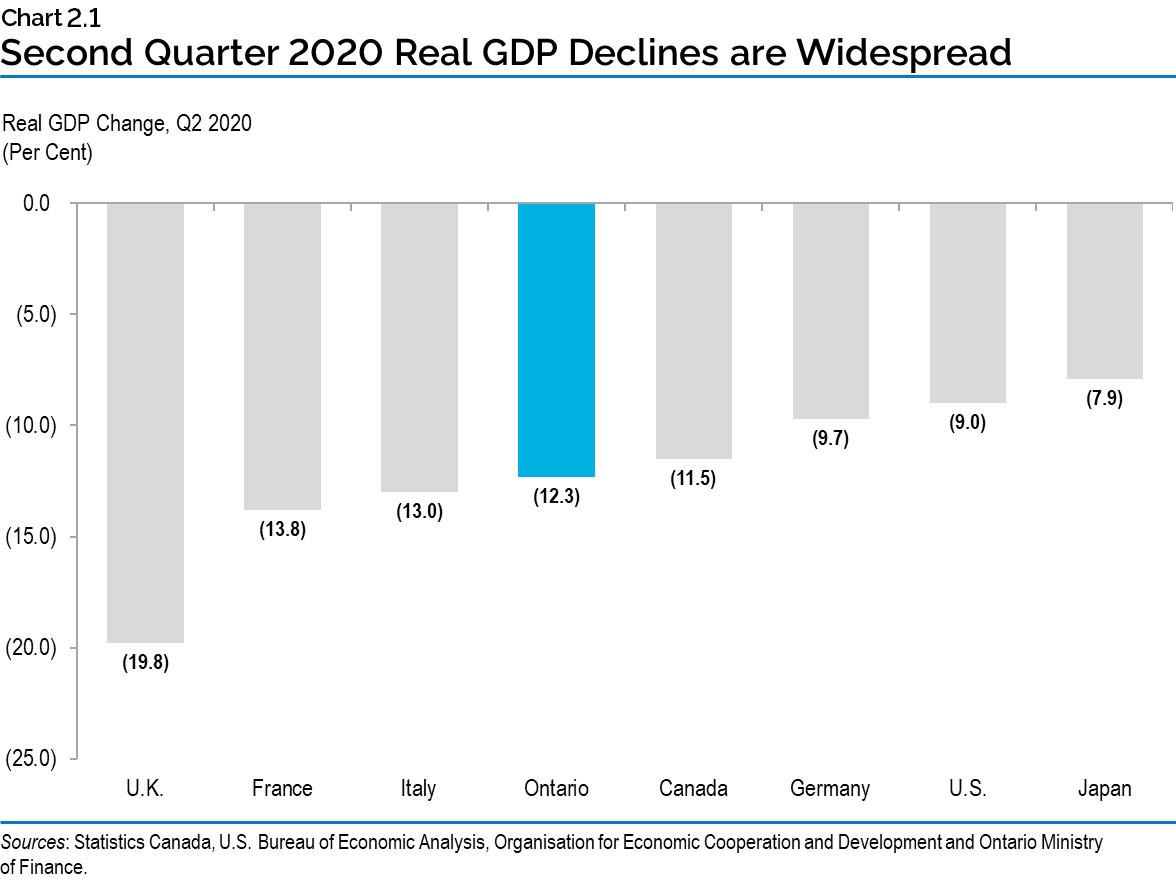
The COVID‑19 pandemic has significantly impacted the global economy. All G7 countries posted significant real GDP and employment declines in the second quarter of 2020. Canada’s real GDP declined by 11.5 per cent in the second quarter, while in the United States, Ontario’s largest trading partner, real GDP declined 9.0 per cent.
Ontario’s real GDP declined 12.3 per cent in the second quarter of 2020, as household consumption spending (−14.4 per cent), exports (−19.9 per cent) and total business investment spending (−16.4 per cent) declined in the quarter.
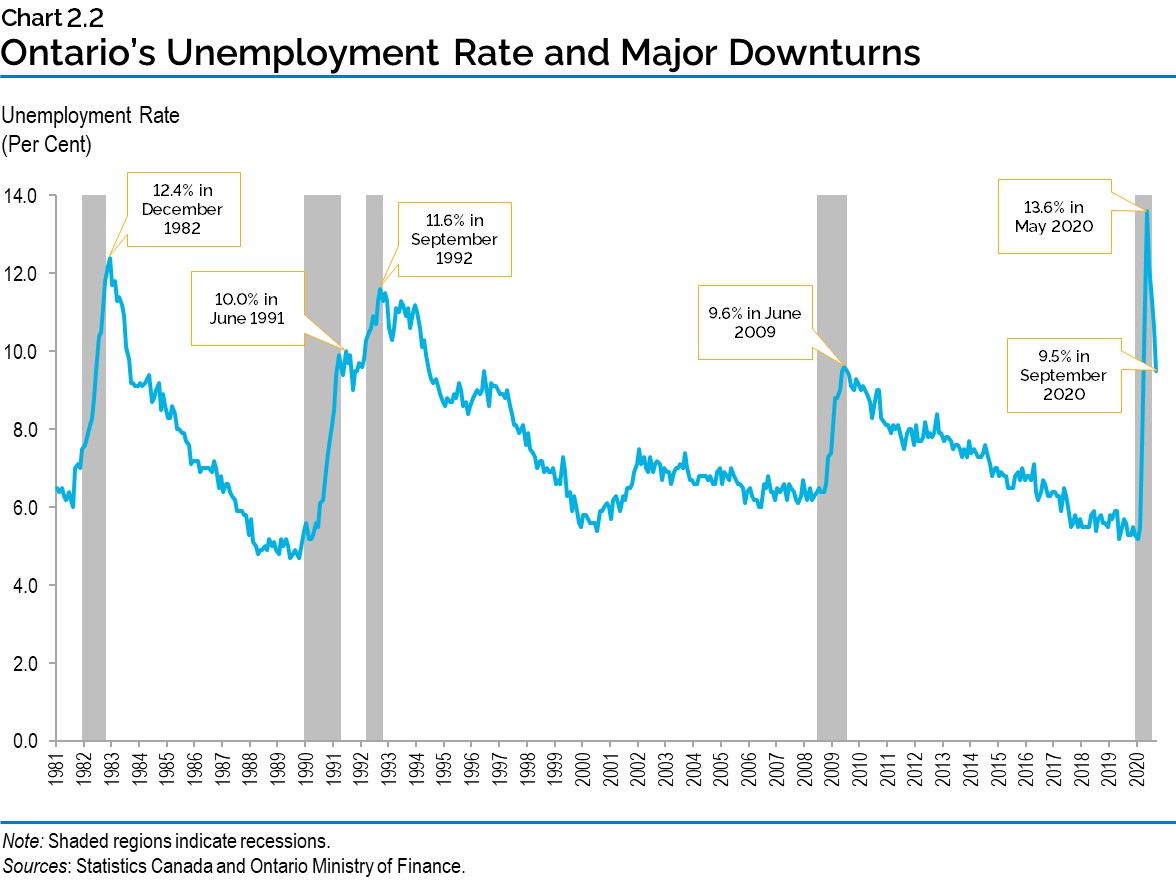
Between February and May, Ontario employment declined by nearly 1.2 million jobs (−15.3 per cent) and the unemployment rate increased to a record high of 13.6 per cent. Despite the unprecedented risk and uncertainty associated with the global pandemic, a significant proportion of the reduced economic activity has recovered. Since June, employment has risen by 838,000 net jobs and as of September reached 95.8 per cent of the February level, while the unemployment rate has decreased to 9.5 per cent. With these gains, employment in September had recovered to 318,500, or 4.2 per cent, below the February 2020 pre-pandemic level.
The impact of COVID‑19 has been uneven across businesses and the workforce. Certain sectors, such as accommodation and food services, have experienced relatively large employment losses. The decline in employment has been relatively large in the private sector and among small businesses. Females (−17.2 per cent) experienced a larger decline in employment than males (−13.6 per cent) between February and May. As of September, employment remained further below its pre COVID‑19 level for females (−4.8 per cent) than for males (−3.7 per cent). Those with employment most heavily impacted by the pandemic include part-time, low-wage and younger workers.
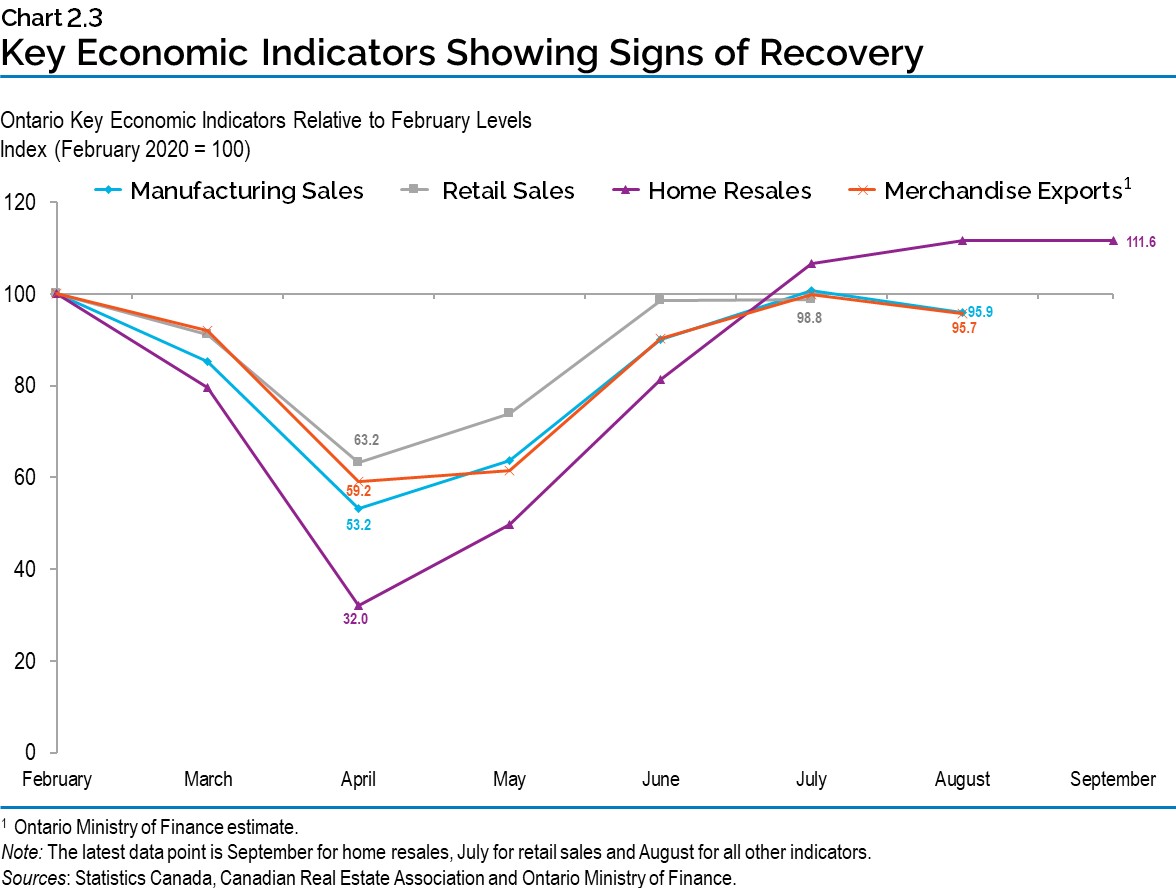
Other key monthly economic indicators are showing signs of recovery, as significant government support measures have been taken to protect and support the people and businesses of Ontario. See Chapter 1: Ontario’s Action Plan: Protect, Support, Recover for more details. Based on the latest available monthly data, home resales were 11.6 per cent above the February level, while retail sales (−1.2 per cent), manufacturing sales (−4.1 per cent) and merchandise exports (−4.3 per cent) were near their pre-pandemic levels.
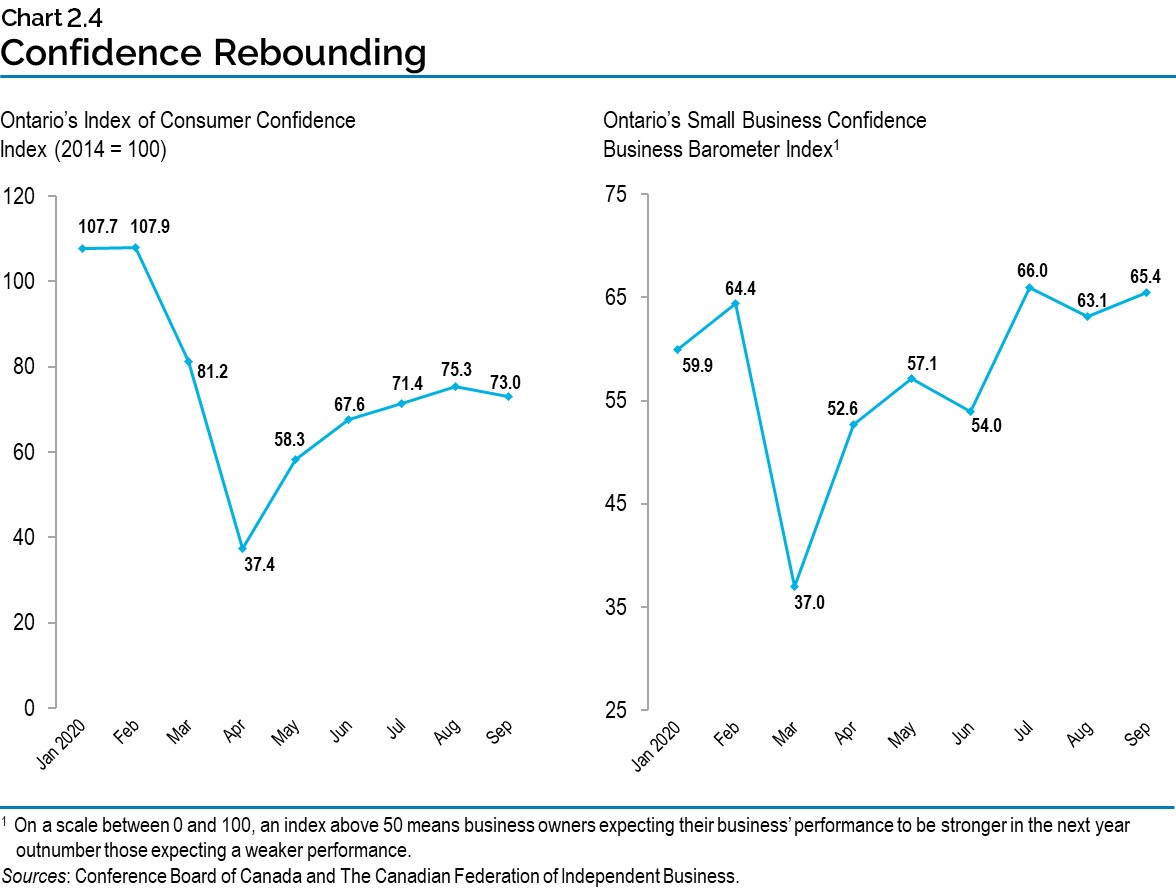
As of September 2020, confidence indicators also show a recovery in consumer and business sentiment. The Conference Board of Canada’s Index of Consumer Confidence for Ontario declined significantly as a result of the COVID‑19 pandemic to a low of 37.4 in April before rebounding to 73.0 in September. The Canadian Federation of Independent Business (CFIB) small business confidence index for Ontario declined significantly in March but has recently rebounded above the pre-pandemic level.
Ontario’s economic recovery has been supported by a broad range of measures in response to the COVID‑19 outbreak, including assistance to families, businesses and those on the front lines of the pandemic. For more information on these measures, see Chapter 1: Ontario’s Action Plan: Protect, Support, Recover.
Economic Outlook
The Ontario Ministry of Finance regularly consults with private-sector economists and tracks their forecasts to inform the government’s planning assumptions. Private-sector economists are projecting that Ontario’s economy will have a continued recovery from the pandemic over the forecast horizon. On average, forecasters expect real GDP to contract 6.1 per cent in 2020, grow 5.0 per cent in 2021, 3.6 per cent in 2022 and 2.1 per cent in 2023. The Ontario Ministry of Finance’s real GDP projections are set below the average of private-sector forecasts in each year for prudent planning purposes. Three economic experts reviewed the Ministry of Finance’s economic assumptions and found them to be reasonable.1
| 2020 | 2021 | 2022 | 2023 | |
|---|---|---|---|---|
| BMO Capital Markets (October) | (5.5) | 6.0 | – | – |
| Central 1 Credit Union (September) | (6.6) | 4.2 | 3.0 | 1.8 |
| CIBC Capital Markets (September) | (5.5) | 4.0 | 4.7 | – |
| The Conference Board of Canada (August) | (7.6) | 7.0 | 5.3 | 1.4 |
| Desjardins Group (September) | (5.2) | 4.9 | 2.4 | 2.6 |
| Laurentian Bank Securities (September) | (7.5) | 5.5 | – | – |
| National Bank of Canada (September) | (5.7) | 4.2 | – | – |
| Quantitative Economic Decisions, Inc. (July) | (6.9) | 4.5 | 4.0 | 1.7 |
| Royal Bank of Canada (September) | (5.8) | 5.2 | – | – |
| Scotiabank (September) | (5.7) | 4.7 | – | – |
| Stokes Economics (July) | (6.2) | 4.6 | 2.9 | 1.9 |
| TD Bank Group (September) | (5.7) | 4.3 | 3.4 | – |
| University of Toronto (August) | (5.4) | 6.5 | 3.2 | 3.0 |
| Private-Sector Survey Average | (6.1) | 5.0 | 3.6 | 2.1 |
| Ontario’s Planning Assumption | (6.5) | 4.9 | 3.5 | 2.0 |
Table 2.2 footnotes:
Source: Ontario Ministry of Finance Survey of Forecasters (October 2, 2020).
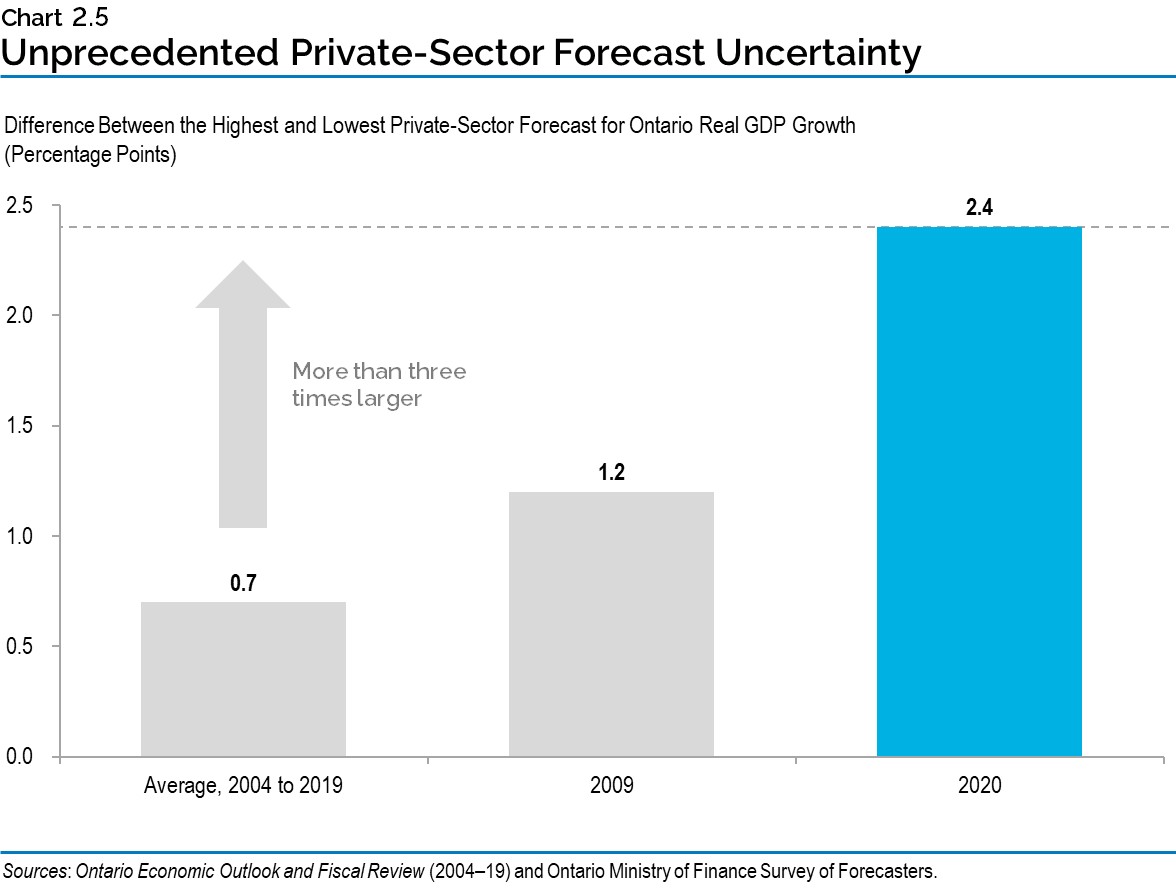
The COVID‑19 pandemic has created an unprecedented level of economic uncertainty globally and in Canada.2 This is reflected by an extraordinarily wide range in projections among private-sector forecasters for Ontario’s economy. Between 2004 and 2019, the average difference between the lowest and highest private-sector forecast for in-year Ontario real GDP growth, at this point in the fiscal year, was 0.7 percentage points. In 2009, a period of heightened uncertainty, the range was 1.2 percentage points. Currently, uncertainty regarding the state of the economy has contributed to the largest range in private-sector forecasts in recent history of 2.4 percentage points between the lowest and highest real GDP growth forecasts for 2020.
Global Economic Environment
Economic output contracted sharply during the first half of 2020 as the COVID‑19 pandemic took hold, sending the global economy into a recession. Global GDP is projected to decline 4.4 per cent in 2020, before growing 5.2 per cent in 2021. Significant risks to the global economy persist as the future path of the pandemic remains uncertain.
Real GDP in the United States contracted a record 9.0 per cent in the second quarter of 2020, following a 1.3 per cent decline in the first quarter. Recovery has been taking place as economic activity began to resume after COVID‑19 related restrictions eased. However, the expiry of the initial government support programs and persistently high levels of COVID‑19 infections have put downward pressure on the U.S. recovery. On an average annual basis, U.S. real GDP is projected to contract 4.0 per cent in 2020 and grow 3.9 per cent in 2021.
Real GDP in the euro area is projected to contract 8.3 per cent in 2020 and grow 5.2 per cent in 2021. Having faced the pandemic earlier than the rest of the world, China is the only major economy expected to experience growth in 2020 at a projected rate of 1.9 per cent. The level of economic output at the end of 2021 is expected to be lower than that at the end of 2019 for many economies, highlighting the continuing impact of the pandemic.
| 2019 | 2020p | 2021p | 2022p | 2023p | |
|---|---|---|---|---|---|
| World Real GDP Growth (Per Cent) | 2.8 | (4.4) | 5.2 | 4.2 | 3.8 |
| U.S. Real GDP Growth (Per Cent) | 2.2 | (4.0) | 3.9 | 2.9 | 2.3 |
| West Texas Intermediate (WTI) Crude Oil ($US per Barrel) | 43.0 | 40.0 | 47.0 | 52.0 | 56.0 |
| Canadian Dollar (Cents US) | 75.4 | 74.2 | 75.3 | 75.4 | 76.0 |
| Three-Month Treasury Bill Rate1 (Per Cent) | 1.7 | 0.4 | 0.2 | 0.2 | 0.4 |
| 10-Year Government Bond Rate2 (Per Cent) | 1.6 | 0.7 | 0.8 | 1.3 | 1.7 |
Table 2.3 footnotes:
p = Ontario Ministry of Finance planning projection based on external sources.
[1], [2] Government of Canada interest rates.
Sources: International Monetary Fund World Economic Outlook (October 2020), U.S. Bureau of Economic Analysis, U.S. Energy Information Administration, Bank of Canada, “Blue Chip Economic Indicators” (October 2020), and Ontario Ministry of Finance Survey of Forecasters.
Major central banks reacted quickly in response to COVID‑19 with actions to support economies and ensure financial markets continue to operate effectively. This included lowering policy interest rates and increasing direct financial market support through quantitative easing, which has contributed to lower long-term interest rates. As economies stabilized and resumed growth, major central banks have signalled that continued policy accommodation will be required to support financial markets, boost economic activity and reduce unemployment. In September, the U.S. Federal Reserve stated they expect their policy interest rate will remain near zero until at least 2023.
Following the onset of the pandemic, the Bank of Canada quickly lowered its policy interest rate from 1.75 per cent to 0.25 per cent, which the Bank has stated is the effective lower bound. To provide further economic support and avoid a sudden contraction of credit, the Bank established several large-scale asset purchase programs. These programs were aimed at a broad range of funding markets, supporting government and business-sector liquidity.
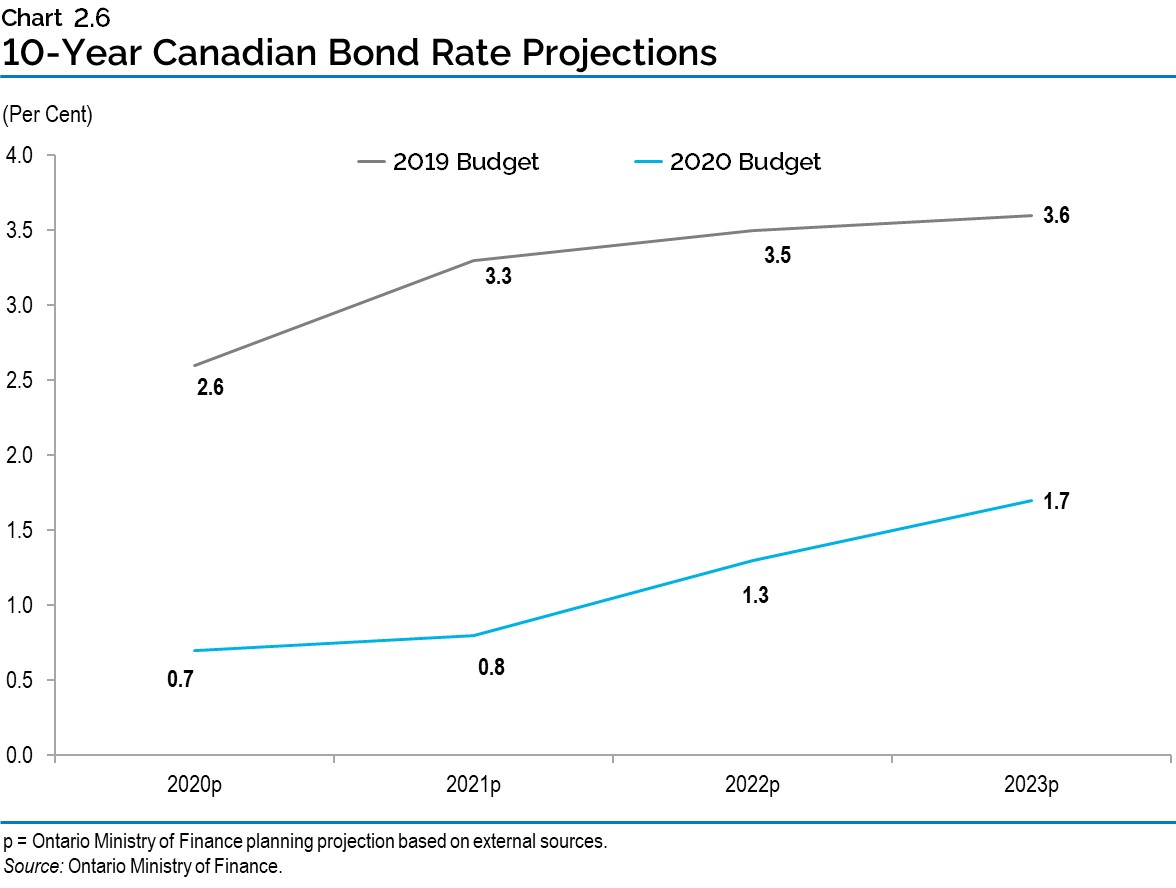
Three-month Treasury Bill rates are expected to remain little-changed through 2023. The weaker economic outlook along with central bank actions to support credit markets have contributed to a significant decline in Canadian long-term interest rates. Since February, the 10-year Government of Canada bond rate declined from over 1.25 per cent to below 0.5 per cent during the summer. Long-term interest rates are expected to remain low over the projection period, rising modestly from 0.7 per cent in 2020 to 1.7 per cent in 2023, significantly lower than projected before the pandemic.
Lower economic activity early in 2020 caused energy demand to decline sharply. West Texas Intermediate oil prices declined from over $60 US per barrel early in the year to under $10 US per barrel in April. Oil prices have since risen to around $40 US per barrel due to stronger energy demand. The Canadian dollar also moved lower over the same period earlier this year, declining from 77 cents US to 69 cents US. It has since increased to around 75 cents US and is expected to rise modestly over the forecast period to 76 cents US by 2023. Oil prices are projected to rise from $40 US per barrel in 2020 to $56 US per barrel in 2023.
Details of Ontario’s Economic Outlook
Table 2.4 provides details of the Ontario Ministry of Finance’s economic outlook over the forecast period.
| 2019 | 2020p | 2021p | 2022p | 2023p | |
|---|---|---|---|---|---|
| Real Gross Domestic Product | 1.7 | (6.5) | 4.9 | 3.5 | 2.0 |
| Nominal Gross Domestic Product | 3.9 | (5.0) | 6.6 | 5.7 | 4.2 |
| Compensation of Employees | 4.2 | (2.5) | 5.3 | 5.1 | 4.6 |
| Net Operating Surplus — Corporations | 2.6 | (16.0) | 10.0 | 10.3 | 2.7 |
| Nominal Household Consumption | 3.6 | (6.0) | 7.4 | 6.0 | 4.2 |
| Other Economic Indicators — Employment | 2.9 | (5.4) | 5.0 | 2.5 | 1.9 |
| Other Economic Indicators — Job Creation (000s) | 210 | (401) | 353 | 183 | 144 |
| Other Economic Indicators — Unemployment Rate (Per Cent) | 5.6 | 9.5 | 7.7 | 6.8 | 6.3 |
| Other Economic Indicators — Consumer Price Index | 1.9 | 0.5 | 1.7 | 2.0 | 1.9 |
| Other Economic Indicators — Housing Starts (000s) | 69.0 | 75.0 | 73.0 | 75.0 | 77.0 |
| Other Economic Indicators — Home Resales | 9.0 | 0.0 | 5.0 | 3.0 | 2.0 |
| Other Economic Indicators — Home Resale Prices | 6.4 | 12.0 | 0.0 | 2.0 | 4.0 |
| Key External Variables — U.S. Real Gross Domestic Product | 2.2 | (4.0) | 3.9 | 2.9 | 2.3 |
| Key External Variables — WTI Crude Oil ($US per Barrel) | 43.0 | 40.0 | 47.0 | 52.0 | 56.0 |
| Key External Variables — Canadian Dollar (Cents US) | 75.4 | 74.2 | 75.3 | 75.4 | 76.0 |
| Key External Variables — Three-Month Treasury Bill Rate1 | 1.7 | 0.4 | 0.2 | 0.2 | 0.4 |
| Key External Variables — 10-Year Government Bond Rate2 | 1.6 | 0.7 | 0.8 | 1.3 | 1.7 |
Table 2.4 footnotes:
p = Ontario Ministry of Finance planning projection.
[1], [2] Government of Canada interest rates (per cent).
Sources: Statistics Canada, Canada Mortgage and Housing Corporation, Canadian Real Estate Association, Bank of Canada, United States Bureau of Economic Analysis, “Blue Chip Economic Indicators” (October 2020), U.S. Energy Information Administration and Ontario Ministry of Finance.
Significant Revision to the Ontario Outlook since the 2019 Budget
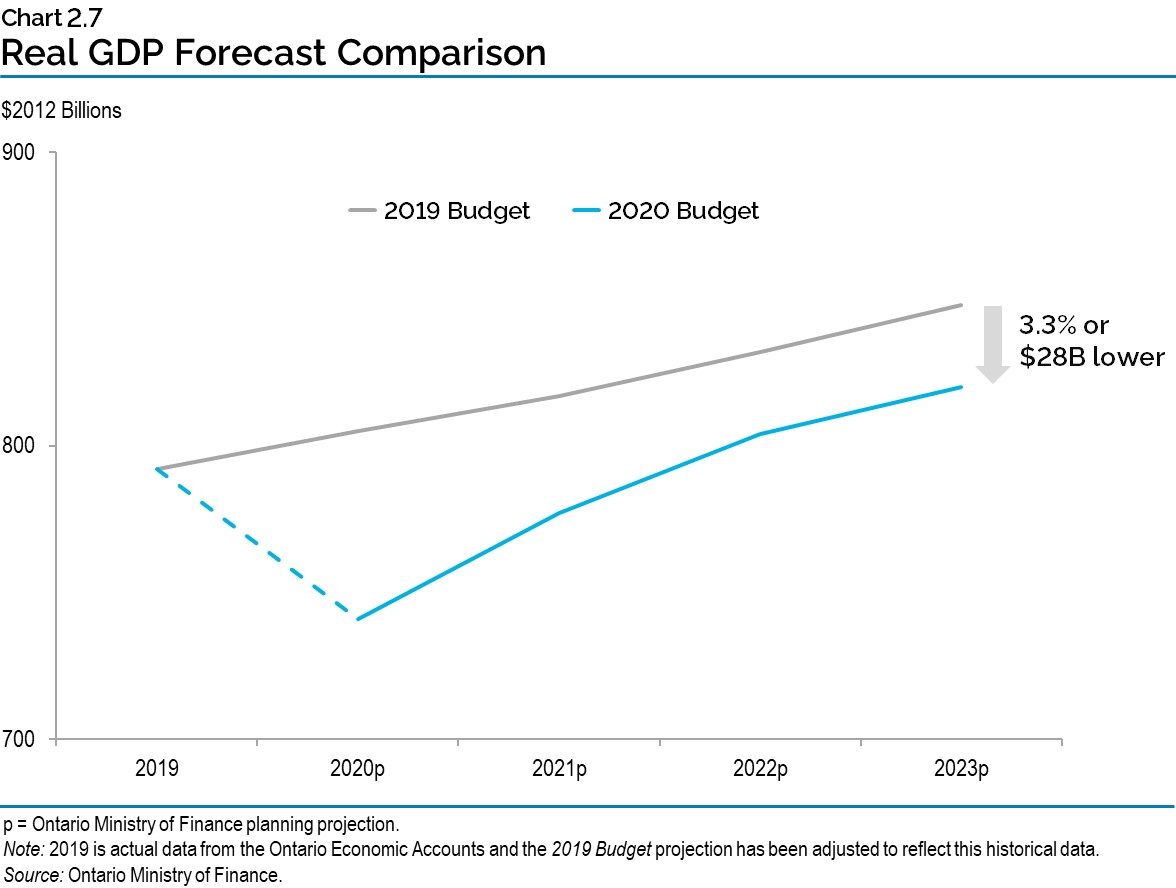
The COVID‑19 pandemic has led to a significant change in the projection for Ontario GDP over the forecast horizon. The 2019 Budget projected that between 2020 and 2023 Ontario real GDP would rise by 7.1 per cent and that nominal GDP would rise by 14.9 per cent. The current planning projection assumes that real GDP will rise by 3.6 per cent and nominal GDP will rise by 11.6 per cent over the same period. This represents a significant revision when compared to the 2019 Budget. By 2023, real GDP is projected to be 3.3 per cent or $28 billion lower than was projected in the 2019 Budget.
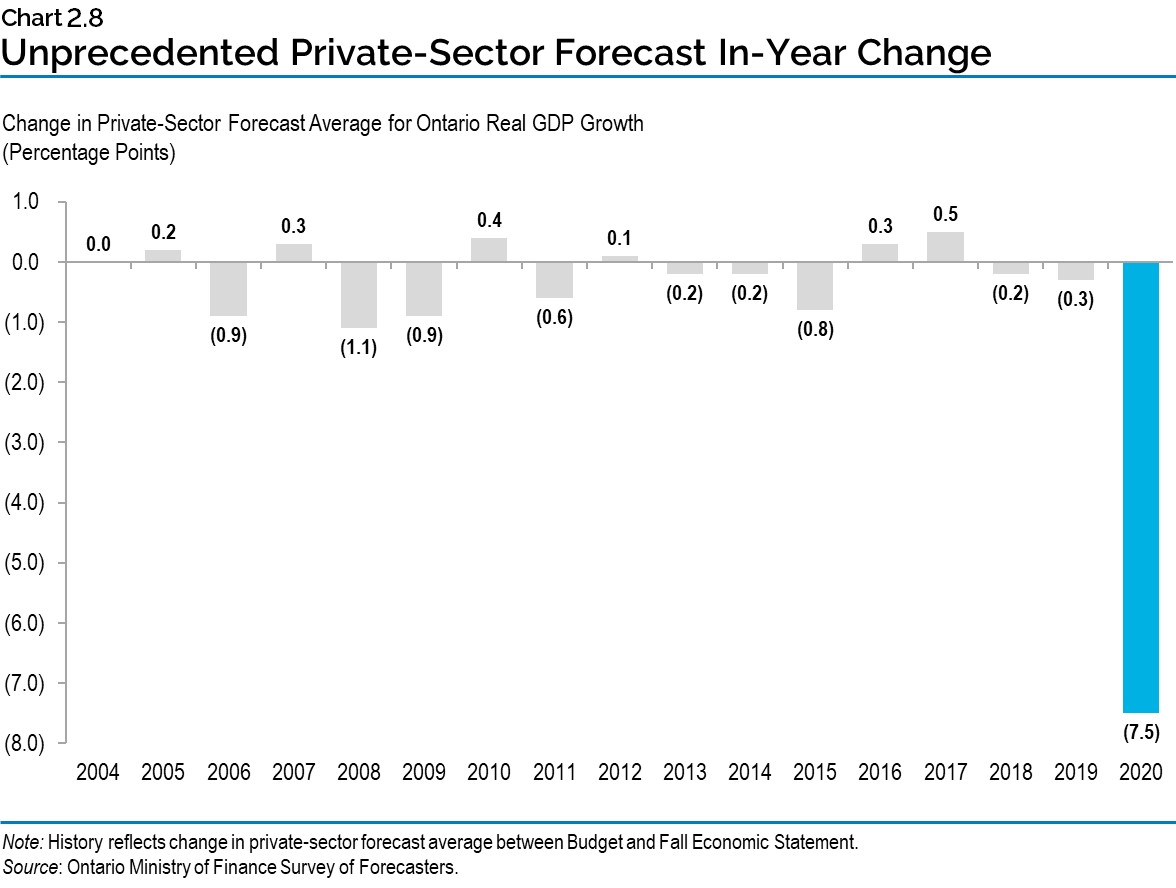
The change to the private-sector average for real GDP growth since March 2020 represents the largest in-year revision in recent history. Between 2004 and 2019, there were relatively moderate changes in the private-sector average for real GDP growth between the time of the Budget in the spring and the fall. During the 2008–09 downturn, a time of heightened economic uncertainty, the private-sector average forecast declined by 1.1 percentage points in 2008 and 0.9 percentage points in 2009. Since the time of the March 2020 Economic and Fiscal Update, the private-sector forecast average for real GDP growth has declined an unprecedented 7.5 percentage points.
Risks to the Outlook
The future path of the COVID‑19 pandemic represents the main risk to the global economy and for Ontario. The pandemic has significantly heightened economic uncertainty for the global and Canadian economies and international financial markets. In order to protect their economies, governments and central banks in all parts of the world have responded with unprecedented policy support. While support has been extensive, the future evolution of these measures will continue to pose uncertainty to the global economic outlook.
As the pandemic continues to evolve, the impacts on the Ontario and Canadian economies will become clearer. Major economic downturns in Ontario have been followed by a period of relatively strong and sustained growth. Historical experience suggests that average annual real GDP growth eventually resumes at or close to its pre-recession pace, as was the case following the recessions in Ontario in the early 1990s and 2008–09. However, there is a risk that the expected recovery may take longer due to the significant uncertainty surrounding the future path of the pandemic.
The current range of private-sector forecasts for Ontario over the medium term reflects the heightened uncertainty around the outlook, with real GDP growth forecasts ranging from 4.0 per cent to 7.0 per cent in 2021.
Table 2.5 displays current estimates of the impact of sustained changes in key external factors on Ontario’s real GDP, assuming other external factors are unchanged. The relatively wide range of estimated impacts reflects the uncertainty regarding how the economy could respond to these changes in external conditions.
| Change in Real GDP Growth First Year |
Change in Real GDP Growth Second Year |
|
|---|---|---|
| Canadian Dollar Depreciates by Five Cents US | +0.1 to +0.7 | +0.2 to +0.8 |
| Crude Oil Prices Decrease by $10 US per Barrel | +0.1 to +0.3 | +0.1 to +0.3 |
| U.S. Real GDP Growth Increases by One Percentage Point | +0.2 to +0.6 | +0.3 to +0.7 |
| Canadian Interest Rates Increase by One Percentage Point | (0.1) to (0.5) | (0.2) to (0.6) |
Table 2.5 footnotes:
Source: Ontario Ministry of Finance.
Economic Outlook Scenarios
The global economic disruptions caused by the COVID‑19 pandemic have led to unprecedented uncertainty surrounding the economic forecast. While the planning assumptions for economic growth are reasonable and slightly prudent based on available private-sector forecasts, there are a broad range of factors that could result in economic growth being relatively stronger or weaker.
In order to illustrate the unprecedented degree of economic uncertainty, the Ministry of Finance has developed two plausible alternative scenarios that the economy could take over the next several years. A scenario-based approach to presenting economic forecasts under current conditions of elevated uncertainty has also been used by the Government of Canada, the Bank of Canada, the International Monetary Fund and other major organizations.
The two alternative Faster Growth and Slower Growth scenarios represent reasonable alternative economic paths and are intended to illustrate a broader range of possible outcomes. These alternative scenarios should not be considered the best case or the worst case. Rather, they represent possible outcomes in this period of heightened uncertainty and are provided in an effort to be as transparent as possible.
| 2021p | 2022p | 2023p | |
|---|---|---|---|
| Faster Growth Scenario | 7.5 | 3.1 | 2.3 |
| Planning Projection | 4.9 | 3.5 | 2.0 |
| Slower Growth Scenario | 3.3 | 1.0 | 1.4 |
Table 2.6 footnotes:
p = Ontario Ministry of Finance planning projection and alternative scenarios.
Source: Ontario Ministry of Finance.
These scenarios indicate the broad range of risk related to future economic growth. In the planning projection, as well as in the Faster Growth scenario, real GDP is higher than the 2019 level in both 2022 and 2023. In the Faster Growth scenario, the level of real GDP in 2023 is 2.4 per cent higher than the planning projection, while in the Slower Growth scenario the level of real GDP in 2023 is 4.5 per cent lower.
Footnotes
[1] The three experts are from the Policy and Economic Analysis Program at the University of Toronto; Quantitative Economic Decisions, Inc; and Stokes Economic Consulting.
[2] For example, “Measuring Economic Policy Uncertainty” by Scott Baker, Nicholas Bloom and Steven J. Davis at www.PolicyUncertainty.com finds that “current levels of economic policy uncertainty are at extremely elevated levels compared to recent history.”
Chart Descriptions
Chart 2.1: Second Quarter 2020 Real GDP Declines are Widespread
This bar chart illustrates real gross domestic product growth in the second Quarter of 2020 for select global jurisdictions. Real gross domestic product declines in the second quarter are as follows: −19.8 per cent in the United Kingdom; −13.8 per cent in France; −13.0 per cent in Italy; −12.3 per cent in Ontario; −11.5 per cent in Canada; −9.7 per cent in Germany; −9.0 per cent in the United States and −7.9 per cent in Japan.
Sources: Statistics Canada, U.S. Bureau of Economic Analysis, Organisation for Economic Cooperation and Development, and Ontario Ministry of Finance.
Chart 2.2: Ontario’s Unemployment Rate and Major Downturns
This line chart illustrates Ontario’s monthly unemployment rate from January 1981 to September 2020 with shaded regions indicating major downturns. Ontario had periods of recessions from the first quarter of 1982 to the third quarter of 1982; the first quarter of 1990 to the first quarter of 1991; the second quarter of 1992 to the third quarter of 1992; the third quarter of 2008 to the second quarter of 2009 and the first and second quarter of 2020.
Recessionary periods contained or were followed by local peak unemployment rates. Notable unemployment rates following a recession are as follows: 12.4 per cent in December 1982; 10.0 per cent in June 1991; 11.6 per cent in September 1992; 9.6 per cent in June 2009 and 13.6 per cent in May 2020. Most recently, the unemployment rate was 9.5 per cent in September 2020.
Note: Shaded regions indicate recessions.
Sources: Statistics Canada and Ontario Ministry of Finance.
Chart 2.3: Key Economic Indicators Showing Signs of Recovery
This line chart illustrates Ontario’s monthly manufacturing sales, retail sales, home resales and merchandise exports indexed where February 2020 levels equal 100.
Manufacturing sales declined from 100.0 in February to 53.2 in April and rose to 95.9 in August. Retail sales declined from 100.0 in February to 63.2 in April and rose to 98.8 in July. Home Resales declined from 100.0 to 32.0 in April and rose to 111.6 in September.
Merchandise exports declined from 100.0 to 59.2 in April and rose to 95.7 in August.
1Ontario Ministry of Finance estimate.
Note: The latest data point is September for home resales, July for retail sales and August for other indicators.
Sources: Statistics Canada, Canadian Real Estate Association and Ontario Ministry of Finance
Chart 2.4: Confidence Rebounding
This chart contains two-line charts that illustrate Ontario’s index of consumer confidence and Ontario’s small business barometer index from January 2020 to September 2020.
Ontario’s small business confidence is indexed where January 2014 equals 100. The monthly index levels are as follows: 107.7 in January; 107.9 in February; 81.2 in March; 37.4 in April; 58.3 in May; 67.6 in June; 71.4 in July; 75.3 in August and 73.0 in September.
Ontario’s small business confidence measured by the business barometer index1 is as follows: 59.9 in January; 64.4 in February; 37.0 in March; 52.6 in April; 57.1 in May; 54.0 in June; 66.0 in July; 63.1 in August and 65.4 in September.
1On a scale between 0 and 100, an index above 50 means business owners expecting their business’ performance to be stronger in the next year outnumber those expecting a weaker performance.
Sources: Conference Board of Canada and The Canadian Federation of Independent Business.
Chart 2.5: Unprecedented Private-Sector Forecast Uncertainty
The bar chart shows the difference between the highest and lowest private-sector forecast for Ontario real GDP growth. The average difference from 2004 to 2019 was 0.7 percentage point. In 2009, the difference was 1.2 percentage points. In 2020, the difference is 2.4 percentage points.
Sources: Ontario Economic Outlook and Fiscal Review (2004–19) and Ontario Ministry of Finance Survey of Forecasters
Chart 2.6: 10-Year Canadian Bond Rate Projections
This line chart shows the projections for 10-year Canadian bond rate in the 2019 Budget and in the 2020 Budget. In the 2019 Budget, the 10-year bond rate was projected to be 2.6 per cent in 2020, 3.3 per cent in 2021, 3.5 per cent in 2022 and 3.6 per cent in 2023. In the 2020 Budget, the 10-year bond rate was projected to be 0.7 per cent in 2020, 0.8 per cent in 2021, 1.3 per cent in 2022 and 1.7 per cent in 2023.
Source: Ontario Ministry of Finance
Chart 2.7: Real GDP Forecast Comparison
This line chart shows the projections for Ontario real GDP in billions of 2012 dollars in the 2019 Budget and in the 2020 Budget. Ontario real GDP was $792 billion in 2019. In the 2019 Budget, Ontario real GDP was projected to reach $805 billion in 2020, $817 billion in 2021, $832 billion in 2022, and $848 billion in 2023. In the 2020 Budget, Ontario real GDP was projected to be $741 billion in 2020, $777 billion in 2021, $804 billion in 2022, and $820 billion in 2023.
Note: 2019 is actual data from the Ontario Economic Accounts and the 2019 Budget projection has been adjusted to reflect this historical data.
Source: Ontario Ministry of Finance
Chart 2.8: Unprecedented Private-Sector Forecast In-Year Change
This bar chart shows the changes in private-sector forecast average in percentage points for Ontario real GDP growth between the Budget and the Fall Economic Statement each year for years 2004 to 2020. The changes were 0.0 in 2004, 0.2 in 2005, −0.9 in 2006, 0.3 in 2007, −1.1 in 2008, −0.9 in 2009, 0.4 in 2010, −0.6 in 2011, 0.1 in 2012, −0.2 in 2013 and 2014, −0.8 in 2015, 0.3 in 2016, 0.5 in 2017, −0.2 in 2018, −0.3 in 2019 and −7.5 in 2020.
Source: Ontario Ministry of Finance Survey of Forecasters
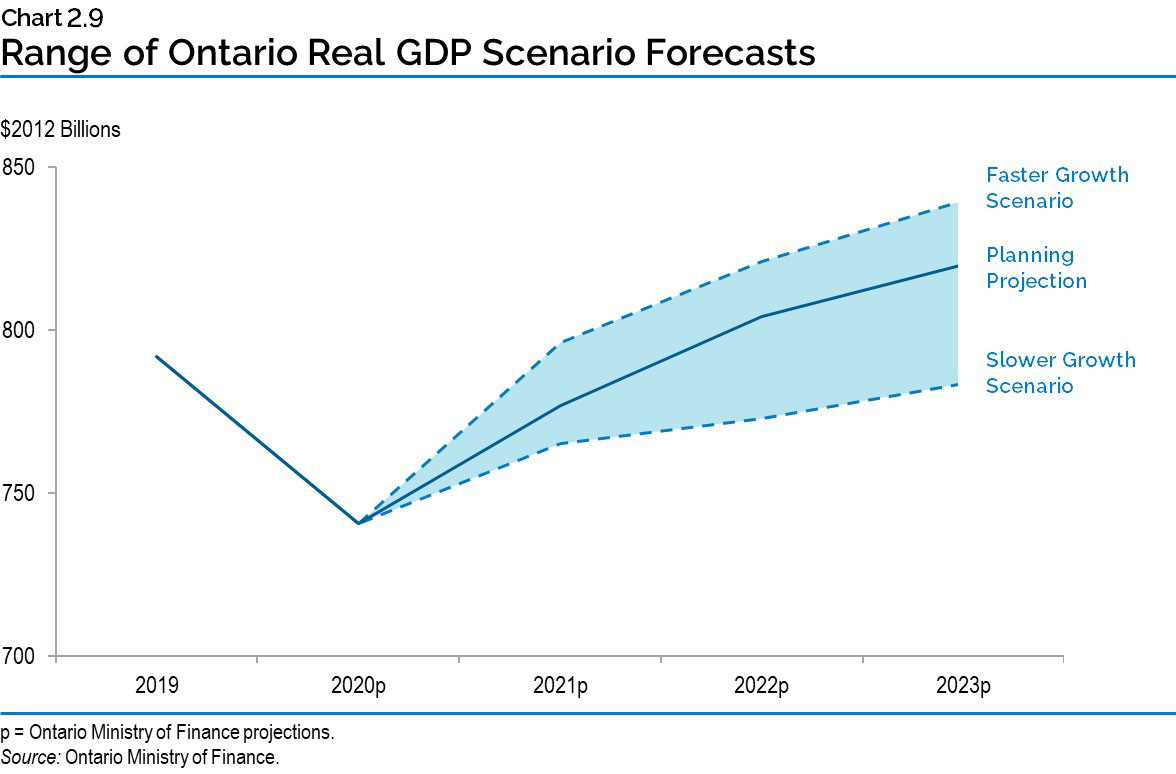
Chart 2.9: Range of Ontario Real GDP Scenario Forecasts
This chart shows the projected levels of Ontario real GDP in billions of 2012 dollars under three scenarios: the planning assumption, the Faster Growth scenario and the Slower Growth scenario. Ontario real GDP was $792 billion in 2019 and projected to be $741 billion for all three scenarios. Under the planning assumption, Ontario real GDP is projected to be $777 billion in 2021, $804 billion in 2022, and $820 billion in 2023. Under the Slower Growth scenario, Ontario real GDP is projected to be $765 billion in 2021, $773 billion in 2022, and $784 billion in 2023. Under the Faster Growth scenario, Ontario real GDP is projected to be $796 billion in 2021, $821 billion in 2022, and $840 billion in 2023.
Source: Ontario Ministry of Finance