Introduction
The government has a plan to build Ontario, laying the foundation for the province’s long-term recovery, growth and prosperity. The 2022 Budget includes a multi-year fiscal plan with significant investments in health care, education and critical infrastructure to achieve the government’s ambitious vision for the province.
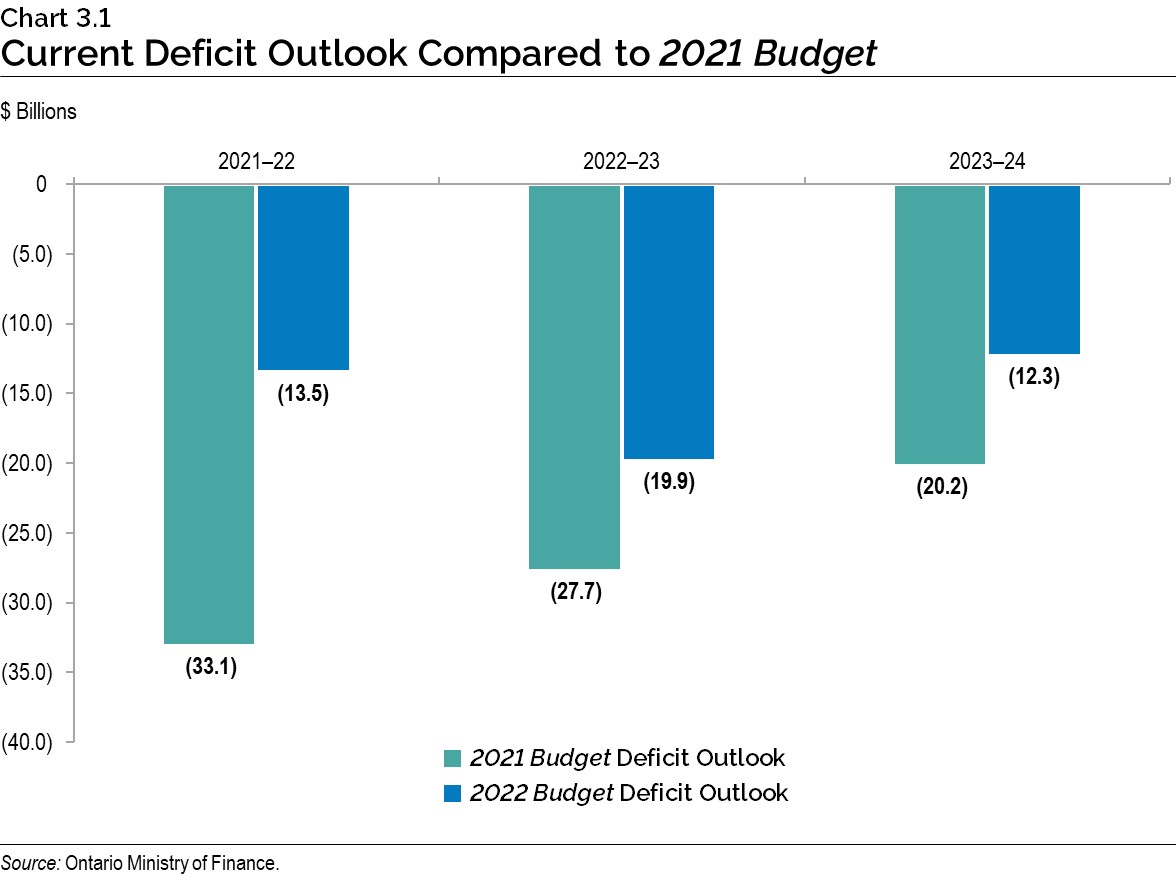
Ontario is projecting a $13.5 billion deficit in 2021–22. Over the medium term, the government is projecting deficits of $19.9 billion in 2022–23, declining to $12.3 billion in 2023–24 and $7.6 billion in 2024–25. The 2022 Budget deficit outlook represents a significant improvement compared to the outlook published in the 2021 Budget, demonstrating the strength of Ontario’s recovery.
Primarily due to a lower-than-forecast deficit and higher nominal GDP, the net debt-to-GDP ratio is projected to be 40.7 per cent in 2021–22, 8.1 percentage points lower than the 48.8 per cent forecast presented in the 2021 Budget. Over the medium-term outlook, Ontario’s net debt-to-GDP ratio is now forecast to be 41.4 per cent in 2022–23 and 2023–24, and declining to 41.3 per cent in 2024–25.
| Actual 2020–21 |
Interim1 2021–22 |
Medium-Term Outlook 2022–23 |
Medium-Term Outlook 2023–24 |
Medium-Term Outlook 2024–25 |
|
|---|---|---|---|---|---|
| Revenue | 164.9 | 173.6 | 179.8 | 188.2 | 196.9 |
| Expense — Programs2 | 169.0 | 174.1 | 185.2 | 184.8 | 188.1 |
| Expense — Interest on Debt | 12.3 | 13.0 | 13.5 | 14.3 | 14.9 |
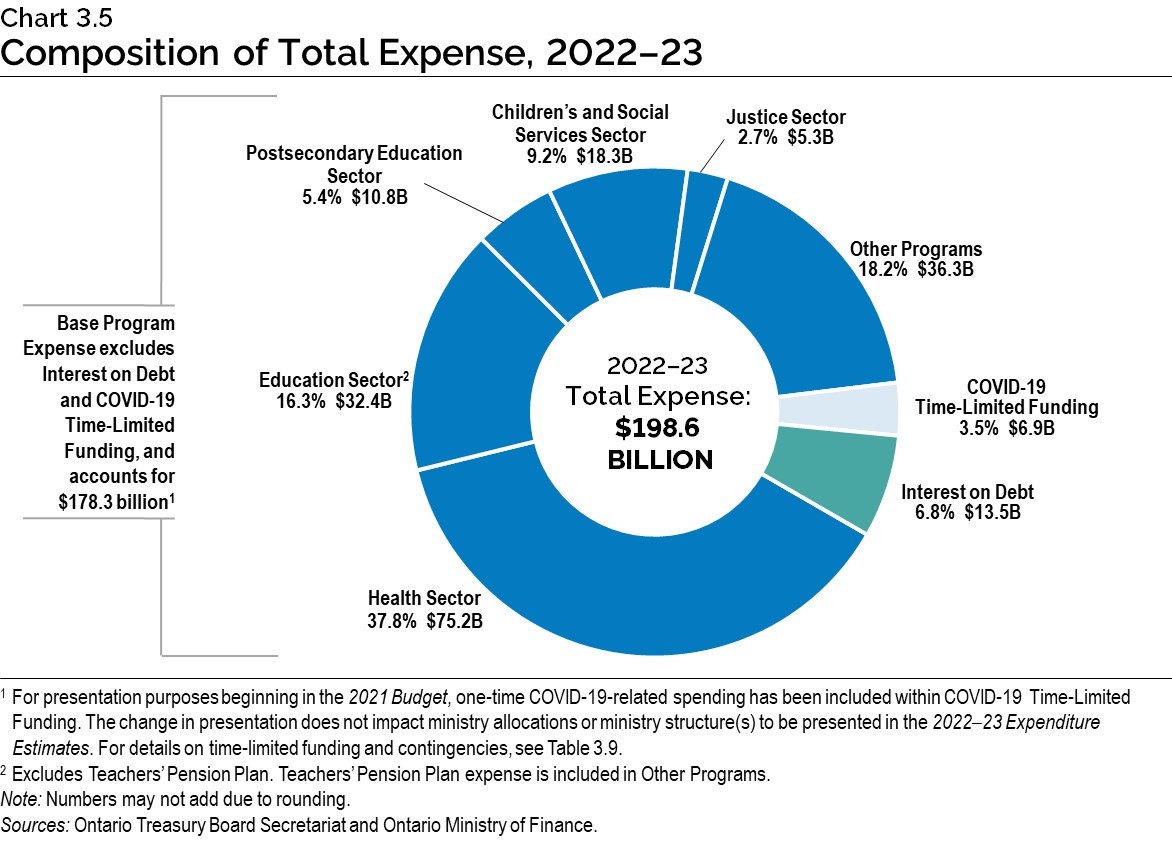
| Total Expense | 181.3 | 187.1 | 198.6 | 199.1 | 203.0 |
| Surplus/(Deficit) Before Reserve | (16.4) | (13.5) | (18.9) | (10.8) | (6.1) |
| Reserve | – | – | 1.0 | 1.5 | 1.5 |
| Surplus/(Deficit) | (16.4) | (13.5) | (19.9) | (12.3) | (7.6) |
| Net Debt as a Per Cent of GDP | 43.1% | 40.7% | 41.4% | 41.4% | 41.3% |
| Net Debt as a Per Cent of Revenue | 226.5% | 227.5% | 238.4% | 239.3% | 238.1% |
| Interest on Debt as a Per Cent of Revenue | 7.4% | 7.5% | 7.5% | 7.6% | 7.5% |
Table 3.1 footnotes:
[1] Interim represents the 2022 Budget projection for the 2021–22 fiscal year.
[2] For a breakout of COVID-19 Time-Limited Funding, see Table 3.9.
Note: Numbers may not add due to rounding.
Sources: Ontario Treasury Board Secretariat and Ontario Ministry of Finance.
2021–22 Interim Fiscal Performance
Ontario’s 2021–22 deficit is projected to be $13.5 billion — $19.6 billion lower than the outlook published in the 2021 Budget.
The 2022 Budget is projecting revenues in 2021–22 to be $173.6 billion — $19.6 billion higher than forecast in the 2021 Budget. This increase is largely driven by higher taxation revenue reflecting stronger-than-anticipated 2021 economic growth and net tax assessments for 2020 and prior years.
Program expense is projected to be $174.1 billion — $1.1 billion higher than the 2021 Budget forecast, primarily due to additional investments for health care, critical infrastructure, and supports for businesses and workers.
Ontario is forecast to pay $13.0 billion in interest costs in 2021–22 — $0.1 billion lower than the forecast in the 2021 Budget. At 40.7 per cent, the net debt-to-GDP ratio in 2021–22 is forecast to be 8.1 percentage points lower, primarily as a result of a lower-than-forecast deficit and higher nominal GDP.
The 2021 Budget also included a $1.0 billion reserve to protect the fiscal plan against unforeseen adverse changes in Ontario’s revenue and expense forecasts for the remainder of the fiscal year. The reserve was not required at fiscal year-end and has been drawn down at interim.
| 2021 Budget |
Interim1 2021–22 |
In-Year Change |
|
|---|---|---|---|
| Revenue | 154,012 | 173,572 | 19,560 |
| Expense — Programs | 172,989 | 174,076 | 1,087 |
| Expense — Interest on Debt | 13,130 | 12,992 | (138) |
| Total Expense | 186,120 | 187,068 | 948 |
| Surplus/(Deficit) Before Reserve | (32,108) | (13,496) | 18,612 |
| Reserve | 1,000 | – | (1,000) |
| Surplus/(Deficit) | (33,108) | (13,496) | 19,612 |
Table 3.2 footnotes:
[1] Interim represents the 2022 Budget projection for the 2021–22 fiscal year.
Note: Numbers may not add due to rounding.
Sources: Ontario Treasury Board Secretariat and Ontario Ministry of Finance.
Interim Revenue Update
The 2021–22 total revenue outlook is $173.6 billion — $19.6 billion higher than projected in the 2021 Budget. Since the release of the 2021–22 Third Quarter Finances, total revenue has decreased by $3.1 billion, primarily due to lower Other Non-Tax Revenue.
| Interim1 2021–22 |
|
|---|---|
| 2021 Budget Total Revenue | 154,012 |
| Revenue Changes in the 2021–22 First Quarter Finances | 2,885 |
| Revenue Changes in the 2021 Ontario Economic Outlook and Fiscal Review | 11,720 |
| Revenue Changes in the 2021–22 Third Quarter Finances | 8,042 |
| Revenue Changes Since the 2021–22 Third Quarter Finances — Land Transfer Tax | 212 |
| Revenue Changes Since the 2021–22 Third Quarter Finances — Gasoline and Fuel Taxes | (24) |
| Revenue Changes Since the 2021–22 Third Quarter Finances — Sales Tax | (33) |
| Revenue Changes Since the 2021–22 Third Quarter Finances — Corporations Tax | (110) |
| Revenue Changes Since the 2021–22 Third Quarter Finances — Personal Income Tax | (253) |
| Revenue Changes Since the 2021–22 Third Quarter Finances — All Other Taxes | (2) |
| Revenue Changes Since the 2021–22 Third Quarter Finances — Total Taxation Revenue | (209) |
| Revenue Changes Since the 2021–22 Third Quarter Finances — Government of Canada Transfers | 359 |
| Revenue Changes Since the 2021–22 Third Quarter Finances — Income from Government Business Enterprises | 49 |
| Revenue Changes Since the 2021–22 Third Quarter Finances — Other Non-Tax Revenue | (3,285) |
| Total Revenue Changes Since the 2021–22 Third Quarter Finances | (3,087) |
| Total Revenue Changes Since the 2021 Budget | 19,560 |
| 2022 Budget Total Revenue Outlook | 173,572 |
Table 3.3 footnotes:
[1] Interim represents the 2022 Budget projection for the 2021–22 fiscal year.
Note: Numbers may not add due to rounding.
Source: Ontario Ministry of Finance.
The forecast for Total Taxation Revenue has decreased by $209 million compared to the 2021–22 Third Quarter Finances. Key changes in the taxation revenue outlook include:
- Land Transfer Tax revenue outlook increased by $212 million due to stronger-than-expected housing market activity and collections in 2021–22;
- Gasoline and Fuel Taxes revenue outlooks decreased by $24 million combined due to lower-than-projected fuel consumption volumes;
- Sales Tax revenue projection decreased by $33 million due to slower-than-expected household consumption growth in 2021;
- Corporations Tax revenue outlook decreased by $110 million due to lower-than-projected growth in net operating surplus of corporations in 2022; and
- Personal Income Tax revenue projection decreased by $253 million mainly due to lower-than-expected compensation of employee growth in 2021.
Government of Canada Transfers are projected to increase by $359 million mainly due to one-time funding from the federal government to support long-term care homes as well as higher direct transfers to the broader public sector (BPS), partially offset by reprofiling of Early Learning and Child Care funding into 2022–23 and a reprofiling of funding under the Investing in Canada Infrastructure Program.
Projected net Income from Government Business Enterprises increased $49 million mainly reflecting stronger-than-expected performance from the Ontario Lottery and Gaming Corporation (OLG) and the Ontario Cannabis Store (OCS), partially offset by lower projected combined net income from Ontario Power Generation (OPG) and Hydro One Limited (HOL).
- Net income from OLG increased $112 million due to earlier-than-expected easing of COVID-19 capacity restrictions for land-based gaming.
- Net income from OCS increased $19 million, reflecting lower-than-expected operating expenses in 2021–22.
- Net income from OPG and HOL decreased $82 million combined, mainly reflecting downward revisions to forecast net income from OPG.
Other Non-Tax Revenues decreased by $3.3 billion largely reflecting the $1.8 billion impact of the elimination and rebate of eligible licence plate renewal fees paid since March 1, 2020, lower third‑party revenue recognized from broader public sector hospitals and school boards, and lower sales and rentals revenue recognized from consolidated government agencies impacted by the COVID-19 pandemic.
Interim Expense Update
Since the release of the 2021 Budget, the government has made significant investments throughout the fiscal year targeted at protecting people’s health and supporting workers. Most of these new investments were offset by existing time-limited contingencies, such as the Time-Limited COVID-19 Fund. Examples of investments include additional resources for hospitals and long-term care, business supports, municipal transit and infrastructure. The 2021–22 total expense outlook is $187.1 billion — $0.9 billion higher than the 2021 Budget.
Since the release of the 2021–22 Third Quarter Finances, the total program expense projection has decreased by $1.7 billion, primarily due to lower-than-projected spending in base programs, partially offset by an increase in COVID-19 Time-Limited Funding.
| Interim1 2021–22 |
|
|---|---|
| 2021 Budget Total Expense | 186,120 |
| Total Expense Changes in the 2021–22 First Quarter Finances | 2,208 |
| Total Expense Changes in the 2021 Ontario Economic Outlook and Fiscal Review | 787 |
| Total Expense Changes in the 2021–22 Third Quarter Finances | (351) |
| Program Expense Changes Since the 2021–22 Third Quarter Finances — Base Programs2 — Health Sector | 1,064 |
| Program Expense Changes Since the 2021–22 Third Quarter Finances — Base Programs3 — Education Sector4 | (1,314) |
| Program Expense Changes Since the 2021–22 Third Quarter Finances — Base Programs5 — Postsecondary Education Sector | (685) |
| Program Expense Changes Since the 2021–22 Third Quarter Finances — Base Programs6 — Children’s and Social Services Sector | (632) |
| Program Expense Changes Since the 2021–22 Third Quarter Finances — Base Programs7 — Justice Sector | (71) |
| Program Expense Changes Since the 2021–22 Third Quarter Finances — Base Programs8 — Other Programs | (936) |
| Program Expense Changes Since the 2021–22 Third Quarter Finances — Total Base Programs Expense Changes Since the 2021–22 Third Quarter Finances | (2,574) |
| Program Expense Changes Since the 2021–22 Third Quarter Finances — COVID-19 Time-Limited Funding | 1,357 |
| Program Expense Changes Since the 2021–22 Third Quarter Finances — Drawdown of the Time-Limited COVID-19 Fund | (500) |
| Total Program Expense Changes Since the 2021–22 Third Quarter Finances | (1,717) |
| Interest on Debt Change Since the 2021–22 Third Quarter Finances | 21 |
| Total Expense Changes Since the 2021–22 Third Quarter Finances | (1,696) |
| Total Expense Changes Since the 2021 Budget | 948 |
| 2022 Budget Total Expense Outlook | 187,068 |
Table 3.4 footnotes:
[1] Interim represents the 2022 Budget projection for the 2021–22 fiscal year.
[2], [3], [5], [6], [7], [8] For presentation purposes in the 2022 Budget, one-time COVID-19-related spending has been included within COVID-19 Time-Limited Funding. This funding continues to be presented separately in order to transparently capture the temporary nature of these investments.
[4] Excludes Teachers’ Pension Plan. Teachers’ Pension Plan expense is included in Other Programs.
Note: Numbers may not add due to rounding.
Sources: Ontario Treasury Board Secretariat and Ontario Ministry of Finance.
The following expense changes are projected since the release of the 2021–22 Third Quarter Finances:
- Health sector expense is projected to be $1.1 billion higher primarily due to investments to support wage enhancement for personal support workers, and the expansion of the Community Paramedicine for Long-Term Care program to support 22 additional communities to alleviate pressures from bed waitlists in the long-term care sector.
- Education sector expense is projected to be lower primarily because school boards experienced a decline in non-government revenue, from sources such as fundraising, community use of schools and international student tuition, and lower-than-projected enrolment. This results in a projected $1.3 billion decrease.
- Postsecondary Education sector expense is projected to be $685 million lower, mainly due to lower college expenses, lower-than-expected student uptake for financial assistance and the ongoing impact of federal government program changes.
- Children’s and Social Services sector expense is projected to be lower primarily due to the temporary federal support programs that resulted in lower-than-expected demand for social assistance and the Ontario Child Benefit, resulting in a projected $632 million decrease.
- Justice sector expense is projected to be $71 million lower primarily due to project delays in the Public Safety Radio Network Project as a result of COVID-19 and supply chain issues.
- Other Programs expense is projected to be $936 million lower due to the following key changes:
- $149 million decrease in the Ministry of Transportation due to the impacts of Metrolinx ridership and lower-than-forecast transfers to municipalities due to construction delays;
- $79 million in underspending for planned infrastructure programs, such as the Investing in Canada Infrastructure Program, due to revised implementation timelines; and
- Reducing the standard Contingency Fund balance to $75 million, due to lower than previously anticipated spending across various sectors and higher savings reported by ministries due to effective in-year management of costs.
- COVID-19 Time-Limited Funding expense is projected to be $1,357 million higher, with $500 million offset through the Time-Limited COVID-19 Fund, due to additional investments to support:
- Hospitals with COVID-19 response including additional critical care capacity and health human resources;
- COVID-19 vaccine program, testing and additional capacity in public health;
- Prevention and containment of COVID-19 in long-term care homes;
- The first instalment of one-time payments of up to $5,000 for eligible nurses to support retention of nurses in Ontario; and
- Justice sector COVID-19 expenses primarily due to pressures for the Vaccine Distribution Secretariat, managing the pandemic in correctional institutions and the courts, and to support Legal Aid Ontario.
- Interest on debt expense is projected to be $21 million higher due to higher-than-forecast borrowing costs.
Prudence in 2021–22
As reported in the 2021 Budget, the government fully allocated the extraordinary contingencies previously made available in 2021–22 to protect the health of the people of Ontario and support families, employers and jobs during the COVID-19 pandemic.
In order to maintain continued flexibility, as the 2021–22 fiscal year unfolded, the government allocated $2.2 billion to the Time-Limited COVID-19 Fund in 2021–22 as part of the 2021–22 First Quarter Finances, with an additional $500 million increase to this Fund announced in the 2021 Ontario Economic Outlook and Fiscal Review: Build Ontario. After all projected drawdowns reported in the 2021–22 Third Quarter Finances and the 2022 Budget, the Time-Limited COVID-19 Fund for 2021–22 has been fully allocated.
The standard Contingency Fund is also maintained to help mitigate expense risks — for example, in cases where health and safety may be compromised — that may otherwise adversely affect Ontario’s fiscal performance. For 2021–22, the standard Contingency Fund has a current remaining balance of $75 million.
The Fiscal Sustainability, Transparency and Accountability Act, 2019 requires Ontario’s fiscal plan to incorporate prudence in the form of a reserve to protect the fiscal outlook against unforeseen adverse changes in the province’s revenue and expense, including those resulting from changes in Ontario’s economic performance. The 2021 Budget included a reserve of $1.0 billion in 2021–22, which was not required at fiscal year-end and has been drawn down at interim.
Medium-Term Fiscal Plan
The government is projecting deficits of $19.9 billion in 2022–23, $12.3 billion in 2023–24, and $7.6 billion in 2024–25, a significant improvement from the 2021 Budget deficit outlook.
Medium-Term Revenue Outlook
Total revenue is projected to increase from $173.6 billion in 2021–22 to $196.9 billion in 2024–25, for an average annual growth rate of 4.3 per cent. Revenue growth reflects the Ontario Ministry of Finance’s outlook for economic growth.
| Actual 2020–21 |
Interim1 2021–22 |
Medium-Term Outlook 2022–23 |
Medium-Term Outlook 2023–24 |
Medium-Term Outlook 2024–25 |
|
|---|---|---|---|---|---|
| Revenue — Personal Income Tax | 40.3 | 42.3 | 44.6 | 47.0 | 49.6 |
| Revenue — Sales Tax | 26.6 | 30.4 | 32.3 | 34.2 | 35.7 |
| Revenue — Corporations Tax | 17.8 | 22.2 | 19.7 | 20.4 | 21.1 |
| Revenue — Ontario Health Premium | 4.3 | 4.5 | 4.7 | 4.9 | 5.1 |
| Revenue — Education Property Tax | 6.0 | 5.7 | 5.7 | 5.6 | 5.6 |
| Revenue — All Other Taxes | 15.8 | 19.1 | 19.4 | 21.0 | 21.9 |
| Total Taxation Revenue | 110.9 | 124.2 | 126.4 | 133.2 | 139.1 |
| Government of Canada | 33.9 | 29.7 | 31.0 | 31.8 | 33.4 |
| Income from Government Business Enterprises | 5.0 | 5.6 | 6.3 | 6.7 | 7.5 |
| Other Non-Tax Revenue | 15.1 | 14.1 | 16.1 | 16.5 | 16.9 |
| Total Revenue | 164.9 | 173.6 | 179.8 | 188.2 | 196.9 |
Table 3.5 footnotes:
[1] Interim represents the 2022 Budget projection for the 2021–22 fiscal year.
Note: Numbers may not add due to rounding.
Source: Ontario Ministry of Finance.
The primary driver of the forecast for Personal Income Tax (PIT) revenues is the outlook for growth in compensation of employees. The PIT revenue projection reflects the impact of proposed tax measures such as the enhancement to the Low-income Individuals and Families Tax Credit. For more information, please see Annex: Details of Tax Measures and Other Legislative Initiatives. Also included in the PIT projection are prior‐year and unique factors such as the impact of Canada Recovery Benefits payments that have been deemed taxable by the federal government. Personal Income Tax revenue is projected to grow at an average annual rate of 5.4 per cent between 2021–22 and 2024–25.
The forecast for Sales Tax (ST) revenue is driven by the projection for household consumption spending. Average growth in ST revenue is 5.6 per cent between 2021–22 and 2024–25.
The forecast for Corporations Tax (CT) revenue is driven by the projection for net operating surplus of corporations. Corporations Tax revenue for 2021–22 includes a one-time amount of $3.0 billion for 2020 tax returns and prior years processed after the finalization of 2020–21 results. Excluding this amount, CT revenue is projected to grow at an average annual rate of 3.2 per cent between 2021–22 and 2024–25.
The primary driver of the forecast for Ontario Health Premium revenue is the outlook for growth in compensation of employees. Ontario Health Premium revenue is projected to grow at an average annual rate of 4.4 per cent between 2021–22 and 2024–25.
Education Property Tax revenue is based primarily on the outlook for growth in the property assessment base resulting from new construction activities. Revenues are projected to remain relatively stable over the term of the outlook, with assessment growth offset by the impact of previously announced measures, including the reduction in Business Education Tax (BET) rates.
Revenues from All Other Taxes are projected to increase at an average annual rate of 4.7 per cent between 2021–22 and 2024–25. This includes revenues from the Employer Health Tax; Land Transfer Tax; Beer, Wine and Spirits Taxes; and volume-based taxes such as the Gasoline Tax, Fuel Tax and Tobacco Tax. The projection for All Other Taxes also reflects the impact of tax measures, such as the proposed temporary reduction to the Gasoline Tax by 5.7 cents per litre and Fuel Tax by 5.3 cents per litre. See Annex: Details of Tax Measures and Other Legislative Initiatives for more information.
The forecast for Government of Canada transfers is largely based on existing federal–provincial funding agreements and formulas. Federal transfers are projected to increase at an average annual rate of 4.0 per cent from 2021–22 to 2024–25, which reflect $2.8 billion in one-time funding related to COVID-19 in 2021–22. One-time funding declines to $1.1 billion in 2022–23. The forecast for Government of Canada transfers includes new funding of:
- Approximately $6.6 billion in federal revenue between 2022–23 and 2024–25 to implement the Canada-wide Early Learning and Child Care Agreement;
- $775.5 million in 2022–23 in additional one-time federal funding through Bill C-17 and amendments to the Federal-Provincial Fiscal Arrangements Act to support COVID-19 recovery; and
- $316.2 million in 2022–23 through Bill C-17 for the federal portion of support for municipal transit cost pressures due to reduced ridership as a result of COVID-19 and support for municipal shelters through the Social Services Relief Fund.
The outlook for Income from Government Business Enterprises (GBEs) is based on Ontario Ministry of Finance estimates of net income for Hydro One Ltd. (Hydro One) and projections provided by Ontario Power Generation (OPG), the Ontario Cannabis Store (OCS), the Liquor Control Board of Ontario (LCBO), and the Ontario Lottery and Gaming Corporation (OLG). Net incomes of GBEs are projected to increase at an average annual rate of 10.0 per cent from 2021–22 to 2024–25. The strong growth mainly reflects the anticipated recovery of OLG’s net income that has been impacted by the closure of casinos to protect public health in response to the COVID-19 pandemic and expected increases in lottery and OLG’s digital revenue.
The forecast for Other Non-Tax Revenue is based on projections provided by government ministries and agencies. The outlook for Other Non-Tax Revenue is projected to increase at an average annual rate of 6.3 per cent from 2021–22 to 2024–25 largely due to the expected increase in third-party revenues from hospitals, school boards and colleges that are recognized in Ontario’s financial statements. It also reflects lower revenues from Vehicle and Driver Registration Fees of $1.8 billion in 2021–22 due the elimination and rebate of eligible licence plate renewal fees paid since March 1, 2020, and an average impact of $1.1 billion in 2022–23 and beyond due to the elimination of licence plate renewal fees.
Risks to the Revenue Outlook
There are a variety of risks to the economic planning assumptions underlying the revenue forecast, as outlined in Chapter 2: Economic Performance and Outlook. Table 3.6 highlights some of the key risks and sensitivities to the 2022–23 revenue forecast that could arise from unexpected changes in economic conditions. These are only estimates; actual results can vary. The risks identified are based on factors that are considered to have the most material impact on the largest revenue sources.
| Economic Factors | Revenue Sources | 2022–23 Sensitivities |
|---|---|---|
| Nominal GDP | Total Taxation Revenue | $850 million revenue change for each percentage point change in nominal GDP growth. This can vary significantly, depending on the composition and source of changes in GDP growth. |
| Compensation of Employees | Personal Income Tax, Ontario Health Premium and Employer Health Tax | $627 million revenue change for each percentage point change in growth in compensation of employees. |
| Household Consumption Expenditures | Sales Tax | $234 million revenue change for each percentage point change in growth of household consumption expenditures. |
| Net Operating Surplus of Corporations | Corporations Tax | $102 million revenue change for each percentage point change in growth in net operating surplus of corporations. |
| Housing Resales and Resale Prices | Land Transfer Tax | $57 million revenue change for each percentage point change in growth of either housing resales or resale prices. |
| Ontario Population Share | Canada Health Transfer | $45 million revenue change for each one-tenth of a percentage point change in Ontario’s population share. |
| Ontario Population Share | Canada Social Transfer | $16 million revenue change for each one-tenth of a percentage point change in Ontario’s population share. |
Table 3.6 footnotes:
Source: Ontario Ministry of Finance.
Revenue Outlook Scenarios
To illustrate the potential impacts of elevated economic uncertainty, the Ontario Ministry of Finance has developed two plausible alternative scenarios that the economy could take over the next several years. See Chapter 2: Economic Performance and Outlook for more details. Based on the two alternative nominal GDP economic scenarios, two taxation revenue scenarios were developed. The Faster Growth and Slower Growth scenarios each represent a potential path intended to illustrate a broader range of possible outcomes but should not be considered as the best case or the worst case.
| 2022–23p | 2023–24p | 2024–25p | |
|---|---|---|---|
| Faster Growth Scenario | 131.2 | 140.3 | 148.5 |
| Planning Projection | 126.4 | 133.2 | 139.1 |
| Slower Growth Scenario | 123.1 | 127.9 | 132.2 |
Table 3.7 footnotes:
p = Ontario Ministry of Finance Planning Projection and alternative scenarios.
Note: Numbers may not add due to rounding.
Source: Ontario Ministry of Finance.
In the Faster Growth scenario, total taxation revenue over the medium term is $9.4 billion higher in 2024–25 than the Planning Projection, while in the Slower Growth scenario, total taxation revenue is $7.0 billion lower.
In the event that the alternative economic scenarios materialize as opposed to the Planning Projection, Ontario’s fiscal plan would also change as a result.
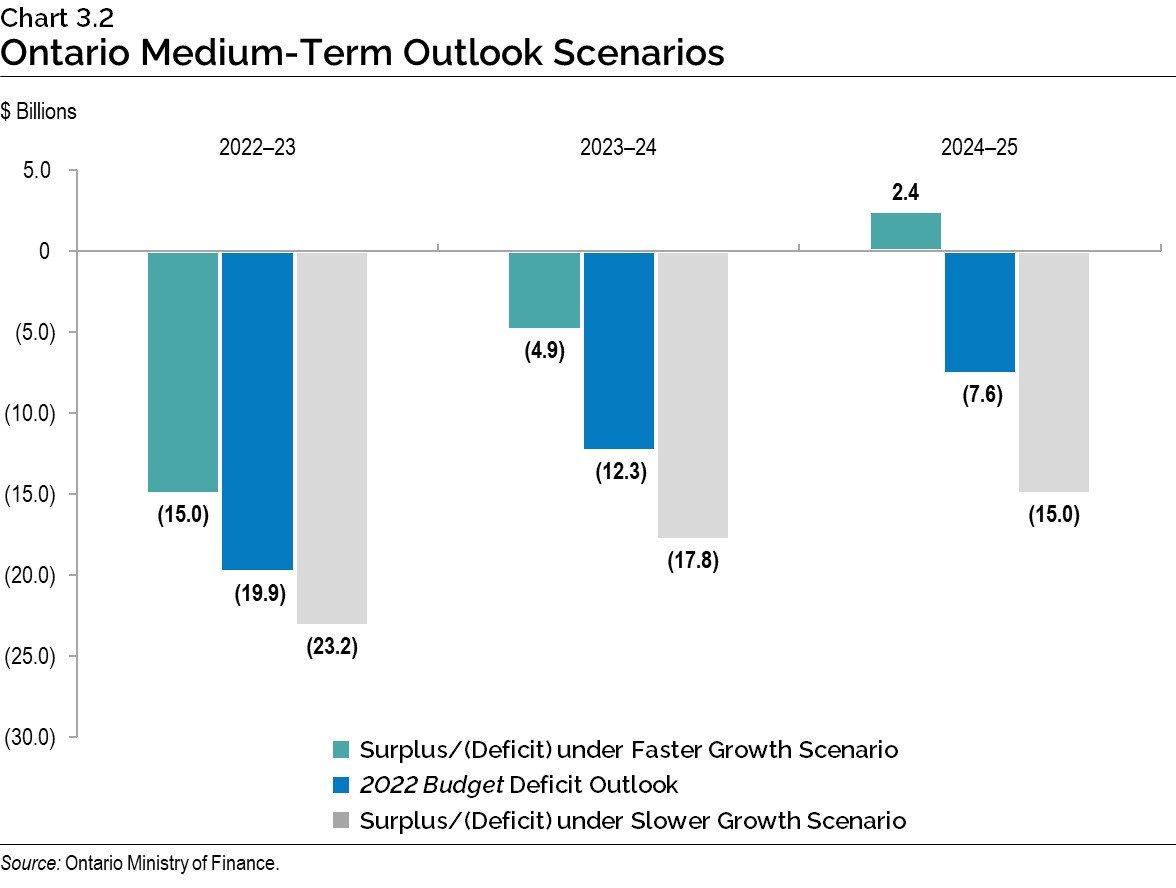
Under the Faster Growth scenario, the deficit outlook may improve to $15.0 billion in 2022–23 and $4.9 billion in 2023–24, and a surplus of $2.4 billion in 2024–25. However, if the Slower Growth scenario takes place instead, the deficit outlook may deteriorate to $23.2 billion in 2022–23, $17.8 billion in 2023–24, and $15.0 billion in 2024–25.
Note that in these alternative outlook scenarios, expenditures are assumed to be unchanged compared to the medium-term expense outlook and only revenue and interest on debt are adjusted.
Medium-Term Expense Outlook
The total expense outlook is projected to grow from $187.1 billion in 2021–22 to $203.0 billion in 2024–25.
Program expense is projected to grow from $174.1 billion in 2021–22 to $188.1 billion in 2024–25, while base program expense increases by $26.1 billion over the same period. This reflects the government’s commitment to invest in priority areas such as health, education and critical infrastructure.
| Actual 2020–21 |
Interim1 2021–22 |
Medium-Term Outlook 2022–23 |
Medium-Term Outlook 2023–24 |
Medium-Term Outlook 2024–25 |
|
|---|---|---|---|---|---|
| Base Programs2 — Health Sector | 64.4 | 71.0 | 75.2 | 77.6 | 78.3 |
| Base Programs3 — Education Sector4 | 28.4 | 29.5 | 32.4 | 34.2 | 35.1 |
| Base Programs5 — Postsecondary Education Sector | 9.5 | 10.0 | 10.8 | 11.1 | 11.4 |
| Base Programs6 — Children’s and Social Services Sector | 17.0 | 17.2 | 18.3 | 18.4 | 18.6 |
| Base Programs7 — Justice Sector | 4.6 | 4.8 | 5.3 | 5.2 | 5.1 |
| Base Programs8 — Other Programs | 26.0 | 29.6 | 36.3 | 38.3 | 39.7 |
| Total Base Programs | 150.0 | 162.1 | 178.3 | 184.8 | 188.1 |
| COVID-19 Time-Limited Funding | 19.1 | 12.0 | 6.9 | – | – |
| Total Programs | 169.0 | 174.1 | 185.2 | 184.8 | 188.1 |
| Interest on Debt | 12.3 | 13.0 | 13.5 | 14.3 | 14.9 |
| Total Expense | 181.3 | 187.1 | 198.6 | 199.1 | 203.0 |
Table 3.8 footnotes:
[1] Interim represents the 2022 Budget projection for the 2021–22 fiscal year.
[2], [3], [5], [6], [7], [8] For presentation purposes beginning in the 2021 Budget, one-time COVID-19-related spending has been included within COVID-19 Time-Limited Funding. The change in presentation does not impact ministry allocations or ministry structure(s) to be presented in the 2022–23 Expenditure Estimates. For details on time-limited funding and contingencies, see Table 3.9.
[4] Excludes Teachers’ Pension Plan, which is included in Other Programs.
Note: Numbers may not add due to rounding.
Sources: Ontario Treasury Board Secretariat and Ontario Ministry of Finance.
With the health and safety of the people of Ontario as the top priority, the government has made available COVID-19 Time-Limited Funding to protect Ontario’s progress against COVID-19. This funding is presented separately to transparently capture the predominantly temporary nature of these investments.
In addition to these temporary COVID-19-related initiatives, the government continues to invest in programs that serve the people of Ontario. Over the medium-term outlook, base program expense is projected to increase every year, growing at an average annual rate of 5.1 per cent from 2021–22 to 2024–25.
Highlights of the changes to the program expense outlook over the medium term include the following:
- Base Health sector expense is projected to increase from $71.0 billion in 2021–22 to $78.3 billion in 2024–25 — representing 3.3 per cent average annual growth over the period. The growth is primarily due to investments to:
- Address growing demand in the hospital sector, including the continuation of over 3,000 acute and post-acute beds as well as hundreds of new adult, pediatric and neonatal critical care beds. This also includes increasing base funding for hospitals to respond to Ontario’s growing and aging population;
- Provide a permanent wage enhancement to personal support workers who deliver publicly funded support services in home and community care, long-term care and public hospitals;
- Address increased utilization within the Ontario Drug Benefit program and the New Drug Funding Program;
- Expand services in the home and community care sector;
- Strengthen quality of care and increase funding to meet the nutritional needs of long-term care residents; and
- Support mental health and addictions services.
- Base Education sector expense is projected to increase from $29.5 billion in 2021–22 to
$35.1 billion in 2024–25 — representing 5.9 per cent average annual growth over the period. Key investments include:- $6.8 billion over three years to support the implementation of the Canada-wide Ontario Early Learning and Child Care Agreement to reduce average out-of-pocket child care fees and enhance access to child care; and
- Providing significant additional funding to school boards to support student learning and forecasted enrolment increases.
- Base Postsecondary Education sector expense is projected to increase from $10.0 billion in
2021–22 to $11.4 billion in 2024–25 — representing 4.7 per cent average annual growth over the period. Key investments include:- $142 million over three years to provide additional supports to postsecondary institutions delivering clinical education for nursing-related programs and to expand the number of medical school graduates;
- $61 million over three years for the Ontario Learn and Stay Grant to provide financial supports to postsecondary students who enrol in priority programs such as Health Human Resources and continue to work in underserved communities in the region where they studied after graduation; and
- $55 million over three years to invest more in research and innovation to support productivity, economic growth, and address current and future pandemic preparedness, including additional funding to support Phase 1 of the Biosciences Research Infrastructure Fund.
- Base Children’s and Social Services sector expense is projected to increase from $17.2 billion in 2021–22 to $18.6 billion in 2024–25 — representing 2.6 per cent average annual growth over the period. This is mainly due to:
- Temporary federal support programs that led to lower-than-expected demand for social assistance and the Ontario Child Benefit. This resulted in one-time lower spending in 2021–22 for these programs; and
- New investments to provide a permanent wage enhancement for eligible personal support workers and direct support workers in the social services sector.
- Base Justice sector expense is projected to increase from $4.8 billion in 2021–22 to $5.1 billion in 2024–25 — representing 2.1 per cent average annual growth over the period. This includes investments to support improved emergency services, new technologies and additional staffing for the Ontario Provincial Police, and funding to reduce the criminal case backlog in the courts.
- Base Other Programs expense is projected to increase from $29.6 billion in 2021–22 to $39.7 billion in 2024–25 — representing 10.3 per cent average annual growth over the period. The changes over this period primarily reflect a significant annual increase in the level of contingencies over the course of the outlook to reflect a cautious approach to planning as uncertainty increases over time. Other key changes include:
- $2.8 billion over three years, beginning in 2022–23, as part of the government’s multi-year commitment to provide every community in Ontario with access to reliable high-speed internet by the end of 2025; and
- Ongoing significant investments in transit and transportation infrastructure, which increase Ministry of Transportation expense by nearly $700 million, including projects that are planned to be completed and enter into service over the coming years.
- COVID-19 Time-Limited Funding is projected to be $6.9 billion in 2022–23, with $2.8 billion funded through the Time-Limited COVID-19 Fund, and includes key additional investments, such as:
- $2.0 billion to support hospital beds including critical care, additional staff and personal protective equipment;
- $1.1 billion for COVID-19 testing;
- $597 million to help students recover from the disruptions of COVID-19 through supports for learning recovery, such as tutoring and additional staff;
- $505 million to support municipal transit systems as they recover from the COVID-19 pandemic;
- $382 million to support the second instalment of one-time payments of up to $5,000 for eligible nurses to support the retention of nurses in Ontario;
- $244 million to support the prevention and containment of COVID-19 in long-term care homes. In addition, $34 million will support long-term care homes with maintaining supplies of personal protective equipment;
- An additional $210 million for the COVID-19 vaccination program;
- $205 million to extend the Ontario Jobs Training Tax Credit in 2022;
- $200 million for the Ontario Staycation Tax Credit;
- $171 million to support the public health sector including funding to enhance COVID-19 monitoring and case and contact management, the continuation of the Infection Prevention and Control Hubs, the extension of school-focused nurses and continued support of the High Priority Communities Strategy;
- $128 million to support municipal service managers and Indigenous program partners to deliver critical services through the Social Services Relief Fund;
- $52 million to support Legal Aid Ontario as a result of lower revenues received from the Law Foundation of Ontario;
- $28 million in support of the Agri-Food sector to prepare for potential urgent needs, strengthen the food supply chain and support the agri-food sector; and
- $22 million to provide personal protective equipment and infection prevention and control measures in congregate care and community settings.
- The total expense outlook includes interest on debt expense, which is projected to increase from $13.0 billion in 2021–22 to $14.9 billion in 2024–25.
Prudence Built into the Medium-Term Outlook
In keeping with sound fiscal planning practices, Ontario’s revenue outlook is based on prudent economic planning projections, as discussed in Chapter 2: Economic Performance and Outlook. Three external economic experts reviewed the Ontario Ministry of Finance’s economic assumptions and found them to be reasonable.1
Ontario incorporates prudence in the form of a reserve to protect the fiscal outlook against unforeseen adverse changes in the province’s revenue and expense, including those resulting from changes in Ontario’s economic performance. The reserve has been set at $1.0 billion in 2022–23, $1.5 billion in 2023–24, and $1.5 billion in 2024–25. In addition, the standard Contingency Fund is maintained to help mitigate expense risks — for example, in cases where health and safety may be compromised, and which may otherwise adversely affect Ontario’s fiscal performance. The standard Contingency Fund in 2022–23 is set at $4.6 billion and increases further through the remainder of the medium-term outlook, reflecting the government’s cautious, prudent and responsible fiscal planning.
To maintain the flexibility necessary given the ongoing uncertainty related to the pandemic and the future pace of economic recovery, the government has made available time-limited funding and extraordinary contingencies through the Time-Limited COVID-19 Fund. Funding previously tracked in the 2021 Budget under the Pandemic Fund and the Support for People and Jobs Fund in 2022–23 has been reallocated towards the Time-Limited COVID-19 Fund, which will help deploy resources where they are needed most. As shown in Table 3.9, for the 2022–23 fiscal year, the Time-Limited COVID-19 Fund has been fully allocated as of the 2022 Budget.
| Interim1 2021–22 |
Medium-Term Outlook 2022–23 |
Medium-Term Outlook 2023–24 |
Medium-Term Outlook 2024–25 |
|
|---|---|---|---|---|
| COVID-19 Time-Limited Funding and Extraordinary Contingencies — Pandemic Fund2 | 4,000 | – | – | – |
| COVID-19 Time-Limited Funding and Extraordinary Contingencies — Support for People and Jobs Fund3 | 1,000 | – | – | – |
| COVID-19 Time-Limited Funding and Extraordinary Contingencies — Time-Limited COVID-19 Fund | 2,700 | 2,800 | – | – |
| COVID-19 Time-Limited Funding and Extraordinary Contingencies — Other COVID-19 Time-Limited Funding | 4,311 | 4,107 | – | – |
| Total COVID-19 Time-Limited Funding and Extraordinary Contingencies | 12,011 | 6,907 | – | – |
| Remaining Balances as of the 2022 Budget — Time-Limited COVID-19 Fund | – | – | – | – |
| Total Remaining Balances as of the 2022 Budget | – | – | – | – |
Table 3.9 footnotes:
[1] Interim represents the 2022 Budget projection for the 2021–22 fiscal year.
[2], [3] The Pandemic Fund and the Support for People and Jobs Fund were fully allocated for 2021–22 as presented in the 2021 Budget. Funding previously tracked under the Pandemic Fund and Support for People and Jobs Fund in 2022–23 has been reallocated towards the Time‑Limited COVID-19 Fund.
Note: Numbers may not add due to rounding.
Sources: Ontario Treasury Board Secretariat and Ontario Ministry of Finance.
Risks to the Expense Outlook
Table 3.10 provides a summary of key expense risks and sensitivities that could result from unexpected changes in economic conditions and program demands. A change in these factors could affect total expense and the public sector, causing variances in the overall fiscal forecast. These sensitivities illustrate possible effects on the government’s key programs and can vary, depending on the nature and composition of potential risks.
| Program/Sector | 2022–23 Assumption | 2022–23 Sensitivities |
|---|---|---|
| Health Sector (base)1 | Annual growth of 5.8 per cent | One per cent change in health spending: $751.7 million |
| Hospital Costs (base)2 | Annual growth of 4.0 per cent | One per cent change in hospital costs: $217 million |
| COVID-19 Testing | Cost per additional 10,000 diagnostic tests/day (lab processing) | Additional 10,000 COVID-19 diagnostic tests: $0.47 million/day3 |
| Drug Programs (base) | Annual growth of 6.1 per cent4 | One per cent change in program expenditure of drug programs: $57.7 million |
| Ontario Health Insurance Plan (OHIP) (base) | Annual growth of 2.3 per cent | One per cent change in OHIP expense: $172.9 million |
| Long-Term Care Homes | 79,159 long-term care home beds. Average provincial annual operating cost per bed in a long-term care home: $85,283 |
One per cent change in number of beds: approximately $67.5 million5 |
| Home Care6 | Approximately 36.4 million hours of personal support services | One per cent change in hours of personal support services: approximately $17 million |
| Home Care7 | Approximately 9.5 million nursing and therapy visits and 1.5 million nursing shifts | One per cent change in all nursing and therapy visits: approximately $11 million |
| Elementary and Secondary Schools | Approximately 2 million average daily pupil enrolment | One per cent enrolment change: approximately $170 million |
| Ontario Works | 243,934 average annual caseload | One per cent caseload change: approximately $28 million |
| Ontario Disability Support Program | 402,984 average annual caseload | One per cent caseload change: approximately $59 million |
| Interest on Debt | Average cost of borrowing in 2022–23 is forecast to be 3.4 per cent | In the first full year, the impact of a 100 basis-point change in borrowing rates is forecast to be over $700 million |
Table 3.10 footnotes:
[1] Health sector expense includes funding from the Ontario Ministry of Health and the Ontario Ministry of Long-Term Care.
[2] Hospital costs are based on hospital operating transfer payments and exclude one-time funding for COVID-19 and consolidations.
[3] Estimated cost per day is based on an average of $46.50 per test for tests conducted by the diagnostic lab network (lab processing only). Tests processed outside of the network are more expensive on a per-test basis.
[4] Estimate based on 2021–22 allocation of $5,442.4 million relative to 2022–23 proposed allocation of $5,774.3 million.
[5] Based on the Long-Term Care 2022–23 Plan of $6,750.9 million (excludes one-time COVID-19 funding and consolidation adjustments).
[6], [7] Home Care statistics are based on a combination of 2020–21 and 2021–22 data and estimates.
Sources: Ontario Treasury Board Secretariat and Ontario Ministry of Finance.
Transparency and Risks
The government is committed to being open and transparent about the state of Ontario’s finances. This principle is reflected in the Fiscal Sustainability, Transparency and Accountability Act, 2019, which stipulates that Ontario’s fiscal policy should be clearly articulated and information about it should be readily available to the public without charge.
To ensure a reasonable and prudent economic forecast, the government’s key economic planning projections are set below the average of private-sector forecasts in each year. For 2022, the planning assumptions are set relatively further below the private-sector average to reflect the elevated degree of uncertainty for this year.
While the planning assumptions for economic growth are reasonable and prudent, the Ontario Ministry of Finance has also developed Faster Growth and Slower Growth scenarios to provide greater transparency around the province’s economic outlook amid heightened economic uncertainty.
As a matter of transparent fiscal management, financial pressures are monitored throughout the fiscal year by the Ontario Treasury Board Secretariat, with the goal of ensuring that robust and prudent methodologies are used to develop forecasts. Other important risk management tools include closely tracking the pace of implementation of initiatives and proactively identifying emerging program and policy risks. Comprehensive analysis of known pressures informs the fiscal planning processes, including the development of plans to mitigate and manage fiscal pressures, as well as maintaining adequate contingencies as part of the medium-term fiscal projections.
In addition to the key demand sensitivities and economic risks to the fiscal plan, there are risks stemming from the government’s contingent liabilities. Whether future events will result in actual liabilities for the province is beyond the direct control of the government. For example, losses could result from legal settlements, defaults on projects or a call on loan or funding guarantees. Provisions for losses that are likely to occur and can be reasonably estimated are expensed and reported as liabilities in Ontario’s financial statements. Any significant contingent liabilities related to the 2021–22 fiscal year will be disclosed as part of the Annual Report and Consolidated Financial Statements 2021–2022, to be released later this year.
Summary of Significant Accounting Policies
This section provides a summary of the basis of accounting, reporting entity and the significant accounting policies used in preparing the multi-year fiscal plan discussed in the 2022 Budget. Please refer to the Public Accounts of Ontario Annual Report and Consolidated Financial Statements 2020–2021 for further details.
Basis of Accounting
This Budget is prepared on the same accounting basis as the Consolidated Financial Statements 2020–2021, with adjustments to include the estimated impact from new accounting standards effective in 2022–23, where appropriate.
Reporting Entity
The estimated revenues and expenses reflect the expected activities of the Consolidated Revenue Fund combined with those organizations which Public Sector Accounting Board (PSAB) standards define as controlled by the Ontario government and which include public hospitals, school boards and colleges.
Government organizations controlled by Ontario are consolidated if they meet one of the following criteria: their revenues, expenses, assets or liabilities are greater than $50 million; or their outside sources of revenue, deficit or surplus are greater than $10 million.
Principles of Consolidation
Government organizations, including hospitals, school boards and colleges (collectively known as BPS organizations), as well as other government organizations controlled by the Ontario government, are consolidated on a line-by-line basis with the assets, liabilities, revenues and expenses based on the percentage of ownership the government held during the fiscal year. Where appropriate, adjustments are made to present the accounts of these organizations on a basis consistent with the accounting policies of the government and to eliminate inter-organizational accounts and transactions.
Government Business Enterprises (GBEs) are recognized on a modified equity method, based on their results prepared in accordance with International Financial Reporting Standards, and taking into consideration the percentage of ownership owned by the government during the year. Net income of the GBEs is shown as a separate item, Income from Government Business Enterprises.
Revenue
Tax revenues are recognized in the period in which the taxable event occurs and when authorized by legislation, estimated on taxpayer assessments, taxable income or other factors as appropriate.
Transfers from the Government of Canada are recognized as revenue in the period during which the transfer is authorized by the federal government and all eligibility criteria are met, except if the stipulations related to federal government funding create an obligation that meets the definition of a liability, in which case the revenue is recognized as the stipulations are met.
Other revenue is recognized in the fiscal year that the events giving rise to the revenue occurred and the revenue is earned.
Expense
Expenses are recognized in the fiscal year in which the events giving rise to the expenses occur and resources are consumed.
Transfer payments are recognized in the year in which the transfer is authorized, and all eligibility criteria have been met by the recipient. Any transfers paid in advance are deemed to have met all eligibility criteria.
Interest on debt includes: (i) interest on outstanding debt net of interest income on investments and loans; (ii) amortization of debt discounts, premiums and commissions; and (iii) debt servicing costs and other costs.
Employee future benefits, such as pensions, other retirement benefits and entitlements upon termination, are recognized as expenses over the years in which the benefits are earned by employees. A valuation allowance is recorded to write down Ontario’s share of net pension assets when the government assesses it is not entitled to fully benefit from the net pension asset.
The cost of tangible capital assets including buildings, transportation infrastructure, machinery, equipment, and information technology infrastructure owned by Ontario and its consolidated organizations are capitalized and amortized over their estimated useful service lives on a straight-line basis.
New Accounting Standards
The Public Sector Accounting Board (PSAB) has issued several changes to its standards for government financial reporting, including accounting for liabilities for asset retirement obligations, financial instruments, portfolio investment and foreign currency transactions, which will impact Ontario’s 2022–2023 Public Accounts. Where reasonably determinable, the government has included the estimated impact from the PSAB standards in this Budget.
Ontario is in the process of assessing the impacts from new accounting standards and guidelines effective in 2023–24 (PS 3160 – Public Private Partnerships, PS 3400 – Revenue, and PSG-8 – Purchased Intangibles). The estimated impact is not reasonably determinable at this time.
Asset Retirement Obligations
The Asset Retirement Obligations Standard (PS 3280) provides guidance on the accounting and reporting for legal obligations associated with the retirement of tangible capital assets.
In the past, Ontario has reported its obligations related to the retirement of tangible capital assets in the period when the asset is retired. It has reported obligations for closure and post-closure activities related to landfill sites as the landfill sites’ capacity was used.
Ontario is implementing the new standard through a modified retroactive approach, which measures the liability as if the standard had been applied using current information and assumptions. This approach results in the liability being partially recorded to the opening accumulated deficit, and partly to the opening balance of tangible capital assets, resulting in an increase to the province’s net debt. The increased carrying value of tangible capital assets increases future amortization expense.
Ontario identified and assessed potential sources of legal obligations and developed estimates of the liability required to settle the obligation for impacted assets. Going forward, the liability will be updated for the purchase or sale of assets, new or changes to retirement obligations, settlement of obligations and periodic reviews of assumptions.
Financial Instruments and Foreign Currency Translation
The adoption of two new standards on financial instruments (PS 3450) and foreign currency translation (PS 2601), effective April 1, 2022, requires the incorporation of fair value amounts of the debt and derivative portfolio in Ontario’s financial statements. Fair value amounts will impact Ontario’s net debt, presented in the Public Accounts from 2022–23 onwards.
However, there are certain challenges that make it difficult for the provincial budget to credibly forecast the impact of fair valuing Ontario’s debt and derivative portfolio. The first challenge is the lack of reliable forecasts of the underlying fair value input curves, such as the Interest Rate Swap Curve, required to compute fair values. Another challenge is estimating the notional value and number of derivatives required over the medium-term outlook and the balance period. This requires precise estimates of the amount of foreign and domestic debt, and the division between the issuance of fixed and floating rate instruments. While the budget process does include broad estimates for the above, without knowing what the future global or domestic market conditions overall would entail, Ontario cannot accurately forecast what type and how much debt in each category will be issued in the future. For these reasons, Ontario has concluded that it is not possible to forecast the impact of fair valuing its debt and derivative portfolio in the 2022 Budget. However, these fair value amounts will be incorporated in the Public Accounts of Ontario from 2022–23 onwards.
A 100 basis-point parallel shift, either up or down, in the underlying input curves would result in the fair value of financial instruments held by Ontario as at March 31, 2022, decreasing/increasing by $366 million.
Details of Ontario’s Finances
| Actual 2019–20 |
Actual 2020–21 |
Interim1 2021–22 |
Plan 2022–23 |
|
|---|---|---|---|---|
| Taxation Revenue — Personal Income Tax | 37,743 | 40,333 | 42,330 | 44,584 |
| Taxation Revenue — Sales Taxes | 28,619 | 26,576 | 30,358 | 32,287 |
| Taxation Revenue — Corporations Tax | 15,414 | 17,775 | 22,173 | 19,736 |
| Taxation Revenue — Education Property Tax | 6,179 | 6,040 | 5,679 | 5,652 |
| Taxation Revenue — Employer Health Tax | 6,731 | 6,537 | 7,177 | 7,842 |
| Taxation Revenue — Ontario Health Premium | 4,059 | 4,330 | 4,509 | 4,722 |
| Taxation Revenue — Gasoline Tax | 2,783 | 1,898 | 2,305 | 2,088 |
| Taxation Revenue — Land Transfer Tax | 3,067 | 3,698 | 5,685 | 5,686 |
| Taxation Revenue — Tobacco Tax | 1,118 | 1,099 | 991 | 953 |
| Taxation Revenue — Fuel Tax | 807 | 686 | 781 | 703 |
| Taxation Revenue — Beer, Wine and Spirits Taxes | 582 | 624 | 634 | 635 |
| Taxation Revenue — Electricity Payments in Lieu of Taxes | 505 | 563 | 583 | 511 |
| Taxation Revenue — Ontario Portion of the Federal Cannabis Excise Duty | 48 | 106 | 185 | 215 |
| Taxation Revenue — Other Taxes | 623 | 619 | 763 | 800 |
| Taxation Revenue — Total | 108,278 | 110,884 | 124,153 | 126,414 |
| Government of Canada — Canada Health Transfer | 15,640 | 16,206 | 16,729 | 17,560 |
| Government of Canada — Canada Social Transfer | 5,650 | 5,815 | 6,002 | 6,191 |
| Government of Canada — Equalization | – | – | – | – |
| Government of Canada — Infrastructure Programs | 400 | 626 | 706 | 1,239 |
| Government of Canada — Labour Market Programs | 1,054 | 1,323 | 1,523 | 1,128 |
| Government of Canada — Social Housing Agreement | 484 | 338 | 299 | 263 |
| Government of Canada — Other Federal Payments | 1,756 | 9,157 | 4,000 | 4,139 |
| Government of Canada — Direct Transfers to Broader Public Sector Organizations | 414 | 459 | 487 | 479 |
| Government of Canada — Total | 25,398 | 33,924 | 29,747 | 30,999 |
| Income from Government Business Enterprises — Liquor Control Board of Ontario | 2,402 | 2,539 | 2,551 | 2,583 |
| Income from Government Business Enterprises — Ontario Power Generation Inc./Hydro One Ltd. | 1,167 | 2,044 | 1,452 | 1,186 |
| Income from Government Business Enterprises — Ontario Lottery and Gaming Corporation | 2,309 | 359 | 1,436 | 2,330 |
| Income from Government Business Enterprises — Ontario Cannabis Store | 19 | 67 | 174 | 180 |
| Income from Government Business Enterprises — Total | 5,897 | 5,009 | 5,613 | 6,279 |
| Other Non-Tax Revenue — Fees, Donations and Other Revenues from Hospitals, School Boards and Colleges | 9,281 | 7,790 | 8,557 | 9,365 |
| Other Non-Tax Revenue — Vehicle and Driver Registration Fees2 | 2,055 | 1,952 | 80 | 1,034 |
| Other Non-Tax Revenue — Miscellaneous Other Non-Tax Revenue | 1,222 | 1,857 | 1,720 | 1,169 |
| Other Non-Tax Revenue — Other Fees and Licences | 1,156 | 1,017 | 1,037 | 1,211 |
| Other Non-Tax Revenue — Sales and Rentals | 1,369 | 680 | 1,210 | 1,939 |
| Other Non-Tax Revenue — Reimbursements | 1,005 | 1,277 | 996 | 1,039 |
| Other Non-Tax Revenue — Royalties | 283 | 359 | 388 | 307 |
| Other Non-Tax Revenue — Power Supply Contract Recoveries | 122 | 116 | 68 | 42 |
| Other Non-Tax Revenue — Net Reduction of Power Purchase Contracts | 30 | 28 | 5 | – |
| Other Non-Tax Revenue — Total | 16,523 | 15,076 | 14,059 | 16,106 |
| Total Revenue | 156,096 | 164,893 | 173,572 | 179,798 |
Table 3.11 footnotes:
[1] Interim represents the 2022 Budget projection for the 2021–22 fiscal year.
[2] Vehicle and Driver Registration Fees in 2021–22 reflect the elimination and rebate of eligible licence plate renewal fees paid since March 1, 2020.
Note: Numbers may not add due to rounding.
Source: Ontario Ministry of Finance.
| Ministry Expense | Actual 2019–20 |
Actual 2020–21 |
Interim3 2021–22 |
Plan 2022–23 |
|---|---|---|---|---|
| Agriculture, Food and Rural Affairs (Base) | 297 | 289 | 304 | 331.3 |
| Agriculture, Food and Rural Affairs — Federal–Provincial Infrastructure Programs4 | 94 | – | – | – |
| Agriculture, Food and Rural Affairs — Municipal Infrastructure Program Investments5 | 222 | – | – | – |
| Agriculture, Food and Rural Affairs — Demand-Driven Risk Management and Time-Limited Programs6 | 518 | 458 | 405 | 439.3 |
| Agriculture, Food and Rural Affairs — COVID-19 Time-Limited Funding7 | – | 41 | 17 | 47.6 |
| Agriculture, Food and Rural Affairs (Total) | 1,130 | 788 | 726 | 818.1 |
| Attorney General (Base) | 1,684 | 1,524 | 1,681 | 1,783.7 |
| Attorney General — Statutory Appropriations — Crown Liability and Proceedings Act, 2019 | 192 | 60 | 36 | – |
| Attorney General — One-time Accounting Adjustment for the Victim Fine Surcharges Program | – | 196 | – | – |
| Attorney General — COVID-19 Time-Limited Funding8 | – | 71 | 124 | 52.0 |
| Attorney General (Total) | 1,876 | 1,851 | 1,840 | 1,835.7 |
| Board of Internal Economy (Base) | 257 | 248 | 279 | 278.2 |
| Board of Internal Economy — Provision for the Costs of General Election | – | – | – | 100.0 |
| Board of Internal Economy — COVID-19 Time-Limited Funding9 | – | 0 | – | – |
| Board of Internal Economy (Total) | 257 | 248 | 279 | 378.2 |
| Children, Community and Social Services (Base) | 17,066 | 17,026 | 17,211 | 18,326.5 |
| Children, Community and Social Services — COVID-19 Time-Limited Funding10 | – | 440 | 78 | 22.0 |
| Children, Community and Social Services (Total) | 17,066 | 17,466 | 17,289 | 18,348.5 |
| Citizenship and Multiculturalism (Base) | 11 | 14 | 29 | 52.6 |
| Citizenship and Multiculturalism — COVID-19 Time-Limited Funding11 | – | – | 4 | 3.7 |
| Citizenship and Multiculturalism (Total) | 11 | 14 | 33 | 56.3 |
| Colleges and Universities (Base) | 9,220 | 8,767 | 8,944 | 9,439.4 |
| Colleges and Universities — Student Financial Assistance | 1,296 | 766 | 1,037 | 1,333.0 |
| Colleges and Universities — Time-Limited Infrastructure Funding under the Strategic Investment Fund | 2 | – | – | – |
| Colleges and Universities — COVID-19 Time-Limited Funding12 | – | 292 | 21 | 10.7 |
| Colleges and Universities (Total) | 10,519 | 9,826 | 10,002 | 10,783.1 |
| Economic Development, Job Creation and Trade (Base) | 315 | 391 | 433 | 429.8 |
| Economic Development, Job Creation and Trade — Time-Limited Investments | 263 | 187 | 190 | 434.4 |
| Economic Development, Job Creation and Trade — Bad Debt Expense | – | 211 | – | – |
| Economic Development, Job Creation and Trade — COVID-19 Time-Limited Funding13 | – | 3,106 | 468 | 78.0 |
| Economic Development, Job Creation and Trade (Total) | 579 | 3,896 | 1,091 | 942.1 |
| Education (Base) | 30,177 | 28,390 | 29,487 | 32,439.0 |
| Education — Teachers’ Pension Plan | 1,570 | 1,607 | 1,609 | 1,630.0 |
| Education — COVID-19 Time-Limited Funding14 | – | 2,885 | 754 | 597.5 |
| Education (Total) | 31,748 | 32,881 | 31,849 | 34,666.5 |
| Energy (Base)15 | 410 | 229 | 305 | 327.6 |
| Energy — Electricity Cost-Relief Programs | 5,484 | 5,539 | 6,324 | 6,273.7 |
| Energy — COVID-19 Time-Limited Funding16 | – | 906 | 302 | – |
| Energy (Total) | 5,894 | 6,674 | 6,930 | 6,601.3 |
| Environment, Conservation and Parks (Base) | 612 | 632 | 703 | 711.9 |
| Environment, Conservation and Parks — Time-Limited Investments | 2 | – | – | – |
| Environment, Conservation and Parks — COVID-19 Time-Limited Funding17 | – | 3 | 9 | 24.7 |
| Environment, Conservation and Parks (Total) | 614 | 636 | 712 | 736.6 |
| Executive Offices (Base) | 33 | 33 | 41 | 47.0 |
| Executive Offices — Time-Limited Assistance | – | 2 | – | – |
| Executive Offices — COVID-19 Time-Limited Funding18 | – | 6 | 2 | – |
| Executive Offices (Total) | 33 | 41 | 43 | 47.0 |
| Finance (Base) | 819 | 739 | 846 | 938.5 |
| Finance — Investment Management Corporation of Ontario19 | 88 | 128 | 186 | 221.9 |
| Finance — Ontario Municipal Partnership Fund | 503 | 502 | 502 | 501.9 |
| Finance — Power Supply Contract Costs | 122 | 116 | 68 | 42.3 |
| Finance — Time-Limited COVID-19 Fund20 | – | – | – | – |
| Finance — COVID-19 Time-Limited Funding21 | – | 440 | 378 | – |
| Finance (Total) | 1,532 | 1,924 | 1,980 | 1,704.6 |
| Francophone Affairs (Base) | 5 | 5 | 7 | 7.4 |
| Francophone Affairs — Time-Limited Investments | – | – | – | 0.6 |
| Francophone Affairs — COVID-19 Time-Limited Funding22 | – | 1 | 3 | – |
| Francophone Affairs (Total) | 5 | 6 | 9 | 7.9 |
| Government and Consumer Services (Base) | 677 | 623 | 739 | 835.8 |
| Government and Consumer Services — Realty | 924 | 1,099 | 1,143 | 1,184.5 |
| Government and Consumer Services — COVID-19 Time-Limited Funding23 | – | 423 | 128 | 89.2 |
| Government and Consumer Services (Total) | 1,601 | 2,145 | 2,010 | 2,109.6 |
| Health (Total)24 | 59,293 | 59,879 | 65,103 | 68,414.4 |
| COVID-19 Health Response25 | – | 5,082 | 7,971 | 4,753.6 |
| Heritage, Sport, Tourism and Culture Industries (Base) | 904 | 717 | 976 | 871.2 |
| Heritage, Sport, Tourism and Culture Industries — Ontario Cultural Media Tax Credits | 656 | 512 | 693 | 816.9 |
| Heritage, Sport, Tourism and Culture Industries — Ontario Cultural Media Tax Credits — Amounts Related to Prior Years | 80 | 65 | 84 | – |
| Heritage, Sport, Tourism and Culture Industries — COVID-19 Time-Limited Funding26 | – | 120 | 242 | 200.0 |
| Heritage, Sport, Tourism and Culture Industries (Total) | 1,640 | 1,413 | 1,995 | 1,888.2 |
| Indigenous Affairs (Base) | 71 | 64 | 93 | 118.3 |
| Indigenous Affairs — One-Time Investments including Settlements | 16 | 149 | 151 | – |
| Indigenous Affairs — COVID-19 Time-Limited Funding27 | – | 42 | 4 | – |
| Indigenous Affairs (Total) | 86 | 256 | 247 | 118.3 |
| Infrastructure (Base) | 81 | 154 | 194 | 981.5 |
| Infrastructure — Federal–Provincial Infrastructure Programs28 | 160 | 227 | 366 | 717.4 |
| Infrastructure — Waterfront Toronto Revitalization (Port Lands Flood Protection) | 116 | 103 | 156 | 25.0 |
| Infrastructure — Municipal Infrastructure Program Investments29 | – | 197 | 398 | 398.4 |
| Infrastructure — COVID-19 Time-Limited Funding30 | – | 0 | 37 | – |
| Infrastructure (Total) | 358 | 682 | 1,151 | 2,122.3 |
| Labour, Training and Skills Development (Base) | 159 | 170 | 201 | 301.7 |
| Labour, Training and Skills Development — Training Tax Credits (Co-operative Education and Apprenticeship Training)31 | 152 | 98 | 105 | 92.0 |
| Labour, Training and Skills Development — Demand-Driven Employment and Training Programs | 922 | 1,142 | 1,171 | 1,126.6 |
| Labour, Training and Skills Development — COVID-19 Time-Limited Funding32 | – | 33 | 579 | 284.7 |
| Labour, Training and Skills Development (Total) | 1,232 | 1,443 | 2,057 | 1,804.9 |
| Long-Term Care (Total)33 | 4,423 | 4,513 | 5,941 | 6,750.9 |
| Municipal Affairs and Housing (Base) | 540 | 485 | 488 | 562.4 |
| Municipal Affairs and Housing — Time-Limited Investments | 317 | 224 | 468 | 414.5 |
| Municipal Affairs and Housing — Social Housing Agreement — Payments to Service Managers34 | 341 | 313 | 281 | 210.3 |
| Municipal Affairs and Housing — COVID-19 Time-Limited Funding35 | – | 2,707 | 324 | 127.5 |
| Municipal Affairs and Housing (Total) | 1,197 | 3,729 | 1,561 | 1,314.7 |
| Northern Development, Mines, Natural Resources and Forestry (Base)36 | 1,219 | 1,176 | 1,436 | 1,439.4 |
| Northern Development, Mines, Natural Resources and Forestry — One-Time Accounting Adjustment for Landfills | – | 202 | – | – |
| Northern Development, Mines, Natural Resources and Forestry — Emergency Forest Firefighting | 136 | 115 | 239 | 100.0 |
| Northern Development, Mines, Natural Resources and Forestry — COVID-19 Time-Limited Funding37 | – | 13 | 48 | – |
| Northern Development, Mines, Natural Resources and Forestry (Total) | 1,355 | 1,506 | 1,723 | 1,539.3 |
| Seniors and Accessibility (Base) | 63 | 65 | 77 | 203.1 |
| Seniors and Accessibility — Time-Limited Investments | – | – | 9 | 0.8 |
| Seniors and Accessibility — COVID-19 Time-Limited Funding38 | – | 151 | 35 | 31.1 |
| Seniors and Accessibility (Total) | 63 | 216 | 121 | 235.0 |
| Solicitor General (Base) | 2,759 | 2,820 | 3,045 | 3,516.4 |
| Solicitor General — COVID-19 Time-Limited Funding39 | – | 94 | 137 | – |
| Solicitor General (Total) | 2,759 | 2,914 | 3,182 | 3,516.4 |
| Transportation (Base)40 | 4,950 | 4,668 | 5,572 | 5,888.2 |
| Transportation — Federal–Provincial Infrastructure Programs | 188 | 449 | 277 | 720.7 |
| Transportation — COVID-19 Time-Limited Funding41 | – | 2,188 | 345 | 585.0 |
| Transportation (Total) | 5,138 | 7,306 | 6,195 | 7,194.0 |
| Treasury Board Secretariat (Base) | 199 | 201 | 311 | 335.2 |
| Treasury Board Secretariat — Employee and Pensioner Benefits | 1,665 | 1,485 | 1,650 | 1,590.1 |
| Treasury Board Secretariat — Operating Contingency Fund | – | – | 75 | 4,325.8 |
| Treasury Board Secretariat — Capital Contingency Fund | – | – | – | 224.2 |
| Treasury Board Secretariat — COVID-19 Time-Limited Funding42 | – | 3 | – | – |
| Treasury Board Secretariat (Total) | 1,864 | 1,689 | 2,036 | 6,475.3 |
| Interest on Debt43 | 12,495 | 12,274 | 12,992 | 13,485.0 |
| Total Expense | 164,768 | 181,297 | 187,068 | 198,647.7 |
Table 3.12 footnotes:
[1] Numbers reflect current ministry structure.
[2] Ministry expenses have been restated for reclassification and program transfer changes. These changes are fiscally neutral. The actual results are presented on a similar basis for consistency.
[3] Interim represents the 2022 Budget projection for the 2021–22 fiscal year.
[4], [5], [28], [29] Municipal and Federal–Provincial Infrastructure Program delivery transferred from the Ontario Ministry of Agriculture, Food and Rural Affairs to the Ontario Ministry of Infrastructure in 2020–21.
[6] The 2019–20 amount includes an extraordinary production insurance payout of $175 million above annual forecast due to 2019 crop conditions.
[7], [8], [9], [10], [11], [12], [13], [14], [16], [17], [18], [20], [21], [22], [23], [26], [27], [30], [32], [35], [37], [38], [39], [41], [42] In the 2021 Budget, the government made available COVID‐19 Time‐Limited Funding. This funding continues to be presented separately in order to transparently capture the temporary nature of these investments.
[15], [36], [40] Ontario Northland Transportation Commission was transferred from the Ontario Ministry of Energy, Northern Development and Mines to the Ontario Ministry of Transportation beginning in 2020–21.
[19] Based on the requirements of Public Sector Accounting Standards, the government consolidates the Investment Management Corporation of Ontario into the Ontario Ministry of Finance.
[24] Includes accounting adjustments tied primarily to grants provided for infrastructure projects and other related investments.
[25] For presentation purposes in the 2022 Budget, time-limited COVID-19-related health response spending has been included separately instead of within the Ontario Ministry of Health and Ontario Ministry of Long-Term Care. This change in presentation does not impact ministry allocations, which reflect the ministry structure(s) presented in the 2022–23 Expenditure Estimates.
[31] The Co-operative Education Tax Credit remains in effect. The Apprenticeship Training Tax Credit is eliminated for eligible apprenticeship programs that commenced on or after November 15, 2017. Amounts from 2019–20 to 2021–22 include tax credit amounts related to prior years.
[33] The Ontario Ministry of Long-Term Care total includes expenses incurred by Ontario Health for funding for long-term care. These amounts will be consolidated in the total expense of the Ontario Ministry of Health, including $4.5 billion for interim 2021–22 and $4.7 billion in 2022–23.
[34] The annual decline from 2019–20 to 2022–23 is mainly due to declining federal obligations, such as maturing mortgages, under the Social Housing Agreement.
[43] Interest on debt is net of interest capitalized during construction of tangible capital assets of $245 million in 2019–20, $230 million in 2020–21, $232 million in 2021–22, and $401 million in 2022–23.
Note: Numbers may not add due to rounding.
Sources: Ontario Treasury Board Secretariat and Ontario Ministry of Finance.
| Sector | Total Infrastructure Expenditures Interim1, 2 2021–22 |
2022–23 Plan Investment in Capital Assets3 |
2022–23 Plan Transfers and Other Infrastructure Expenditures4 |
2022–23 Plan Total Infrastructure Expenditures |
|---|---|---|---|---|
| Transportation — Transit | 6,698 | 6,767 | 1,415 | 8,183 |
| Transportation — Provincial Highways | 3,030 | 2,778 | 240 | 3,018 |
| Transportation — Other Transportation, Property and Planning | 179 | 142 | 77 | 219 |
| Health — Hospitals | 1,864 | 3,022 | 3 | 3,025 |
| Health — Other Health | 192 | 53 | 162 | 215 |
| Education | 2,672 | 2,922 | 15 | 2,938 |
| Postsecondary Education — Colleges and Other | 419 | 395 | 75 | 470 |
| Postsecondary Education — Universities | 93 | – | 135 | 135 |
| Social | 479 | 20 | 299 | 319 |
| Justice | 400 | 822 | 26 | 847 |
| Other Sectors5 | 2,142 | 993 | 2,286 | 3,279 |
| Total Infrastructure Expenditures | 18,167 | 17,914 | 4,733 | 22,647 |
| Less: Other Partner Funding6 | 1,303 | 2,611 | – | 2,611 |
| Total7 | 16,864 | 15,303 | 4,733 | 20,035 |
Table 3.13 footnotes:
[1] Interim represents the 2022 Budget projection for the 2021–22 fiscal year.
[2] Includes provincial investment in capital assets of $12.9 billion.
[3] Includes $401 million in interest capitalized during construction.
[4] Includes transfers to municipalities, universities and non-consolidated agencies.
[5] Includes broadband infrastructure, government administration, natural resources, and the culture and tourism industries.
[6] Other Partner Funding refers to third-party investments primarily in hospitals, colleges and schools.
[7] Includes Federal/Municipal contributions to provincial infrastructure investments.
Note: Numbers may not add due to rounding.
Source: Ontario Treasury Board Secretariat.
| 2013–14 | 2014–15 | 2015–16 | 2016–17 | 2017–18 | 2018–19 | 2019–20 | Actual 2020–21 |
Interim5 2021–22 |
Plan 2022–23 |
|
|---|---|---|---|---|---|---|---|---|---|---|
| Revenue | 122,955 | 126,152 | 136,148 | 140,734 | 150,594 | 153,700 | 156,096 | 164,893 | 173,572 | 179,798 |
| Expense — Programs | 123,330 | 126,199 | 129,905 | 131,460 | 142,363 | 148,751 | 152,273 | 169,023 | 174,076 | 185,163 |
| Expense — Interest on Debt3 | 11,155 | 11,221 | 11,589 | 11,709 | 11,903 | 12,384 | 12,495 | 12,274 | 12,992 | 13,485 |
| Total Expense | 134,485 | 137,420 | 141,494 | 143,169 | 154,266 | 161,135 | 164,768 | 181,297 | 187,068 | 198,648 |
| Reserve | – | – | – | – | – | – | – | – | – | 1,000 |
| Surplus/(Deficit) | (11,530) | (11,268) | (5,346) | (2,435) | (3,672) | (7,435) | (8,672) | (16,404) | (13,496) | (19,850) |
| Net Debt | 276,169 | 294,557 | 306,357 | 314,077 | 323,834 | 338,496 | 353,332 | 373,564 | 394,933 | 428,653 |
| Accumulated Deficit | 184,835 | 196,665 | 203,014 | 205,939 | 209,023 | 216,642 | 225,764 | 239,294 | 252,790 | 276,376 |
| Gross Domestic Product (GDP) at Market Prices | 696,192 | 727,042 | 760,435 | 790,749 | 824,979 | 860,104 | 892,226 | 866,940 | 970,549 | 1,035,576 |
| Primary Household Income | 473,807 | 490,423 | 512,570 | 520,486 | 541,501 | 567,484 | 592,605 | 590,677 | 637,712 | 672,719 |
| Population (000s) — July4 | 13,511 | 13,618 | 13,707 | 13,875 | 14,070 | 14,309 | 14,545 | 14,746 | 14,826 | 15,129 |
| Net Debt per Capita (dollars) | 20,441 | 21,631 | 22,350 | 22,636 | 23,016 | 23,657 | 24,293 | 25,334 | 26,637 | 28,334 |
| Household Income per Capita (dollars) | 35,069 | 36,014 | 37,394 | 37,511 | 38,486 | 39,660 | 40,744 | 40,058 | 43,012 | 44,467 |
| Net Debt as a Per Cent of Revenue | 224.6% | 233.5% | 225.0% | 223.2% | 215.0% | 220.2% | 226.4% | 226.5% | 227.5% | 238.4% |
| Interest on Debt as a Per Cent of Revenue | 9.1% | 8.9% | 8.5% | 8.3% | 7.9% | 8.1% | 8.0% | 7.4% | 7.5% | 7.5% |
| Net Debt as a Per Cent of GDP | 39.7% | 40.5% | 40.3% | 39.7% | 39.3% | 39.4% | 39.6% | 43.1% | 40.7% | 41.4% |
| Accumulated Deficit as a Per Cent of GDP | 26.5% | 27.1% | 26.7% | 26.0% | 25.3% | 25.2% | 25.3% | 27.6% | 26.0% | 26.7% |
Table 3.14 footnotes:
[1] Amounts reflect a change in pension expense that was calculated based on recommendations of the Independent Financial Commission of Inquiry, as described in Note 19 to the Consolidated Financial Statements, in Public Accounts of Ontario 2017–2018. Amounts for net debt and accumulated deficit also reflect this change.
[2] Revenues and expenses have been restated to reflect the change in presentation of third-party revenue for hospitals, school boards and colleges to be reported as revenue.This restatement is fiscally neutral.
[3] Interest on debt is net of interest capitalized during construction of tangible capital assets of $245 million in 2019–20, $230 million in 2020–21, $232 million in 2021–22, and $401 million in 2022–23.
[4] Population figures are for July 1 of the fiscal year indicated (i.e., for 2017–18, the population on July 1, 2017, is shown).
[5] Interim represents the 2022 Budget projection for the 2021–22 fiscal year.
Note: Numbers may not add due to rounding.
Sources: Statistics Canada, Ontario Treasury Board Secretariat and Ontario Ministry of Finance.
Footnotes
[1] The three experts are from the Policy and Economic Analysis Program at the University of Toronto; Quantitative Economic Decisions, Inc.; and Stokes Economic Consulting, Inc.
Chart Descriptions
Chart 3.1: Current Deficit Outlook Compared to 2021 Budget
The bar chart illustrates the deficit outlook presented in the 2021 Budget compared to the current outlook in the 2022 Budget. The 2021 Budget projected deficits of $33.1 billion in 2021–22, $27.7 billion in 2022–23, and $20.2 billion in 2023–24. With the release of the 2022 Budget, the deficit projections have been revised to $13.5 billion in 2021–22, $19.9 billion in 2022–23, and $12.3 billion in 2023–24.
Source: Ontario Ministry of Finance.
Chart 3.2: Ontario Medium-Term Outlook Scenarios
The bar chart illustrates the range of Ontario deficit outlooks based on the two alternative economic scenarios presented in Chapter 2: Economic Performance and Outlook. The 2022 Budget deficit outlook estimates the deficit to be $19.9 billion in 2022–23, $12.3 billion in 2023–24, and $7.6 billion in 2024–25. Under the Faster Growth scenario, the deficit outlook is estimated to be $15.0 billion in 2022–23 and $4.9 billion in 2023–24, and a surplus of $2.4 billion in 2024–25. Under the Slower Growth scenario, the deficit outlook is estimated to be $23.2 billion in 2022–23, $17.8 billion in 2023–24, and $15.0 billion in 2024–25.
Source: Ontario Ministry of Finance.
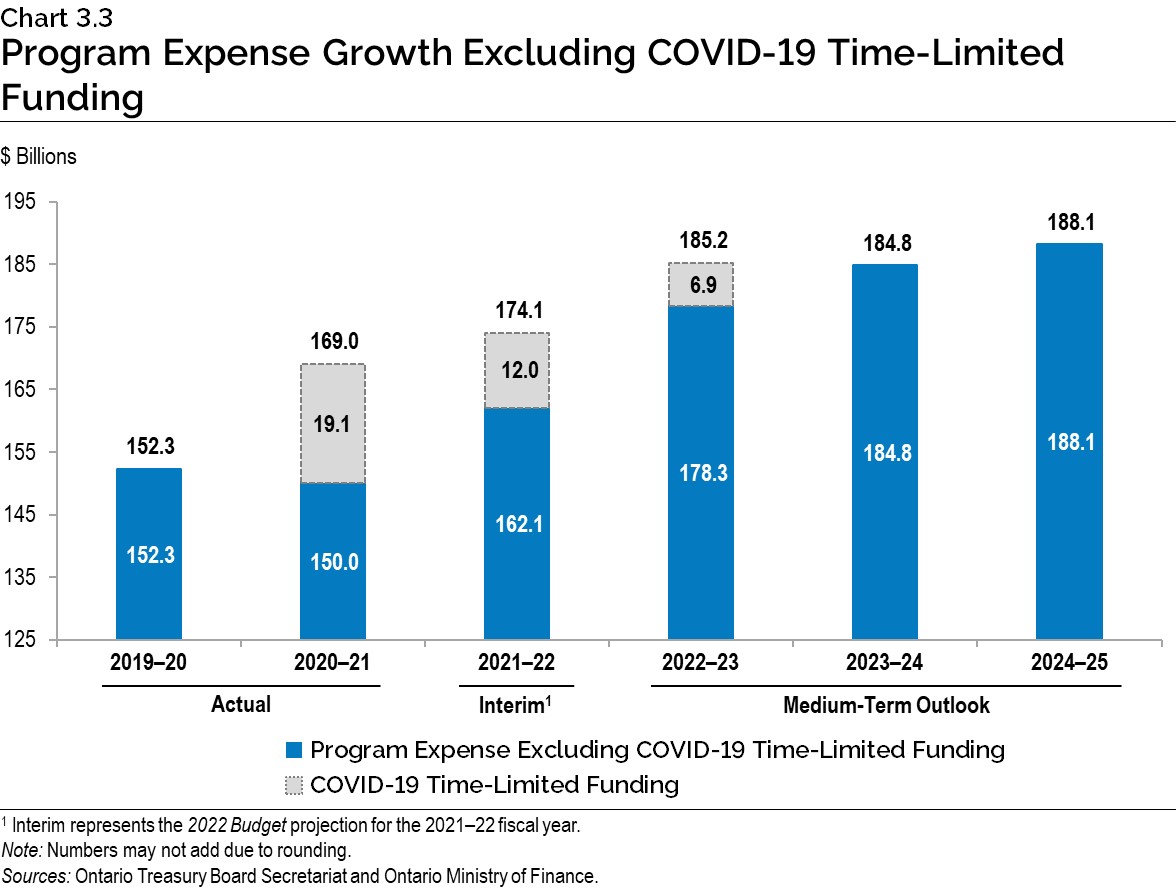
Chart 3.3: Program Expense Growth Excluding COVID-19 Time-Limited Funding
The bar chart shows program expense growth from 2019–20 to 2024–25 excluding COVID-19 Time-Limited Funding. For 2019–20, program expense, excluding COVID-19 Time-Limited Funding, is $152.3 billion, $150.0 billion in 2020–21, $162.1 billion in 2021–22, $178.3 billion in 2022–23, $184.8 billion in 2023–24 and $188.1 billion in 2024–25.
There are only three fiscal years from 2019–20 to 2024–25 where COVID-19 Time-Limited Funding is included as part of total program expense. In 2020–21, COVID-19 Time-Limited Funding of $19.1 billion increases total program expense to $169.0 billion. In 2021–22, COVID-19 Time-Limited Funding of $12.0 billion increases total program expense to $174.1 billion. In 2022–23, COVID-19 Time-Limited Funding of $6.9 billion increases total program expense to $185.2 billion.
Note: Numbers may not add due to rounding.
Sources: Ontario Treasury Board Secretariat and Ontario Ministry of Finance.
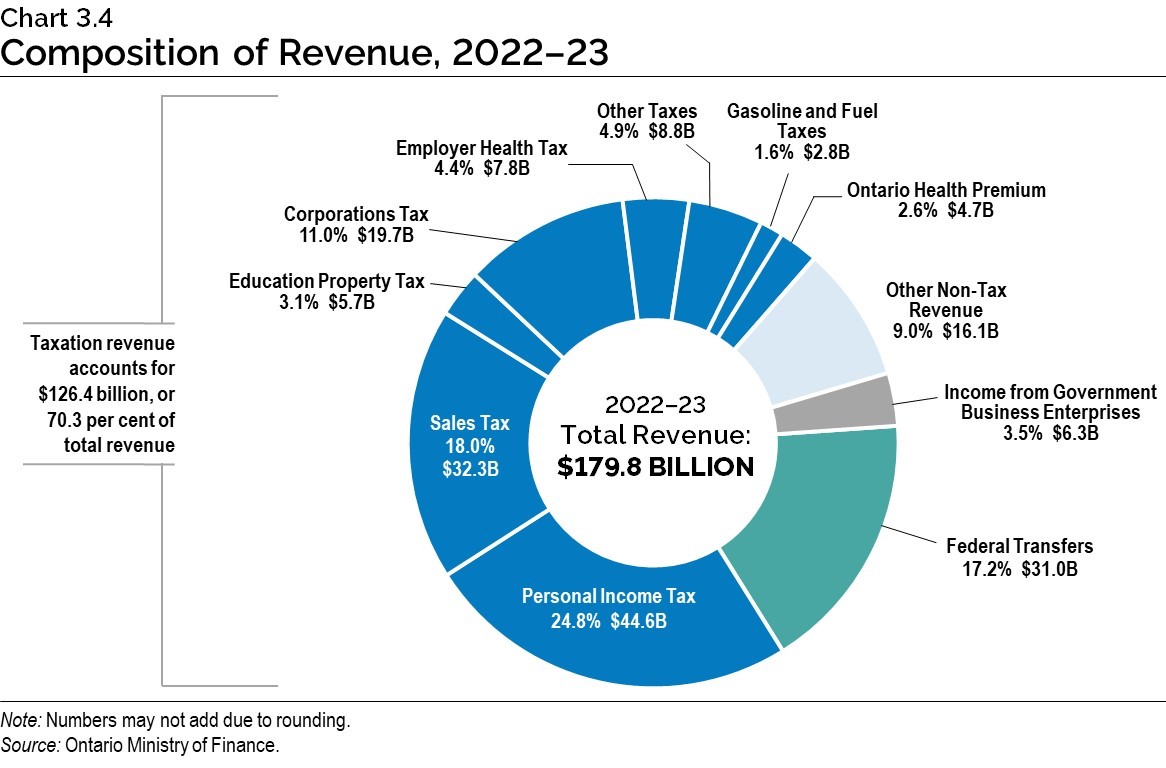
Chart 3.4: Composition of Revenue, 2022–23
The pie chart shows the composition of Ontario’s revenue in 2022–23, which is projected to be $179.8 billion. The largest taxation revenue source is Personal Income Tax revenue at $44.6 billion, accounting for 24.8 per cent of total revenue. This is followed by Sales Tax at $32.3 billion, or 18.0 per cent of total revenue; and Corporations Tax at $19.7 billion, or 11.0 per cent of total revenue. Other components of taxation revenue include Education Property Tax at $5.7 billion, or 3.1 per cent of total revenue; Employer Health Tax at $7.8 billion, or 4.4 per cent; Gasoline and Fuel Taxes at $2.8 billion, or 1.6 per cent; the Ontario Health Premium at $4.7 billion, or 2.6 per cent; and Other Taxes at $8.8 billion, or 4.9 per cent of total revenue.
Total taxation revenue accounts for $126.4 billion, or 70.3 per cent of total revenue.
The other major non-taxation sources of revenue are Federal Transfers of $31.0 billion, or 17.2 per cent of total revenue; Income from Government Business Enterprises at $6.3 billion, or 3.5 per cent of total revenue; and various Other Non-Tax Revenue at $16.1 billion, or 9.0 per cent of total revenue.
Note: Numbers may not add due to rounding.
Source: Ontario Ministry of Finance.
Chart 3.5: Composition of Total Expense, 2022–23
The pie chart shows the share of Ontario’s total expense and dollar amounts by sector in 2022–23.
Total expense in 2022–23 is projected to be $198.6 billion.
Base Program Expense excludes Interest on Debt and COVID-19 Time-Limited Funding, and accounts for $178.3 billion.1
The largest expense is the Health Sector at $75.2 billion, accounting for 37.8 per cent of total expense.
The remaining sectors of total expense include the Education Sector2 at $32.4 billion or 16.3 per cent; the Postsecondary Education Sector at $10.8 billion or 5.4 per cent; the Children’s and Social Services Sector at $18.3 billion or 9.2 per cent; the Justice Sector at $5.3 billion or 2.7 per cent; Other Programs at $36.3 billion or 18.2 per cent; and COVID-19 Time-Limited Funding at $6.9 billion or 3.5 per cent. Interest on Debt, included as part of Total Expense, is $13.5 billion or 6.8 per cent.
[1] For presentation purposes beginning in the 2021 Budget, one-time COVID-19-related spending has been included within COVID-19 Time-Limited Funding. The change in presentation does not impact ministry allocations or ministry structure(s) to be presented in the 2022–23 Expenditure Estimates. For details on time-limited funding and contingencies, see Table 3.9.
[2] Excludes the Teachers’ Pension Plan. Teachers’ Pension Plan expense is included in Other Programs.
Note: Numbers may not add due to rounding.
Sources: Ontario Treasury Board Secretariat and Ontario Ministry of Finance.