The government is currently projecting a deficit of $4.3 billion in 2016–17, and a balanced budget in 2017–18 and 2018–19, consistent with the 2016 Budget plan.
| Item | Actual 2015–16 |
Current Outlook 2016–17 |
Medium-Term Outlook 2017–18 |
Medium-Term Outlook 2018–19 |
|---|---|---|---|---|
| Revenue | 128.4 | 132.7 | 140.1 | 144.9 |
| Expense - Programs | 122.4 | 125.3 | 127.7 | 131.7 |
| Expense - Interest on Debt | 11.0 | 11.4 | 11.7 | 12.4 |
| Total Expense | 133.4 | 136.6 | 139.4 | 144.1 |
| Surplus/(Deficit) Before Reserve | (5.0) | (3.9) | 0.7 | 0.8 |
| Reserve | – | 0.4 | 0.7 | 0.8 |
| Surplus/(Deficit) | (5.0) | (4.3) | 0.0 | 0.0 |
| Net Debt as a Per Cent of GDP | 40.0 | 40.3 | 39.8 | 39.3 |
| Accumulated Deficit as a Per Cent of GDP | 26.6 | 26.2 | 25.2 | 24.2 |
Table 3.7 footnote:
Notes: Numbers may not add due to rounding.
2015–16 actual results reflect the accounting treatment adopted in the Public Accounts of Ontario 2015–2016 including the Pension Adjustment related to net pension assets. Outlook for 2016–17 to 2018–19 also reflects this Pension Adjustment.
Revenues are projected to grow from $132.7 billion in 2016–17 to $144.9 billion in 2018–19. This represents an increase in the medium-term revenue outlook since the 2016 Budget, reflecting a higher tax revenue base, largely a result of the processing of 2015 personal and corporate income tax returns since the 2016 Budget and a stronger housing market in 2016.
Program expense is projected to grow from $125.3 billion in 2016–17 to $131.7 billion in 2018–19, and is forecast to be higher in each year compared to the 2016 Budget plan. This includes investing in things that matter most and that help Ontarians, such as electricity cost relief for Ontario consumers and support for public hospitals. Consistent with the accounting treatment for pensions reflected in the Public Accounts of Ontario 2015–2016, including the Pension Adjustment related to net pension assets, the outlook also reflects a cautious approach to forecasting pension expense each year (see Chapter 2, Section B: Transforming Government and Managing Costs).
Total expense is also projected to be higher in each year compared to the 2016 Budget, but is partly mitigated by lower-than-forecast interest on debt expense resulting from lower-than-forecast interest rates.
The 2016 Budget included a reserve of $1.0 billion in 2016–17, $1.1 billion in 2017–18 and $1.2 billion in 2018–19, to protect the fiscal outlook against unforeseen adverse changes. The reserve is being reduced to $0.4 billion in 2016–17, $0.7 billion in 2017–18 and $0.8 billion in 2018–19 to help mitigate the impact of the unexpected change to the accounting treatment for net pension assets.
The net debt-to-GDP ratio is projected to be 40.3 per cent in 2016–17 and then begin to decline from 2017–18 onwards.
2015–16 Fiscal Update
The government continues to project a deficit of $4.3 billion in 2016–17, unchanged from the 2016 Budget forecast.
| Item | Budget Plan | Current Outlook | In-Year Change |
|---|---|---|---|
| Revenue | 130,589 | 132,720 | 2,131 |
| Expense - Programs | 122,139 | 125,269 | 3,130 |
| Expense - Interest on Debt | 11,756 | 11,375 | (381) |
| Total Expense | 133,895 | 136,644 | 2,749 |
| Reserve | 1,000 | 400 | (600) |
| Surplus/(Deficit) | (4,306) | (4,324) | (18) |
Table 3.8 footnote:
Notes: Numbers may not add due to rounding.
The Budget Plan reflects the Province’s historical application of public-sector accounting standards for net pension assets.
The Current Outlook reflects the approach to forecasting pension expense including the Pension Adjustment.
The Province’s total revenue projection of $132.7 billion for 2016–17 is $2.1 billion higher than the 2016 Budget forecast. This is largely due to projected higher personal and corporate income tax revenues and continued strength in the housing market.
The 2016–17 program expense outlook is $3.1 billion higher than the projection in the 2016 Budget. This reflects electricity cost relief and an investment to support public hospitals. It also incorporates $2.2 billion in increased pension expense related to the Pension Adjustment (see Chapter 2, Section B: Transforming Government and Managing Costs).
Interest on debt expense for 2016–17 is forecast to be $11.4 billion, $0.4 billion lower than forecast in the 2016 Budget, continuing a trend that has been in place since 2010–11, through a combination of lower-than-forecast deficits and borrowing requirements, and lower-than-forecast interest rates.
As a result, the total expense outlook for 2016–17 is projected to be $2.7 billion higher than the 2016 Budget forecast.
The 2016–17 outlook also includes a $0.4 billion reserve to protect the fiscal outlook against unforeseen adverse changes in the Province’s revenue and expense. The reserve is reduced by $0.6 billion from the 2016 Budget plan to help mitigate the fiscal impact of the Pension Adjustment.
2016–17 Revenue Changes since the 2016 Budget
The Province’s revenue outlook of $132.7 billion in 2016–17 is $2.1 billion higher than the 2016 Budget forecast. The increase largely reflects higher income tax revenues, particularly from Personal Income Tax and Corporate Income Tax, due to stronger-than-projected 2015 tax return results and a stronger housing market, which led to higher Land Transfer Tax revenues.
| Item | 2016–17 |
|---|---|
| Taxation Changes - Personal Income Tax and Ontario Health Premium | 1,108 |
| Taxation Changes - Corporations Tax | 726 |
| Taxation Changes - Land Transfer Tax | 314 |
| Taxation Changes - All Other Taxes | 123 |
| Taxation Changes - Employer Health Tax | (111) |
| Taxation Changes - Sales Tax | (132) |
| Total Taxation Changes | 2,028 |
| Government of Canada Transfers | (182) |
| Income from Government Business Enterprises | 185 |
| Other Non-Tax Revenues | 100 |
| Total Revenue Changes since the 2016 Budget | 2,131 |
Table 3.9 footnote:
Note: Numbers may not add due to rounding.
Details of 2016–17 In-Year Revenue Changes
Key changes to revenue projections since the 2016 Budget include the following:
- Personal Income Tax and Ontario Health Premium combined revenue is $1,108 million higher than the 2016 Budget forecast, primarily due to higher 2015 revenue, based on tax returns processed since the 2016 Budget. This is partially offset by slower projected growth in wages and salaries in 2016.
- Corporations Tax revenue is $726 million higher, based on 2015 tax returns processed since the 2016 Budget. This is partially offset by slower growth in corporate profits in 2016.
- Land Transfer Tax revenue is $314 million higher, due to the continued strength of Ontario’s housing market in 2016.
- All Other Taxes revenue is $123 million higher, mainly reflecting higher 2015–16 Education Property Tax, Preferred Share Dividend Tax and Tobacco Tax revenues.
- Employer Health Tax revenue is $111 million lower, based on 2015–16 results and slightly slower projected growth in wages and salaries in 2016.
- The outlook for Sales Tax revenue is $132 million lower, reflecting an anticipated negative prior-year adjustment to the Province’s 2015 Harmonized Sales Tax (HST) revenue entitlement.
- Government of Canada Transfers are $182 million lower, mainly due to lower transfers in 2016–17 for home care and infrastructure than anticipated in the 2016 Budget. Funding announced since the 2016 Budget for affordable housing, postsecondary education, and clean water and wastewater projects is included in the outlook.
- Income from Government Business Enterprises is $185 million higher, reflecting stronger 2016–17 year-to-date performances of the Ontario Lottery and Gaming Corporation (OLG) and Liquor Control Board of Ontario (LCBO).
- Other Non-Tax Revenue is $100 million higher, reflecting higher projected revenue related to recoveries of prior-year expenditures based on 2015–16 results.
2016–17 Expense Changes since the 2016 Budget
The 2016–17 total expense outlook, at $136.6 billion, is $2.7 billion higher than the projection in the 2016 Budget.
| Item | 2016–17 |
|---|---|
| Net Changes in Program Expense Reported in First Quarter Finances | 0.9 |
| Program Expense Changes since the First Quarter Finances - Pension Adjustment1 | 2,240.5 |
| Program Expense Changes since the First Quarter Finances - Net Program Expense Changes Associated with Increased Federal Transfers | 423.0 |
| Program Expense Changes since the First Quarter Finances - Green Investment Fund | 325.0 |
| Program Expense Changes since the First Quarter Finances - 8% Provincial Rebate for Electricity Consumers | 300.0 |
| Program Expense Changes since the First Quarter Finances - Support for Improved Patient Services in Hospitals | 140.3 |
| Program Expense Changes since the First Quarter Finances - Emergency Forest Firefighting | 65.0 |
| Program Expense Changes since the First Quarter Finances - School Renewal Funding | 37.6 |
| Program Expense Changes since the First Quarter Finances - Ontario’s Strategy to End Human Trafficking | 1.4 |
| Program Expense Changes since the First Quarter Finances - Contiingency Funds | (404.0) |
| Net Program Expense Changes since the First Quarter Finances | 3,128.80 |
| Interest on Debt | (381.0) |
| Total Expense Changes since the 2016 Budget | 2,748.70 |
Table 3.10 footnote:
Notes: Numbers may not add due to rounding.
[1] Reflects the approach to forecasting pension expense including the Pension Adjustment (see Chapter 2, Section B: Transforming Government and Managing Costs).
Details of 2016–17 In-Year Expense Changes
The following program expense changes have occurred since the 2016–17 First Quarter Finances.
- A $2.2 billion pension expense increase to reflect the Pension Adjustment. This potential impact reflects a consistent approach for pension expense as reported in the Public Accounts of Ontario 2015–2016 (see Chapter 2, Section B: Transforming Government and Managing Costs for details on the treatment of Provincial net pension assets).
- An expense increase of $423.0 million in 2016–17 to support new investments in social and affordable housing, postsecondary education, and projects under the Clean Water and Wastewater Fund (CWWF), fully offset by federal revenue. The net expense increase in 2016–17 of $423.0 million represents the first portion of the multi-year bilateral infrastructure agreements reached between the Province and the federal government since the 2016 Budget. The agreements include almost $2 billion in federal support for social and affordable housing, new infrastructure investments at Ontario postsecondary institutions and the CWWF.
- An investment of $325.0 million for the Green Investment Fund, as announced in the 2015 Ontario Economic Outlook and Fiscal Review, to support the Province’s climate change strategy.
- Electricity cost relief of $300.0 million to provide a rebate equal to the provincial portion of the HST on electricity bills.
- An investment of $140.3 million to maintain and expand patient access to high-quality services in public hospitals across Ontario as they continue to meet the growing needs of their local communities. The new funding will help many hospitals sustain and improve access to key services such as obstetrics, elective surgeries and diagnostic imaging, and will help reduce wait times for hospital services.
- An increase of $65.0 million to support emergency forest firefighting activities until the end of the 2016 fire season.
- An increase of $37.6 million for school renewal funding. This expense increase is part of the additional $1.1 billion over two school years that the Province announced in summer 2016.
- An increase of $1.4 million to support planning for implementation of Ontario’s Strategy to End Human Trafficking.
- A decrease of $404.0 million in the contingency funds to offset select program expense changes that have occurred since the 2016–17 First Quarter Finances.
Interest on debt expense is $381.0 million lower than projected in the 2016 Budget, primarily as a result of lower-than-forecast interest rates.
Medium-Term Fiscal Outlook
The government continues to project a balanced budget in 2017–18 and 2018–19, unchanged from the 2016 Budget forecast.
Medium-Term Revenue Outlook
The medium-term revenue outlook reflects current revenue information and projections for the Ontario economy as outlined in Section A: Ontario’s Economic Outlook of this chapter, as well as revised assumptions related to the federal government’s commitments. Revenue is projected to grow at an average annual rate of 4.1 per cent between 2015–16 and 2018–19.
Key information still to be received over the remainder of the fiscal year could have a significant impact on the medium-term revenue outlook.
| Item | Current Outlook 2016–17 |
Medium-Term Outlook 2017–18 |
Medium-Term Outlook 2018–19 |
|---|---|---|---|
| Revenue - Taxation Revenue | 93.8 | 98.1 | 103.0 |
| Revenue - Government of Canada | 24.5 | 25.7 | 26.5 |
| Revenue - Income from Government Business Enterprises | 5.2 | 5.5 | 5.9 |
| Revenue - Other Non-Tax Revenue | 9.2 | 10.7 | 9.5 |
| 2016 Ontario Economic Outlook and Fiscal Review | 132.7 | 140.1 | 144.9 |
Table 3.11 footnote:
Note: Numbers may not add due to rounding.
The medium-term Taxation Revenue outlook reflects current revenue information and projections for the Ontario economy. Taxation revenue is projected to grow by $11.1 billion between 2015–16 and 2018–19, or at an average annual rate of 3.9 per cent, which is consistent with average annual nominal GDP growth of 3.9 per cent.
Government of Canada transfers are projected to grow by $3.6 billion, or at an average annual rate of 5.0 per cent over the medium term. The forecast also includes new funding for postsecondary education and infrastructure projects, reflecting recently signed agreements with the federal government.
The outlook for Income from Government Business Enterprises (GBEs) is based on Ministry of Finance estimates for Hydro One and Hydro One Brampton and projections provided by Ontario Power Generation, LCBO and OLG. Overall revenue from GBEs is projected to grow by $1.0 billion between 2015–16 and 2018–19, or at an average annual rate of 6.4 per cent, reflecting higher net income overall from the GBEs.
The outlook for Other Non-Tax Revenue is based on projections provided by government ministries and provincial agencies. The outlook for Other Non-Tax Revenue is projected to increase by $0.8 billion, or at an average annual rate of 2.8 per cent, over the medium term. The Other Non-Tax Revenue outlook includes anticipated proceeds from the auctioning of cap-and-trade permits beginning in 2017 and projected net proceeds from the government’s asset optimization strategy. The decrease in Other Non-Tax Revenue in 2018–19 largely reflects the removal of the debt retirement charge from electricity bills as of April 1, 2018, and a decrease in projected net proceeds from the asset optimization strategy.
Medium-Term Revenue Changes since the 2016 Budget
| Item | Current Outlook 2016–17 |
Medium-Term Outlook 2017–18 |
Medium-Term Outlook 2018–19 |
|---|---|---|---|
| 2016 Budget Total Revenue | 130.6 | 137.7 | 141.9 |
| Changes since the 2016 Budget - Taxation Revenue | 2.0 | 2.1 | 2.8 |
| Changes since the 2016 Budget - Government of Canada | (0.2) | (0.0) | (0.1) |
| Changes since the 2016 Budget - Income from Government Business Enterprises | 0.2 | 0.2 | 0.2 |
| Changes since the 2016 Budget - Other Non-Tax Revenue | 0.1 | 0.1 | 0.1 |
| Total Changes since the 2016 Budget | 2.1 | 2.4 | 3.0 |
| 2016 Ontario Economic Outlook and Fiscal Review Total Revenue | 132.7 | 140.1 | 144.9 |
Table 3.12 footnote:
Note: Numbers may not add due to rounding.
The outlook for Taxation Revenue has increased over the medium term, reflecting continued strength in the housing market in 2016 and a higher tax revenue base, including higher revenues from the processing of 2015 personal and corporate income tax returns during 2016 and higher HST revenues due in part to a projected increase in Ontario’s share allocation for HST. These positive impacts are partially offset by slower nominal GDP growth in 2016 and 2017.
The lower medium-term outlook for Government of Canada transfers is largely due to lower Equalization payments in 2017–18 and 2018–19, and revisions to projected funding for infrastructure. This includes new funding for affordable housing, postsecondary education and projects under the CWWF.
The change in the medium-term outlook for Income from Government Business Enterprises reflects higher projected revenues from OLG and LCBO, based on 2016–17 year-to-date performances of these enterprises.
The change in Other Non-Tax Revenue largely reflects higher projected revenue from recoveries of prior-year expenditures based on 2015–16 results.
Medium-Term Expense Outlook
| Item | Current Outlook 2016–17 | Medium-Term Outlook 2017–18 |
Medium-Term Outlook 2018–19 |
|---|---|---|---|
| 2016 Budget Total Expense | 133.9 | 136.6 | 140.7 |
| Changes since the 2016 Budget - Pension Adjustment1 | 2.2 | 2.8 | 3.7 |
| Changes since the 2016 Budget - Other Net Program Expense Changes | 0.9 | 0.8 | 0.4 |
| Total Changes in Program Expense since the 2016 Budget | 3.1 | 3.5 | 4.1 |
| Interest on Debt | (0.4) | (0.8) | (0.7) |
| Total Changes in Expense since the 2016 Budget | 2.7 | 2.8 | 3.4 |
| 2016 Ontario Economic Outlook and Fiscal Review Total Expense | 136.6 | 139.4 | 144.1 |
Table 3.13 footnote:
[1] The outlook reflects the approach to forecasting pension expense including the Pension Adjustment. The comparative impact for 2015–16 was $1.5 billion, as reported in the Public Accounts of Ontario 2015–2016.
Note: Numbers may not add due to rounding.
Source: Ontario Ministry of Finance.
Program expense is projected to be $3.5 billion higher in 2017–18 and $4.1 billion higher in 2018–19 compared to 2016 Budget projections. The program expense outlook over the medium term is higher, mainly due to electricity cost relief for consumers and the impact of recently signed infrastructure agreements with the federal government. It also incorporates the impact of a change in forecasting pension expense each year to include the projected Pension Adjustment.
Interest on debt expense is projected to be $0.8 billion lower in 2017–18 and $0.7 billion lower in 2018–19 compared with the forecast laid out in the 2016 Budget, primarily as a result of lower-than-forecast interest rates and cost-effective debt management.
Total expense is projected to grow to $144.1 billion by 2018–19, above the forecast included in the 2016 Budget, as a result of higher program expense, partially offset by lower interest on debt.
Fiscal Prudence
As required by the Fiscal Transparency and Accountability Act, 2004, Ontario’s fiscal plan incorporates prudence in the form of a reserve to protect the fiscal outlook against unforeseen adverse changes in the Province’s revenue and expense. The current fiscal outlook includes a reserve of $0.4 billion in 2016–17, $0.7 billion in 2017–18 and $0.8 billion in 2018–19, reduced from the 2016 Budget to help mitigate the impact of the Pension Adjustment.
The current outlook also maintains contingency funds to help mitigate expense risks — particularly in cases where health and safety may be compromised, services to the most vulnerable are jeopardized, or in the event of natural disasters — that may otherwise negatively impact Ontario’s fiscal performance.
Details of Ontario’s Finances
The following tables and charts provide information on the Province’s historical financial performance, key fiscal indicators, and Ontario’s fiscal plan and outlook.
| Item | 2013–14 | 2014–15 | Actual 2015–16 |
Current Outlook 2016–17 |
|---|---|---|---|---|
| Taxation Revenue - Personal Income Tax | 26,929 | 29,313 | 31,141 | 33,202 |
| Taxation Revenue - Sales Tax1 | 20,481 | 21,689 | 23,455 | 23,844 |
| Taxation Revenue - Corporations Tax | 11,423 | 9,557 | 11,428 | 12,776 |
| Taxation Revenue - Education Property Tax2 | 5,457 | 5,561 | 5,839 | 5,914 |
| Taxation Revenue - Employer Health Tax | 5,283 | 5,415 | 5,649 | 5,896 |
| Taxation Revenue - Ontario Health Premium | 3,128 | 3,366 | 3,453 | 3,677 |
| Taxation Revenue - Gasoline Tax | 2,363 | 2,447 | 2,459 | 2,564 |
| Taxation Revenue - Land Transfer Tax | 1,614 | 1,778 | 2,118 | 2,365 |
| Taxation Revenue - Tobacco Tax | 1,110 | 1,163 | 1,226 | 1,243 |
| Taxation Revenue - Fuel Tax | 718 | 739 | 751 | 766 |
| Taxation Revenue - Beer and Wine Tax | 557 | 560 | 582 | 600 |
| Taxation Revenue - Electricity Payments In Lieu of Taxes | 543 | 180 | 3,247 | 515 |
| Taxation Revenue - Other Taxes | 360 | 507 | 470 | 485 |
| Total Taxation Revenue | 79,966 | 82,275 | 91,818 | 93,847 |
| Government of Canada - Canada Health Transfer | 11,940 | 12,408 | 13,089 | 13,893 |
| Government of Canada - Canada Social Transfer | 4,689 | 4,847 | 4,984 | 5,141 |
| Government of Canada - Equalization | 3,169 | 1,988 | 2,363 | 2,304 |
| Government of Canada - Infrastructure Programs | 123 | 137 | 146 | 742 |
| Government of Canada - Labour Market Programs | 909 | 896 | 927 | 1,187 |
| Government of Canada - Social Housing | 474 | 465 | 455 | 434 |
| Government of Canada - Wait Times Reduction Fund | 96 | – | – | – |
| Government of Canada - Other Federal Payments | 877 | 874 | 893 | 761 |
| Total Government of Canada | 22,277 | 21,615 | 22,857 | 24,462 |
| Government Business Enterprises - Ontario Lottery and Gaming Corporation | 2,009 | 1,995 | 2,234 | 2,118 |
| Government Business Enterprises - Liquor Control Board of Ontario | 1,723 | 1,831 | 1,956 | 2,045 |
| Government Business Enterprises - Ontario Power Generation Inc./Hydro One Ltd./ Brampton Distribution Holdco Inc. | 1,605 | 1,789 | 719 | 1,049 |
| Total Government Business Enterprises | 5,337 | 5,615 | 4,909 | 5,212 |
| Other Non-Tax Revenue - Reimbursements | 962 | 985 | 991 | 983 |
| Other Non-Tax Revenue - Vehicle and Driver Registration Fees | 1,248 | 1,433 | 1,565 | 1,751 |
| Other Non-Tax Revenue - Electricity Debt Retirement Charge | 954 | 956 | 859 | 625 |
| Other Non-Tax Revenue - Power Supply Contract Recoveries | 1,296 | 950 | 875 | 643 |
| Other Non-Tax Revenue - Sales and Rentals | 1,160 | 2,336 | 2,102 | 2,409 |
| Other Non-Tax Revenue - Cap-and-Trade Proceeds | – | – | – | 478 |
| Other Non-Tax Revenue - Other Fees and Licences | 759 | 693 | 964 | 987 |
| Other Non-Tax Revenue - Net Reduction of Power Purchase Contract Liability | 243 | 217 | 172 | 129 |
| Other Non-Tax Revenue - Royalties | 242 | 275 | 274 | 287 |
| Other Non-Tax Revenue - Miscellaneous Other Non-Tax Revenue3 | 1,467 | 1,196 | 991 | 907 |
| Total Other Non-Tax Revenue | 8,331 | 9,041 | 8,793 | 9,199 |
| Total Revenue | 115,911 | 118,546 | 128,377 | 132,720 |
Table 3.14 footnote:
[1] Sales Tax revenue is net of the Ontario Sales Tax Credit and the energy component of the Ontario Energy and Property Tax Credit.
[2] Education Property Tax revenue is net of the property tax credit component of the Ontario Energy and Property Tax Credit and the Ontario Senior Homeowners’ Property Tax Grant.
[3] Relatively high Miscellaneous Other Non-Tax Revenue in 2013–14 reflects the gain on the sale of the Province’s shares of General Motors Company and higher recoveries of prior-year expenditures.
Note: Numbers may not add due to rounding.
| Ministry Expense | 2013–14 | 2014–15 | Actual 2015–16 |
Current Outlook 2016–17 |
|---|---|---|---|---|
| Aboriginal Affairs1 | 63 | 67 | 74 | 79.9 |
| Agriculture, Food and Rural Affairs2 | 800 | 805 | 882 | 915.9 |
| Attorney General | 1,812 | 1,782 | 1,859 | 1,867.8 |
| Board of Internal Economy3 | 199 | 264 | 205 | 219.9 |
| Children and Youth Services | 3,973 | 4,112 | 4,242 | 4,448.8 |
| Citizenship, Immigration and International Trade | 152 | 157 | 169 | 176.8 |
| Community and Social Services 4 | 9,977 | 10,551 | 11,295 | 11,470.8 |
| Community Safety and Correctional Services5 | 2,380 | 2,524 | 2,567 | 2,648.5 |
| Economic Development, Employment and Infrastructure/ Research and Innovation6 | 992 | 1,076 | 1,134 | 1,176.4 |
| Education7 | 23,645 | 24,630 | 24,998 | 25,672.3 |
| Energy8 | 311 | 326 | 328 | 322.0 |
| Environment and Climate Change9 | 480 | 486 | 503 | 531.4 |
| Executive Offices10 | 30 | 43 | 36 | 44.9 |
| Finance11 | 907 | 951 | 1,045 | 968.6 |
| Francophone Affairs, Office of | 5 | 5 | 8 | 5.7 |
| Government and Consumer Services | 594 | 573 | 608 | 605.6 |
| Health and Long-Term Care12, 13 | 48,933 | 50,039 | 51,067 | 51,931.4 |
| Labour | 303 | 305 | 304 | 309.3 |
| Municipal Affairs and Housing14 | 845 | 889 | 922 | 900.0 |
| Natural Resources and Forestry15 | 720 | 714 | 724 | 750.1 |
| Northern Development and Mines | 719 | 804 | 701 | 790.7 |
| Tourism, Culture and Sport16 | 1,337 | 1,246 | 1,431 | 1,290.1 |
| Training, Colleges and Universities17 | 7,599 | 7,684 | 7,656 | 8,096.6 |
| Transportation18 | 2,823 | 2,944 | 3,287 | 3,849.6 |
| Treasury Board Secretariat19 | 222 | 227 | 215 | 347.7 |
| Interest on Debt20 | 10,572 | 10,635 | 10,967 | 11,375.0 |
| Other Expense21 | 5,972 | 5,022 | 6,177 | 6,648.3 |
| Year-End Savings22 | – | – | – | (800.0) |
| Total Expense | 126,364 | 128,861 | 133,406 | 136,644.1 |
Table 3.15 footnote:
[1], [2], [3], [4], [5], [6], [7], [8], [9], [10], [11], [12], [14], [15], [16], [18], [19], [21] Details on other ministry expense can be found in Table 3.16, Details of Other Expense.
[3] The 2014–15 amount includes expenses for the 2014 general election.
[13], [17] Years prior to 2015–16 reflect the Province’s historical application of public-sector accounting standards for net pension assets of pension plans. 2015–16 expense actuals reflect the accounting treatment adopted in the Public Accounts of Ontario 2015–2016 including the Pension Adjustment related to net pension assets. The outlook for 2016–17 also reflects this approach to forecasting pension expense.
[20] Interest on debt is net of interest capitalized during construction of tangible capital assets of $134 million in 2013–14, $202 million in 2014–15, $165 million in 2015–16 and $183 million in 2016–17.
[22] As in past years, the Year-End Savings provision reflects efficiencies through in-year expenditure management and underspending due to factors such as program management, and changes in project startups and implementation plans.
Notes: Numbers may not add due to rounding.
The impact of recently announced ministry restructuring will be reflected in future updates.
| Ministry Expense | 2013–14 | 2014–15 | Actual 2015–16 |
Current Outlook 2016–17 |
|---|---|---|---|---|
| Aboriginal Affairs - Green Investment Fund Initiatives | – | – | – | 5.0 |
| Aboriginal Affairs - One-Time Investments including Settlements | 12 | 3 | 5 | 0.4 |
| Agriculture, Food and Rural Affairs - Time-Limited Investments in Infrastructure | 132 | 36 | 47 | 116.4 |
| Agriculture, Food and Rural Affairs - Time-Limited Assistance | 17 | 7 | – | 3.1 |
| Community and Social Services - Time-Limited Investments in Affordable and Supportive Housing | – | – | – | 23.0 |
| Community Safety and Correctional Services - Time-Limited Support for 2015 Pan/Parapan American Games Security | 5 | 44 | 122 | – |
| Economic Development, Employment and Infrastructure/Research and Innovation - Green Investment Fund Initiatives | – | – | – | 99.0 |
| Economic Development, Employment and Infrastructure/Research and Innovation - Federal–Provincial Infrastructure Programs | – | – | – | 316.3 |
| Education - Teachers’ Pension Plan1 | 873 | 564 | 1,590 | 1,672.0 |
| Energy - Green Investment Fund Initiatives | – | – | – | 108.0 |
| Energy - Ontario Clean Energy Benefit | 1,006 | 1,078 | 860 | – |
| Energy - Strategic Asset Management and Transformation Related to Hydro One | – | – | 44 | 70.9 |
| Energy - 8% Provincial Rebate for Electricity Consumers | – | – | – | 300.0 |
| Environment and Climate Change - Green Investment Fund Initiatives | – | – | – | 1.0 |
| Executive Offices - Time-Limited Assistance | – | – | – | 1.0 |
| Finance - Ontario Municipal Partnership Fund | 569 | 542 | 513 | 505.0 |
| Finance - Power Supply Contract Costs | 1,296 | 920 | 875 | 643.1 |
| Health and Long-Term Care - Time-Limited Investments in Affordable and Supportive Housing | – | – | – | 4.7 |
| Municipal Affairs and Housing - Green Investment Fund Initiatives | – | – | – | 92.0 |
| Municipal Affairs and Housing - Time-Limited Investments in Municipal, Social and Affordable Housing | 155 | 153 | 165 | 543.6 |
| Municipal Affairs and Housing - Time-Limited Investments | 208 | 7 | 1 | 0.9 |
| Natural Resources and Forestry - Emergency Forest Firefighting | 92 | 78 | 95 | 134.8 |
| Tourism, Culture and Sport - Time-Limited Investments to Support 2015 Pan/Parapan American Games | 332 | 405 | 839 | 88.6 |
| Transportation - Green Investment Fund Initiatives | – | – | – | 20.0 |
| Treasury Board Secretariat - Capital Contingency Fund | – | – | – | 100.0 |
| Treasury Board Secretariat - Operating Contingency Fund | – | – | – | 552.4 |
| Treasury Board Secretariat - Employee and Pensioner Benefits2 | 1,275 | 1,186 | 1,021 | 1,247.0 |
| Total Other Expense | 5,972 | 5,022 | 6,177 | 6,648.3 |
Table 3.16 footnote:
[1], [2] Years prior to 2015–16 reflect the Province’s historical application of public-sector accounting standards for net pension assets of pension plans. 2015–16 expense actuals reflect the accounting treatment adopted in the Public Accounts of Ontario 2015–2016 including the Pension Adjustment related to net pension assets. The outlook for 2016–17 also reflects this approach to forecasting pension expense.
Notes: Numbers may not add due to rounding.
The impact of recently announced ministry restructuring will be reflected in future updates.
| Sector | Total Infrastructure Expenditures 2015–16 Actual1 |
2016–17 Current Outlook Investment in Capital Assets2 |
2016–17 Current Outlook Transfers and Other Infrastructure Expenditures3 |
2016–17 Current Outlook Total Infrastructure Expenditures4 |
|---|---|---|---|---|
| Transportation - Transit | 3,421 | 4,701 | 660 | 5,361 |
| Transportation - Provincial Highways | 2,372 | 2,108 | 43 | 2,150 |
| Transportation - Other Transportation, Property and Planning | 547 | 603 | 186 | 788 |
| Health - Hospitals | 3,045 | 2,621 | 263 | 2,884 |
| Health - Other Health | 181 | 60 | 248 | 308 |
| Education | 1,590 | 2,390 | 171 | 2,561 |
| Postsecondary - Colleges and Other | 400 | 704 | 13 | 716 |
| Postsecondary - Universities | 224 | – | 375 | 375 |
| Social | 267 | 12 | 801 | 814 |
| Justice | 150 | 58 | 197 | 255 |
| Other Sectors5 | 556 | 436 | 748 | 1,183 |
| Total Infrastructure Expenditures | 12,752 | 13,693 | 3,703 | 17,396 |
Table 3.17 footnote:
[1] Includes provincial investment in capital assets of $8.5 billion.
[2] Includes $183 million in interest capitalized during construction.
[3] Includes transfers to municipalities, universities and non-consolidated agencies.
[4] Includes third-party investments in hospitals, colleges and schools, and provisional federal contributions to provincial infrastructure investments.
[5] Includes government administration, natural resources, culture and tourism sectors.
Note: Numbers may not add due to rounding.
| Item | 2007–08 | 2008–09 | 2009–102 | 2010–11 | 2011–12 | 2012–13 | 2013–14 | 2014–15 | Actual 2015–16 |
Current Outlook 2016–17 |
|---|---|---|---|---|---|---|---|---|---|---|
| Revenue | 104,115 | 97,532 | 96,313 | 107,175 | 109,773 | 113,369 | 115,911 | 118,546 | 128,377 | 132,720 |
| Expense - Programs | 94,601 | 95,375 | 106,856 | 111,706 | 112,660 | 112,248 | 115,792 | 118,225 | 122,439 | 125,269 |
| Expense - Interest on Debt3 | 8,914 | 8,566 | 8,719 | 9,480 | 10,082 | 10,341 | 10,572 | 10,635 | 10,967 | 11,375 |
| Total Expense | 103,515 | 103,941 | 115,575 | 121,186 | 122,742 | 122,589 | 126,364 | 128,861 | 133,406 | 136,644 |
| Reserve | – | – | – | – | – | – | – | – | – | 400 |
| Surplus/(Deficit) | 600 | (6,409) | (19,262) | (14,011) | (12,969) | (9,220) | (10,453) | (10,314) | (5,029) | (4,324) |
| Net Debt4 | 156,616 | 169,585 | 193,589 | 214,511 | 235,582 | 252,088 | 267,190 | 284,576 | 305,233 | 317,947 |
| Accumulated Deficit | 105,617 | 113,238 | 130,957 | 144,573 | 158,410 | 167,132 | 176,634 | 187,511 | 202,697 | 207,020 |
| Gross Domestic Product (GDP) at Market Prices | 601,735 | 608,446 | 597,882 | 630,989 | 659,743 | 680,084 | 695,349 | 727,962 | 763,276 | 789,176 |
| Primary Household Income | 403,408 | 414,724 | 412,847 | 424,251 | 444,076 | 459,111 | 472,921 | 490,023 | 511,781 | 531,545 |
| Population — July (000s) | 12,764 | 12,883 | 12,998 | 13,135 | 13,264 | 13,414 | 13,556 | 13,685 | 13,797 | 13,983 |
| Net Debt per Capita (dollars) | 12,270 | 13,164 | 14,894 | 16,331 | 17,762 | 18,793 | 19,710 | 20,795 | 22,123 | 22,738 |
| Household Income per Capita (dollars) | 31,605 | 32,193 | 31,763 | 32,299 | 33,481 | 34,226 | 34,886 | 35,807 | 37,094 | 38,014 |
| Interest on Debt as a Per Cent of Revenue | 8.6 | 8.8 | 9.1 | 8.8 | 9.2 | 9.1 | 9.1 | 9.0 | 8.5 | 8.6 |
| Net Debt as a Per Cent of GDP | 26.0 | 27.9 | 32.4 | 34.0 | 35.7 | 37.1 | 38.4 | 39.1 | 40.0 | 40.3 |
| Accumulated Deficit as a Per Cent of GDP | 17.6 | 18.6 | 21.9 | 22.9 | 24.0 | 24.6 | 25.4 | 25.8 | 26.6 | 26.2 |
Table 3.18 footnote:
[1] Revenue and expense have been restated to reflect a fiscally neutral accounting change for the revised presentation of education property taxes, as described in the 2010 Ontario Budget; a fiscally neutral accounting change related to the reclassification of government agencies and organizations, as described in the 2011 Ontario Economic Outlook and Fiscal Review; and a fiscally neutral reclassification of a number of tax measures that are transfers or grants, as described in the 2012 Ontario Budget.
[2] Starting in 2009–10, investments in minor tangible capital assets owned by the Province were capitalized and amortized to expense. All capital assets owned by consolidated organizations are being accounted for in a similar manner.
[3] Interest on debt is net of interest capitalized during construction of tangible capital assets of $134 million in 2013–14, $202 million in 2014–15, $165 million in 2015–16 and $183 million in 2016–17.
[4] Starting in 2009–10, Net Debt includes the net debt of hospitals, school boards and colleges, consistent with Public Sector Accounting Board standards. For comparative purposes, Net Debt has been restated from 2007–08 to 2008–09 to conform with this revised presentation.
Note: Years prior to 2015–16 reflect the Province’s historical application of public-sector accounting standards for net pension assets of pension plans. 2015–16 expense actuals reflect the accounting treatment adopted in the Public Accounts of Ontario 2015–2016 including the Pension Adjustment related to net pension assets. The outlook for 2016–17 also reflects this approach to forecasting pension expense.
Sources: Statistics Canada and Ontario Ministry of Finance.
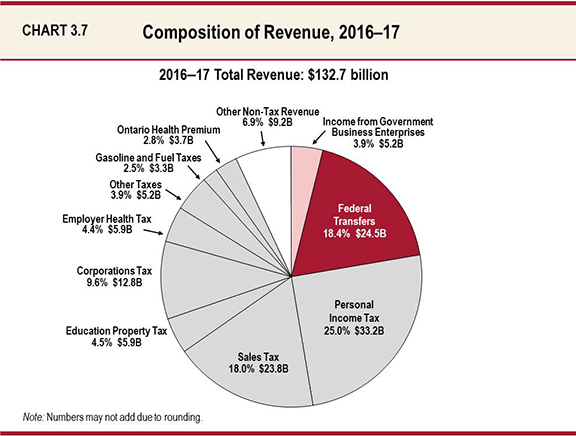
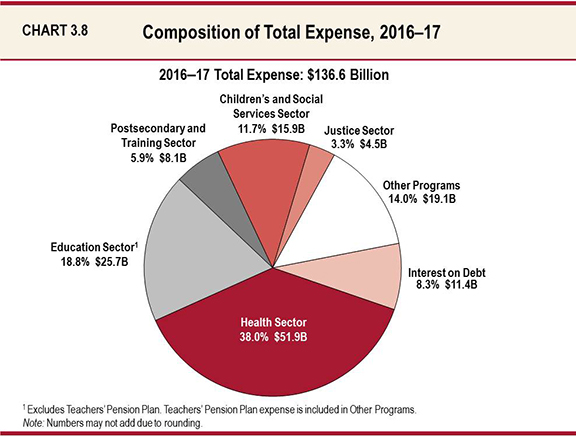
Chart Descriptions
Chart 3.7: Composition of Revenue, 2016–17
This pie chart shows the composition of Ontario’s revenue in 2016–17, which totals $132.7 billion. The largest taxation revenue source is Personal Income Tax revenue at $33.2 billion, accounting for 25.0 per cent of total revenue. This is followed by Sales Tax at $23.8 billion, or 18.0 per cent of total revenue, and Corporations Tax at $12.8 billion, or 9.6 per cent of total revenue. Total taxation revenue accounts for $93.8 billion, or 70.7 per cent of total revenue. The other major non-taxation sources of revenue are Federal Transfers of $24.5 billion, or 18.4 per cent of total revenue, Income from Government Business Enterprises at $5.2 billion, or 3.9 per cent of total revenue, and various Other Non-Tax Revenues at $9.2 billion, or 6.9 per cent of total revenue.
Chart 3.8: Composition of Total Expense, 2016–17
This pie chart shows the share of total expense and dollar amounts by sector in 2016–17. Total expense in 2016–17 is $136.6 billion.
The largest expense is the Health Sector at $51.9 billion, accounting for 38.0 per cent of total expense.
The remaining sectors of total expense include the Education Sector at $25.7 billion or 18.8 per cent; the Postsecondary and Training Sector at $8.1 billion or 5.9 per cent; the Children’s and Social Services Sector at $15.9 billion or 11.7 per cent; the Justice Sector at $4.5 billion or 3.3 percent; and Other Programs at $19.1 billion or 14.0 per cent. Interest on Debt, included as part of Total Expense, is $11.4 billion or 8.3 per cent.
Note that the Education Sector excludes the Teachers’ Pension Plan. Teachers’ Pension Plan expense is included in Other Programs.