On this page Skip this page navigation
- Introduction
- Long-Term Public Borrowing
- Ensuring Preferred Market Access
- Leading Canadian Dollar Green Bond Market
- Extending Term of Borrowing
- Interest on Debt Savings and Affordability
- Ensuring Adequate Liquidity Levels
- Reducing Net Debt-to-GDP
- Total Debt Composition
- Cost of Debt
- Limiting Risk Exposure
- Using Derivatives to Mitigate Risks
- Reducing Ontario’s Electricity Sector Stranded Debt
- Consolidated Financial Tables
Introduction
Ontario conducts its borrowing program with the objective of minimizing interest on debt costs over the long term. The government successfully completed its annual borrowing program of $33.9 billion in 2017‑18. This was up from the $26.4 billion forecast in the 2017 Budget, in spite of a lower funding requirement, because the Province capitalized on the strong demand for Ontario bonds to prefund $11.5 billion of its 2018–19 borrowing requirement.
Ontario’s net debt is projected to be $308.2 billion as of March 31, 2018; $3.7 billion lower than forecast in the 2017 Budget. Net debt was $301.6 billion as of March 31, 2017. Ontario’s net debt-to-GDP ratio peaked in 2014–15 at 39.3 per cent and is now forecast at 37.1 per cent in 2017–18. The net debt-to-GDP ratio is forecast to remain below the 2014–15 peak and resume a downward trend in 2022–23.
The Green Bond program is a part of Ontario’s borrowing program, and serves as an important tool to help Ontario finance transit and other environmentally friendly projects across the province. As the first Canadian province to issue Green Bonds, and based on the program’s success, Ontario remains committed to the Green Bond market and expects to continue to access it on an annual basis. The Province issued its fourth and largest Green Bond offering in January 2018.
Long-Term Public Borrowing
The Province’s surplus for 2017–18 is projected to be $0.6 billion, compared to the 2017 Budget forecast of a balanced budget. The Province’s total long-term borrowing in 2018–19 is forecast to be $31.7 billion, $0.5 billion less than what was estimated in the 2017 Budget. The total long-term borrowing for 2019–20 forecast at $36.7 billion is also lower than the projection in the 2017 Budget by $1.1 billion.
| Item | 2017–18 — 2017 Budget | 2017–18 — Interim | 2017–18 — In-Year Change | 2018–19 | 2019–20 | 2020–21 |
|---|---|---|---|---|---|---|
| Deficit/(Surplus) | – | (0.6) | (0.6) | 6.7 | 6.6 | 6.5 |
| Investment in Capital Assets | 13.1 | 10.7 | (2.4) | 14.2 | 15.7 | 15.8 |
| Non-Cash Adjustments | (6.7) | (5.9) | 0.8 | (7.1) | (7.1) | (7.6) |
| Loans to Infrastructure Ontario | 0.4 | 0.1 | (0.3) | 0.4 | 0.5 | 0.4 |
| Other Net Loans/Investments | (0.8) | (1.6) | (0.8) | 1.5 | 0.5 | 0.4 |
| Debt Maturities | 17.5 | 17.4 | (0.1) | 21.5 | 27.3 | 26.4 |
| Debt Redemptions | 0.1 | 0.1 | (0.0) | 0.1 | 0.1 | 0.1 |
| Total Funding Requirement | 23.7 | 20.2 | (3.5) | 37.3 | 43.6 | 41.9 |
| Canada Pension Plan Borrowing | – | – | – | (0.0) | (0.9) | (0.6) |
| Decrease/(Increase) in Short-Term Borrowing | – | – | – | – | – | – |
| Increase/(Decrease) in Cash and Cash Equivalents | 6.0 | 6.0 | – | 6.0 | (6.0) | – |
| Preborrowing from 2016–17 | (3.2) | (3.8) | (0.5) | – | – | – |
| Preborrowing in 2017–18 for 2018–19 | – | 11.5 | 11.5 | (11.5) | – | – |
| Total Long-Term Public Borrowing | 26.4 | 33.9 | 7.4 | 31.7 | 36.7 | 41.3 |
Table 3.28 Footnotes:
Note: Numbers may not add due to rounding.
The government will seek approval from the legislature for borrowing authority to meet the Province’s requirements and will propose amendments that, if passed, would streamline the administration of the Province’s borrowing program.
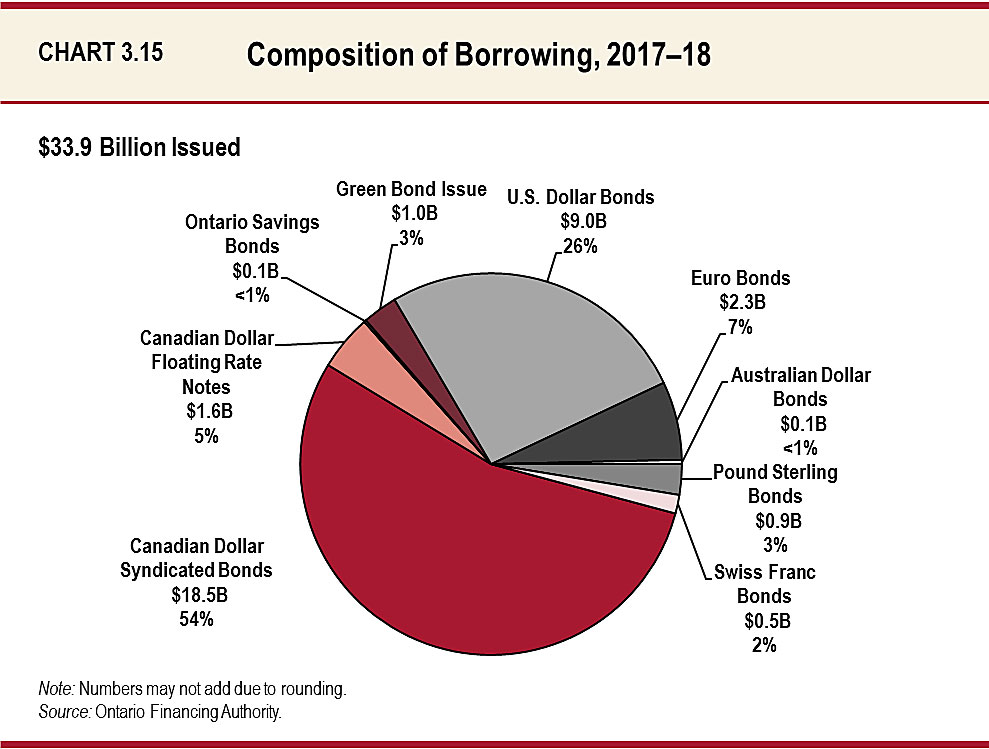
Approximately 62 per cent of 2017–18’s borrowing was completed in Canadian dollars, primarily through syndicated issues, but also included floating rate notes, Ontario Savings Bonds and a $1 billion Green Bond issue. While this percentage is lower than the 74 per cent of 2016–17’s borrowing in Canadian dollars, it remains roughly in line with the target announced in the 2017 Ontario Economic Outlook and Fiscal Review — to complete approximately two-thirds of the total borrowing in the Canadian dollar market.
About $12.8 billion, or 38 per cent, of borrowing was completed in foreign currencies. The U.S. dollar market remained an important source of funding for Ontario in 2017–18, with $9.0 billion issued in U.S. dollars. The remaining foreign currency borrowing was completed in euros, pound sterling, Swiss francs and Australian dollars.
Ensuring Preferred Market Access
The Province regularly accesses borrowing opportunities in currencies other than Canadian dollars to relieve pressure on the domestic bond market and diversify its investor base. This helps reduce Ontario’s overall borrowing costs and ensures that the Province will continue to have access to capital if domestic market conditions become more challenging.
Given the continued demand in the Canadian dollar market, the Province will maintain its Canadian dollar borrowing target of approximately two-thirds of total borrowing in 2018–19.
Leading Canadian Dollar Green Bond Market
Ontario is currently the largest issuer of Canadian dollar Green Bonds, with four Green Bond issues totalling $3.05 billion.
On January 25, 2018, the Province successfully launched its fourth Green Bond issue of $1 billion. This is not only the largest Green Bond offering from the Province of Ontario, but also the largest issue to be priced in the Canadian dollar Green Bond market.
Eligible projects selected to receive funding from Ontario’s latest Green Bond issue include seven projects with an emphasis on clean transportation, and energy efficiency and conservation categories.
The seven projects align with four of the United Nations Sustainable Development Goals (SDGs). Developed by the United Nations in 2015, SDGs are universal goals aimed at improving areas such as climate change, innovation and sustainable consumption, among other priorities.
As the first Canadian province to issue Green Bonds, Ontario will continue to develop the Canadian dollar Green Bond market with investor participation from around the world. Ontario’s Green Bonds capitalize on the Province’s ability to raise funds at low interest rates and serve as an important tool to help Ontario finance transit and other environmentally friendly projects across the province.
Extending Term of Borrowing
The global decline in interest rates over the past 25 years is already showing signs of modestly reversing. Maintaining a long average term of the Province’s debt portfolio ensures low interest rates remain locked in for a longer period. This reduces refinancing risks and helps offset the impact of expected higher interest rates on the Province’s future interest on debt (IOD) costs.
Since the beginning of fiscal year 2010–11, Ontario has issued $70.6 billion of bonds with terms of longer than 30 years to lock in low rates. As a result, the average term of Ontario’s debt portfolio has been extended, from 9.7 years in 2009–10 to 10.9 years, as of December 31, 2017.
Interest on Debt Savings and Affordability
Interest on debt expense is projected to be $11,965 million for 2017–18, which is $281 million lower than the forecast in the 2017 Budget. Interest on debt expense is forecast to be $12.5 billion in 2018–19 and $13.1 billion in 2019–20.
The 2017–18 savings continue a trend that has been in place since 2010 through a combination of lower deficits and borrowing requirements, and lower-than-forecast interest rates. Savings on IOD over the period to balance now total $24.4 billion relative to the 2010 Budget forecast.
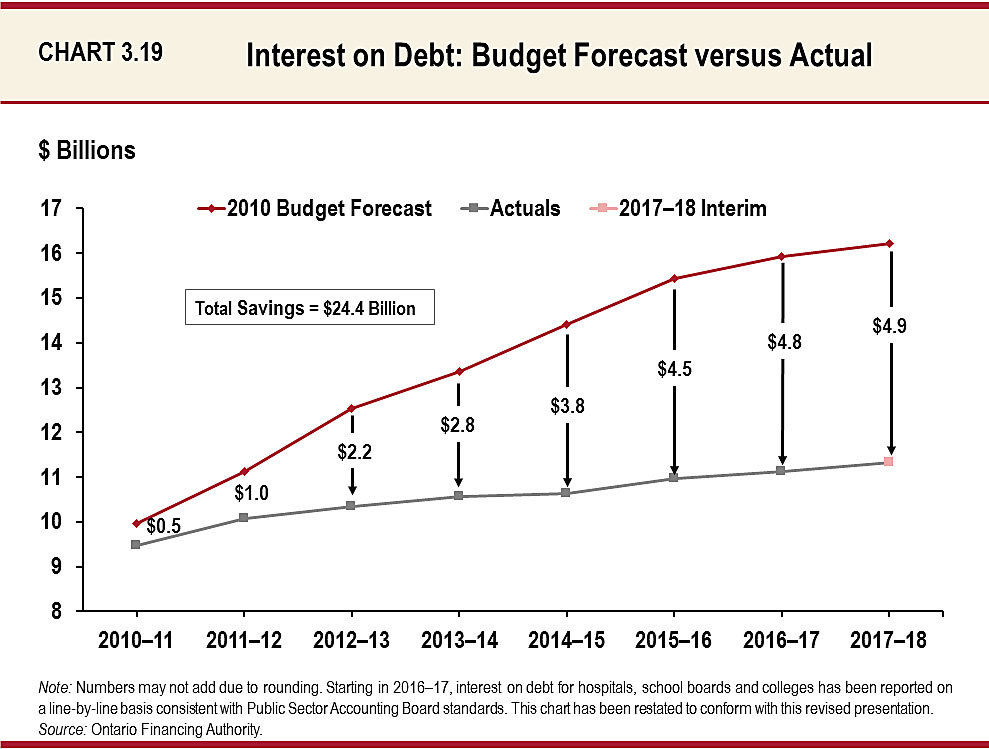
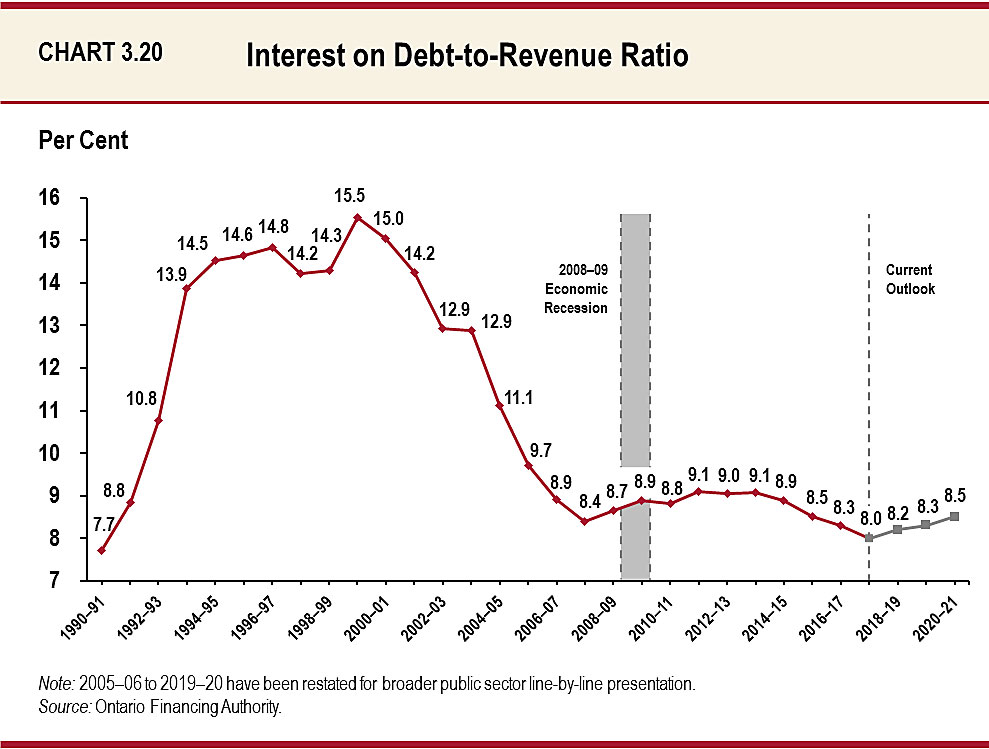
Chart 3.20 illustrates how the savings on IOD have lowered IOD-to-revenue, a key measure of the affordability of debt. The 2010 Budget forecasted that, by 2017–18, the Province would need to spend 11.3 cents of every revenue dollar received on interest. The current forecast is 3.3 cents lower, at 8 cents of interest costs for every dollar of revenue. This ratio is lower than it has been for the past 25 years, and is forecast to remain in this range through the medium-term outlook period to 2020–21, even after taking into consideration an IOD forecast that includes higher rates and a return to deficit.
Ensuring Adequate Liquidity Levels
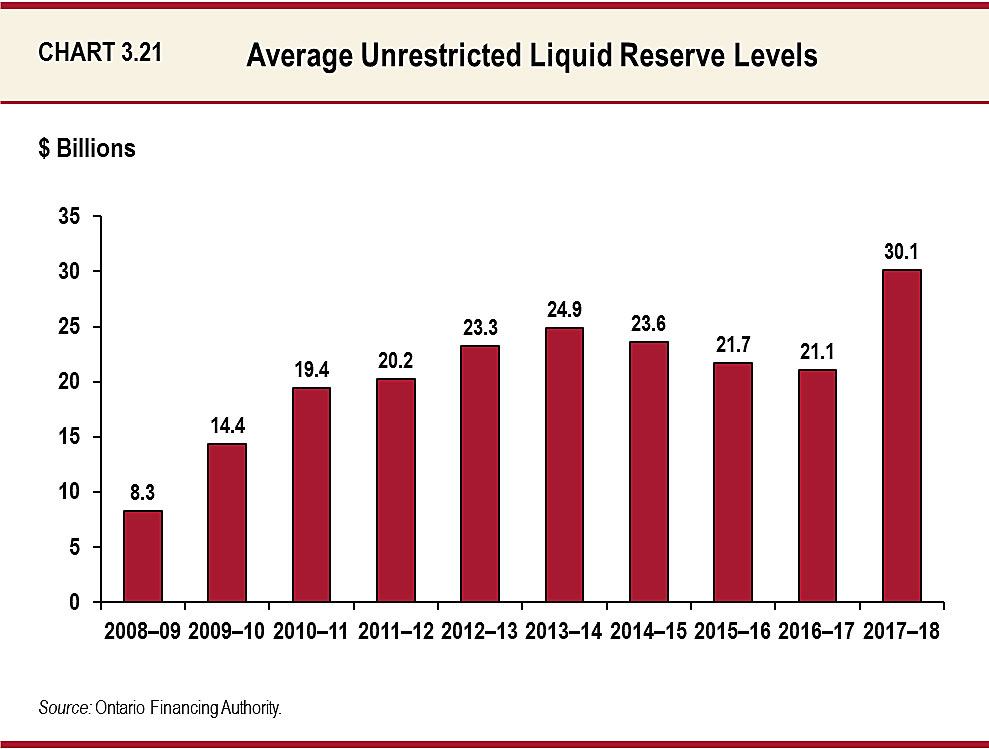
Ontario actively manages its financial obligations through the maintenance of a liquid reserve portfolio and the use of short-term borrowing. The Province increased its level of unrestricted liquid reserves following the financial crisis in 2008–09. Coming out of the financial crisis, the Province began a strategy of creating large, liquid 10- and 30-year benchmark domestic bond issues in 2009–10 in response to investor demand. This strategy has been very successful and continues to lower Ontario’s borrowing costs while enhancing the Province’s access to capital. However, as a result of these large bond issues, the Province will have large cash outflows on single days commencing in 2019–20, rather than having maturities spread more evenly throughout the year. In anticipation of the need for cash reserves to meet these requirements for large outflows on a single day, the Province began building larger cash reserves in 2017–18, as noted in Chart 3.21.
The Province’s short-term borrowing program in the Canadian and U.S. dollar money markets is relatively small, accounting for only 6.2 per cent of Ontario’s debt. The unused short-term borrowing capacity that this leaves, combined with the high levels of unrestricted liquid reserves, ensures the Province will always have adequate liquidity to meet its financial obligations.
Reducing Net Debt-to-GDP
Ontario’s net debt is the difference between total liabilities and total financial assets. It is projected to be $308.2 billion as of March 31, 2018, down from the net debt projection of $311.9 billion in the 2017 Budget.
Accumulated deficit is projected to be $192.4 billion as of March 31, 2018, compared to a projection of $193.5 billion in the 2017 Budget. The projected difference of $115.8 billion between net debt and accumulated deficit is due to the Province’s high level of investment in infrastructure.
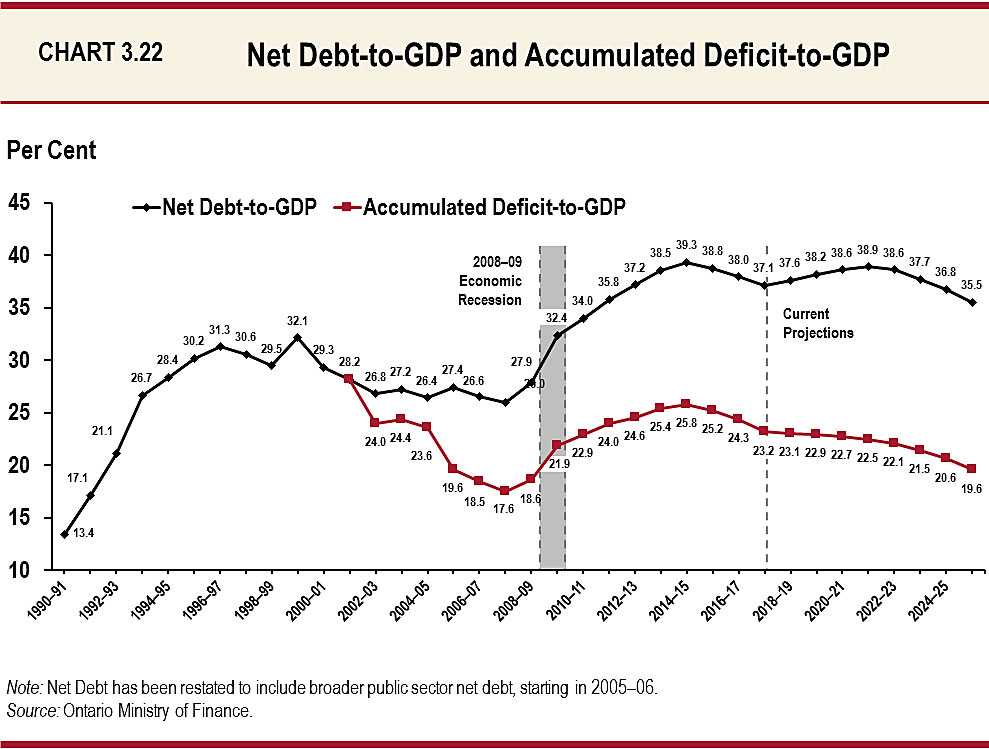
Ontario’s net debt-to-GDP ratio peaked in 2014–15 at 39.3 per cent and is now forecast at 37.1 per cent in 2017–18, below the forecast of 37.5 per cent for 2017–18 contained in the 2017 Budget. The net debt-to-GDP ratio is forecast to remain below the 2014–15 peak and resume a downward trend in 2022–23.
Total Debt Composition
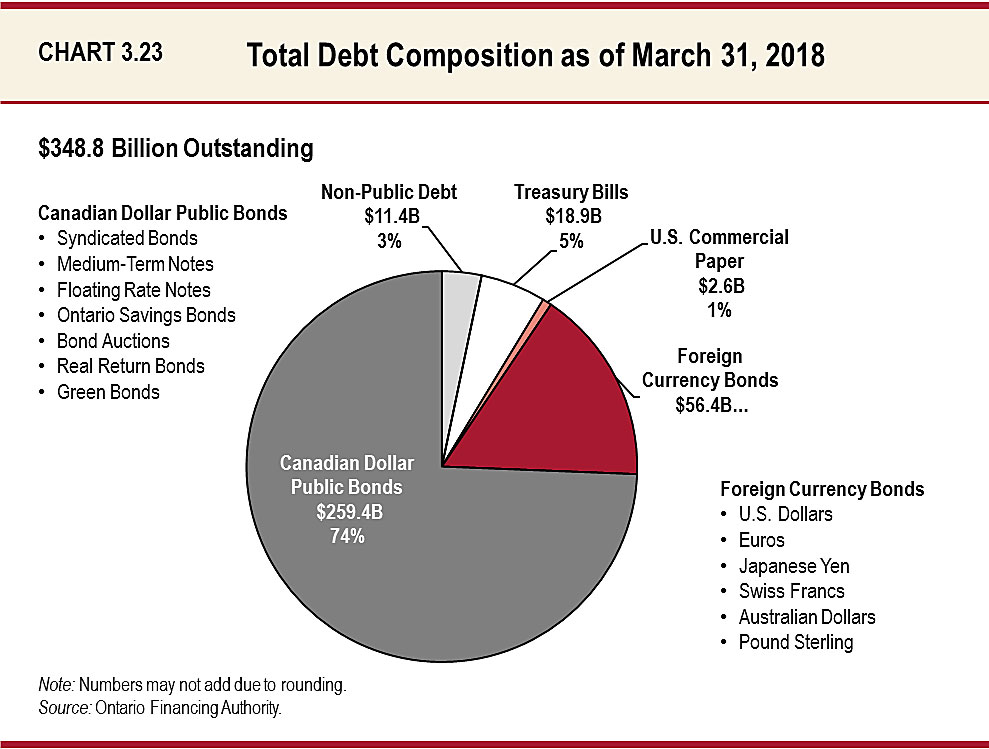
Total debt consists of bonds issued in the public capital markets, non-public debt, treasury bills and U.S. commercial paper. Total debt, which represents all borrowing without offsetting financial assets, is projected to be $348.8 billion as of March 31, 2018.
Public debt, as of March 31, 2018, is projected to be $337.4 billion, primarily consisting of bonds issued in the domestic and international public markets in seven currencies. Ontario also has $11.4 billion outstanding in non-public debt issued in Canadian dollars. Non-public debt consists of debt instruments issued mainly to the Canada Pension Plan Investment Board. This debt is not marketable and cannot be traded.
Canadian dollar denominated debt represents 83 per cent of the total debt projected as of March 31, 2018.
Cost of Debt
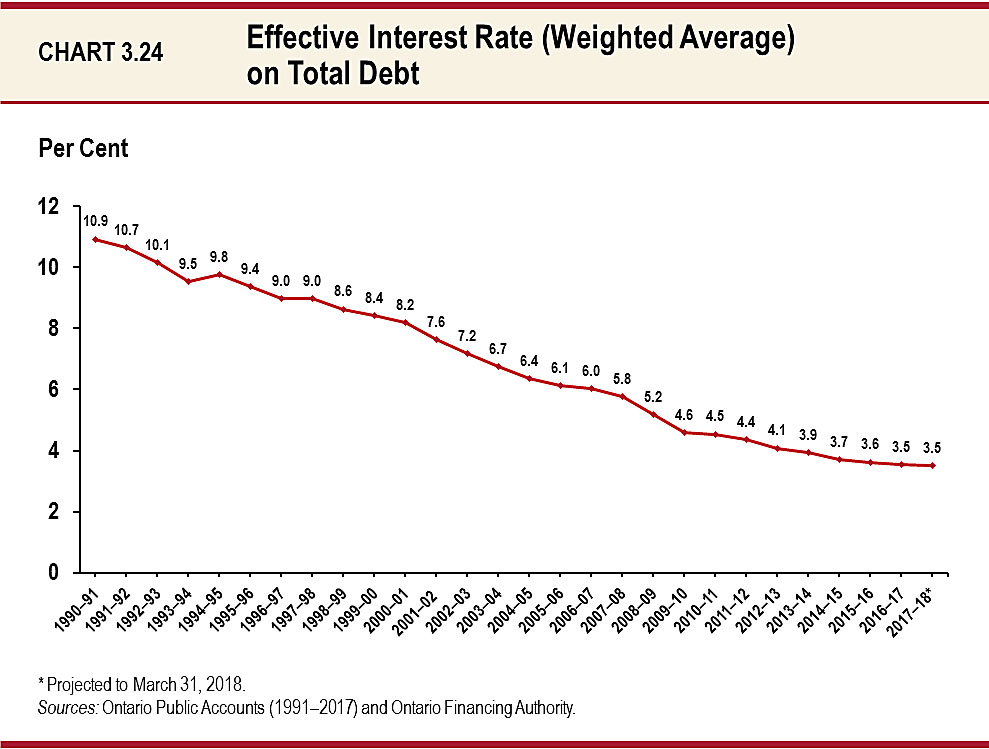
The interest rate that Ontario pays on its debt has declined steadily since 1990–91, when the effective interest rate (on a weighted-average basis) on total debt was 10.9 per cent. As of March 31, 2018, it is forecast to be 3.5 per cent, unchanged from March 31, 2017.
For 2018–19, the impact of a one percentage point change in interest rates on IOD would be approximately $300 million for the Province.
Limiting Risk Exposure
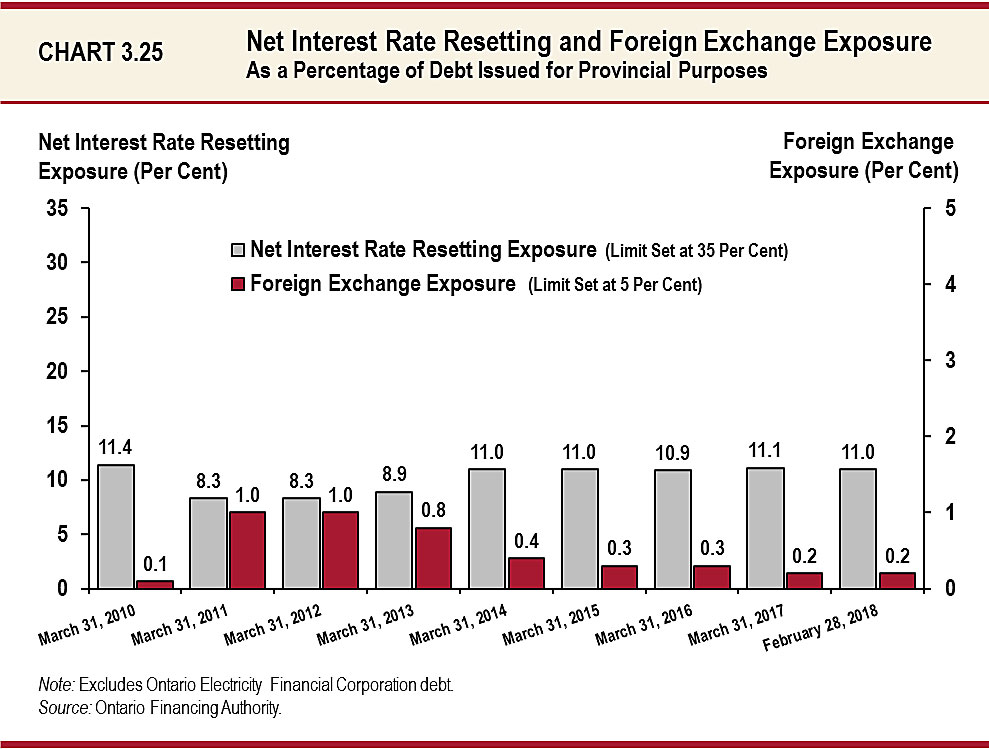
Ontario limits itself to a maximum net interest rate resetting exposure of 35 per cent and a maximum foreign exchange exposure of five per cent of debt issued for provincial purposes. As of February 28, 2018, the values for net interest rate resetting exposure and foreign exchange exposure were, respectively, 11.0 per cent and 0.2 per cent. All exposures remained well below policy limits in 2017–18.
Using Derivatives to Mitigate Risks
To seek the most cost-effective means of meeting its borrowing requirements, Ontario issues fixed and floating rate debt in both domestic and international markets. To mitigate the risk arising from foreign exchange and interest rate movements, the Province uses derivatives, a type of financial contract, to limit its exposure to both of these variables. Foreign currency swaps and forwards are used to convert foreign currency exposure into Canadian dollar exposure, while interest rate swaps ensure interest payments on the Province’s floating rate debt remain constant.
| Item | Total | Interest Rate Swaps | Cross-Currency Swaps | Forward Foreign Exchange Contracts |
|---|---|---|---|---|
| 2016–17 | 156.6 |
85.2 |
40.8 |
30.6 |
| Interim 2017–18 | 158.5 | 82.5 | 44.2 | 31.8 |
Table 3.29 Footnotes:
[1] Notional amounts represent the volume of outstanding derivative contracts and are not indicative of credit risk, market risk or actual cash flows.
Note: Numbers may not add due to rounding.
Source: Ontario Financing Authority.
Reducing Ontario’s Electricity Sector Stranded Debt
Ontario Electricity Financial Corporation (OEFC) interim results for 2017–18 show an estimated excess of revenue over expense of $1.9 billion, which would reduce OEFC’s unfunded liability (or “stranded debt of the electricity sector”) from $3.2 billion, as of March 31, 2017, to $1.3 billion, as of March 31, 2018. This would be the 14th consecutive year of stranded debt reduction.
Projected 2018–19 OEFC results are an excess of revenue over expense of about $0.3 billion.
Through prudent management of electricity sector debt and other obligations, the government has removed the debt retirement charge (DRC) cost from residential electricity users’ electricity bills beginning January 1, 2016. As announced in the 2015 Ontario Economic Outlook and Fiscal Review, the government is ending the DRC beginning April 1, 2018, for industrial, business and other electricity users, such as institutions and not-for-profits.
Even after the end of the DRC, the OEFC is expected to continue to service and pay down its debt and other liabilities from OEFC’s other dedicated revenues, such as payments-in-lieu of taxes and the Gross Revenue Charge.
Consolidated Financial Tables
| Debt1 | 2013–14 | 2014–15 | 2015–16 | 2016–17 | Interim 2017–18 | Plan 2018–19 |
|---|---|---|---|---|---|---|
| Publicly Held Debt — Bonds2 | 259,933 | 280,442 | 293,935 | 299,356 | 315,307 | 325,706 |
| Publicly Held Debt — Treasury Bills | 12,297 | 14,631 | 14,604 | 16,120 | 18,870 | 18,870 |
| Publicly Held Debt — U.S. Commercial Paper3 | 8,657 | 6,304 | 6,304 | 5,369 | 2,619 | 2,619 |
| Publicly Held Debt — Infrastructure Ontario (IO)4 | 1,603 | 950 | 300 | 300 | 300 | 300 |
| Publicly Held Debt — Other | 345 | 317 | 301 | 296 | 279 | 268 |
| Publicly Held Debt — Total | 282,835 | 302,644 | 315,444 | 321,441 | 337,375 | 347,763 |
| Non-Public Debt | 12,923 | 12,316 | 11,969 | 11,661 | 11,413 | 11,074 |
| Total Debt | 295,758 | 314,960 | 327,413 | 333,102 | 348,788 | 358,837 |
| Cash and Temporary Investments Excluding Broader Public Sector (BPS) | (24,303) | (24,946) | (25,765) | (23,422) | (32,018) | (26,534) |
| Total Debt Net of Cash and Temporary Investments | 271,455 | 290,014 | 301,648 | 309,680 | 316,770 | 332,303 |
| Other Net (Assets)/Liabilities5 | (18,061) | (19,507) | (21,400) | (22,044) | (21,845) | (20,504) |
| BPS Net Debt | 14,574 | 14,896 | 15,124 | 14,012 | 13,278 | 13,242 |
| Net Debt | 267,968 | 285,403 | 295,372 | 301,648 | 308,203 | 325,041 |
| Non-Financial Assets6 | (91,334) | (97,892) | (103,343) | (108,138) | (115,754) | (125,888) |
| Accumulated Deficit | 176,634 | 187,511 | 192,029 | 193,510 | 192,449 | 199,153 |
Table 3.30 Footnotes:
[1] Includes debt issued by the Province and Government Organizations.
[2], [3] All balances are expressed in Canadian dollars. The balances above reflect the effect of related derivative contracts.
[4] Infrastructure Ontario’s (IO) interim 2017–18 debt is composed of Infrastructure Renewal Bonds ($300 million). IO’s debt is not guaranteed by the Province.
[5] Other Net (Assets)/Liabilities include accounts receivable, loans receivable, advances and investments in Government Business Enterprises, accounts payable, accrued liabilities, deferred revenue and capital contributions, pensions and other employee future benefits, and other liabilities.
[6] Non-financial assets include the tangible capital assets of the Province and broader public sector.
Source: Ontario Ministry of Finance.
| Item | 2019–20 | 2020–21 |
|---|---|---|
| Total Debt | 369.0 | 384.4 |
| Cash and Temporary Investments | (20.5) | (20.5) |
| Total Debt Net of Cash and Temporary Investments | 348.5 | 363.9 |
| Other Net (Assets)/Liabilities | (18.3) | (15.0) |
| Broader Public Sector Net Debt | 12.6 | 11.2 |
| Net Debt | 342.8 | 360.1 |
| Non-Financial Assets | (137.0) | (147.9) |
| Accumulated Deficit | 205.8 | 212.3 |
Table 3.31 Footnotes:
Note: Numbers may not add due to rounding.
Chart Descriptions
Chart 3.15: Composition of Borrowing, 2017–18
In 2017–18, the Province successfully completed its borrowing program of $33.9 billion. This consisted of $18.5 billion (54 per cent) of Canadian dollar syndicated bonds, $1.6 billion (5 per cent) of Canadian Dollar Floating Rate Notes, a $1.0 billion (3 per cent) Canadian dollar Green Bond, $0.1 billion (<1 per cent) of Ontario Savings Bonds, $9.0 billion (26 per cent) of U.S. dollar bonds, $2.3 billion (7 per cent) of euro bonds, $0.1 billion (<1 per cent) of Australian dollar bonds, $0.9 billion (3 per cent) of pound sterling bonds, and $0.5 billion (2 per cent) of Swiss franc bonds.
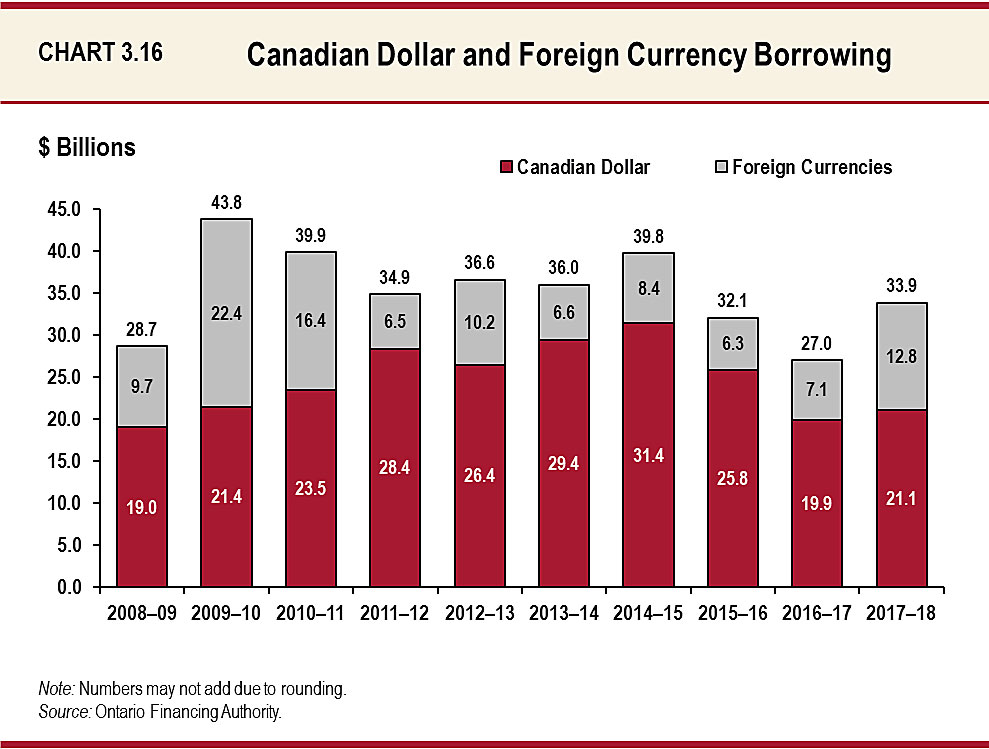
Chart 3.16: Canadian Dollar and Foreign Currency Borrowing
In 2017–18, the Province’s borrowing program totalled $33.9 billion. $21.1 billion was borrowed in the Canadian dollar market and $12.8 billion was borrowed in foreign currencies.
| Year | Canadian Dollar ($ Billions) |
Foreign Currencies ($ Billions) | Total ($ Billions) |
|---|---|---|---|
| 2008–09 | 19 | 9.7 | 28.7 |
| 2009–10 | 21.4 | 22.4 | 43.8 |
| 2010–11 | 23.5 | 16.4 | 39.9 |
| 2011–12 | 28.4 | 6.5 | 34.9 |
| 2012–13 | 26.4 | 10.2 | 36.6 |
| 2013–14 | 29.4 | 6.6 | 36 |
| 2014–15 | 31.4 | 8.4 | 39.8 |
| 2015–16 | 25.8 | 6.3 | 32.1 |
| 2016–17 | 19.9 | 7.1 | 27 |
| 2017–18 | 21.1 | 12.8 | 33.9 |
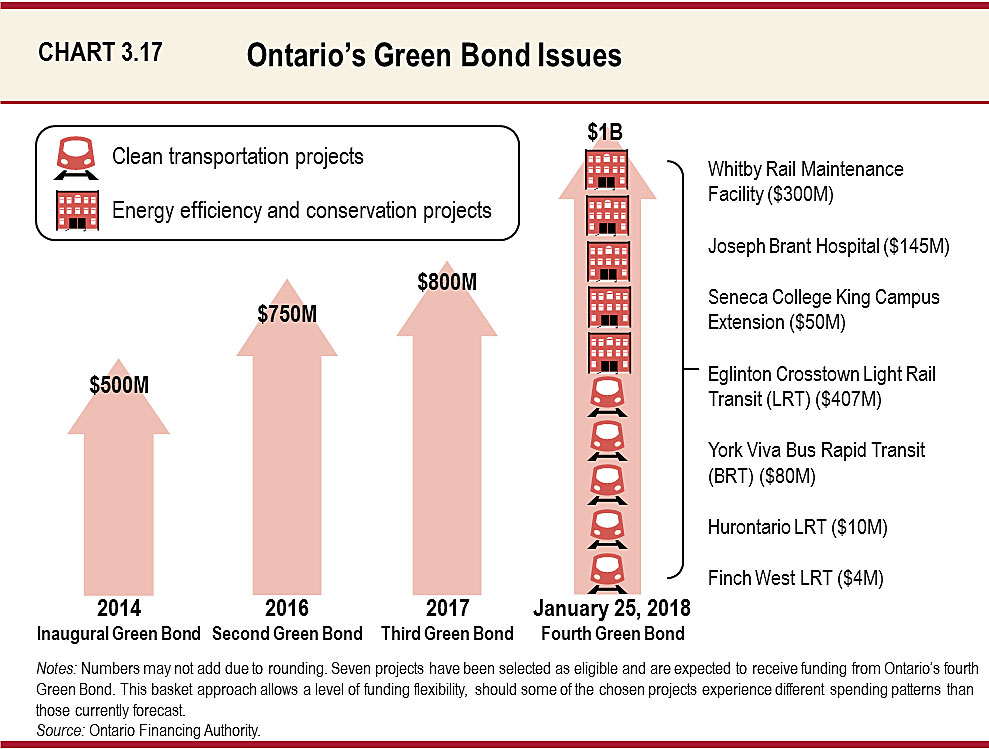
Chart 3.17: Ontario’s Green Bond Issues
Ontario is currently the largest issuer of Canadian dollar Green Bonds, with four outstanding green issues totaling $3.05 billion. In 2014, Ontario successfully launched a Green Bond program, with an inaugural global Canadian dollar Green Bond of $500 million. This was followed by a global Canadian dollar Green Bond of $750 million in 2016 and an $800 million Canadian dollar Green Bond in 2017. On January 25, 2018, the Province successfully launched its fourth Green Bond issue of $1.0 billion. This is the largest Green Bond offering from the Province of Ontario to date. Eligible projects selected to receive funding from the fourth Green Bond issue includes seven projects with an emphasis on clean transportation, and energy efficiency and conservation categories.
Clean Transportation Projects
- Eglinton Crosstown Light Rail Transit (LRT) ($407M)
- York Viva Bus Rapid Transit (BRT) ($80M)
- Hurontario LRT ($10M)
- Finch West LRT ($4M)
Energy Efficiency and Conservation Projects
- Whitby Rail Maintenance Facility ($300M)
- Joseph Brant Hospital ($145M)
- Seneca College King Campus Extension ($50M)
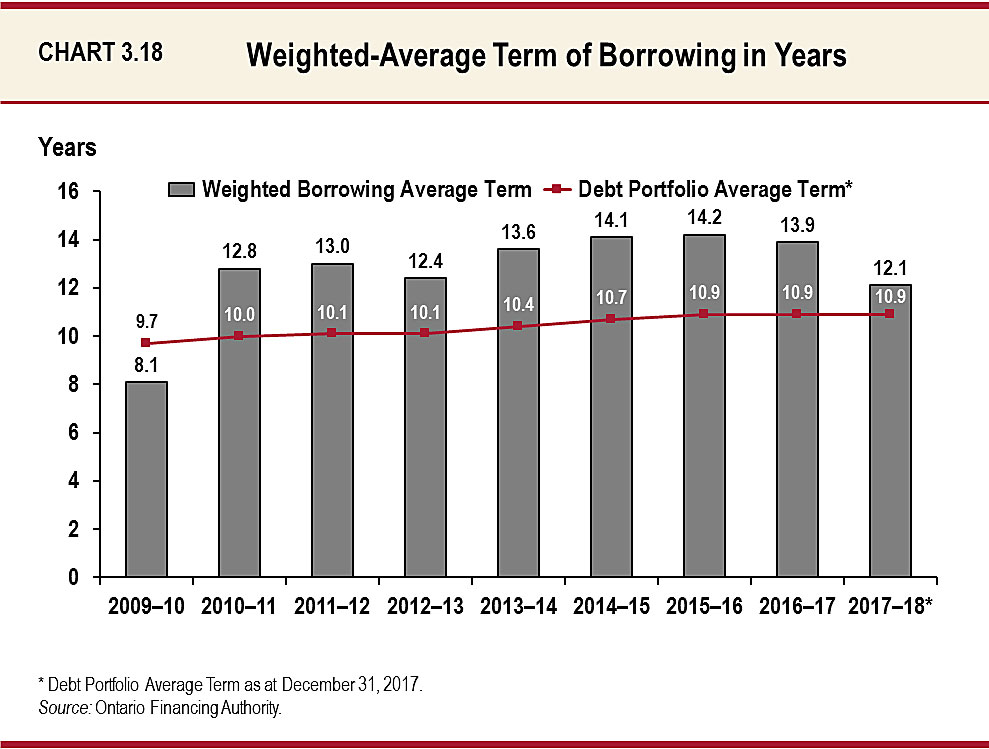
Chart 3.18: Weighted-Average Term of Borrowing in Years
The average term of Ontario’s debt portfolio has been extended from 9.7 years in 2009–10 to 10.9 years as of December 31, 2017. The weighted-average term of borrowing for 2017–18 was 12.1 years. The average term to maturity of new long-term Provincial borrowing has been extended significantly from 8.1 years in 2009–10.
| Year | 2009–10 | 2010–11 | 2011–12 | 2012–13 | 2013–14 | 2014–15 | 2015–16 | 2016–17 | 2017–18 |
|---|---|---|---|---|---|---|---|---|---|
| Weighted-Average Term (years) | 8.1 | 12.8 | 13 | 12.4 | 13.6 | 14.1 | 14.2 | 13.9 | 12.1 |
| Debt Portfolio Average Term (years) | 9.7 | 10 | 10.1 | 10.1 | 10.4 | 10.7 | 10.9 | 10.9 | 10.9 |
Chart 3.19: Interest on Debt: Budget Forecast versus Actual
Interest on debt expense in 2017–18 is now forecast to be $4.9 billion lower than the forecast contained in the 2010 Budget. Interest on debt savings over the period to balance now total $24.4 billion relative to the 2010 Budget forecast.
| Year | 2010–11 | 2011–12 | 2012–13 | 2013–14 | 2014–15 | 2015–16 | 2016–17 | 2017–18 | Savings ($ Billions) | 0.5 | 1 | 2.2 | 2.8 | 3.8 | 4.5 | 4.8 | 4.9 |
|---|
Chart 3.20: Interest on Debt-to-Revenue Ratio
Interest on debt-to-revenue is forecast to be 8.0 per cent for 2017–18. This ratio is lower than it was in the 1990s and is forecast to remain lower through the outlook period in 2020–21.
| Year | Actuals (%) |
|---|---|
| 1990–91 | 7.7 |
| 1991–92 | 8.8 |
| 1992–93 | 10.8 |
| 1993–94 | 13.9 |
| 1994–95 | 14.5 |
| 1995–96 | 14.6 |
| 1996–97 | 14.8 |
| 1997–98 | 14.2 |
| 1998–99 | 14.3 |
| 1999–00 | 15.5 |
| 2000–01 | 15 |
| 2001–02 | 14.2 |
| 2002–03 | 12.9 |
| 2003–04 | 12.9 |
| 2004–05 | 11.1 |
| 2005–06 | 9.7 |
| 2006–07 | 8.9 |
| 2007–08 | 8.4 |
| 2008–09 | 8.7 |
| 2009–10 | 8.9 |
| 2010–11 | 8.8 |
| 2011–12 | 9.1 |
| 2012–13 | 9 |
| 2013–14 | 9.1 |
| 2014–15 | 8.9 |
| 2015–16 | 8.5 |
| 2016–17 | 8.3 |
| 2017–18 | 8 |
| 2018–19 | 8.2 |
| 2019–20 | 8.3 |
| 2020–21 | 8.5 |
Chart 3.21: Average Unrestricted Liquid Reserve Levels
The average unrestricted liquid reserve for 2017–18 was $30.1 billion.
| Year | 2008–09 | 2009–10 | 2010–11 | 2011–12 | 2012–13 | 2013–14 | 2014–15 | 2015–16 | 2016–17 | 2017–18 | $ Billions | 8.3 | 14.4 | 19.4 | 20.2 | 23.3 | 24.9 | 23.6 | 21.7 | 21.1 | 30.1 |
|---|
Chart 3.22: Net Debt-to-GDP and Accumulated Deficit-to-GDP
Ontario’s net debt-to-GDP ratio is forecast at 37.1 per cent in 2017–18, 37.6 per cent in 2018–19, 38.2 per cent in 2019–20 and 38.6 per cent in 2020–21.
| Year | Net Debt-to-GDP (%) | Accumulated Deficit-to-GDP (%) |
|---|---|---|
| 1990–91 | 13.4 | 13.4 |
| 1991–92 | 17.1 | 17.1 |
| 1992–93 | 21.1 | 21.1 |
| 1993–94 | 26.7 | 26.7 |
| 1994–95 | 28.4 | 28.4 |
| 1995–96 | 30.2 | 30.2 |
| 1996–97 | 31.3 | 31.3 |
| 1997–98 | 30.6 | 30.6 |
| 1998–99 | 29.5 | 29.5 |
| 1999–00 | 32.1 | 32.1 |
| 2000–01 | 29.3 | 29.3 |
| 2001–02 | 28.2 | 28.2 |
| 2002–03 | 26.8 | 24 |
| 2003–04 | 27.2 | 24.4 |
| 2004–05 | 26.4 | 23.6 |
| 2005–06 | 27.4 | 19.6 |
| 2006–07 | 26.6 | 18.5 |
| 2007–08 | 26 | 17.6 |
| 2008–09 | 27.9 | 18.6 |
| 2009–10 | 32.4 | 21.9 |
| 2010–11 | 34 | 22.9 |
| 2011–12 | 35.8 | 24 |
| 2012–13 | 37.2 | 24.6 |
| 2013–14 | 38.5 | 25.4 |
| 2014–15 | 39.3 | 25.8 |
| 2015–16 | 38.8 | 25.2 |
| 2016–17 | 38 | 24.3 |
| 2017–18 | 37.1 | 23.2 |
| 2018–19 | 37.6 | 23.1 |
| 2019–20 | 38.2 | 22.9 |
| 2020–21 | 38.6 | 22.7 |
| 2021–22 | 38.9 | 22.5 |
| 2022–23 | 38.6 | 22.1 |
| 2023–24 | 37.7 | 21.5 |
| 2024–25 | 36.8 | 20.6 |
| 2025–26 | 35.5 | 19.6 |
Chart 3.23: Total Debt Composition as of March 31, 2018
As of March 31, 2018, the Province’s total debt is projected to be $348.8 billion, and consists of $259.4 billion (74 per cent) of Canadian dollar public bonds (syndicated bonds, medium-term notes, floating rate notes, Ontario Savings Bonds, bond auctions, real return bonds, and Green Bonds), $11.4 billion (3 per cent) of Canadian dollar non-public debt, $18.9 (5 per cent) billion of treasury bills, $2.6 billion (1 per cent) of U.S. dollar commercial paper, and $56.4 billion (16 per cent) of foreign currency bonds (U.S. dollars, euros, Japanese yen, Swiss francs, pound sterling, and Australian dollars).
Chart 3.24: Effective Interest Rate (Weighted Average) on Total Debt
As of March 31, 2018, the effective interest rate (calculated as a weighted average) is forecast to be 3.5 per cent on the Province’s total debt, unchanged from the 3.5 per cent in 2016–17. The effective interest rate has been steadily decreasing from 10.9 per cent in 1990–91.
| Year | Effective Interest Rate (%) |
|---|---|
| 1990–91 | 10.9 |
| 1991–92 | 10.7 |
| 1992–93 | 10.1 |
| 1993–94 | 9.5 |
| 1994–95 | 9.8 |
| 1995–96 | 9.4 |
| 1996–97 | 9 |
| 1997–98 | 9 |
| 1998–99 | 8.6 |
| 1999–00 | 8.4 |
| 2000–01 | 8.2 |
| 2001–02 | 7.6 |
| 2002–03 | 7.2 |
| 2003–04 | 6.7 |
| 2004–05 | 6.4 |
| 2005–06 | 6.1 |
| 2006–07 | 6 |
| 2007–08 | 5.8 |
| 2008–09 | 5.2 |
| 2009–10 | 4.6 |
| 2010–11 | 4.5 |
| 2011–12 | 4.4 |
| 2012–13 | 4.1 |
| 2013–14 | 3.9 |
| 2014–15 | 3.7 |
| 2015–16 | 3.6 |
| 2016–17 | 3.5 |
| 2017–18 | 3.5 |
Chart 3.25: Net Interest Rate Resetting and Foreign Exchange Exposure
The Province’s interim net interest rate resetting exposure, calculated as a percentage of the debt issued for Provincial purposes, was 11.0 per cent on February 28, 2018. This compares to the 11.1 per cent as of March 31, 2017 and 10.9 per cent as of March 31, 2016. The net interest rate exposure limit is set at 35 per cent. The Province’s interim foreign exchange exposure, calculated as a percentage of the debt issued for Provincial purposes, was 0.2 per cent as of February 28, 2018. This is remains unchanged from as of March 31, 2017 and lower than the 0.3 per cent as of March 31, 2016. The foreign exchange exposure limit is set at five per cent.
| March 31, 2010 | March 31, 2011 | March 31, 2012 | March 31, 2013 | March 31, 2014 | March 31, 2015 | March 31, 2016 | March 31, 2017 | February 28, 2018 | |
|---|---|---|---|---|---|---|---|---|---|
| Foreign Exchange Exposure (%) | 0.1 | 1 | 1 | 0.8 | 0.4 | 0.3 | 0.3 | 0.2 | 0.2 |
| Net Interest Rate Resetting Exposure (%) | 11.4 | 8.3 | 8.3 | 8.9 | 11 | 11 | 10.9 | 11.1 | 11 |