Ontario’s Fiscal Outlook
The government is projecting a return to balance in 2017–18, and continued balance in 2018–19 and 2019–20. Consistent with this, Ontario’s net debt-to-GDP ratio is projected to continue to decline to 37.2 per cent in 2019–20. The government is setting an interim net debt-to-GDP ratio target of 35 per cent by 2023–24 and continues to maintain a target of reducing the net debt-to-GDP ratio to its pre-recession level of 27 per cent, currently projected to be achieved by 2029–30.
For 2016–17, the government is projecting a deficit of $1.5 billion, an improvement of $2.8 billion compared to the 2016 Budget. It is also a $2.0 billion improvement compared with the 2015–16 deficit of $3.5 billion.1 In addition, since peaking in 2014–15, Ontario’s net debt-to-GDP ratio has declined to 37.8 per cent, reflecting the government’s fiscal performance and the strengthening of the Ontario economy.
| Item | Actual 2015–16 |
Interim 2016–17 |
Plan 2017–18 |
Outlook 2018–19 |
Outlook 2019–20 |
|---|---|---|---|---|---|
| Revenue | 128.4 | 133.2 | 141.7 | 144.9 | 149.3 |
| Expense — Programs | 120.9 | 123.5 | 129.5 | 132.3 | 135.8 |
| Expense — Interest on Debt | 11.0 | 11.3 | 11.6 | 12.0 | 12.6 |
| Total Expense | 131.9 | 134.8 | 141.1 | 144.3 | 148.4 |
| Surplus/(Deficit) Before Reserve | (3.5) | (1.5) | 0.6 | 0.6 | 0.9 |
| Reserve | – | – | 0.6 | 0.6 | 0.9 |
| Surplus/(Deficit) | (3.5) | (1.5) | 0.0 | 0.0 | 0.0 |
| Net Debt as a Per Cent of GDP | 38.6 | 37.8 | 37.5 | 37.3 | 37.2 |
| Accumulated Deficit as a Per Cent of GDP | 25.2 | 24.2 | 23.2 | 22.3 | 21.4 |
Table 6.1 Footnotes:
Note: Numbers may not add due to rounding.
2016–17 Interim Fiscal Performance
Ontario’s deficit for 2016–17 is projected to be $1.5 billion — an improvement of $2.8 billion compared with the 2016 Budget forecast.
| Item | Budget Plan | Interim | In-Year Change |
|---|---|---|---|
| Revenue | 130,589 | 133,228 | 2,639 |
| Expense — Programs | 122,139 | 123,502 | 1,362 |
| Expense — Interest on Debt | 11,756 | 11,250 | (506) |
| Total Expense | 133,895 | 134,752 | 856 |
| Reserve | 1,000 | – | (1,000) |
| Surplus/(Deficit) | (4,306) | (1,524) | 2,783 |
Table 6.2 Footnotes:
Note: Numbers may not add due to rounding.
Total revenue is projected to be $2.6 billion above the 2016 Budget Plan largely due to higher taxation revenues and stronger total net incomes from Government Business Enterprises (GBEs), partially offset by lower other revenues.
Total expense in 2016–17 is projected to be $0.9 billion higher than forecast in the 2016 Budget, as a result of higher program expense and lower interest on debt. This includes the impact of $0.5 billion in lower interest on debt expense for 2016–17 than the forecast in the 2016 Budget, due to lower interest rates and cost-effective debt management.
Ontario’s program expense is projected to be $1.4 billion higher than outlined in the 2016 Budget. This is primarily the result of investments in health care, social services, the Green Investment Fund initiatives and the Ontario Rebate for Electricity Consumers.
The fiscal plan outlined in the 2016 Budget included a $1.0 billion reserve to protect the fiscal outlook against unforeseen adverse changes in the Province’s revenue and expense forecasts in 2016–17. With a higher–than–expected revenue forecast exceeding higher projected expense, it is anticipated that the reserve will not be required by year-end and has been drawn down.
Given the preliminary nature of these estimates, the interim forecast is subject to change as actual Provincial revenue and expense are finalized in the Public Accounts of Ontario 2016–2017.
In-Year Revenue Performance
Total revenue in 2016–17 is estimated to be $133.2 billion. This is $2.6 billion, or 2.0 per cent, above the amount projected in the 2016 Budget. The increase is largely due to higher taxation revenues and stronger total net incomes from GBEs, partially offset by lower other revenues.
| Item | Interim 2016–17 |
|---|---|
| Taxation Revenue — Corporations Tax | 1,296 |
| Taxation Revenue — Personal Income Tax | 717 |
| Taxation Revenue — Sales Tax | 714 |
| Taxation Revenue — Land Transfer Tax | 637 |
| Taxation Revenue — All Other Taxes | (120) |
| Total Taxation Revenue | 3,244 |
| Total Government of Canada | (249) |
| Income from Government Business Enterprises — Liquor Control Board of Ontario | 296 |
| Income from Government Business Enterprises — Ontario Lottery and Gaming Corporation | 181 |
| Income from Government Business Enterprises — Ontario Power Generation Inc./Hydro One Ltd./Brampton Distribution Holdco Inc. | (207) |
| Total Income from Government Business Enterprises | 270 |
| Total Other Non-Tax Revenue | (626) |
| Total Revenue Changes since the 2016 Budget | 2,639 |
Table 6.3 Footnotes:
Note: Numbers may not add due to rounding.
Revenue Changes
Highlights of key 2016–17 revenue changes from the 2016 Budget forecast are as follows:
- Corporations Tax (CT) revenue is $1,296 million higher, mainly due to higher revenue in 2015 and prior years from tax returns processed and a stronger corporate profits outlook relative to the 2016 Budget.
- Personal Income Tax (PIT) revenue is $717 million higher than the 2016 Budget forecast, primarily due to higher 2015 revenue from tax returns processed.
- Sales Tax revenues are estimated to be $714 million higher, largely reflecting an increase to Harmonized Sales Tax (HST) revenues due to a higher Ontario share of the overall HST/GST revenue pool as the provincial economy has performed better than the rest of Canada in 2015 and 2016.
- Land Transfer Tax (LTT) revenues are estimated to be $637 million higher, due to higher Ontario housing resale prices.
- All Other Tax revenues combined are estimated to be $120 million lower, mainly due to lower revenues from electricity payments in lieu (PIL) of taxes and Employer Health Tax, partially offset by higher revenues from Education Property Tax, Gasoline Tax, Tobacco Tax and Ontario Health Premium.
- Government of Canada transfers are estimated to be $249 million lower than the 2016 Budget forecast, largely reflecting lower transfers for infrastructure projects, mainly due to revised timelines for the Building Canada Fund and the absence of anticipated federal health funding for home care.
- Net income from the Liquor Control Board of Ontario (LCBO) is projected to be $296 million higher than projected in the 2016 Budget, primarily due to the recategorization from Sales and Rentals of the impact of the sale of its head office lands as part of the Province’s asset optimization strategy.
- Net income from the Ontario Lottery and Gaming Corporation (OLG) is estimated to be $181 million higher than projected in the 2016 Budget, due to higher-than-projected revenues in OLG’s lottery, slots and casinos, and resort casinos business lines.
- The combined net incomes of Ontario Power Generation Inc. (OPG), Hydro One Ltd. (HOL) and Brampton Distribution Holdco Inc. are projected to be $207 million below the 2016 Budget forecast. Lower HOL net income shown as consolidated by the Province mainly reflects the recategorization of impacts of broadening Hydro One ownership that were previously reflected under Sales and Rentals. Lower than projected OPG net income is mainly due to a variance from gross margins assumed in the 2016 Budget.
- Other Non-Tax Revenue is projected to be $626 million lower, mainly due to reprofiling of carbon allowance proceeds from 2016–17 to 2017–18, and lower revenue under Sales and Rentals which mainly reflects the recategorization of revenues related to the Province’s asset optimization strategy.
In-Year Expense Performance
Total expense in 2016–17 is currently projected to be $134.8 billion, $0.9 billion higher than the 2016 Budget forecast. This growth in program expense is primarily due to additional investments in hospitals, Green Investment Fund initiatives, and additional investments in the Ontario Disability Support Program and the Ontario Rebate for Electricity Consumers. This is partially offset by lower-than-projected interest on debt expense.
| Item | 2016–17 |
|---|---|
| Increase/(Decrease) in Program Expense since the 2016 Budget1 — Health Sector | 483 |
| Increase/(Decrease) in Program Expense since the 2016 Budget2 — Education Sector3 | 105 |
| Increase/(Decrease) in Program Expense since the 2016 Budget4 — Postsecondary and Training Sector | (69) |
| Increase/(Decrease) in Program Expense since the 2016 Budget5 — Children’s and Social Services Sector | 287 |
| Increase/(Decrease) in Program Expense since the 2016 Budget6 — Justice Sector | 115 |
| Increase/(Decrease) in Program Expense since the 2016 Budget7 — Other Programs | 441 |
| Total Increase/(Decrease) in Program Expense since the 2016 Budget | 1,362 |
| Interest on Debt | (506) |
| Total Expense Changes since the 2016 Budget | 856 |
Table 6.4 Footnotes:
[1], [2], [4], [5], [6], [7] Expense change by sector, restated for fiscally neutral transfers of programs between sectors.
[3] Excludes Teachers’ Pension Plan. Teachers’ Pension Plan expense is included in Other Programs.
Expense Changes
The following expense changes have occurred since the 2016 Budget:
- Health sector expense is projected to increase by $483 million, primarily due to additional investments in hospitals to support the needs of patients and reduce wait times, and funding to support additional stem cell transplants in Ontario.
- Education sector expense is projected to be $105 million higher than forecast, primarily due to higher-than-projected enrolment.
- Postsecondary and training sector is projected to be $69 million lower than anticipated, mainly as result of lower-than-forecasted demand in employment and training programs and student financial assistance programs.
- Children’s and social services sector expense is projected to increase by $287 million, primarily due to additional investments to address demand for the Ontario Disability Support Program and increased funding for autism services.
- Justice sector expense is expected to increase by $115 million, primarily due to settlements under the Proceedings Against the Crown Act, reforms to the corrections system and ensuring wage parity for First Nation police officers.
- Other programs expense is expected to increase by $441 million, mainly due to the Green Investment Fund initiatives, the Ontario Rebate for Electricity Consumers, investments in social and affordable housing, and the Clean Water and Wastewater Fund.
Interest on debt expense is projected to be $506 million lower than forecast in the 2016 Budget, primarily due to lower-than-forecast interest rates, the lower forecasted deficit and cost-effective debt management.
Medium-Term Fiscal Outlook
The government is projecting a balanced budget in 2017–18, consistent with the plan first laid out in the 2010 Budget. The Province is also projecting continued balance in 2018–19 and 2019–20.
Over the medium term, revenue is forecast to increase from $133.2 billion in 2016–17 to $149.3 billion in 2019–20, while total expense is projected to increase from $134.8 billion to $148.4 billion over the same period.
Key Changes since the 2016 Budget
The medium-term revenue outlook is above the 2016 Budget Plan largely because of strong performance in taxation revenues driven by a growing economy. Personal Income Tax and Corporations Tax revenues are boosted by stronger-than-expected assessments for 2015 and prior years. Higher HST revenues reflect upward federal revision to Ontario entitlements due to an increase in Ontario’s share of the overall revenue pool and lower housing rebates. Land Transfer Tax revenues have been boosted by higher-than-expected increases in housing prices.
Total expense over the medium term is projected to be higher than forecast at the time of the 2016 Budget as a result of the investments the government is making in health, education, electricity cost relief and other public services that matter to Ontario families, partially offset by lower interest on debt expense. Ontario’s medium-term outlook for interest on debt expense is currently below the 2016 Budget estimate, primarily as a result of lower-than-forecast interest rates, along with effective and efficient debt management.
The program expense outlook over the medium term is projected to be higher in each of 2016–17, 2017–18 and 2018–19, compared with the medium-term forecast in the 2016 Budget. This increase reflects the investments the government can continue to make as a result of restoring a balanced budget including:
- Supporting hospitals, children and youth pharmacare, primary care, home care, and mental health services;
- Supporting enrolment growth in schools, child care expansion and the Highly Skilled Workforce Strategy; and
- Supporting electricity cost relief programs under the Fair Hydro Plan.
The reserve included in the fiscal plan has been set at $0.6 billion in 2017–18 and 2018–19, reflecting continued prudence while recognizing the confidence arising from a strengthening Ontario economy and a restoring of fiscal balance in Ontario.
| Item | 2016–17 | 2017–18 | 2018–19 |
|---|---|---|---|
| Surplus/(Deficit) from the 2016 Budget | (4.3) | 0.0 | 0.0 |
| Total Revenue Changes | 2.6 | 3.9 | 3.0 |
| Expense Changes — Net Program Expense Changes | 1.4 | 5.3 | 4.7 |
| Expense Changes — Interest on Debt | (0.5) | (0.9) | (1.1) |
| Total Expense Changes | 0.9 | 4.4 | 3.6 |
| Change in Reserve | (1.0) | (0.5) | (0.6) |
| Fiscal Improvement/(Deterioration) | 2.8 | 0.0 | 0.0 |
| 2017 Budget Surplus/(Deficit) | (1.5) | 0.0 | 0.0 |
Table 6.5 Footnotes:
Note: Numbers may not add due to rounding.
Ontario’s Revenue Outlook
Ontario’s revenues rely heavily on the level and pace of economic activity in the province, with growth expected to be roughly in line with nominal gross domestic product (GDP). For example, taxes are collected on the incomes and spending of Ontarians, and on the profits generated by businesses operating in Ontario.
However, there are important qualifications to this general relationship. The impact of housing completions and resales on HST and LTT revenues is proportionately greater than their contribution to GDP. Growth in several tax revenue sources, such as volume-based gasoline and fuel taxes, is more closely aligned to real GDP. Similarly, some revenues, such as vehicle and driver registration fees, tend to more closely track growth in the driving-age population.
Growth in some revenue sources, such as the Corporations Tax and Mining Tax, can diverge significantly from economic growth in any given year due to the inherent volatility of business profits, as well as the use of tax provisions, such as the option to carry losses forward or backward across different tax years.
Medium-Term Revenue Outlook
Total revenue is projected to increase from $133.2 billion to $149.3 billion between 2016–17 and 2019–20, or at an average annual rate of 3.9 per cent. Revenue growth largely reflects the Ministry of Finance’s outlook for economic growth outlined later in this chapter. The medium-term revenue outlook includes revised estimates related to the current federal government’s commitments for additional health funding for home care and mental health. It also includes projected carbon allowance proceeds and net revenues from the Province’s asset optimization strategy.
| Item | Interim 2016–17 |
Plan 2017–18 |
Outlook 2018–19 |
Outlook 2019–20 |
|---|---|---|---|---|
| Revenue — Personal Income Tax | 32.9 | 35.0 | 37.3 | 39.5 |
| Revenue — Sales Tax | 24.7 | 26.0 | 27.1 | 28.0 |
| Revenue — Corporations Tax | 13.3 | 13.8 | 14.7 | 15.5 |
| Revenue — Ontario Health Premium | 3.7 | 3.8 | 4.0 | 4.2 |
| Revenue — Education Property Tax | 5.9 | 6.0 | 6.1 | 6.1 |
| Revenue — All Other Taxes | 14.6 | 15.4 | 16.3 | 17.1 |
| Total Taxation Revenue | 95.1 | 100.1 | 105.4 | 110.3 |
| Government of Canada | 24.4 | 25.7 | 25.4 | 24.9 |
| Income from Government Business Enterprises | 5.3 | 4.9 | 5.7 | 6.0 |
| Other Non-Tax Revenue | 8.5 | 11.0 | 8.3 | 8.1 |
| Total Revenue | 133.2 | 141.7 | 144.9 | 149.3 |
Table 6.6 Footnotes:
Note: Numbers may not add due to rounding.
Building on existing initiatives, including actions to address the underground economy, the government is taking action to strengthen the integrity of the tax system and ensure that everyone pays their fair share. A review of revenues generated from GBEs will also be undertaken. This integrated approach will help promote greater fairness and efficiency, and ensure the ongoing integrity of the tax system (see Chapter 7: A Fair and Sustainable Tax System).
The medium-term taxation revenue growth profile reflects growth in the economy, but may also incorporate prior-year adjustments and the impacts of past and proposed tax measures. These latter impacts may result in a taxation revenue growth profile for a specific revenue source that appears to be inconsistent with the growth profile of the main related economic driver. To help explain the medium-term growth profile of the major taxation revenues, the following three tables adjust total projected revenues for each of Personal Income Tax, Sales Tax and Corporations Tax, to remove prior-year adjustments and impacts of measures to arrive at “base revenue.” This base revenue measure is shown to be more closely aligned to the main economic driver for the specific taxation revenue source.
| Item | Interim 2016–17 |
Plan 2017–18 |
Outlook 2018–19 |
Outlook 2019–20 |
|---|---|---|---|---|
| Revenue — Total Projected Revenue | 32.9 | 35.0 | 37.3 | 39.5 |
| Revenue — Tax Measures1 | (0.0) | 0.1 | 0.3 | 0.4 |
| Revenue — Other Adjustments | (0.2) | 0.0 | 0.0 | 0.0 |
| Revenue — Base Revenue2 | 33.1 | 34.9 | 36.9 | 39.1 |
| Revenue — Base Revenue Growth (Per Cent) | – | 5.4 | 5.7 | 5.9 |
| Revenue — Compensation of Employees3 (Per Cent Change) | – | 4.1 | 4.5 | 4.6 |
Table 6.7 Footnotes:
[1] Represents the revenue impact of all tax measures, announced previously or proposed in this Budget.
[2] Total Projected Revenue less the impact of tax measures or other one-time factors, such as prior-year adjustments.
Base Revenue reflects the impact of underlying macroeconomic factors.
[3] Includes wages, salaries and employers’ social contributions.
Note: Numbers may not add due to rounding.
The primary economic driver of the forecast for Personal Income Tax (PIT) revenue is the outlook for growth in the compensation of employees. The PIT revenue projection also reflects the impact of tax measures, as well as prior-year and other adjustments. Tax measures include those announced in past Budgets and those proposed in this Budget (see Chapter 7: A Fair and Sustainable Tax System), as well as the impact of federal measures including those announced in the 2017 federal budget. Excluding the impacts of tax measures and other adjustments, the PIT revenue base is projected to grow at an average annual rate of 5.7 per cent over the forecast period. This compares with average annual growth of 4.4 per cent in compensation of employees over this period. Personal Income Tax revenue tends to grow at a faster rate than incomes due to the progressive structure of the PIT system.
| Revenue | Interim 2016–17 |
Plan 2017–18 |
Outlook 2018–19 |
Outlook 2019–20 |
|---|---|---|---|---|
| Total Projected Sales Tax Revenue1 | 24.7 | 26.0 | 27.1 | 28.0 |
| Tax Measures2 | 0.3 | 0.2 | 0.1 | 0.1 |
| Other Adjustments | 0.2 | 0.0 | 0.0 | 0.0 |
| Base Revenue3 | 24.2 | 25.8 | 27.0 | 27.9 |
| Base Revenue Growth (Per Cent) | – | 6.9 | 4.5 | 3.3 |
| Nominal Consumption Growth (Per Cent) | – | 4.3 | 4.2 | 4.2 |
Table 6.8 Footnotes:
[1] Revenues from sales tax include: the provincial portion of the Harmonized Sales Tax (HST), Ontario’s Retail Sales Tax (RST) on certain insurance premiums, and the RST on private transfers of specified vehicles. Sales Tax Revenue is reported net of both the Ontario Sales Tax Credit and the energy component of the Ontario Energy and Property Tax Credit.
[2] Represents the revenue impact of all tax measures, announced previously or proposed in this Budget.
[3] Total Projected Revenue less the impact of tax measures or other one-time factors, such as prior-year adjustments.
Base Revenue reflects the impact of underlying macroeconomic factors.
Note: Numbers may not add due to rounding.
The Sales Tax revenue projection is based primarily on growth in consumer spending. The Sales Tax revenue projection also reflects the impact of tax measures and prior-year adjustments. Tax measures of $0.3 billion in 2016–17 primarily reflect the impact of transitional measures such as input tax credits, which are being phased out by 2018–19. Other adjustments reflect a one-time adjustment of $0.2 billion in 2016–17 related to a variance from Sales Tax revenue reported in the Public Accounts of Ontario 2015–2016. Excluding the impacts of measures and other adjustments, the Sales Tax revenue base is projected to grow at an average annual rate of 4.9 per cent, reflecting average annual growth in nominal consumption of 4.2 per cent over this period.
| Revenue | Interim 2016–17 |
Plan 2017–18 |
Outlook 2018–19 |
Outlook 2019–20 |
|---|---|---|---|---|
| Total Projected Revenue | 13.3 | 13.8 | 14.7 | 15.5 |
| Tax Measures1 | 0.2 | 0.3 | 0.4 | 0.4 |
| Other Adjustments2 | 0.6 | 0.0 | 0.0 | 0.0 |
| Base Revenue3 | 12.6 | 13.5 | 14.4 | 15.1 |
| Base Revenue Growth (Per Cent) | – | 7.4 | 6.5 | 5.0 |
| Net Operating Surplus — Corporations Growth (Per Cent) | – | 6.8 | 7.1 | 5.4 |
Table 6.9 Footnotes:
[1] Represents the revenue impact of all tax measures announced previously or proposed in this Budget.
[2] Other Adjustments include net timing of payment adjustments due to the difference between projected Corporations Tax (CT) revenue entitlements and projected federal CT remittances.
[3] Total Projected Revenue less the impact of tax measures or other one-time factors, such as prior-year adjustments. Base Revenue reflects the impact of underlying macroeconomic factors.
Note: Numbers may not add due to rounding.
The forecast for Corporations Tax (CT) revenue is based on the annual growth in the net operating surplus of corporations. The CT revenue projection reflects the impact of tax measures, as well as prior-year and other adjustments. Tax measures include those announced in past federal and provincial budgets and those proposed in this Budget (see Chapter 7: A Fair and Sustainable Tax System). After accounting for tax measures and other adjustments, the CT revenue base grows at an average annual rate of 6.3 per cent over the forecast period. This is in line with the 6.5 per cent average annual growth in the net operating surplus of corporations.
Ontario Health Premium revenue forecast is based primarily on the projected growth in the compensation of employees. As a result, Ontario Health Premium revenue is projected to increase at an average annual rate of 4.4 per cent over the forecast period.
Education Property Tax revenue is projected to increase at an average annual rate of 1.1 per cent over the forecast period. This is largely due to growth in the property assessment base resulting from new construction activities.
Revenues from All Other Taxes are projected to increase at an average annual rate of 5.4 per cent over the forecast period. This includes revenues from the Land Transfer Tax, Beer and Wine Tax and volume-based taxes such as the Gasoline Tax, Fuel Tax and Tobacco Tax. The effect of the new housing affordability policies on the housing market, and therefore on LTT revenues, are difficult to predict. However, LTT revenues are projected to increase, but at a slower rate than last year, reflecting a moderation in the pace of housing market activity.
The forecast for Government of Canada transfers is based on existing federal–provincial funding arrangements. Revenues are projected to grow slightly at an average annual rate of 0.6 per cent over the forecast period, largely reflecting projected increases in the Canada Health Transfer and Canada Social Transfer, partially offset by lower projections of Equalization payments. The forecast also includes revised estimates related to the federal government’s 2017 budget announcement of federal health funding for home care and mental health.
The outlook for Income from Government Business Enterprises (GBEs) is based on Ministry of Finance estimates of net income for Hydro One and information provided by Ontario Power Generation, Liquor Control Board of Ontario (LCBO) and the Ontario Lottery and Gaming Corporation (OLG). Overall revenue from GBEs is projected to increase by $0.7 billion between 2016–17 and 2019–20, or at an average annual rate of 4.3 per cent.
The forecast for Other Non-Tax revenue is based on projectionsprovided by government ministries and Provincial agencies. Between 2016–17 and 2019–20, Other Non-Tax revenues are projected to be slightly lower by $0.3 billion. This decrease largely reflects the removal of the Debt Retirement Charge from commercial, industrial and all other electricity users in 2018–19 and the projected net impact of the Province’s planned asset optimization strategy. This decline is partially offset by higher revenue from vehicle and driver registration fees.
Key Changes in the Medium-Term Revenue Outlook since the 2016 Budget
Compared with the 2016 Budget forecast, the outlook for revenues are higher over the 2016–17 to 2018–19 period.
| Item | 2016–17 | 2017–18 | 2018–19 |
|---|---|---|---|
| Taxation | 3.2 | 4.1 | 5.2 |
| Government of Canada Transfers | (0.2) | (0.1) | (1.1) |
| Government Business Enterprises | 0.3 | (0.5) | 0.0 |
| Carbon Allowance Proceeds | (0.5) | (0.1) | (0.5) |
| Other Non-Tax Revenue | (0.1) | 0.5 | (0.7) |
| Total Revenue Changes | 2.6 | 3.9 | 3.0 |
Table 6.10 Footnotes:
Note: Numbers may not add due to rounding.
Taxation revenues are higher, largely due to stronger economic growth and higher-than-expected revenues from processing past years tax returns. Stronger estimates of economic growth for 2014 to 2016 have increased Ontario’s 2016 nominal GDP by $19.8 billion above the level expected in the 2016 Budget. The latest tax data from processing of Personal and Corporate Income Tax returns during 2016 boosted the 2015 base upon which growth is applied, increasing revenue estimates over the forecast period. The HST base in 2015 was also higher as Ontario’s relatively stronger economic growth exceeded expectations, increasing Ontario’s share of the revenue pool. Taxation revenue also benefited from continued strength of the Ontario housing market. Finally, the higher taxation revenue includes impact of tax measures announced in this Budget (see Chapter 7: A Fair and Sustainable Tax System). Tax measures include a Tobacco Tax rate increase and paralleling of the 2017 federal budget tax measures.
Lower Government of Canada Transfers in 2016–17 largely reflects lower-than-projected funding for infrastructure projects and the absence of funding for home care as anticipated in the 2016 Budget. The decline in the plan year and the medium term mainly reflects lower projected Equalization payments, partially offset in 2017–18 by higher federal transfer for public transit projects.
Income from Government Business Enterprises is projected to be higher in 2016–17 reflecting stronger overall performance from OLG and LCBO, including the recategorization from Sales and Rentals of the impact of the sale of LCBO’s head office lands as part of the Province’s asset optimization strategy. The decrease in 2017–18 is mainly due to projected lower combined net incomes of Hydro One Ltd. and the Ontario Power Generation Inc., including the impact of a Provincial accounting consolidation adjustment, as required in Public Accounts under Public Sector Accounting Standards, as discussed in Chapter 6, Section A: Transforming Government for Sustainability and Fairness.
The revenue outlook also includes projected proceeds from the auctioning of carbon allowances beginning in 2016–17. Lower proceeds in 2016–17 reflect revenue from the first auction in March 2017 being certified and settled in fiscal year 2017–18. A lower medium-term outlook also reflects revised projections using more cautious assumptions.
The decrease in Other Non-Tax Revenue in 2016–17 is largely due to lower Sales and Rentals revenue recategorized under LCBO net income as indicated above; partially offset by higher revenue from power supply contract recoveries that are fiscally neutral and other miscellaneous revenue sources. The overall change in the medium term largely reflects revised net impacts of the Province’s planned asset optimization strategy, higher miscellaneous revenues, and fiscally neutral lower power supply contract recoveries.
Risks to the Revenue Outlook
Ontario’s revenue outlook is based on reasonable assumptions about the pace of growth in Ontario’s economy. There are both positive and negative risks to the economic projections underlying the revenue forecast. Some of these risks are discussed in this section. The following section highlights some of the key sensitivities and risks to the fiscal plan that could arise from unexpected changes in economic conditions. These estimates are only guidelines; actual results will vary depending on the composition and interaction of the various factors.
The risks are those that could have the most material impact on the largest revenue sources. A broader range of additional risks are not included because they are either less material or difficult to quantify. For example, the outlook for Government of Canada transfers is subject to changes in economic variables that affect federal funding, as well as changes by the federal government to the funding arrangements themselves.
| Economic Factors | Revenue Sources | 2017–18 Sensitivities1 |
|---|---|---|
| Nominal GDP | Total Taxation Revenue | $690 million revenue change for each percentage point change in Nominal GDP Growth |
| Compensation of Employees | Personal Income Tax, Ontario Health Premium and Employer Health Tax | $425 million revenue change for each percentage point change in growth in Compensation of Employees |
| Household Consumption Expenditures | Harmonized Sales Tax | $190 million for each percentage point change in growth of Household Consumption Expenditures |
| Net Corporations Operating Surplus | Corporations Tax | $145 million revenue change for each percentage point change in growth of Net Corporations Operating Surplus |
| Housing Resales and Resale Prices | Land Transfer Tax | $26 million for each percentage point change in growth of either the number or prices of Housing Resales |
Table 6.11 Footnotes:
[1] Can vary significantly, depending on composition and source of changes in the underlying economic driver.
Medium-Term Expense Outlook
The Province’s program expense outlook is projected to grow at an average annual rate of 2.9 per cent between 2015–16 and 2019–20. This reflects the government’s commitment to invest in priority areas such as health care, education, child care expansion and electricity cost relief programs.
The government has a strong track record in meeting its fiscal targets, and is building on the success of recent initiatives to support the Province’s fiscal objectives. The government will expand the review of current programs to identify opportunities for modernization and to ensure that expense growth is managed within the plan laid out in this Budget (see Chapter 6, Section A: Transforming Government for Sustainability and Fairness).
| Item | Actual 2015–16 |
Interim 2016–17 |
Plan 2017–18 |
Outlook 2018–19 |
Outlook 2019–20 |
Average Annual Growth 2015–16 to 2019–20 |
|---|---|---|---|---|---|---|
| Programs — Health Sector | 51.0 | 52.2 | 53.8 | 56.3 | 58.1 | 3.3% |
| Programs — Education Sector1 | 25.0 | 25.7 | 26.5 | 27.4 | 28.0 | 2.8% |
| Programs — Postsecondary and Training Sector | 7.7 | 7.8 | 8.4 | 8.3 | 8.4 | 2.5% |
| Programs — Children’s and Social Services Sector | 15.6 | 16.2 | 16.9 | 17.2 | 17.4 | 2.7% |
| Programs — Justice Sector | 4.5 | 4.6 | 4.7 | 4.7 | 4.8 | 1.2% |
| Programs — Other Programs | 17.1 | 17.0 | 19.2 | 18.4 | 19.2 | 2.9% |
| Total Programs | 120.9 | 123.5 | 129.5 | 132.3 | 135.8 | 2.9% |
| Interest on Debt | 11.0 | 11.3 | 11.6 | 12.0 | 12.6 | 3.6% |
| Total Expense | 131.9 | 134.8 | 141.1 | 144.3 | 148.4 | 3.0% |
Table 6.12 Footnotes:
[1] Excludes Teachers’ Pension Plan. Teachers’ Pension Plan expense is included in Other Programs.
Note: Numbers may not add due to rounding.
Highlights of the program expense outlook over the medium term include the following:
- Health sector expense is projected to grow on average by 3.3 per cent per year between 2015–16 and 2019–20 as a result of targeted funding for hospital services, reduced wait times, new children and youth pharmacare, investments to increase access to primary care, home care and community care, and increased supports for people requiring mental health and addictions services.
- Education sector expense is projected to grow on average by 2.8 per cent per year between 2015–16 and 2019–20, mainly due to increased funding to school boards to support enrolment growth and new investments in child care.
- Postsecondary and training sector expense is projected to grow on average by 2.5 per cent per year between 2015–16 and 2019–20, mainly due to investments in the Highly Skilled Workforce initiatives and postsecondary infrastructure investments.
- Children’s and social services sector expense is projected to grow on average by 2.7 per cent per year between 2015–16 and 2019–20, primarily reflecting investments in social assistance and developmental services, as well as funding to support transformation of autism and child welfare services.
- Justice sector expense is projected to grow on average by 1.2 per cent per year between 2015–16 and 2019–20, mainly due to reforms to the corrections system, the continuing upload of court security costs from municipalities, the expansion of access to legal aid for low-income Ontarians, appointing more judges, initiatives to support more timely resolution of cases, and planned capital investments.
- Other programs expense is projected to grow on average by 2.9 per cent per year between 2015–16 and 2019–20, mainly due to electricity cost relief programs under the Fair Hydro Plan, initiatives under the Climate Change Action Plan, and investments in transit and transportation.
The total expense outlook includes interest on debt expense, which is projected to increase on average by 3.6 per cent per year between 2015–16 and 2019–20. This increase is mainly due to borrowing for investment in capital assets.
Risks to the Expense Outlook
The government has continued to demonstrate strong fiscal management, having held average annual growth in program spending to 1.8 per cent between 2011–12 and 2015–16. It will manage risks prudently to ensure it can continue to invest in the economy and people, while maintaining balanced budgets.
The following table provides a summary of key expense risks and sensitivities that could result from unexpected changes in economic conditions and program demands. A change in these factors could affect total expense, causing variances in the overall fiscal forecast.
These sensitivities are illustrative and can vary, depending on the nature and composition of potential risks.
| Program/Sector | 2017–18 Assumption | 2017–18 Sensitivity |
|---|---|---|
| Health Sector | Average annual growth of 3.3 per cent | One per cent change in health spending: $538 million |
| Hospitals Sector Expense | Annual growth of 3.1 per cent | One per cent change in hospitals sector expense: $237 million |
| Drug Programs | Annual growth of 8.4 per cent | One per cent change in program expenditure of drug programs: $42 million |
| Long-Term Care Homes | 78,229 long-term care home beds. Average Provincial annual operating cost per bed in a long-term care home: $52,861 | One per cent change in number of beds: approximately $41 million |
| Home Care | Approximately 29 million hours of personal support services | One per cent change in hours of personal support services: approximately $9.7 million |
| Home Care | Approximately 8.7 million nursing and therapy visits and 2.1 million nursing shifts | One per cent change in all nursing and therapy visits: approximately $8.4 million |
| Elementary and Secondary Schools | Approximately 1,969,000 average daily pupil enrolment | One per cent enrolment change: approximately $165 million |
| Ontario Works | 248,877 average annual caseload | One per cent caseload change: $27 million |
| Ontario Disability Support Program | 358,079 average annual caseload | One per cent caseload change: $51 million |
| Interest on Debt | Average cost of 10-year borrowing in 2017–18 forecast to be approximately 3.0 per cent | The impact of a 100 basis-point change in borrowing rates is forecast to be approximately $300 million |
Contingent Liabilities
In addition to the key demand sensitivities and economic risks to the fiscal plan, there are risks stemming from the government’s contingent liabilities. Whether these contingencies will result in actual liabilities for the Province is beyond the direct control of the government. Losses could result from legal settlements, defaults on projects, and loan and funding guarantees. Provisions for losses that are likely to occur and can be reasonably estimated are expensed and reported as liabilities in the Province’s financial statements. Any significant contingent liabilities related to the 2016–17 fiscal year will be disclosed as part of the 2016–2017 Annual Report and Consolidated Financial Statements, expected to be released in the summer.
Fiscal Prudence
As required by the Fiscal Transparency and Accountability Act, 2004 (FTAA), Ontario’s fiscal plan incorporates prudence in the form of a reserve to protect the fiscal outlook against unforeseen adverse changes in the Province’s revenue and expense. The reserve has been set at $0.6 billion in 2017–18, $0.6 billion in 2018–19, and $0.9 billion in 2019–20.
The fiscal plan also includes contingency funds (both operating and capital) to help mitigate expense risks — particularly in cases where health and safety may be compromised or services to the most vulnerable are jeopardized — that may otherwise adversely affect Ontario’s fiscal performance.
In keeping with sound fiscal practices, the Province’s revenue outlook is based on prudent economic assumptions, as discussed later in this section.
Details of Ontario’s Finances
The following tables and charts provide information on the Province’s historical financial performance, key fiscal indicators, and fiscal plan and outlook.
| Item | 2014–15 | Actual 2015–16 |
Interim 2016–17 | Plan 2017–18 |
|---|---|---|---|---|
| Taxation Revenue — Personal Income Tax | 29,313 | 31,141 | 32,884 | 35,032 |
| Taxation Revenue — Sales Tax1 | 21,689 | 23,455 | 24,690 | 26,011 |
| Taxation Revenue — Corporations Tax | 9,557 | 11,428 | 13,346 | 13,817 |
| Taxation Revenue — Education Property Tax2 | 5,561 | 5,839 | 5,900 | 6,002 |
| Taxation Revenue — Employer Health Tax | 5,415 | 5,649 | 5,882 | 6,117 |
| Taxation Revenue — Ontario Health Premium | 3,366 | 3,453 | 3,664 | 3,789 |
| Taxation Revenue — Gasoline Tax | 2,447 | 2,459 | 2,602 | 2,663 |
| Taxation Revenue — Land Transfer Tax | 1,778 | 2,118 | 2,688 | 3,139 |
| Taxation Revenue — Tobacco Tax | 1,163 | 1,226 | 1,247 | 1,291 |
| Taxation Revenue — Fuel Tax | 739 | 751 | 736 | 746 |
| Taxation Revenue — Beer and Wine Tax | 560 | 582 | 594 | 619 |
| Taxation Revenue — Electricity Payments in Lieu of Taxes | 180 | 3,247 | 373 | 405 |
| Taxation Revenue — Other Taxes | 507 | 470 | 457 | 466 |
| Total Taxation Revenue | 82,275 | 91,818 | 95,063 | 100,097 |
| Government of Canada — Canada Health Transfer | 12,408 | 13,089 | 13,910 | 14,340 |
| Government of Canada — Canada Social Transfer | 4,847 | 4,984 | 5,146 | 5,307 |
| Government of Canada — Equalization | 1,988 | 2,363 | 2,304 | 1,424 |
| Government of Canada — Infrastructure Programs | 137 | 146 | 837 | 2,328 |
| Government of Canada — Labour Market Programs | 896 | 927 | 974 | 977 |
| Government of Canada — Social Housing | 465 | 455 | 434 | 412 |
| Government of Canada — Other Federal Payments | 874 | 893 | 790 | 893 |
| Total Government of Canada | 21,615 | 22,857 | 24,395 | 25,681 |
| Government Business Enterprises — Ontario Lottery and Gaming Corporation | 1,995 | 2,234 | 2,134 | 2,134 |
| Government Business Enterprises — Liquor Control Board of Ontario | 1,831 | 1,956 | 2,321 | 2,137 |
| Government Business Enterprises — Ontario Power Generation Inc./Hydro One Ltd./ Brampton Distribution Holdco Inc. | 1,789 | 719 | 842 | 617 |
| Total Government Business Enterprises | 5,615 | 4,909 | 5,297 | 4,888 |
| Other Non-Tax Revenue — Reimbursements | 985 | 991 | 979 | 984 |
| Other Non-Tax Revenue — Vehicle and Driver Registration Fees | 1,433 | 1,565 | 1,721 | 1,934 |
| Other Non-Tax Revenue — Electricity Debt Retirement Charge | 956 | 859 | 625 | 623 |
| Other Non-Tax Revenue — Power Supply Contract Recoveries | 950 | 875 | 739 | 292 |
| Other Non-Tax Revenue — Sales and Rentals | 2,336 | 2,102 | 1,980 | 3,006 |
| Other Non-Tax Revenue — Carbon Allowance Proceeds | – | – | – | 1,778 |
| Other Non-Tax Revenue — Other Fees and Licences | 693 | 964 | 1,007 | 984 |
| Other Non-Tax Revenue — Net Reduction of Power Purchase Contract Liability | 217 | 172 | 129 | 74 |
| Other Non-Tax Revenue — Royalties | 275 | 274 | 278 | 265 |
| Other Non-Tax Revenue — Miscellaneous Other Non-Tax Revenue | 1,196 | 991 | 1,015 | 1,044 |
| Total Other Non-Tax Revenue | 9,041 | 8,793 | 8,473 | 10,984 |
| Total Revenue | 118,546 | 128,377 | 133,228 | 141,650 |
Table 6.14 Footnotes:
[1] Sales Tax revenue is net of the Ontario Sales Tax Credit and the energy component of the Ontario Energy and Property Tax Credit.
[2] Education Property Tax revenue is net of the Ontario Senior Homeowners’ Property Tax Grant and the property tax component of the Ontario Energy and Property Tax Credit.
Note: Numbers may not add due to rounding.
| Ministry Expense | 2014–15 | Actual 2015–16 |
Interim 2016–17 |
Plan 2017–18 |
|---|---|---|---|---|
| Accessibility Directorate of Ontario (Total) | 15 | 15 | 17.4 | 20.1 |
| Advanced Education and Skills Development (Total) | 7,683 | 7,655 | 7,807.3 | 8,410.3 |
| Agriculture, Food and Rural Affairs — Agriculture, Food and Rural Affairs (Base) | 805 | 883 | 971.0 | 949.1 |
| Agriculture, Food and Rural Affairs — Time-Limited Assistance | 7 | – | 3.1 | – |
| Agriculture, Food and Rural Affairs — Time-Limited Investments in Infrastructure | 36 | 47 | 99.5 | 77.4 |
| Agriculture, Food and Rural Affairs (Total) | 847 | 929 | 1,073.6 | 1,026.5 |
| Attorney General (Total) | 1,782 | 1,859 | 1,941.8 | 1,937.5 |
| Board of Internal Economy1 (Total) | 264 | 205 | 225.8 | 225.8 |
| Children and Youth Services (Total) | 4,166 | 4,297 | 4,447.0 | 4,443.8 |
| Citizenship and Immigration (Total) | 103 | 102 | 104.9 | 112.5 |
| Community and Social Services — Community and Social Services (Base) | 10,550 | 11,298 | 11,697.0 | 12,409.6 |
| Community and Social Services — Time-Limited Investments in Affordable and Supportive Housing | – | – | 23.0 | 9.3 |
| Community and Social Services (Total) | 10,550 | 11,298 | 11,720.0 | 12,418.9 |
| Community Safety and Correctional Services — Community Safety and Correctional Services (Base) | 2,523 | 2,565 | 2,688.9 | 2,776.8 |
| Community Safety and Correctional Services — Time-Limited Support for 2015 Pan/Parapan American Games Security | 44 | 122 | – | – |
| Community Safety and Correctional Services (Total) | 2,567 | 2,687 | 2,688.9 | 2,776.8 |
| Economic Development and Growth / Research, Innovation and Science — Economic Development and Growth / Research, Innovation and Science (Base) | 834 | 908 | 959.6 | 971.0 |
| Economic Development and Growth / Research, Innovation and Science — Green Investment Fund Initiatives | – | – | 99.0 | – |
| Economic Development and Growth / Research, Innovation and Science (Total) | 834 | 908 | 1,058.6 | 971.0 |
| Education — Education (Base) | 24,629 | 24,998 | 25,740.6 | 26,518.1 |
| Education — Teachers’ Pension Plan2 | 564 | 110 | (502.0) | (531) |
| Education (Total) | 25,194 | 25,108 | 25,238.6 | 25,987.1 |
| Energy — Energy (Base) | 326 | 328 | 352.1 | 511.9 |
| Energy — Electricity Cost Relief Programs | – | – | 400.0 | 1,438.0 |
| Energy — Green Investment Fund Initiatives | – | – | 108.0 | – |
| Energy — Ontario Clean Energy Benefit | 1,078 | 860 | 20.8 | – |
| Energy — Strategic Asset Management and Transformation Related to Hydro One | – | 44 | 44.6 | 100.0 |
| Energy (Total) | 1,404 | 1,232 | 925.5 | 2,049.9 |
| Environment and Climate Change — Environment and Climate Change (Base) | 486 | 503 | 530.2 | 1,023.3 |
| Environment and Climate Change — Green Investment Fund Initiatives | – | – | 1.0 | – |
| Environment and Climate Change (Total) | 486 | 503 | 531.2 | 1,023.3 |
| Executive Offices — Executive Offices (Base) | 36 | 35 | 44.4 | 56.1 |
| Executive Offices — Time-Limited Assistance | – | – | 1.3 | – |
| Executive Offices (Total) | 36 | 35 | 45.7 | 56.1 |
| Finance — Finance (Base) | 930 | 1,048 | 901.5 | 932.9 |
| Finance — Ontario Municipal Partnership Fund | 542 | 513 | 505.0 | 505.0 |
| Finance — Power Supply Contract Costs | 950 | 875 | 739.0 | 292.0 |
| Finance (Total) | 2,422 | 2,436 | 2,145.5 | 1,729.9 |
| Francophone Affairs, Office of (Total) | 5 | 8 | 5.1 | 5.3 |
| Government and Consumer Services (Total) | 567 | 602 | 613.6 | 593.3 |
| Health and Long-Term Care — Health and Long-Term Care (Base) | 49,983 | 51,011 | 52,201.1 | 53,762.8 |
| Health and Long-Term Care — Time-Limited Investments in Affordable and Supportive Housing | – | – | 4.7 | – |
| Health and Long-Term Care (Total) | 49,983 | 51,011 | 52,205.8 | 53,762.8 |
| Indigenous Relations and Reconciliation — Indigenous Relations and Reconciliation (Base) | 67 | 75 | 82.6 | 85.8 |
| Indigenous Relations and Reconciliation — Green Investment Fund Initiatives | – | – | 5.0 | – |
| Indigenous Relations and Reconciliation — One-Time Investments including Settlements | 3 | 5 | 11.3 | 5.0 |
| Indigenous Relations and Reconciliation (Total) | 71 | 79 | 98.9 | 90.8 |
| Infrastructure — Infrastructure (Base) | 229 | 213 | 193.3 | 173.0 |
| Infrastructure — Federal–Provincial Infrastructure Programs | – | – | 131.6 | 689.4 |
| Infrastructure (Total) | 229 | 213 | 324.9 | 862.4 |
| International Trade (Total) | 17 | 21 | 31.0 | 61.6 |
| Labour (Total) | 305 | 305 | 310.3 | 311.8 |
| Municipal Affairs / Housing — Municipal Affairs / Housing (Base) | 889 | 923 | 898.0 | 955.0 |
| Municipal Affairs / Housing — Green Investment Fund Initiatives | – | – | 92.0 | – |
| Municipal Affairs / Housing — Time-Limited Investments | 7 | 1 | 7.0 | 10.0 |
| Municipal Affairs / Housing — Time-Limited Investments in Municipal, Social and Affordable Housing | 153 | 165 | 543.6 | 297.0 |
| Municipal Affairs / Housing (Total) | 1,050 | 1,088 | 1,540.7 | 1,262.0 |
| Natural Resources and Forestry — Natural Resources and Forestry (Base) | 713 | 723 | 753.2 | 754.6 |
| Natural Resources and Forestry — Emergency Forest Firefighting | 78 | 95 | 108.6 | 69.8 |
| Natural Resources and Forestry (Total) | 791 | 818 | 861.8 | 824.4 |
| Northern Development and Mines (Total) | 804 | 701 | 837.4 | 767.1 |
| Seniors Affairs (Total) | 17 | 20 | 20.1 | 35.3 |
| Status of Women (Total) | 20 | 26 | 22.8 | 25.8 |
| Tourism, Culture and Sport — Tourism, Culture and Sport (Base) | 1,246 | 1,431 | 1,454.9 | 1,390.5 |
| Tourism, Culture and Sport — Time-Limited Investments to Support 2015 Pan/Parapan American Games | 405 | 839 | 82.3 | – |
| Tourism, Culture and Sport (Total) | 1,650 | 2,270 | 1,537.2 | 1,390.5 |
| Transportation — Transportation (Base) | 2,941 | 3,284 | 3,667.8 | 4,213.7 |
| Transportation — Green Investment Fund Initiatives | – | – | 20.0 | – |
| Transportation — Time-Limited Investments in Infrastructure | – | – | – | 1,112.6 |
| Transportation (Total) | 2,941 | 3,284 | 3,687.8 | 5,326.2 |
| Treasury Board Secretariat — Treasury Board Secretariat (Base) | 237 | 221 | 239.8 | 336.8 |
| Treasury Board Secretariat — Employee and Pensioner Benefits | 1,186 | 987 | 1,163.0 | 1,208.0 |
| Treasury Board Secretariat — Operating Contingency Fund | – | – | 30.0 | 515.0 |
| Treasury Board Secretariat — Capital Contingency Fund | – | – | – | 100.0 |
| Treasury Board Secretariat (Total) | 1,423 | 1,208 | 1,432.8 | 2,159.8 |
| Interest on Debt3 | 10,635 | 10,967 | 11,250.0 | 11,581.3 |
| Year-End Savings4 | – | – | – | (1,200.0) |
| Total Expense | 128,861 | 131,891 | 134,751.8 | 141,050.0 |
Table 6.15 Footnotes:
[1] The 2014–15 amount includes expenses for the 2014 general election.
[2] Numbers reflect the pension expense/recovery that was calculated in accordance with Public Sector Accounting Board standards.
[3] Interest on debt is net of interest capitalized during construction of tangible capital assets of $202 million in 2014–15, $165 million in 2015–16, $121 million in 2016–17 and $292 million in 2017–18.
[4] As in past years, the Year-End Savings provision reflects efficiencies through in-year expenditure management and underspending due to factors such as program management, and changes in project startups and implementation plans.
Note: Numbers may not add due to rounding.
| Sector | Total Infrastructure Expenditures 2016–17 Interim1 |
2017–18 Plan Investment in Capital Assets2 |
2017–18 Plan Transfers and Other Infrastructure Expenditures3 |
2017–18 Plan Total Infrastructure Expenditures4 |
|---|---|---|---|---|
| Transportation — Transit | 3,806 | 5,440 | 1,736 | 7,176 |
| Transportation — Provincial Highways | 2,137 | 2,900 | 120 | 3,020 |
| Transportation — Other Transportation, Property and Planning | 642 | 172 | 180 | 352 |
| Health — Hospitals | 2,297 | 2,588 | 295 | 2,883 |
| Health — Other Health | 262 | 81 | 261 | 342 |
| Education | 2,000 | 2,636 | 53 | 2,689 |
| Postsecondary — Colleges and Other | 721 | 976 | 13 | 989 |
| Postsecondary — Universities | 318 | – | 399 | 399 |
| Social | 749 | 20 | 454 | 474 |
| Justice | 243 | 107 | 227 | 334 |
| Other Sectors5 | 1,135 | 646 | 973 | 1,620 |
| Total Infrastructure Expenditures | 14,311 | 15,566 | 4,711 | 20,277 |
Table 6.16 Footnotes:
[1] Includes provincial investment in capital assets of $8.9 billion.
[2] Includes $292 million in interest capitalized during construction.
[3] Includes transfers to municipalities, universities and non-consolidated agencies.
[4] Includes third-party investments in hospitals, colleges and schools, and federal contributions to provincial infrastructure investments.
[5] Includes government administration, natural resources, culture and tourism sectors.
Note: Numbers may not add due to rounding.
| Item | 2008–09 | 2009–102 | 2010–11 | 2011–12 | 2012–13 | 2013–14 | 2014–15 | Actual 2015–165 |
Interim 2016–17 |
Plan 2017–18 |
|---|---|---|---|---|---|---|---|---|---|---|
| Revenue | 97,532 | 96,313 | 107,175 | 109,773 | 113,369 | 115,911 | 118,546 | 128,377 | 133,228 | 141,650 |
| Expense — Programs | 95,375 | 106,856 | 111,706 | 112,660 | 112,248 | 115,792 | 118,225 | 120,925 | 123,502 | 129,469 |
| Expense — Interest on Debt3 | 8,566 | 8,719 | 9,480 | 10,082 | 10,341 | 10,572 | 10,635 | 10,967 | 11,250 | 11,581 |
| Total Expense | 103,941 | 115,575 | 121,186 | 122,742 | 122,589 | 126,364 | 128,861 | 131,891 | 134,752 | 141,050 |
| Reserve | – | – | – | – | – | – | – | – | – | 600 |
| Surplus/(Deficit) | (6,409) | (19,262) | (14,011) | (12,969) | (9,220) | (10,453) | (10,314) | (3,514) | (1,524) | 0 |
| Net Debt4 | 169,585 | 193,589 | 214,511 | 235,582 | 252,088 | 267,190 | 284,576 | 294,564 | 301,916 | 311,921 |
| Accumulated Deficit | 113,238 | 130,957 | 144,573 | 158,410 | 167,132 | 176,634 | 187,511 | 192,028 | 193,544 | 193,544 |
| Gross Domestic Product (GDP) at Market Prices | 608,446 | 597,882 | 630,989 | 659,743 | 680,084 | 695,349 | 727,962 | 763,276 | 798,218 | 832,652 |
| Primary Household Income | 414,724 | 412,847 | 424,251 | 444,076 | 459,111 | 472,921 | 490,023 | 511,781 | 532,941 | 553,587 |
| Population — July (000s) | 12,883 | 12,998 | 13,135 | 13,264 | 13,414 | 13,556 | 13,685 | 13,797 | 13,983 | 14,130 |
| Net Debt per Capita (dollars) | 13,164 | 14,894 | 16,331 | 17,762 | 18,793 | 19,710 | 20,795 | 21,350 | 21,592 | 22,075 |
| Household Income per Capita (dollars) | 32,193 | 31,763 | 32,299 | 33,481 | 34,226 | 34,886 | 35,807 | 37,094 | 38,114 | 39,177 |
| Interest on Debt as a Per Cent of Revenue | 8.8 | 9.1 | 8.8 | 9.2 | 9.1 | 9.1 | 9.0 | 8.5 | 8.4 | 8.2 |
| Net Debt as a Per Cent of GDP | 27.9 | 32.4 | 34.0 | 35.7 | 37.1 | 38.4 | 39.1 | 38.6 | 37.8 | 37.5 |
| Accumulated Deficit as a Per Cent of GDP | 18.6 | 21.9 | 22.9 | 24.0 | 24.6 | 25.4 | 25.8 | 25.2 | 24.2 | 23.2 |
Table 6.17 Footnotes:
[1] Revenue and expense have been restated to reflect a fiscally neutral accounting change for the revised presentation of education property taxes, as described in the 2010 Ontario Budget; a fiscally neutral accounting change related to the reclassification of government agencies and organizations, as described in the 2011 Ontario Economic Outlook and Fiscal Review; and a fiscally neutral reclassification of a number of tax measures that are transfers or grants, as described in the 2012 Ontario Budget.
[2] Starting in 2009–10, investments in minor tangible capital assets owned by the Province were capitalized and amortized to expense. All capital assets owned by consolidated organizations are being accounted for in a similar manner.
[3] Interest on debt is net of interest capitalized during construction of tangible capital assets of $134 million in 2013–14, $202 million in 2014–15, $165 million in 2015–16, $121 million in 2016–17, and $292 million in 2017–18.
[4] Starting in 2009–10, Net Debt includes the net debt of hospitals, school boards and colleges, consistent with Public Sector Accounting Board standards. For comparative purposes, Net Debt has been restated in 2008–09 to conform with this revised presentation.
[5] The 2015–16 actuals have been restated to reflect recognizing jointly sponsored net pension assets for the Ontario Public Service Employees’ Union Pension Plan and the Ontario Teachers’ Pension Plan on the Province’s financial statements, consistent with the 2016 Budget and as described in the 2016–17 Third Quarter Finances.
Note: Numbers may not add due to rounding.
Sources: Statistics Canada and Ontario Ministry of Finance.
Economic Outlook Details
The Ministry of Finance is forecasting 2.0 per cent average annual growth in Ontario’s real gross domestic product (GDP) over the 2017–20 period. For prudent fiscal planning, these real GDP growth projections are slightly below the average of private-sector forecasts.
| Item | 2014 | 2015 | 2016 | 2017p | 2018p | 2019p | 2020p |
|---|---|---|---|---|---|---|---|
| Real GDP Growth | 2.7 | 2.5 | 2.7 | 2.3 | 2.1 | 2.0 | 1.7 |
| Nominal GDP Growth | 4.7 | 4.9 | 4.6 | 4.3 | 4.1 | 4.2 | 3.9 |
| Employment Growth | 0.8 | 0.7 | 1.1 | 1.3 | 1.2 | 1.1 | 0.9 |
| CPI Inflation | 2.4 | 1.2 | 1.8 | 2.0 | 2.0 | 2.0 | 2.0 |
Table 6.18 Footnotes:
p = Ontario Ministry of Finance planning projection.
Sources: Statistics Canada and Ontario Ministry of Finance.
Ontario’s economy continues to perform well. A balanced and growing economy in the United States, low oil prices and a competitive Canadian dollar provide a solid foundation for future economic growth in Ontario. Rising interest rates and elevated household debt loads pose downside risks. Heightened global uncertainty and rising global protectionist sentiments could potentially weigh down future business, consumer and investor confidence.
Exports and business investment are expected to be key drivers of Ontario’s economic growth over the forecast period. Improving global growth prospects, technological innovation and a competitive and dynamic economic environment will help drive business investment. In turn, business investment will continue to be supported by Ontario’s competitive business tax environment and strategic government actions, such as:
- Infrastructure investments under Moving Ontario Forward; and
- The government’s five-year Business Growth Initiative.
See Chapter 3: Creating Opportunities and Security for a full discussion of government actions to support business investment.
Ontario’s exports are expected to rise by 2.3 per cent annually, on average, over the 2017–20 period. International exports are expected to continue to benefit from a low Canadian dollar and solid U.S. demand. Following a period of weakness, interprovincial exports are expected to pick up over the forecast period, largely due to improving prospects in resource-based provinces. However, intense global competitive challenges pose some downside risk to the outlook. Many other countries whose exports have gained significant share in the U.S. market have also recorded depreciation in their currencies against the U.S. dollar. This has somewhat offset the competitive gains Ontario exporters have experienced from a low Canadian dollar. At the same time, Ontario’s trade with the United States is part of an integrated, productive and mutually beneficial global supply chain which, compared to many other jurisdictions, is more balanced.
Business investment spending slowed in 2016, though firms are expected to increase investment in 2017. Business investment is projected to rise by 3.1 per cent annually between 2017 and 2020. This improvement reflects solid U.S. demand, a still competitive Canadian dollar and growing domestic opportunities.
Ontario has experienced strong job growth since the 2008–09 global recession. Employment is forecast to increase by 1.3 per cent, or 94,000 net new jobs in 2017, following growth of 1.1 per cent in 2016. Steady employment gains of 1.1 per cent annually, on average, are expected over the 2018–20 period. This would result in 900,000 net new jobs created between 2010 and 2020. Also, Ontario’s unemployment rate is projected to improve to 6.4 per cent in 2017 and steadily decline to 6.2 per cent by 2020.
Growth in incomes, buoyed by continued job growth, rising wages and government policy, is expected to continue driving consumer spending in Ontario. Following growth of 2.8 per cent in 2016, annual real household consumption gains are forecast to average 2.0 per cent over the 2017–20 period.
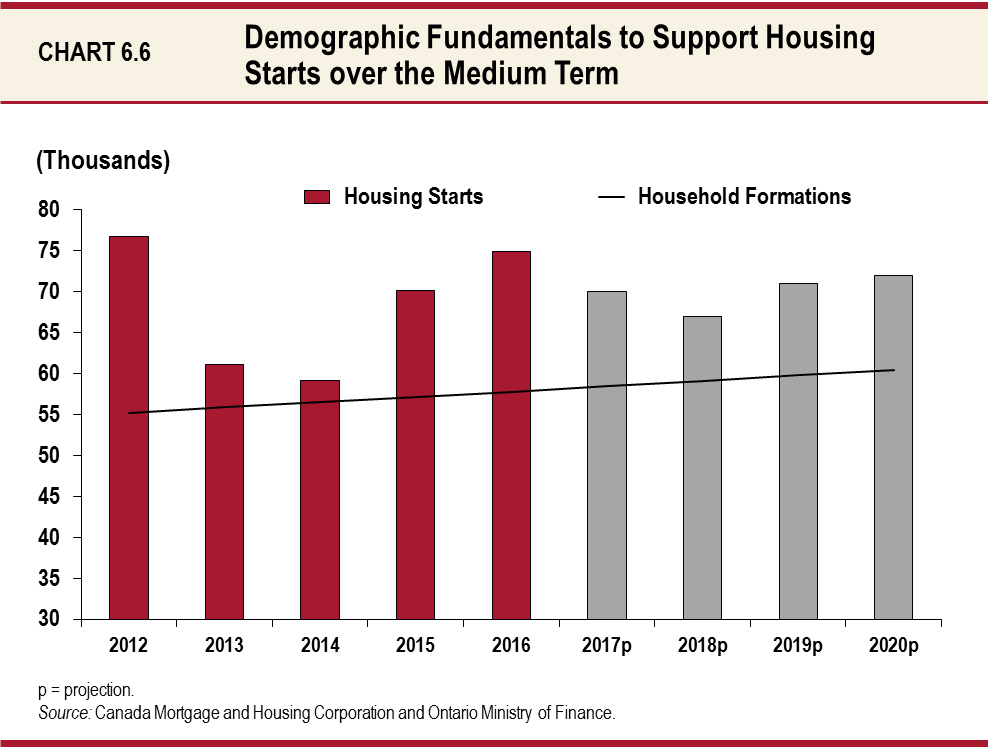
The Ontario housing market advanced in 2016, with both resale activity and housing starts exceeding expectations. Home price appreciation is forecast to moderate as rising interest rates, historically high valuations and mortgage debt temper healthy demographic-related demand, as well as recently introduced policy measures by the Ontario government.
Chart 6.6: Demographic Fundamentals to Support Housing Starts
over the Medium Term
External Economic Environment
The external environment remains supportive of Ontario’s economic growth, with a competitive Canadian dollar, low oil prices and stronger U.S. and Canadian growth. Forecasts for key external factors are summarized in the table below. These are used as the basis for the Ministry of Finance’s forecast for Ontario’s economic growth.
| Item | 2014 | 2015 | 2016 | 2017p | 2018p | 2019p | 2020p |
|---|---|---|---|---|---|---|---|
| World Real GDP Growth (Per Cent) | 3.4 | 3.2 | 3.1e | 3.4 | 3.6 | 3.7 | 3.7 |
| U.S. Real GDP Growth (Per Cent) | 2.4 | 2.6 | 1.6 | 2.3 | 2.4 | 2.1 | 2.0 |
| Canada Real GDP Growth (Per Cent) | 2.6 | 0.9 | 1.4 | 2.1 | 2.0 | 1.9 | 1.7 |
| West Texas Intermediate Crude Oil ($US/bbl.) | 93 | 49 | 43 | 54 | 59 | 62 | 64 |
| Canadian Dollar (Cents US) | 90.5 | 78.2 | 75.4 | 74.5 | 75.5 | 78.5 | 80.0 |
| Three-Month Treasury Bill Rate1 (Per Cent) | 0.9 | 0.5 | 0.5 | 0.5 | 0.8 | 1.5 | 1.9 |
| 10-Year Government Bond Rate2 (Per Cent) | 2.2 | 1.5 | 1.3 | 1.9 | 2.4 | 3.0 | 3.2 |
Table 6.19 Footnotes:
e = estimate.
p = Ontario Ministry of Finance planning projection based on external sources.
[1], [2] Government of Canada interest rates.
Sources: IMF World Economic Outlook (October 2016 and January 2017), U.S. Bureau of Economic Analysis, Blue Chip Economic Indicators (March 2017), Statistics Canada, U.S. Energy Information Administration, Bank of Canada, Ontario Ministry of Finance Survey of Forecasters (March 2017) and Ontario Ministry of Finance.
Global real GDP is expected to strengthen from 3.1 per cent in 2016 to 3.4 per cent in 2017, 3.6 per cent in 2018 and 3.7 per cent in both 2019 and 2020. Emerging market economies are forecast to continue to lead global growth, while advanced economies experience more modest improvements. U.S. and Canadian economic growth are both projected to pick up. U.S. real GDP is expected to expand by 2.3 per cent in 2017, boosted by fiscal stimulus. Canada’s real GDP is forecast to increase from 1.4 per cent in 2016 to 2.1 per cent in 2017, supported by household and government spending and firming oil prices. In many other advanced economies, including Japan and Euro member states, growth projections remain modest for 2017 and 2018.
Oil prices, interest rates and the Canadian dollar are projected to rise moderately over the forecast period. Oil prices rose in late 2016 and early 2017 following the agreement by the Organization of the Petroleum Exporting Countries (OPEC), as well as some non-OPEC countries to lower oil production. Although recently softened, oil prices are expected to rise over the forecast period, supporting a gradual appreciation of the Canadian dollar. However, the differing path of U.S. and Canadian monetary policy will limit near-term gains of the Canadian dollar. The U.S. Federal Reserve raised interest rates in March 2017 for the third time since the global financial crisis, while the Bank of Canada has left its interest rates unchanged. The yield on a three-month Canadian treasury bill is expected to be 0.5 per cent in 2017, unchanged from 2015 and 2016. However, Canadian long-term interest rates rose in late 2016 following U.S. Treasury yields that reflect an anticipated fiscal policy boost and additional Federal Reserve rate hikes.
Ontario Economic Outlook Details
The following table provides details of the Ministry of Finance’s economic outlook for 2017–20, so Ontarians can be informed about the state of the province’s economy.
To continue delivering high-quality data and information, Ontario is modernizing its statistics services. Currently, Ontario is the only province in Canada without an official statistics entity. The Province is taking steps to develop business model options for transforming data into useful information for Ontarians, enabling government to draft and implement policies that will grow the economy and create jobs.
| Item | Actual 2015 |
Actual 2016 |
Projection 2017 |
Projection 2018 |
Projection 2019 |
Projection 2020 |
|---|---|---|---|---|---|---|
| Real Gross Domestic Product | 2.5 | 2.7 | 2.3 | 2.1 | 2.0 | 1.7 |
| Household Consumption | 2.7 | 2.8 | 2.2 | 2.1 | 1.9 | 1.9 |
| Residential Construction | 7.2 | 7.9 | 0.2 | 1.6 | 1.2 | 1.4 |
| Non-Residential Construction | 9.7 | -4.0 | 0.0 | 3.5 | 5.3 | 1.0 |
| Machinery and Equipment | 6.8 | -4.0 | 0.0 | 3.8 | 6.0 | 3.9 |
| Exports | 2.8 | 3.0 | 2.0 | 2.5 | 2.4 | 2.2 |
| Imports | 3.7 | 1.4 | 1.6 | 2.3 | 2.1 | 2.0 |
| Nominal Gross Domestic Product | 4.9 | 4.6 | 4.3 | 4.1 | 4.2 | 3.9 |
| Primary Household Income | 4.4 | 4.1 | 3.9 | 4.0 | 4.1 | 3.9 |
| Compensation of Employees | 4.2 | 4.4 | 4.1 | 4.5 | 4.6 | 4.2 |
| Net Operating Surplus — Corporations | 9.1 | 9.2 | 6.8 | 7.1 | 5.4 | 4.0 |
| Other Economic Indicators — Retail Sales | 4.2 | 4.7 | 3.9 | 3.7 | 3.8 | 3.3 |
| Other Economic Indicators — Housing Starts (000s) | 70.2 | 75.0 | 72.0 | 68.5 | 71.0 | 72.0 |
| Other Economic Indicators — Home Resales | 9.5 | 9.7 | 4.3 | 2.8 | 3.2 | 3.4 |
| Other Economic Indicators — Home Resale Prices | 7.8 | 15.3 | 7.4 | 5.4 | 5.2 | 5.0 |
| Other Economic Indicators — Consumer Price Index | 1.2 | 1.8 | 2.0 | 2.0 | 2.0 | 2.0 |
| Other Economic Indicators — Employment | 0.7 | 1.1 | 1.3 | 1.2 | 1.1 | 0.9 |
| Other Economic Indicators — Job Creation (000s) | 45 | 76 | 94 | 89 | 82 | 66 |
| Other Economic Indicators — Unemployment Rate (Per Cent) | 6.8 | 6.5 | 6.4 | 6.3 | 6.2 | 6.2 |
| Key External Variables — U.S. Real Gross Domestic Product | 2.6 | 1.6 | 2.3 | 2.4 | 2.1 | 2.0 |
| Key External Variables — WTI Crude Oil ($ US/bbl.) | 49 | 43 | 54 | 59 | 62 | 64 |
| Key External Variables — Canadian Dollar (Cents US) | 78.2 | 75.4 | 74.5 | 75.5 | 78.5 | 80.0 |
| Key External Variables — Three-Month Treasury Bill Rate1 | 0.5 | 0.5 | 0.5 | 0.8 | 1.5 | 1.9 |
| Key External Variables — 10-Year Government Bond Rate2 | 1.5 | 1.3 | 1.9 | 2.4 | 3.0 | 3.2 |
Table 6.20 Footnotes:
[1], [2] Government of Canada interest rates (per cent).
Sources: Statistics Canada, Canada Mortgage and Housing Corporation, Canadian Real Estate Association, Bank of Canada, U.S. Bureau of Economic Analysis, Blue Chip Economic Indicators (March 2017), U.S. Energy Information Administration and Ontario Ministry of Finance.
Uncertain Global Environment
Although global economic growth is projected to improve over the 2017–20 period, there are risks around the outlook. Uncertainty about U.S. economic policy, as well as potential restrictions on global trade and migration, could diminish productivity and dampen business sentiment.
The expectation for fiscal stimulus and rising inflation in the United States has pushed long-term interest rates higher since late 2016. Mortgage rates have also increased, but remain at historically low levels. Rising interest rates are expected to contribute to a stabilization in housing market activity in Ontario. However, household debt loads are elevated as resale home price appreciation has outpaced income gains in recent years, fuelling mortgage debt accumulation.
Despite historically low mortgage rates, mortgage carrying costs on recently sold homes in Ontario are above their long-term average. As of 2016, this deterioration in affordability has been most acute in the Greater Toronto Area. High levels of debt combined with elevated resale prices leave Ontario households potentially vulnerable in the event of an adverse economic shock.
Table 6.21 provides current estimates of the impact of sustained changes in key external factors on the growth of Ontario’s real GDP, assuming other external factors are unchanged. The relatively wide range for the impacts reflects uncertainty regarding how the economy would be expected to respond to these changes in external conditions.
| Item | First Year | Second Year |
|---|---|---|
| Canadian Dollar Depreciates by Five Cents US | +0.1 to +0.7 | +0.2 to +0.8 |
| Crude Oil Prices Decrease by $10 US per Barrel | +0.1 to +0.3 | +0.1 to +0.3 |
| U.S. Real GDP Growth Increases by One Percentage Point | +0.2 to +0.6 | +0.3 to +0.7 |
| Canadian Interest Rates Increase by One Percentage Point | –0.1 to –0.5 | –0.2 to –0.6 |
Table 6.21 Footnotes:
Source: Ontario Ministry of Finance.
Private-Sector Forecasts
The Ministry of Finance consults with private-sector economists and tracks their forecasts to inform the government’s planning assumptions. In the process of preparing the 2017 Budget, the Minister of Finance met with private-sector economists to discuss their views on the economy. As well, three economic experts reviewed the Ministry of Finance’s economic assumptions and found them to be reasonable.2
Private-sector economists are projecting continued growth for Ontario over the forecast horizon. On average, private-sector economists are calling for real GDP growth of 2.4 per cent in 2017, 2.2 per cent in 2018, 2.1 per cent in 2019 and 1.8 per cent in 2020. For prudent fiscal planning, the Ministry of Finance’s real GDP growth projections are slightly below the average private-sector forecast.
| Item | 2017 | 2018 | 2019 | 2020 |
|---|---|---|---|---|
| BMO Capital Markets (March) | 2.4 | 1.9 | 1.7 | – |
| Central 1 Credit Union (March) | 2.9 | 3.0 | 2.6 | 2.0 |
| Centre for Spatial Economics (January) | 2.0 | 2.3 | 2.1 | 1.7 |
| CIBC World Markets (March) | 2.3 | 2.1 | – | – |
| Conference Board of Canada (February) | 2.0 | 2.1 | 1.9 | 1.6 |
| Desjardins Group (March) | 2.3 | 2.2 | 1.6 | 1.1 |
| IHS Global Insight (January) | 2.3 | 2.5 | 2.4 | 2.0 |
| Laurentian Bank Securities (February) | 2.3 | 2.1 | – | – |
| National Bank (March) | 2.3 | 2.1 | – | – |
| RBC Financial Group (March) | 2.5 | 2.0 | – | – |
| Scotiabank Group (March) | 2.4 | 2.2 | – | – |
| TD Bank Financial Group (March) | 2.6 | 1.9 | – | – |
| University of Toronto (January) | 2.5 | 2.5 | 2.4 | 2.3 |
| Private-Sector Survey Average | 2.4 | 2.2 | 2.1 | 1.8 |
| Ontario’s Planning Assumption | 2.3 | 2.1 | 2.0 | 1.7 |
Table 6.22 Footnotes:
Source: Ontario Ministry of Finance Survey of Forecasters (March 29, 2017).
Comparison to the 2016 Budget
Key changes since the 2016 Budget include:
- Higher real GDP growth in 2016, followed by more modest growth in 2017 and 2018;
- Higher nominal GDP growth in 2016, but lower growth in 2017 and 2018;
- Higher Canadian dollar and lower U.S. real GDP growth in 2016; and
- Downward revisions to the Canadian dollar and interest rates over the 2017–19 period.
| Item | 2016: 2016 Budget |
2016: 2017 Budget |
2017p: 2016 Budget |
2017p: 2017 Budget |
2018p: 2016 Budget |
2018p: 2017 Budget |
2019p: 2016 Budget |
2019p: 2017 Budget |
|---|---|---|---|---|---|---|---|---|
| Real Gross Domestic Product | 2.2 | 2.7 | 2.4 | 2.3 | 2.2 | 2.1 | 2.0 | 2.0 |
| Nominal Gross Domestic Product |
4.0 | 4.6 | 4.6 | 4.3 | 4.2 | 4.1 | 4.0 | 4.2 |
| Retail Sales | 4.8 | 4.7 | 3.7 | 3.9 | 3.4 | 3.7 | 3.2 | 3.8 |
| Housing Starts (000s) | 64.0 | 75.0 | 65.0 | 72.0 | 68.0 | 68.5 | 72.0 | 71.0 |
| Primary Household Income | 4.5 | 4.1 | 4.4 | 3.9 | 4.2 | 4.0 | 4.2 | 4.1 |
| Compensation of Employees | 4.4 | 4.4 | 4.5 | 4.1 | 4.5 | 4.5 | 4.4 | 4.6 |
| Net Operating Surplus — Corporations | 3.7 | 9.2 | 8.5 | 6.8 | 5.7 | 7.1 | 3.9 | 5.4 |
| Employment | 1.1 | 1.1 | 1.2 | 1.3 | 1.2 | 1.2 | 1.1 | 1.1 |
| Job Creation (000s) | 78 | 76 | 85 | 94 | 82 | 89 | 79 | 82 |
| Consumer Price Index | 1.8 | 1.8 | 2.0 | 2.0 | 2.0 | 2.0 | 2.0 | 2.0 |
| Key External Variables — U.S. Real Gross Domestic Product | 2.1 | 1.6 | 2.4 | 2.3 | 2.4 | 2.4 | 2.2 | 2.1 |
| Key External Variables — WTI Crude Oil ($ US/bbl.) |
42 | 43 | 53 | 54 | 60 | 59 | 67 | 62 |
| Key External Variables — Canadian Dollar (Cents US) |
72.0 | 75.4 | 75.5 | 74.5 | 81.0 | 75.5 | 83.0 | 78.5 |
| Key External Variables — Three-Month Treasury Bill Rate1 (Per Cent) | 0.5 | 0.5 | 0.8 | 0.5 | 2.2 | 0.8 | 2.8 | 1.5 |
| Key External Variables — 10-Year Government Bond Rate2 (Per Cent) | 1.6 | 1.3 | 2.3 | 1.9 | 3.3 | 2.4 | 3.6 | 3.0 |
Table 6.23 Footnotes:
p = Ontario Ministry of Finance planning projection.
[1], [2] Government of Canada interest rates.
Sources: Statistics Canada, Canada Mortgage and Housing Corporation, Bank of Canada, U.S. Energy Information Administration, U.S. Bureau of Economic Analysis, Blue Chip Economic Indicators (March 2017) and Ontario Ministry of Finance.
Footnotes
[1] The 2015–16 actuals have been restated to reflect recognizing jointly sponsored net pension assets for the Ontario Public Service Employees’ Union Pension Plan and the Ontario Teachers’ Pension Plan on the Province’s financial statements, consistent with the 2016 Budget and as described in the 2016–17 Third Quarter Finances.
[2] The three experts are from the Policy and Economic Analysis Program at the Rotman Institute for International Business, Rotman School of Management, University of Toronto; the Centre for Spatial Economics; and the Conference Board of Canada.
Chart Descriptions
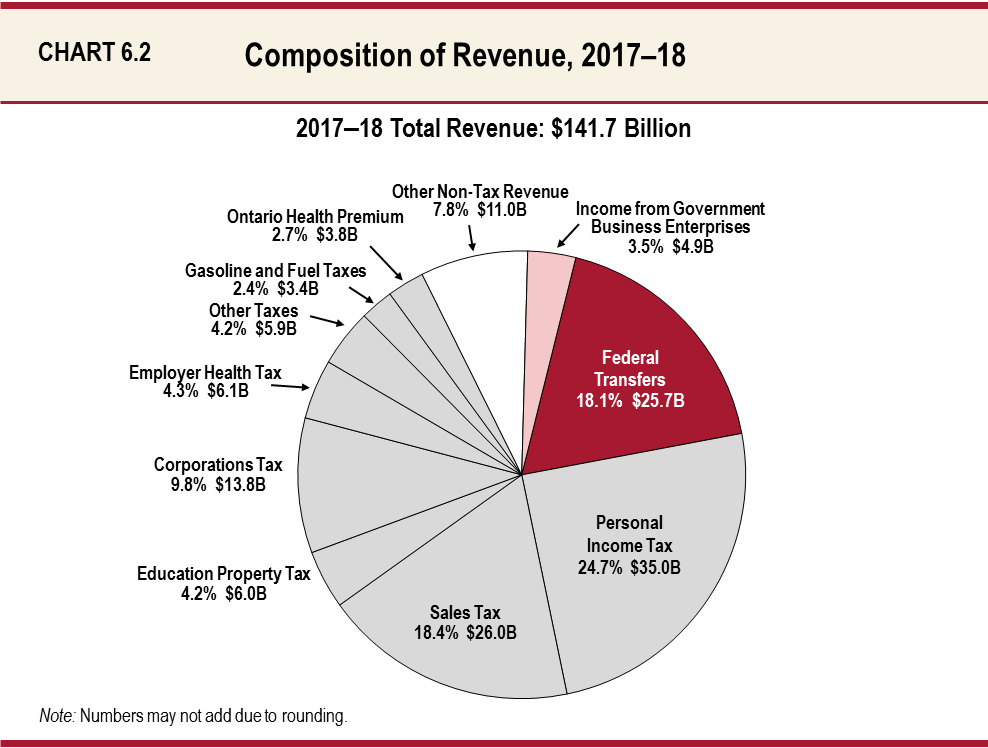
Chart 6.2: Composition of Revenue, 2017–18
This pie chart shows the composition of Ontario’s revenue in 2017–18, which totals $141.7 billion. The largest taxation revenue source is Personal Income Tax revenue at $35.0 billion, accounting for 24.7 per cent of total revenue. This is followed by Sales Tax at $26.0 billion, or 18.4 per cent of total revenue, and Corporations Tax at $13.8 billion, or 9.8 per cent of total revenue. Total taxation revenue accounts for $100.1 billion, or 70.7 per cent of total revenue. The other major non-taxation sources of revenue are Federal Transfers of $25.7 billion, or 18.1 per cent of total revenue, Income from Government Business Enterprises at $4.9 billion, or 3.5 per cent of total revenue, and various Other Non-Tax Revenues at $11.0 billion, or 7.8 per cent of total revenue.
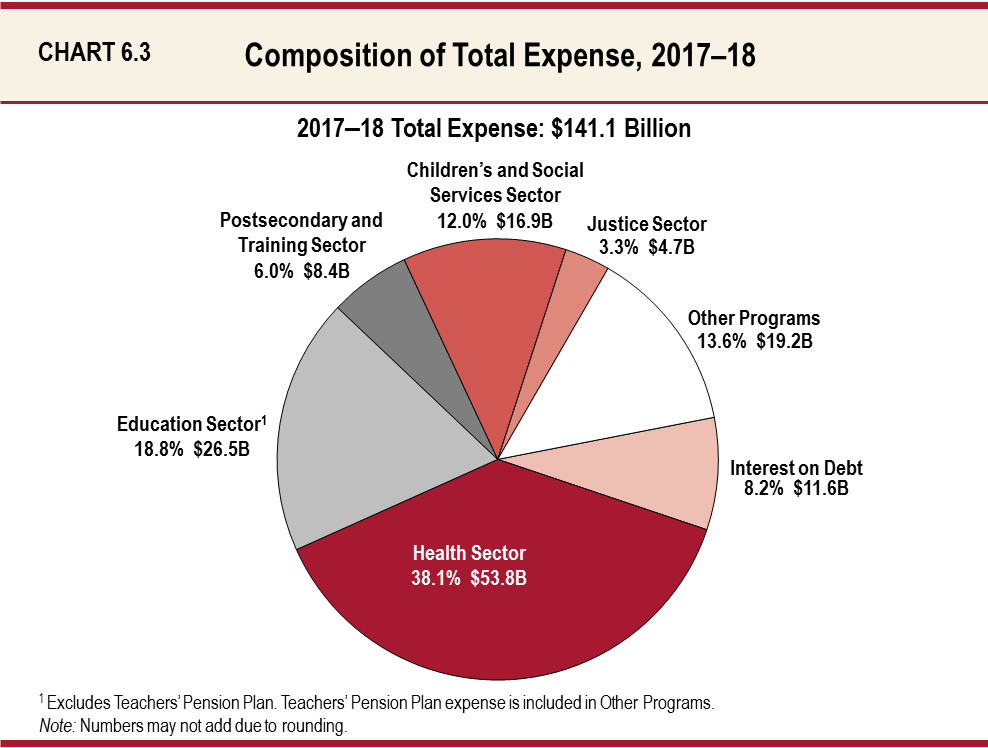
Chart 6.3: Composition of Total Expense, 2017–18
This pie chart shows the share of total expense and dollar amounts by sector in 2017–18.
Total expense in 2017–18 is $141.1 billion.
The largest expense is the Health Sector at $53.8 billion, accounting for 38.1 per cent of total expense.
The remaining sectors of total expense include the Education Sector at $26.5 billion or 18.8 per cent; the Postsecondary and Training Sector at $8.4 billion or 6.0 per cent; the Children’s and Social Services Sector at $16.9 billion or 12.0 per cent; the Justice Sector at $4.7 billion or 3.3 per cent; and Other Programs at $19.2 billion or 13.6 per cent. Interest on Debt, included as part of Total Expense, is $11.6 billion or 8.2 per cent.
Note that the Education Sector excludes the Teachers’ Pension Plan. Teachers’ Pension Plan expense is included in Other Programs.
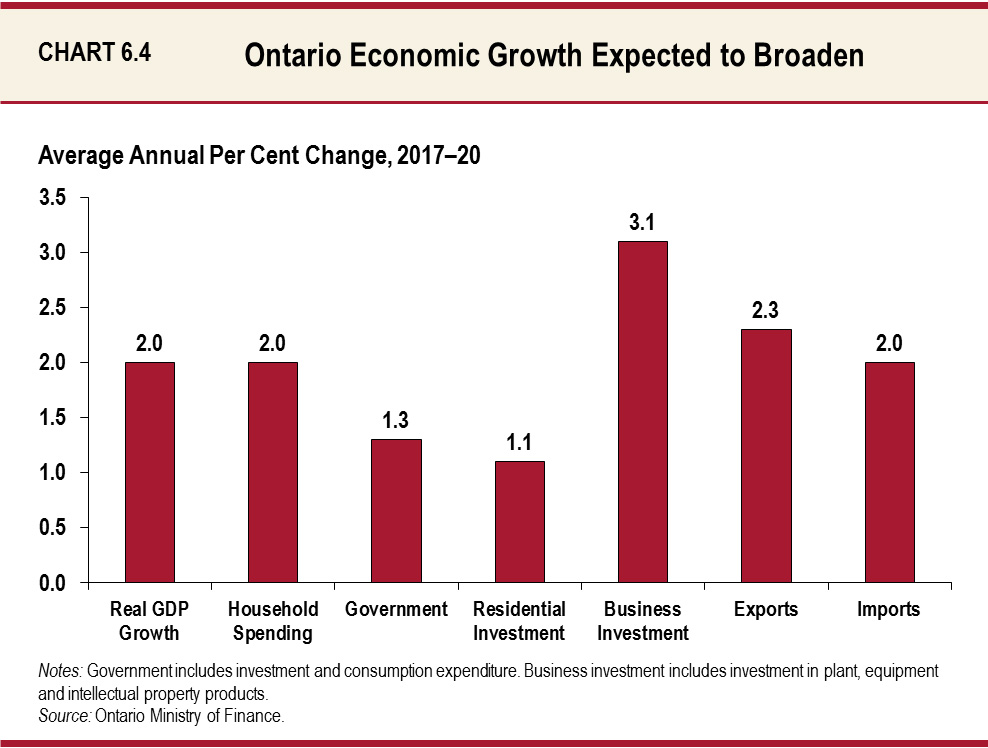
Chart 6.4: Ontario Economic Growth Expected to Broaden
The bar chart shows the composition of Ontario growth over the outlook (2017–20). The overall economy is expected to average real GDP growth of 2.0 per cent, led by business investment and exports with average annual increases of 3.1 per cent and 2.3 per cent, respectively. Average growth between 2017–20 is expected to be 2.0 per cent for household spending, 1.3 per cent for government, 1.1 per cent for residential investment and 2.0 per cent for imports.
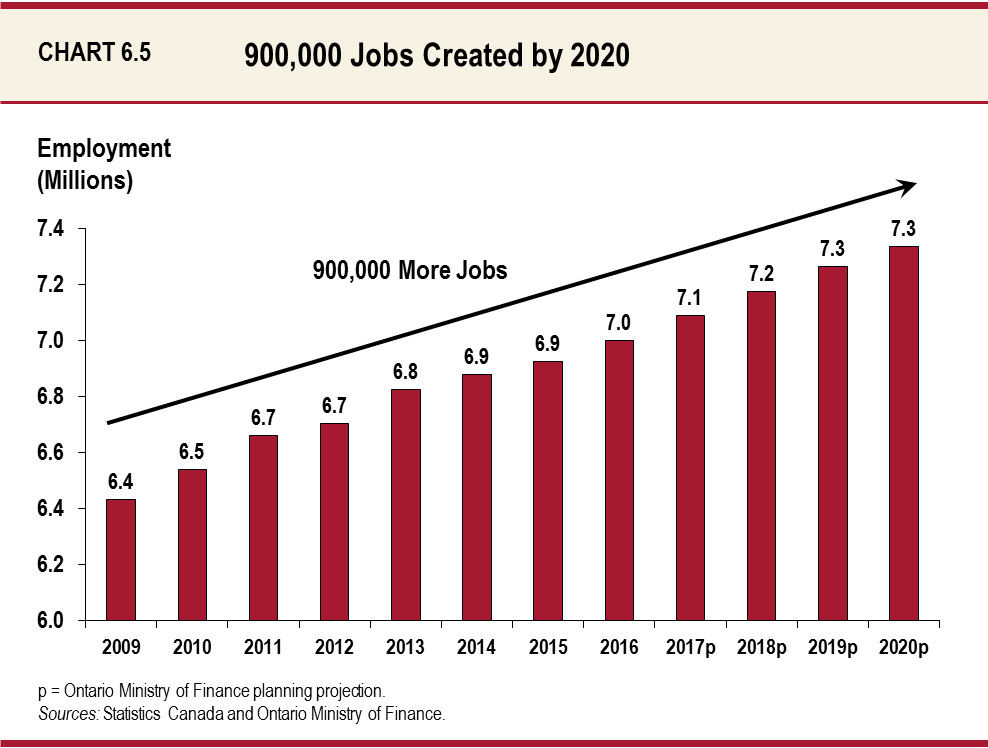
Chart 6.5: 900,000 Jobs Created by 2020
The bar chart shows the annual level of Ontario employment from 2009 to 2020. Ontario employment rose from 6.4 million in 2009 to 7.0 million in 2016. The Ontario Ministry of Finance projects employment will increase steadily to 7.3 million in 2020, for a gain of 900,000 jobs since 2009.
Chart 6.6: Demographic Fundamentals to Support Housing Starts over the Medium Term
This combined line and bar chart compares the annual level of household formations in Ontario with the annual level of housing starts in Ontario between 2012 and 2020. The line, representing household formations, begins at 55,000 in 2012 and ends at 60,000 household formations in 2020. The bars, representing housing starts, begin at 77,000 housing starts in 2012 and end at 72,000 housing starts in 2020. Over the historical period, 2012 to 2016, household formations averaged 57,000 annually, compared with housing starts, which averaged 68,000 annually. Over the forecast period, 2017 to 2020, household formations are expected to average 59,000 annually, compared with housing starts, which are expected to average 71,000 annually.