On this page Skip this page navigation
- Introduction
- Long-Term Public Borrowing
- Ensuring Preferred Market Access
- Leading Canadian-Dollar Green Bond Market
- Extending Term of Borrowing
- Interest on Debt Savings and Affordability
- Ensuring Adequate Liquidity Levels
- Reducing Net Debt-to-GDP
- Total Debt Composition
- Cost of Debt
- Limiting Risk Exposure
- Using Derivatives to Mitigate Risks
- Reducing Ontario’s Electricity Sector Stranded Debt
- Consolidated Financial Tables
Introduction
The Province is committed to making the necessary investments today to help Ontario families and meet the needs of its growing population. Ontario conducts its borrowing program responsibly, with the objectives of minimizing interest on debt costs and generating economic growth through strategic investments. The government successfully completed its annual borrowing program in 2016–17; at $27.0 billion, it is the smallest borrowing program since 2008–09. This is up from the $26.4 billion forecast in the 2016 Budget, as the Province capitalized on the continuing low interest rate environment and strong demand for Ontario bonds to prefund $3.2 billion of its 2017–18 requirement. The Province’s total long-term borrowing in 2017–18 is forecast to be $26.4 billion.
The Province’s debt differs from personal debt in a number of ways. One key difference is the government’s role in making multigenerational investments in infrastructure. By issuing debt at comparatively low interest rates, the Province can borrow money to make investments in capital assets today that improve quality of life for Ontarians and spread the costs equitably over the lifetime of the assets. The balanced budget and the government’s continued focus on capital investment will also add to economic growth, resulting in GDP growing more quickly than debt, and lowering the net debt-to-GDP ratio to the government’s 27 per cent target.
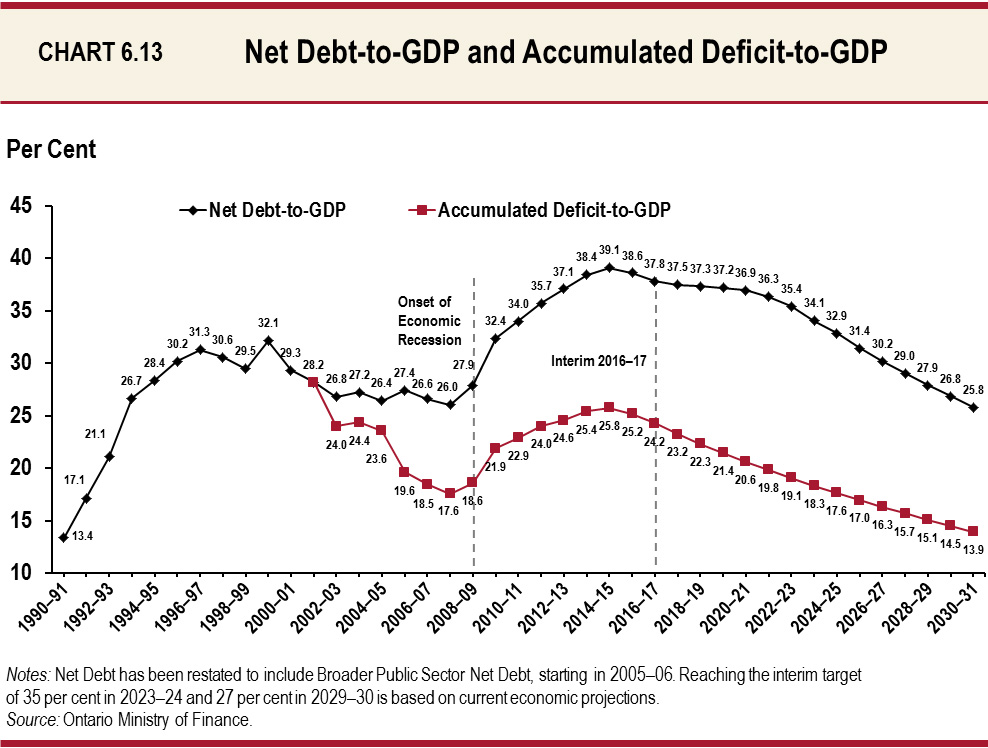
Ontario’s net debt is projected to be $301.9 billion as of March 31, 2017, $6.4 billion lower than forecasted in the 2016 Budget. Net debt was $294.6 billion as of March 31, 2016. Ontario’s net debt-to-GDP ratio peaked in 2014–15 at 39.1 per cent and has trended downwards since then, now forecast at 37.8 per cent in 2016–17. This ratio is forecast to continue to decline to 37.5 per cent in 2017–18, 37.3 per cent in 2018–19 and 37.2 per cent in 2019–20. The government is setting an interim net debt-to-GDP ratio target of 35 per cent by 2023–24 and continues to maintain a target of reducing the net debt-to-GDP ratio to its pre-recession level of 27 per cent, currently projected to be achieved by 2029–30.
Green Bonds are a part of Ontario’s borrowing program, and serve as an important tool to help Ontario finance transit and other environmentally friendly projects across the province. As the first Canadian province to issue Green Bonds, Ontario remains committed to the Green Bond market, and expects to continue to access it on an annual basis. The Province issued its third Green Bond in January 2017.
Long-Term Public Borrowing
The Province’s deficit for 2016–17 is projected to be $1.5 billion, compared to the 2016 Budget forecast of $4.3 billion. The total funding requirement for 2016–17 is now forecast at $25.6 billion, $4.6 billion lower than the 2016 Budget forecast. The Province’s total long-term borrowing in 2017–18 is forecast to be $26.4 billion, which is $0.6 billion lower than the amount borrowed in 2016–17. To date, $0.6 billion in long-term public borrowing has been completed for 2017–18.
| Item | 2016–17 2016 Budget |
2016–17 Interim |
2016–17 In-Year Change |
2017–18 | 2018–19 | 2019–20 |
|---|---|---|---|---|---|---|
| Deficit/(Surplus) | 4.3 | 1.5 | (2.8) | 0.0 | 0.0 | 0.0 |
| Investment in Capital Assets | 11.2 | 8.9 | (2.2) | 13.1 | 15.4 | 17.1 |
| Non-Cash Adjustments | (5.8) | (4.8) | 1.0 | (6.7) | (6.9) | (7.1) |
| Loans to Infrastructure Ontario | – | – | – | 0.4 | 0.5 | 0.6 |
| Other Net Loans/Investments | (0.9) | (1.0) | (0.1) | (0.8) | 1.4 | 0.6 |
| Debt Maturities | 21.5 | 20.9 | (0.5) | 17.5 | 21.8 | 27.4 |
| Debt Redemptions | 0.1 | 0.1 | – | 0.1 | 0.1 | 0.1 |
| Total Funding Requirement | 30.3 | 25.6 | (4.6) | 23.7 | 32.3 | 38.7 |
| Canada Pension Plan Borrowing | (0.1) | (0.1) | – | – | – | (0.9) |
| Decrease/(Increase) in Short-Term Borrowing | (1.0) | – | 1.0 | – | – | – |
| Increase/(Decrease) in Cash and Cash Equivalents | (2.7) | 0.3 | 3.0 | 6.0 | – | – |
| Preborrowing from 2015–16 | – | (2.0) | (2.0) | – | – | – |
| Preborrowing in 2016–17 for 2017–18 | – | 3.2 | 3.2 | (3.2) | – | – |
| Total Long-Term Public Borrowing | 26.4 | 27.0 | 0.6 | 26.4 | 32.2 | 37.8 |
Table 6.24 Footnotes:
Note: Numbers may not add due to rounding.
The Province plans to borrow $96.5 billion over the three-year period in the medium-term borrowing outlook, up from the forecast of $78.5 billion over the three-year period contained in the 2016 Budget. This $18.1-billion increase in borrowing reflects the higher debt maturities, higher investments in capital assets and the need for higher cash reserves.
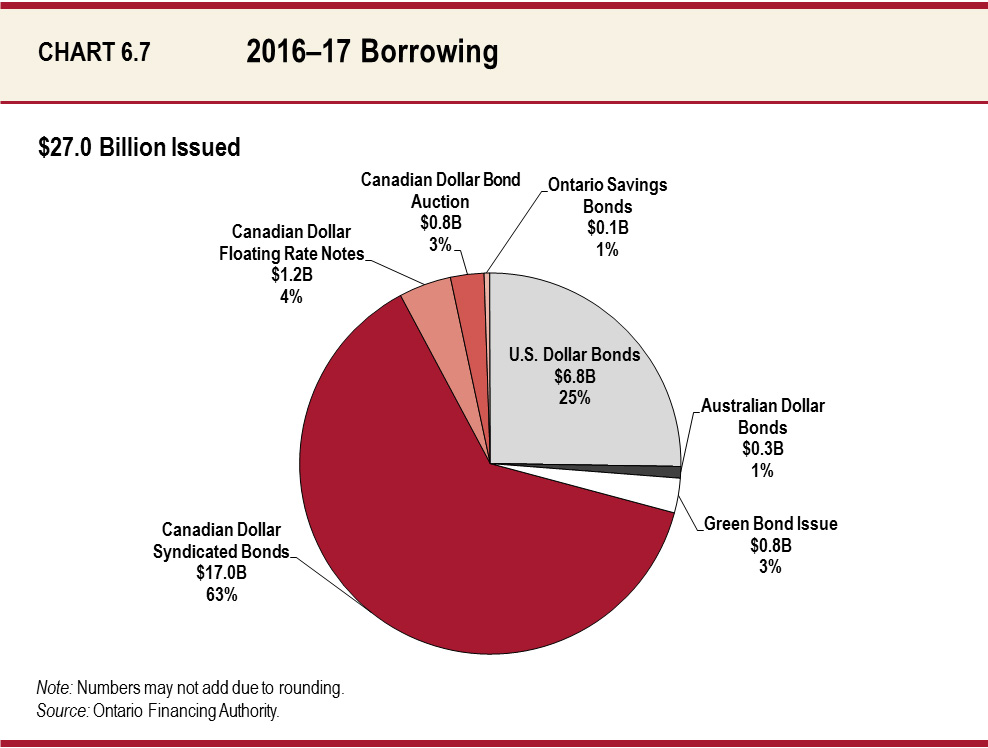
Approximately 74 per cent of 2016–17’s borrowing was completed in Canadian dollars, primarily through syndicated issues, but also included floating rate notes, a bond auction, Ontario Savings Bonds and an $800-million Green Bond issue. While this percentage is lower than the 81 per cent of 2015–16’s borrowing completed in Canadian dollars, it remains roughly in line with the target to complete at least 75 per cent in the Canadian-dollar market.
About $7.1 billion, or 26 per cent, of borrowing was completed in foreign currencies. The U.S.-dollar market remained an important source of funding for Ontario in 2016–17, with $6.8 billion issued in U.S. dollars. The remaining foreign currency borrowing was completed in Australian dollars.
Ensuring Preferred Market Access
The Province regularly takes advantage of borrowing opportunities in currencies other than Canadian dollars to relieve pressure on the domestic bond market and diversify its investor base. This helps reduce Ontario’s overall borrowing costs and ensures that the Province will continue to have access to capital if market conditions become more challenging.
Given the continued strength of demand for Ontario’s bonds in the Canadian-dollar market, the Province will maintain its Canadian-dollar borrowing target of at least 75 per cent in 2017–18.
Leading Canadian-Dollar Green Bond Market
On January 27, 2017, Ontario successfully launched its third Canadian-dollar Green Bond of $800 million.
As the first Canadian province to issue Green Bonds and as the largest and most frequent issuer in the Canadian-dollar Green Bond market, Ontario continues to lead the way in establishing and developing this market with domestic and global investor participation. Since Ontario’s inaugural issue in 2014, the Province’s Green Bonds have attracted investors from the United States, Europe and Asia, bringing new international buyers to Ontario’s borrowing program. Ontario remains committed to the Green Bond market and expects to continue to access it on an annual basis.
Green Bonds are an important tool to help Ontario finance transit and other environmentally friendly projects across the province. Twelve eligible projects have been selected to receive funding from the third Green Bond, with an emphasis on clean transportation, and energy efficiency and conservation.
To date, total Green Bond financing amounts to $2.05 billion, with up to $1.77 billion allocated to Metrolinx for clean transportation projects. All three Green Bond issues helped fund the Eglinton Crosstown LRT project in Toronto, one of the largest public transit expansions in the history of the region.
Extending Term of Borrowing
The global decline in interest rates over the past 25 years cannot continue indefinitely. To limit the fiscal impact of an increase in interest rates, the Province has continued to extend the term of its debt. Extending the term to maturity allows the Province to lock in low interest rates for a longer period, which reduces refinancing risks and helps offset the impact of expected higher interest rates on the Province’s future interest on debt (IOD) costs.
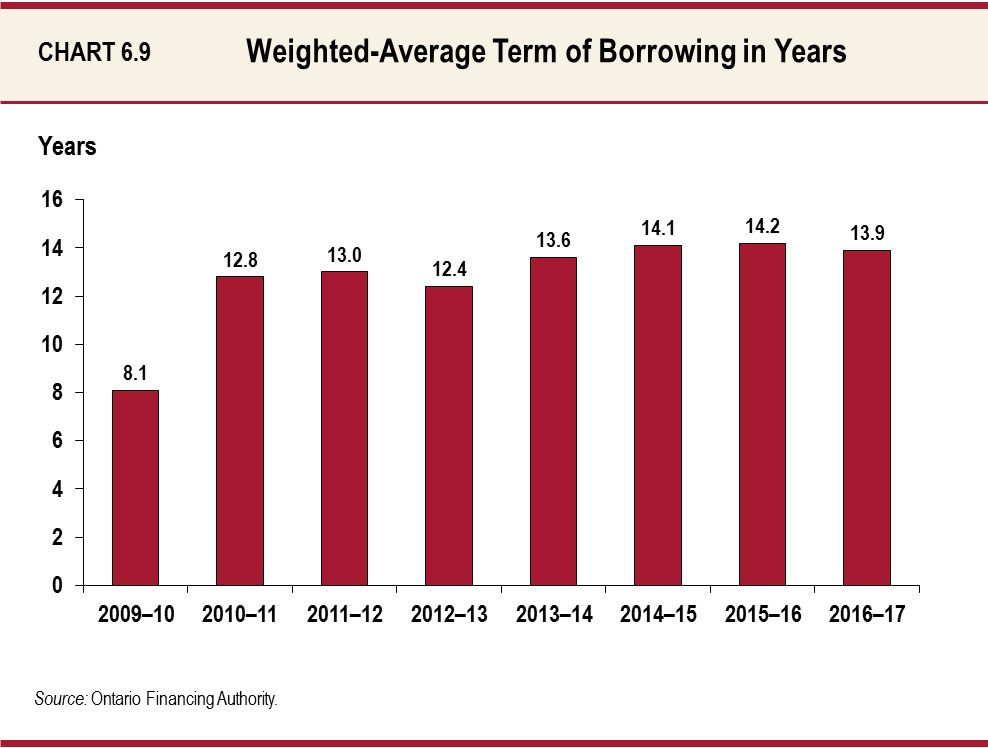
Since the beginning of fiscal year 2010–11, Ontario has issued $63.0 billion of bonds with terms of longer than 30 years to lock in low rates. As a result, the weighted-average term to maturity of long-term Provincial debt issued has been extended significantly, from 8.1 years in 2009–10 to 13.9 years in 2016–17.
Interest on Debt Savings and Affordability
Interest on debt expense is projected to be $11,250 million for 2016–17, which is $506 million lower than forecast in the 2016 Budget, reflecting lower-than-forecast interest rates, the lower forecast deficit for 2016–17 and cost-effective debt management. Interest on debt expense is forecast to be $11,581 million in 2017–18 and $12,035 million in 2018–19 — $872 million and $1,072 million lower, respectively, than forecasted in the 2016 Budget.
These savings continue a trend that has been in place since 2010, through a combination of lower deficits and borrowing requirements, and lower-than-forecast interest rates. Interest on debt savings over the period to balance now total $24.0 billion relative to the 2010 Budget forecast.
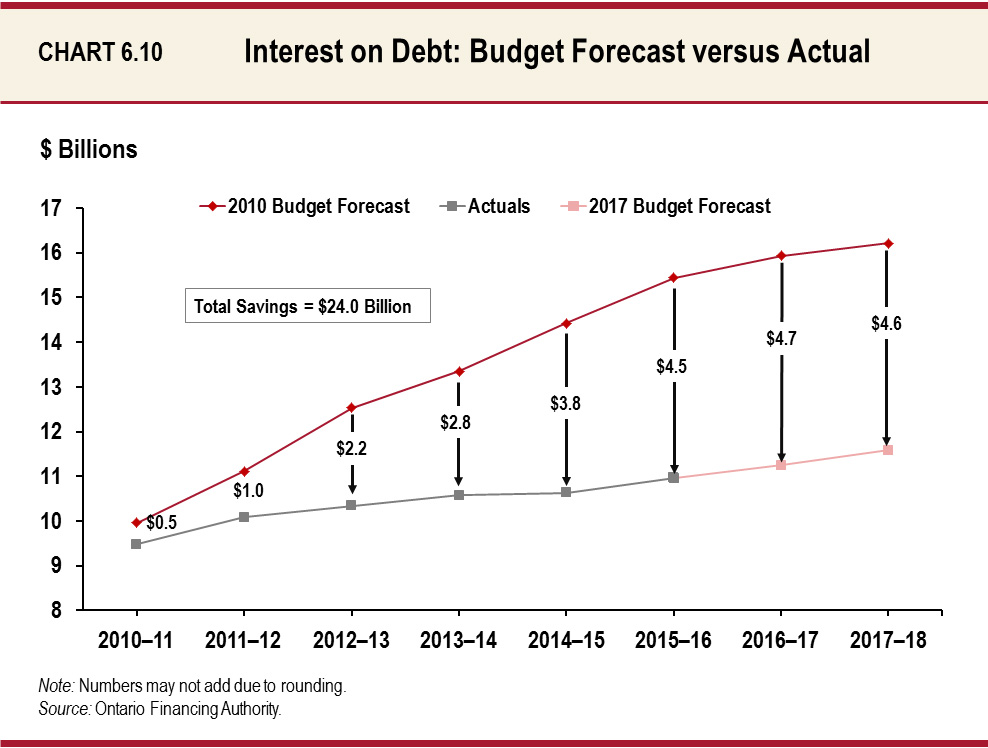
Chart 6.11 illustrates how the savings on IOD have lowered IOD-to-revenue, a key measure of the affordability of debt. The 2010 Budget forecast that by 2017–18, the Province would need to spend 11.3 cents of every revenue dollar received on interest. The current forecast is 3.1 cents lower, at 8.2 cents of interest costs for every dollar of revenue. This ratio is lower than it has been for the last 25 years, and is forecast to remain lower through the outlook period to 2019–20.
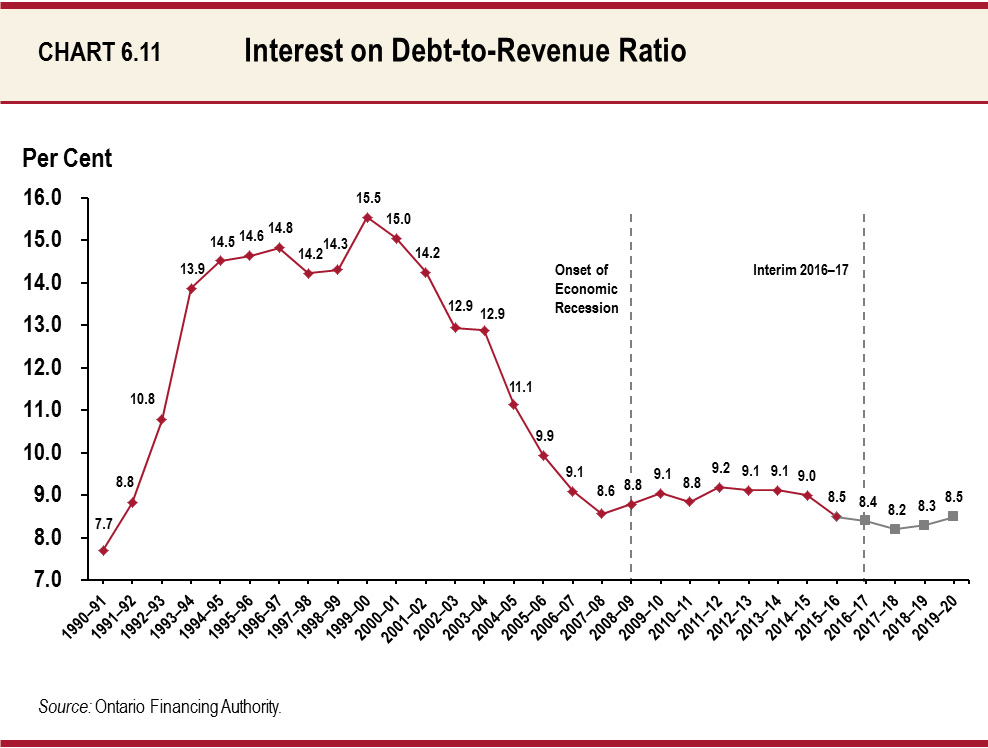
For the 13 years commencing in 1991–92, average IOD-to-revenue was 13.6 per cent, declining to 9.1 per cent over the next 13 years.
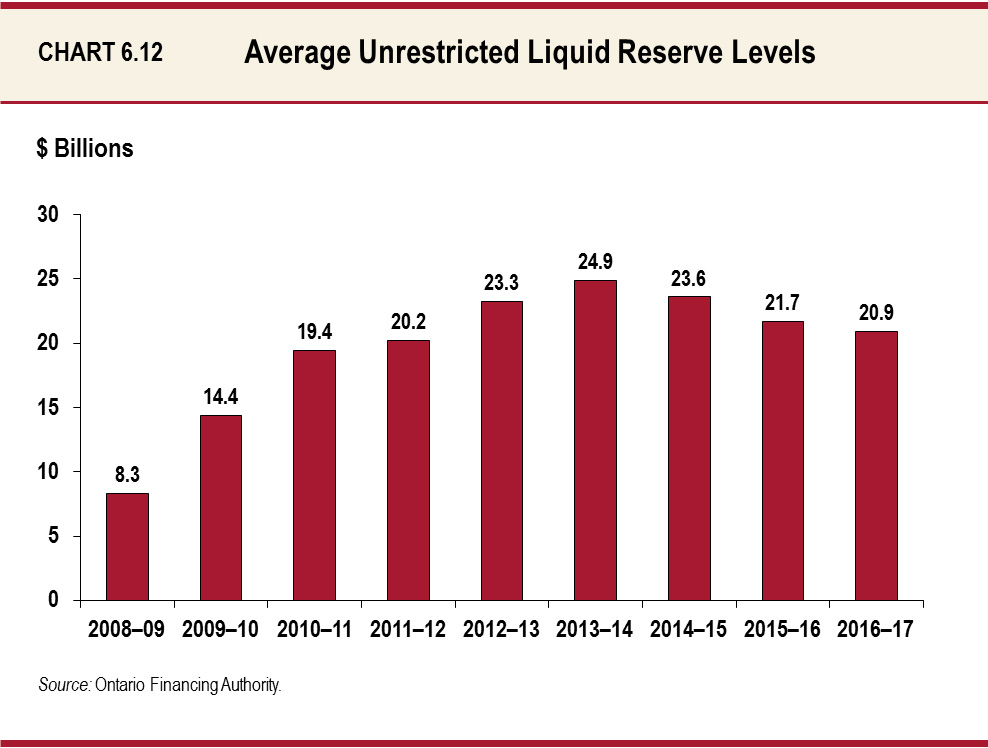
Ensuring Adequate Liquidity Levels
Ontario actively manages its financial obligations through the maintenance of a liquid reserve portfolio and the use of short-term borrowing. The Province increased its level of unrestricted liquid reserves following the financial crisis in 2008–09. Coming out of the financial crisis, the Province began a strategy of creating large, liquid 10- and 30-year benchmark domestic bond issues in 2009–10 in response to investor demand. This strategy has been very successful and continues to lower Ontario’s borrowing costs and enhance the Province’s access to capital. However, as a result of these large bond issues, the Province will have large cash outflows on single days commencing in 2019–20, rather than having maturities spread more evenly through the year. In anticipation of the need for cash reserves to meet these requirements for large outflows on a single day, the Province began, as noted in Table 6.24, building cash reserves in 2016–17, and will continue to increase these reserves in 2017–18.
The Province’s short-term borrowing program in the Canadian- and U.S.-dollar money markets is relatively small, accounting for only 6.3 per cent of Ontario’s debt. The unused short-term borrowing capacity that this leaves, combined with the high levels of unrestricted liquid reserves, ensures that the Province will always have adequate liquidity to meet its financial obligations.
Reducing Net Debt-to-GDP
Ontario’s net debt is the difference between total liabilities and total financial assets. It is projected to be $301.9 billion as of March 31, 2017, down from the net debt projection of $308.3 billion in the 2016 Budget.
Accumulated deficit is projected to be $193.5 billion as of March 31, 2017, compared to a projection of $197.8 billion in the 2016 Budget. The projected difference of $108.4 billion between net debt and accumulated deficit is due to the Province’s consistent level of investment in infrastructure.
Ontario's net debt-to-GDP ratio peaked in 2014–15 at 39.1 per cent and has trended downwards since then, now forecast at 37.8 per cent in 2016–17, well below the 39.6 per cent forecast for 2016–17 contained in the 2016 Budget. This ratio is forecast to continue to decline to 37.5 per cent in 2017–18, 37.3 per cent in 2018–19, and 37.2 per cent in 2019–20. The government is setting an interim net debt-to-GDP ratio target of 35 per cent by 2023–24 and continues to maintain a target of reducing the net debt-to-GDP ratio to its pre-recession level of 27 per cent, currently projected to be achieved by 2029–30.
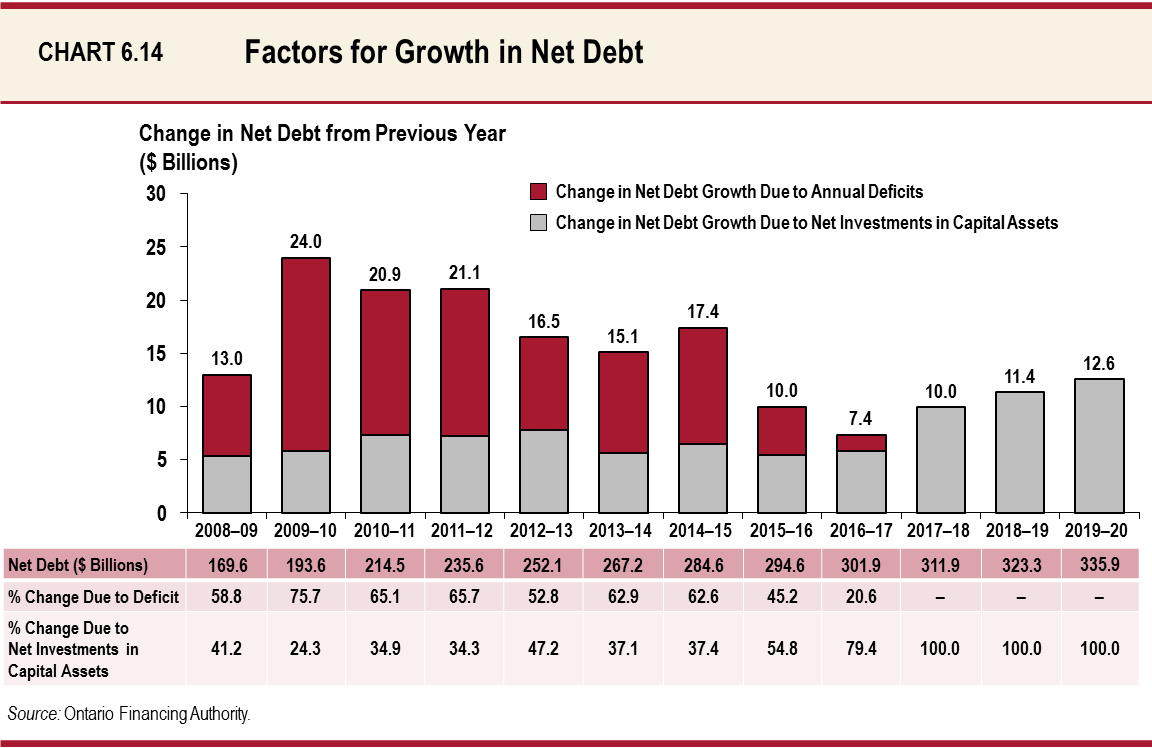
About 61 per cent of the increase in net debt from 2008–09 to 2016–17 is due to the deficit, with net investments in capital assets responsible for the balance. The balanced budget from 2017–18 onwards will ensure that the increase in net debt is limited to the difference between cash investments in capital assets and amortization, which is a non-cash expense and as such does not represent cash outflows.
These investments will work to increase economic growth and will result in GDP growing more quickly than debt, thereby helping to lower the net debt-to-GDP ratio to its pre-recession level.
Total Debt Composition
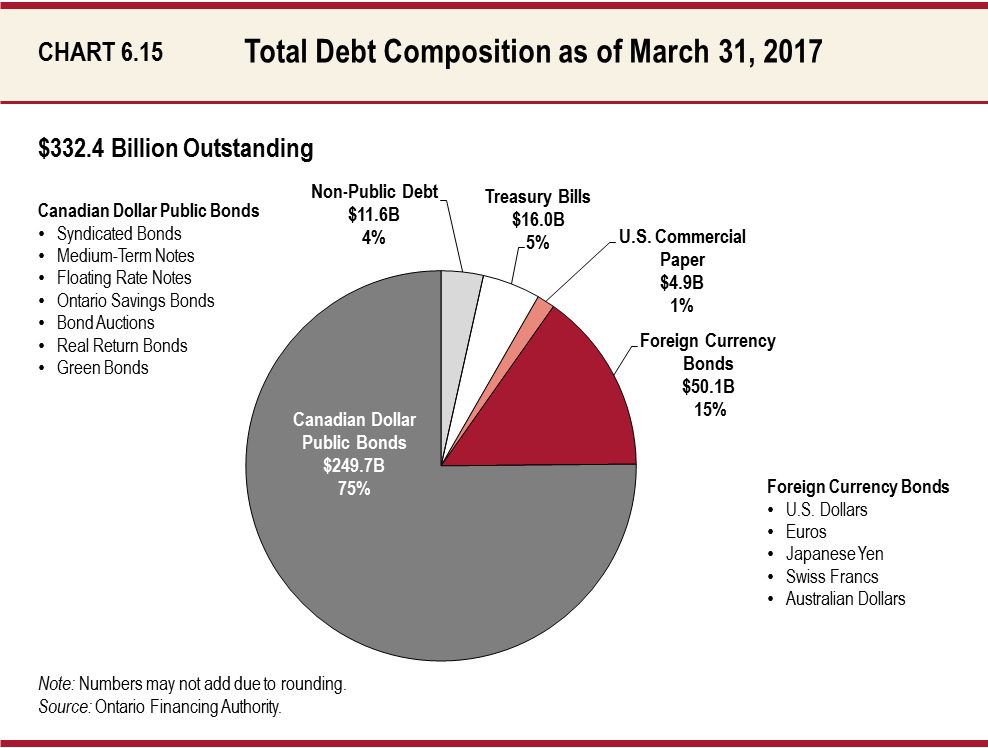
Total debt consists of bonds issued in the public capital markets, non-public debt, treasury bills and U.S. commercial paper. Total debt, which represents all borrowing without offsetting financial assets, is projected to be $332.4 billion as of March 31, 2017.
Public debt, as of March 31, 2017, is projected to be $320.8 billion, primarily consisting of bonds issued in the domestic and international public markets in six currencies. Ontario also has $11.6 billion outstanding in non-public debt issued in Canadian dollars. Non-public debt consists of debt instruments issued mainly to the Canada Pension Plan Investment Board. This debt is not marketable and cannot be traded.
Canadian-dollar denominated debt represents 83 per cent of the total debt projected as of March 31, 2017.
Cost of Debt
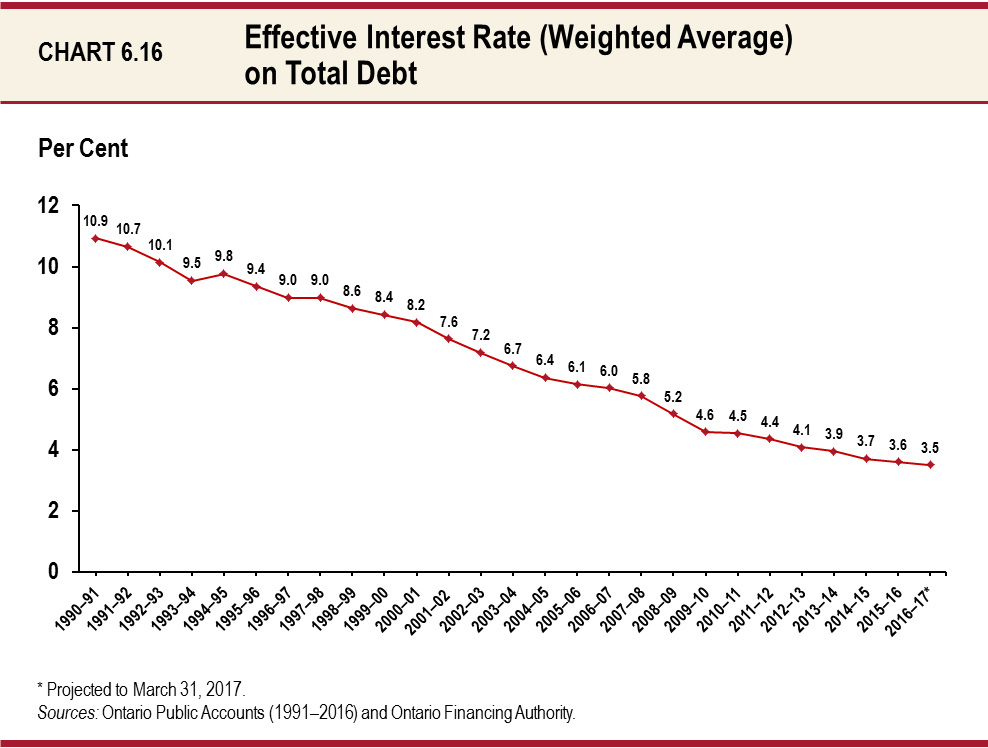
The interest rate that Ontario pays on its debt has declined steadily since 1990–91, when the effective interest rate (on a weighted-average basis) on total debt was 10.9 per cent. As of March 31, 2017, it is forecast to be 3.5 per cent, lower than the 3.6 per cent from March 31, 2016.
For 2017–18, the impact of a one percentage point change in interest rates on IOD would be approximately $300 million for the Province.
Limiting Risk Exposure
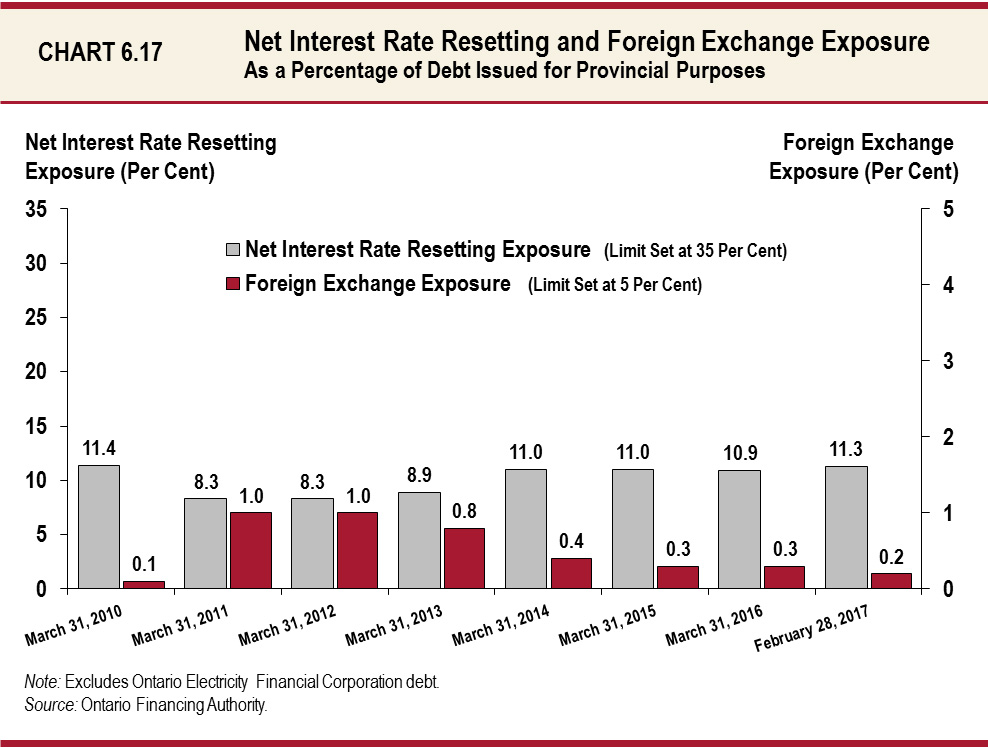
Ontario limits itself to a maximum net interest rate resetting exposure of 35 per cent and a maximum foreign exchange exposure of five per cent of debt issued for provincial purposes. As of February 28, 2017, the values for net interest rate resetting exposure and foreign exchange exposure were 11.3 per cent and 0.2 per cent, respectively. All exposures remained well below policy limits in 2016–17.
Using Derivatives to Mitigate Risks
To seek the most cost-effective means of meeting its borrowing requirements, Ontario issues fixed and floating rate debt in both domestic and international markets. To mitigate the risk arising from foreign exchange and interest rate movements, the Province uses derivatives, a type of financial contract, to limit its exposure to both of these variables. Foreign currency swaps and forwards are used to convert foreign currency exposure into Canadian-dollar exposure, while interest rate swaps ensure interest payments on the Province’s floating rate debt remain constant.
| Item | Total | Interest Rate Swaps |
Cross-Currency Swaps | Forward Foreign Exchange Contracts |
Swaptions |
|---|---|---|---|---|---|
| 2015–16 | 180.0 | 100.8 | 47.6 | 31.0 | 0.5 |
| Interim 2016–17 | 160.9 | 85.0 | 40.7 | 35.2 | – |
Table 6.25 Footnotes:
[1] Notional amounts represent the volume of outstanding derivative contracts and are not indicative of credit risk, market risk or actual cash flows.
Note: Numbers may not add due to rounding.
Source: Ontario Financing Authority.
Reducing Ontario’s Electricity Sector Stranded Debt
Ontario Electricity Financial Corporation (OEFC) interim results for 2016–17 show an estimated excess of revenue over expense of more than $0.9 billion, which would reduce OEFC’s unfunded liability (or “stranded debt of the electricity sector”) from $4.4 billion, as of March 31, 2016, to below $3.5 billion, as of March 31, 2017. This would be the 13th consecutive year of stranded debt reduction.
Projected 2017–18 OEFC results are an excess of revenue over expense of about $1.1 billion.
The government dedicates revenues it receives from the electricity sector to the OEFC. All OEFC revenues, including the debt retirement charge (DRC) paid by electricity users, are used to service and retire its debt and other obligations, as provided for under the Electricity Act, 1998.
Through prudent management of electricity sector debt and other obligations, the government removed the DRC cost from residential electricity users’ electricity bills beginning January 1, 2016, and, as announced in the 2015 Ontario Economic Outlook and Fiscal Review, is ending the DRC as of April 1, 2018, for industrial, business and other electricity users, such as institutions and not-for-profits — nine months earlier than previously estimated.
In addition, OEFC will receive a financial benefit related to the secondary offering of Hydro One shares in accordance with section 50.3 of the Electricity Act, 1998. This financial benefit will contribute to paying down stranded debt.
Consolidated Financial Tables
| Item | 2012–13 | 2013–14 | 2014–15 | 2015–1613 | Interim 2016–17 | Plan 2017–18 |
|---|---|---|---|---|---|---|
| Debt1 — Publicly Held Debt — Bonds2 | 245,544 | 259,933 | 280,442 | 293,935 | 299,257 | 308,165 |
| Debt3 — Publicly Held Debt — Treasury Bills | 13,024 | 12,297 | 14,631 | 14,604 | 16,044 | 16,044 |
| Debt4 — Publicly Held Debt — U.S. Commercial Paper5 | 6,611 | 8,657 | 6,304 | 6,304 | 4,864 | 4,864 |
| Debt6 — Publicly Held Debt — Infrastructure Ontario (IO)7 | 1,909 | 1,603 | 950 | 300 | 300 | 300 |
| Debt8 — Publicly Held Debt — Other | 360 | 345 | 317 | 301 | 289 | 279 |
| Debt9 — Total Publicly Held Debt | 267,448 | 282,835 | 302,644 | 315,444 | 320,754 | 329,652 |
| Debt10 — Non-Public Debt | 13,617 | 12,923 | 12,316 | 11,969 | 11,629 | 11,406 |
| Total Debt | 281,065 | 295,758 | 314,960 | 327,413 | 332,383 | 341,058 |
| Cash and Temporary Investments | (29,037) | (24,303) | (24,946) | (25,765) | (25,765) | (28,543) |
| Total Debt Net of Cash and Temporary Investments | 252,028 | 271,455 | 290,014 | 301,648 | 306,618 | 312,515 |
| Other Net (Assets)/Liabilities11 | (13,839) | (18,354) | (19,848) | (20,945) | (17,978) | (12,883) |
| Broader Public Sector (BPS) Net Debt | 13,899 | 14,089 | 14,410 | 13,861 | 13,276 | 12,289 |
| Net Debt | 252,088 | 267,190 | 284,576 | 294,564 | 301,916 | 311,921 |
| Non-Financial Assets12 | (84,956) | (90,556) | (97,065) | (102,536) | (108,372) | (118,377) |
| Accumulated Deficit | 167,132 | 176,634 | 187,511 | 192,028 | 193,544 | 193,544 |
Table 6.26 Footnotes:
[1] , [3], [4], [6], [8], [9], [10] Includes debt issued by the Province and Government Organizations.
[2], [5] All balances are expressed in Canadian dollars. The balances above reflect the effect of related derivative contracts.
[7] Infrastructure Ontario’s (IO) interim 2016–17 debt is composed of Infrastructure Renewal Bonds ($300 million). IO’s debt is not guaranteed by the Province.
[11] Other Net (Assets)/Liabilities include accounts receivable, loans receivable, advances and investments in government business enterprises, accounts payable, accrued liabilities, deferred revenue and capital contributions, pensions and other employee future benefits, and other liabilities.
[12] Non-financial assets include the tangible capital assets of the Province and broader public sector.
[13] The 2015–16 actuals have been restated to reflect recognizing jointly sponsored net pension assets for the Ontario Public Service Employees’ Union Pension Plan and the Ontario Teachers’ Pension Plan on the Province’s financial statements, consistent with the 2016 Budget.
Source: Ontario Ministry of Finance.
| Item | 2018–19 | 2019–20 |
|---|---|---|
| Total Debt | 351.3 | 362.4 |
| Cash and Temporary Investments | (28.5) | (28.5) |
| Total Debt Net of Cash and Temporary Investments | 322.7 | 333.9 |
| Other Net (Assets)/Liabilities | (10.0) | (7.0) |
| Broader Public Sector (BPS) Net Debt | 10.5 | 9.0 |
| Net Debt | 323.3 | 335.9 |
| Non-Financial Assets | (129.7) | (142.3) |
| Accumulated Deficit | 193.5 | 193.5 |
Table 6.27 Footnotes:
Note: Numbers may not add due to rounding.
Chart Descriptions
Chart 6.7: 2016–17 Borrowing
In 2016–17, the Province successfully completed its borrowing program of $27.0 billion. This consisted of $17.0 billion of Canadian dollar syndicated bonds, $1.2 billion of Canadian dollar Floating Rate Notes, a $0.8-billion Canadian dollar Bond Auction, a $0.8-billion Canadian dollar Green Bond, $0.1 billion of Ontario Savings Bonds, $6.8 billion of U.S. dollar bonds and $0.3 billion of Australian dollar bonds.
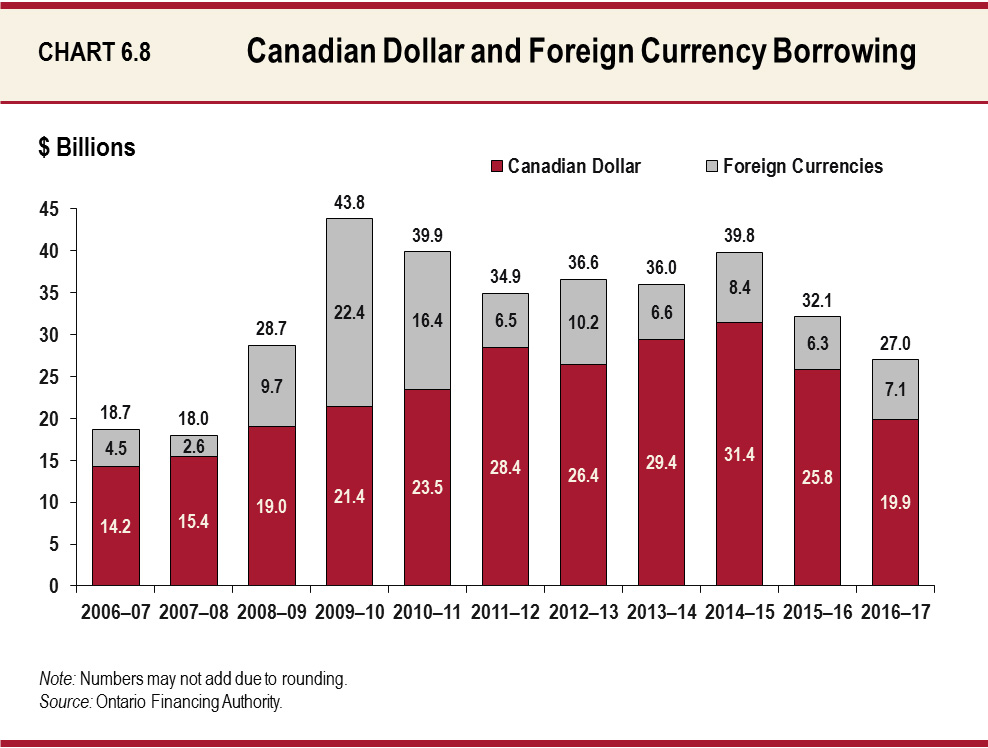
Chart 6.8: Canadian Dollar and Foreign Currency Borrowing
In 2016–17, the Province’s borrowing program totalled $27.0 billion. $19.9 billion was borrowed in the Canadian-dollar market and $7.1 billion was borrowed in foreign currencies.
Chart 6.9: Weighted-Average Term of Borrowing in Years
The weighted-average term of borrowing for 2016–17 was 13.9 years. The average term to maturity of new long-term Provincial borrowing has been extended significantly from 8.1 years in 2009–10.
Chart 6.10: Interest on Debt: Budget Forecast versus Actual
Interest on debt expense in 2016–17 is now forecast to be $4.7 billion lower than the forecast contained in the 2010 Budget. Interest on debt savings over the period to balance now total $24.0 billion relative to the 2010 Budget forecast.
Chart 6.11: Interest on Debt-to-Revenue Ratio
Interest on debt-to-revenue is forecast to be 8.4 per cent for 2016–17. This ratio is lower than it was in the 1990s and is forecast to remain lower through the outlook period in 2019–20.
Chart 6.12: Average Unrestricted Liquid Reserve Levels
As of March 31, 2017, the average unrestricted liquid reserve for 2016–17 was $20.9 billion.
Chart 6.13: Net Debt-to-GDP and Accumulated Deficit-to-GDP
Ontario’s net debt-to-GDP ratio is forecast at 37.8 per cent in 2016–17, 37.5 per cent in 2017–18, 37.3 per cent in 2018–19, and 37.2 per cent in 2019–20.
Chart 6.14: Factors for Growth in Net Debt
About 61 per cent of the increase in net debt from 2008–09 to 2016–17 is due to the deficit, with investments in capital assets responsible for the balance. The balanced budget from 2017–18 onwards will ensure that the increase in net debt is limited to the difference between cash investments in capital assets and amortization, which is a non-cash expense and as such does not represent cash outflows.
Chart 6.15: Total Debt Composition as of March 31, 2017
As of March 31, 2017, the Province’s total debt is projected to be $332.4 billion, and consists of $249.7 billion of Canadian dollar public bonds, $11.6 billion of Canadian dollar non-public debt, $16.0 billion of treasury bills, $4.9 billion of U.S.-dollar commercial paper, and $50.1 billion of foreign currency bonds.
Chart 6.16: Effective Interest Rate (Weighted Average) on Total Debt
As of March 31, 2017, the effective interest rate (calculated as a weighted average) is forecast to be 3.5 per cent on the Province’s total debt, compared to the 3.6 per cent in 2015–16. The effective interest rate has been steadily decreasing from 10.9 per cent in 1990–91.
Chart 6.17: Net Interest Rate Resetting and Foreign Exchange Exposure (as a Percentage of Debt Issued for Provincial Purposes)
The Province’s interim net interest rate resetting exposure, calculated as a percentage of the debt issued for Provincial purposes, was 11.3 per cent as of February 28, 2017. This compares to the 10.9 per cent as of March 31, 2016 and 11.0 per cent as of March 31, 2015. The interest rate exposure limit is set at 35 per cent. The Province’s interim foreign exchange exposure, calculated as a percentage of the debt issued for Provincial purposes, was 0.2 per cent as of February 28, 2017. This is lower than the 0.3 per cent as of March 31, 2016 and 0.3 per cent as of March 31, 2015. The foreign exchange exposure limit is set at 5 per cent.