Ontario’s Fiscal Plan
The government is meeting the 2010 Budget commitment to balance the budget in 2017–18 with a projected surplus of $0.6 billion.
Over the medium term, the government is projecting deficits of $6.7 billion in 2018–19, $6.6 billion in 2019–20, and $6.5 billion in 2020‑21.
| Item | Actual 2016-17 | Interim 2017–18 | Medium-Term Plan 2018–19 | Medium-Term Plan 2019–20 | Medium-Term Plan 2020–21 |
|---|---|---|---|---|---|
| Revenue | 140.7 | 150.1 | 152.5 | 157.6 | 163.8 |
| Expense — Programs | 130.0 | 137.5 | 145.9 | 150.4 | 155.8 |
| Expense — Interest on Debt | 11.7 | 12.0 | 12.5 | 13.1 | 13.8 |
| Total Expense | 141.7 | 149.5 | 158.5 | 163.5 | 169.6 |
| Surplus/(Deficit) Before Reserve | (1.0) | 0.6 | (6.0) | (5.9) | (5.8) |
| Reserve | – | – | 0.7 | 0.7 | 0.7 |
| Surplus/(Deficit) | (1.0) | 0.6 | (6.7) | (6.6) | (6.5) |
| Net Debt as a Per Cent of GDP | 38.0 | 37.1 | 37.6 | 38.2 | 38.6 |
| Accumulated Deficit as a Per Cent of GDP | 24.3 | 23.2 | 23.1 | 22.9 | 22.7 |
Table 3.8 Footnotes:
Note: Numbers may not add due to rounding.
2017–18 Interim Fiscal Performance
The government is projecting a surplus of $642 million for 2017–18 — an improvement of $642 million compared with the 2017 Budget forecast.
| Item | Budget Plan1 | Interim | In-Year Change |
|---|---|---|---|
| Revenue | 150,019 | 150,136 | 117 |
| Expense — Programs | 137,173 | 137,529 | 356 |
| Expense — Interest on Debt | 12,246 | 11,965 | (281) |
| Total Expense | 149,419 | 149,494 | 75 |
| Surplus/(Deficit) Before Reserve | 600 | 642 | 42 |
| Reserve | 600 | – | (600) |
| Surplus/(Deficit) | 0 | 642 | 642 |
Table 3.9 Footnotes:
[1] Amounts reflect a presentation change for hospitals, school boards and colleges. This does not impact the annual surplus/deficit results. Please see the 2017 Ontario Economic Outlook and Fiscal Review for further information.
Note: Numbers may not add due to rounding.
Total revenue is estimated to be on track with the 2017 Budget Plan, with revenues $117 million (0.1 per cent) higher than forecast.
Program expense is projected to be $356 million higher than outlined in the 2017 Budget . This is primarily the result of investments in hospitals, postsecondary education, and justice initiatives and transformation. Interest on debt expense is projected to be $281 million lower than forecast in the 2017 Budget due to a fiscally neutral reporting change, marginally lower than forecast interest rates, a projected surplus and cost effective debt management.
Total expense is projected to be slightly higher than forecast in the 2017 Budget, as higher program expense is projected to be largely offset by lower interest on debt.
The fiscal plan outlined in the 2017 Budget included a $600 million reserve to protect the fiscal outlook against unforeseen adverse changes in the Province’s revenue and expense forecasts in 2017–18. The reserve is not required for year-end and has been drawn down.
Given the preliminary nature of these estimates, the interim forecast is subject to change as actual Provincial revenue and expense are finalized in the Public Accounts of Ontario 2017–2018 to be released later this year.
In-Year Revenue Performance
Total revenue is estimated to be on track with the 2017 Budget Plan, with lower taxation revenues and Government of Canada transfers offset by higher net income of Government Business Enterprises and other non-tax revenues.
| Item | Interim 2017–18 |
|---|---|
| Taxation Revenue — Personal Income Tax and Ontario Health Premium | (2,823) |
| Taxation Revenue — Corporations Tax | 1,983 |
| Taxation Revenue — Land Transfer Tax | (48) |
| Taxation Revenue — All Other Taxes | 144 |
| Total Taxation Revenue | (744) |
| Total Government of Canada | (752) |
| Income from Government Business Enterprises — Ontario Power Generation Inc./Hydro One Ltd. | 828 |
| Income from Government Business Enterprises — Ontario Lottery and Gaming Corporation | 375 |
| Income from Government Business Enterprises — Liquor Control Board of Ontario | 59 |
| Income from Government Business Enterprises — Ontario Cannabis Retail Corporation | (8) |
| Total Income from Government Business Enterprises | 1,254 |
| Total Other Non-Tax Revenue | 359 |
| Total Revenue Changes since the 2017 Budget | 117 |
Table 3.10 Footnotes:
Note: Numbers may not add due to rounding.
Revenue Changes
Highlights of changes to estimated 2017–18 revenue from the 2017 Budget forecast are as follows:
- Personal Income Tax (PIT) and Ontario Health Premium revenue combined are $2,823 million lower, due to lower amounts from 2016 tax returns processed, which lowers the level on which growth is estimated for 2017 and beyond.
- Corporations Tax (CT) revenue is $1,983 million higher, due to higher amounts indicated by processing of 2016 tax returns and stronger growth in corporate profits in 2017.
- Land Transfer Tax (LTT) revenue is $48 million lower, due to lower housing resales.
- All Other Tax revenues combined are $144 million higher.
- Government of Canada revenues are $752 million lower, mainly reflecting a decrease of $795 million in funding for infrastructure projects due to revised project timelines and lower direct transfers to broader public-sector organizations of $102 million. These decreases are partially offset by new funding of $145 million for early learning and child care as a result of a bilateral agreement between Ontario and the federal government that was previously reported in 2017–18 First Quarter Finances . This overall decrease in revenue is offset by a corresponding expense decrease.
- The combined net income of Ontario Power Generation Inc. (OPG) and Hydro One Ltd. (Hydro One) is $828 million above the 2017 Budget forecast. This increase mainly reflects the re-categorization from Sales and Rentals to OPG net income of one-time OPG real estate transaction impacts, the financial performance of OPG ’s Nuclear Funds, and lower OPG expenses. This is partially offset by the impact of the Ontario Energy Board’s 2017 rate decisions with respect to OPG and Hydro One, and the re-categorization from Sales and Rentals to Hydro One net income, reflecting the Province’s lower ownership share of Hydro One.
- Net income from the Ontario Lottery and Gaming Corporation (OLG) is $375 million higher than projected in the 2017 Budget, due largely to strong performance of slot and casino operations and a one-time gain on the sale of assets as a result of modernization.
- Net income from the Liquor Control Board of Ontario (LCBO) is $59 million higher than projected in the 2017 Budget, reflecting expense savings.
- The net loss of the Ontario Cannabis Retail Corporation (OCRC) is due to the initial startup costs of establishing the corporation and its retail network.
- Other Non-Tax Revenue is $359 million higher largely reflecting carbon allowance proceeds and revenues from broader public-sector organizations. These increases are partially offset by lower, fiscally neutral revenue from power supply contract recoveries and lower Sales and Rentals revenue, mainly reflecting the re-categorization from Sales and Rentals of one-time OPG real estate transaction impacts.
The above estimates are based on revenue information available to March 7, 2018. Information arriving subsequent to this date will be reflected in the Province’s finalized financial statements to be included in the Public Accounts of Ontario 2017–2018 .
In-Year Expense Performance
Total expense is currently projected to be $149.5 billion, $75 million higher than the 2017 Budget forecast. Growth in program expense is primarily the result of investments in hospitals, postsecondary education, and justice initiatives and transformation. This is largely offset by lower-than-projected interest on debt expense.
| Item | Interim 2017–18 |
|---|---|
| Program Expense1 — Health Sector | 357 |
| Program Expense — Education Sector2 | (50) |
| Program Expense — Postsecondary and Training Sector | 204 |
| Program Expense — Children’s and Social Services Sector | 6 |
| Program Expense — Justice Sector | 143 |
| Program Expense — Other Programs | (303) |
| Total Program Expense | 356 |
| Interest on Debt | (281) |
| Total Expense Changes since the 2017 Budget | 75 |
Table 3.11 Footnotes:
[1] Expense change by sector, restated for fiscally neutral transfers of programs between sectors.
[2] Excludes Teachers’ Pension Plan. Teachers’ Pension Plan expense is included in Other Programs.
Note: Numbers may not add due to rounding.
Expense Changes
The following expense changes are projected relative to the 2017 Budget :
- Health sector expense is projected to be higher by $357 million, primarily due to additional investments in hospitals to reduce emergency department wait times, and in home and community care to expand services to meet rising demand from seniors and clients with complex needs.
- Education sector expense is projected to be $50 million lower, due to lower-than-forecast school board capital spending.
- Postsecondary and training sector expense is projected to be $204 million higher, primarily due to additional funding for the Ontario Student Assistance Program (OSAP) to support higher-than-forecast applications and awards.
- Children’s and social services sector expense is projected to be higher by $6 million, primarily due to additional investments in autism and partially offset by a lower forecast of the Ontario Child Benefit.
- Justice sector expense is expected to be $143 million higher, primarily due to resources for justice transformation including corrections reform and police oversight reform, increased post-traumatic stress disorder costs for first responders, higher-than-expected bad debt provisions related to unpaid fines, expansion of the Brampton Courthouse project, and increased demand for death investigations.
- Other programs expense is expected to be $303 million lower, mainly due to changes in timing of federal funding for municipal infrastructure projects and updated forecasts for electricity cost relief programs.
Interest on debt expense is projected to be $281 million lower than forecast in the 2017 Budget, of which $209 million is due to revised reporting and is fiscally neutral. The balance of $72 million in savings is primarily due to marginally lower-than-forecast interest rates and the projected surplus.
Medium-Term Fiscal Plan
The government is projecting deficits of $6.7 billion in 2018–19, $6.6 billion in 2019–20 and $6.5 billion in 2020‑21.
Over the medium term, revenue is forecast to increase from $152.5 billion in 2018–19 to $163.8 billion in 2020‑21, while total expense is projected to increase from $158.5 billion to $169.6 billion over the same period.
Medium-Term Revenue Outlook
Ontario’s revenues rely heavily on the level and pace of economic activity in the province, with growth expected to be roughly in line with nominal gross domestic product (GDP) growth. For example, taxes are collected on the incomes and spending of the people of Ontario, and on the profits generated by businesses operating in Ontario.
However, there are important qualifications to this general relationship. The impact of housing completions and resales on Harmonized Sales Tax (HST) and Land Transfer Tax (LTT) revenues is proportionately greater than their contribution to GDP . Growth in several tax revenue sources, such as volume-based gasoline and fuel taxes, is more closely aligned to real GDP . Similarly, some revenues, such as vehicle and driver registration fees, tend to more closely track growth in the driving-age population.
Growth in some revenue sources, such as the Corporations Tax and Mining Tax, can diverge significantly from economic growth in any given year due to the inherent volatility of business profits, as well as the use of tax provisions, such as the option to carry losses forward or backward across different tax years.
Total revenue is projected to increase from $152.5 billion to $163.8 billion between 2018–19 and 2020–21, or at an average annual rate of 3.7 per cent. Revenue growth largely reflects the Ministry of Finance’s outlook for economic growth. See Chapter III, Section B: Economic Outlook .
| Item | 2018–19 | 2019–20 | 2020–21 |
|---|---|---|---|
| Revenue — Personal Income Tax | 35.6 | 37.7 | 39.7 |
| Revenue — Sales Tax | 26.8 | 27.9 | 28.9 |
| Revenue — Corporations Tax | 15.1 | 15.6 | 16.0 |
| Revenue — Ontario Health Premium | 3.9 | 4.1 | 4.3 |
| Revenue — Education Property Tax | 6.1 | 6.1 | 6.2 |
| Revenue — All Other Taxes | 16.0 | 16.7 | 17.3 |
| Total Taxation Revenue | 103.6 | 108.1 | 112.4 |
| Government of Canada | 26.0 | 25.7 | 26.8 |
| Income from Government Business Enterprises | 5.3 | 6.0 | 6.6 |
| Other Non-Tax Revenue | 17.6 | 17.7 | 18.0 |
| Total Revenue | 152.5 | 157.6 | 163.8 |
Table 3.12 Footnotes:
Note: Numbers may not add due to rounding.
The medium-term taxation revenue growth profile reflects growth in the economy and the impacts of past and proposed tax measures. These latter impacts may result in a taxation revenue growth profile for a specific revenue source that appears to be inconsistent with the growth profile of the main economic driver. To help explain the medium-term growth profile of the major taxation revenues, Tables 3.13, 3.14 and 3.15 adjust total projected revenues for each of Personal Income Tax, Sales Tax and Corporations Tax to remove the impacts of measures to arrive at “base revenue.” This base revenue measure is shown to be more closely aligned to the main economic driver for the specific taxation revenue source.
| Revenue | Interim 2017–18 | Medium-Term Outlook 2018–19 | Medium-Term Outlook 2019–20 | Medium-Term Outlook 2020–21 |
|---|---|---|---|---|
| Total Projected Revenue | 32.3 | 35.6 | 37.7 | 39.7 |
| Measures Included in Total1 | 0.2 | 0.8 | 0.9 | 0.9 |
| Other Adjustments2 | (0.5) | – | – | – |
| Base Revenue3 | 32.6 | 34.9 | 36.8 | 38.7 |
| Base Revenue Growth (Per Cent) | – | 6.9 | 5.6 | 5.3 |
| Compensation of Employees Growth4 (Per Cent) | – | 5.9 | 4.5 | 4.2 |
Table 3.13 Footnotes:
[1] Represents the revenue impact of all tax measures, announced previously or proposed in this Budget .
[2] Other adjustments due mainly to prior-year adjustments.
[3] Total Projected Revenue less the impact of tax measures and other one-time factors, such as prior-year adjustments. Base Revenue reflects the impact of underlying macroeconomic factors.
[4] Includes wages, salaries and employers’ social contributions.
Note: Numbers may not add due to rounding.
The primary economic driver of the forecast for Personal Income Tax (PIT) revenue is the outlook for growth in the compensation of employees. The PIT revenue projection also reflects the impact of tax measures as well as prior-year and other adjustments. Tax measures include those announced in past budgets and those proposed in this Budget (see Chapter V, Section A: Tax Measures ), as well as the impact of federal measures including those announced in the 2018 federal budget. Excluding the impacts of tax measures, the PIT revenue base is projected to grow at an average annual rate of 5.9 per cent over the forecast period. This compares with average annual growth of 4.9 per cent in compensation of employees over this period. PIT revenue tends to grow at a faster rate than incomes due to the progressive structure of the PIT system.
| Revenue | Interim 2017–18 | Medium-Term Outlook 2018–19 | Medium-Term Outlook 2019–20 | Medium-Term Outlook 2020–21 |
|---|---|---|---|---|
| Total Projected Sales Tax Revenue1 | 26.0 | 26.8 | 27.9 | 28.9 |
| Measures Included in Total2 | 0.2 | 0.2 | 0.2 | 0.2 |
| Other Adjustments3 | 0.3 | – | – | – |
| Base Revenue4 | 25.5 | 26.6 | 27.7 | 28.7 |
| Base Revenue Growth (Per Cent) | – | 4.3 | 4.0 | 3.8 |
| Nominal Consumption Growth (Per Cent) | – | 4.8 | 4.2 | 4.0 |
Table 3.14 Footnotes:
[1] Revenues from sales tax include the provincial portion of the Harmonized Sales Tax (HST ), Ontario’s Retail Sales Tax (RST) on certain insurance premiums, and the RST on private transfers of specified vehicles. Sales Tax Revenue is reported net of both the Ontario Sales Tax Credit and the energy component of the Ontario Energy and Property Tax Credit.
[2] Represents the revenue impact of all tax measures, announced previously or proposed in this Budget .
[3] Other adjustments refer to one-time factors such as prior year adjustments.
[4] Total Projected Revenue less the impact of tax measures, or other one-time factors such as prior-year adjustments. Base Revenue reflects the impact of underlying macroeconomic factors.
Note: Numbers may not add due to rounding.
The Sales Tax revenue projection is based primarily on growth in consumer spending. The Sales Tax revenue projection also reflects the impact of tax measures and prior-year adjustments. Tax measures of $0.2 billion beginning in 2017–18 primarily reflect the impact of measures announced in past budgets and those proposed in this Budget (see Chapter V, Section A: Tax Measures ), as well as those announced in the 2018 federal budget. Excluding the impacts of measures, the Sales Tax revenue base is projected to grow at an average annual rate of 4.0 per cent, reflecting average annual growth in nominal consumption of 4.4 per cent over this period.
| Revenue | Interim 2017–18 | Medium-Term Outlook 2018–19 | Medium-Term Outlook 2019–20 | Medium-Term Outlook 2020–21 |
|---|---|---|---|---|
| Total Projected Revenue | 15.8 | 15.1 | 15.6 | 16.0 |
| Measures Included in Total1 | 0.2 | 0.4 | 0.5 | 0.5 |
| Other Adjustments2 | 1.0 | – | – | – |
| Base Revenue3 | 14.6 | 14.8 | 15.1 | 15.5 |
| Base Revenue Growth (Per Cent) | – | 1.0 | 2.4 | 2.6 |
| Net Operating Surplus (Per Cent) — Corporations Growth (Per Cent) | – | 1.5 | 3.5 | 2.8 |
Table 3.15 Footnotes:
[1] Represents the revenue impact of all tax measures announced previously or proposed in this Budget .
[2] Other adjustments include net timing of payment adjustments due to the difference between projected Corporations Tax (CT) revenue entitlements and projected federal CT remittances.
[3] Total Projected Revenue less the impact of tax measures or other one-time factors such as prior-year adjustments. Base Revenue reflects the impact of underlying macroeconomic factors.
Note: Numbers may not add due to rounding.
The forecast for Corporations Tax (CT) revenue is based on the annual growth in the net operating surplus of corporations. The CT revenue projection reflects the impact of tax measures as well as prior-year and other adjustments. Tax measures include those announced in past federal and provincial budgets, the 2017 Ontario Economic Outlook and Fiscal Review and those proposed in this Budget (see Chapter V, Section A: Tax Measures ). After accounting for tax measures, the CT revenue base grows at an average annual rate of 2.0 per cent over the forecast period. This is in line with the 2.6 per cent average annual growth in the net operating surplus of corporations.
Ontario Health Premium revenue forecast is based primarily on the projected growth in the compensation of employees. As a result, Ontario Health Premium revenue is projected to increase at an average annual rate of 4.8 per cent over the forecast period.
Education Property Tax revenue is projected to increase at an average annual rate of 0.7 per cent over the forecast period. This is largely due to growth in the property assessment base resulting from new construction activities.
Revenues from All Other Taxes are projected to increase at an average annual rate of 4.0 per cent over the forecast period. This includes revenues from the Employer Health Tax, Land Transfer Tax, Beer, Wine and Spirits Taxes and volume-based taxes such as the Gasoline Tax, Fuel Tax and Tobacco Tax.
The forecast for Government of Canada transfers is based on existing federal–provincial funding arrangements. Revenues are projected to increase at an average annual rate of 1.5 per cent over the forecast period, largely reflecting projected increases in the Canada Health Transfer, Canada Social Transfer, and enhanced and extended funding for labour market programs, partially offset by significantly lower projections of Equalization payments in the medium term. The medium-term revenue outlook also includes revised estimates related to the government’s current commitments for infrastructure funding.
The outlook for Income from Government Business Enterprises (GBEs) is based on Ministry of Finance estimates of net income for Hydro One Ltd. (Hydro One) and information provided by Ontario Power Generation (OPG ), Liquor Control Board of Ontario (LCBO) and the Ontario Lottery and Gaming Corporation (OLG ). Overall revenue from GBEs is projected to increase at an average annual rate of 11.6 per cent, reflecting higher overall net income from business enterprises.
The forecast for Other Non-Tax Revenue is based on projections provided by government ministries and provincial agencies. Between 2018–19 and 2020–21, Other Non-Tax revenues are projected to increase at an average annual rate of 1.3 per cent mainly reflecting higher revenue growth from fees, donations, and other miscellaneous revenues projected under the broader public sector (BPS ). This overall increase is partially offset by lower revenue growth from other non-tax revenue sources, including Carbon Allowance Proceeds.
Risks to the Revenue Outlook
Ontario’s revenue outlook is based on reasonable assumptions about the pace of growth in Ontario’s economy. There are both positive and negative risks to the economic projections underlying the revenue forecast. Some of these risks are discussed in this section.
The following table highlights some of the key sensitivities and risks to the fiscal plan that could arise from unexpected changes in economic conditions. These estimates are only guidelines; actual results will vary depending on the composition and interaction of various factors.
The risks are those that could have the most material impact on the largest revenue sources. A broader range of additional risks are not included because they are either less material or difficult to quantify. For example, the outlook for Government of Canada transfers is subject to changes in economic variables that affect federal funding, as well as changes by the federal government to the funding arrangements themselves.
| Item/Key Components | 2018–19 Assumption | 2018–19 Sensitivities |
|---|---|---|
| Total Revenues — Nominal GDP | 4.1 per cent growth in 2018 | $1,010 million revenue change for each percentage point change in nominal GDP growth. Can vary significantly, depending on composition and source of changes in GDP growth. |
| Total Taxation Revenues — Revenue Base1 | 4.2 per cent growth in 2018–19 | |
| Total Taxation Revenues — Nominal GDP | 4.1 per cent growth in 2018 | $705 million revenue change for each percentage point change in nominal GDP growth. Can vary significantly, depending on composition and source of changes in GDP growth. |
| Personal Income Tax (PIT) Revenues — Revenue Base | 6.9 per cent growth in 2018–19 | |
| Personal Income Tax (PIT) Revenues — Compensation of Employees | 5.9 per cent growth in 2018 | $349 million revenue change for each percentage point change in compensation of employees growth. |
| Personal Income Tax (PIT) Revenues — 2017 Tax-Year Assessments2 | $30.3 billion | $303 million revenue change for each percentage point change in 2017 PIT assessments.3 |
| Personal Income Tax (PIT) Revenues — 2016 Tax-Year and Prior Assessments4 | $1.6 billion | $16 million revenue change for each percentage point change in 2016 and prior-year PIT assessments.5 |
| Sales Tax Revenues — Revenue Base | 4.3 per cent growth in 2018–19 | |
| Sales Tax Revenues — Nominal Household Consumption | 4.8 per cent growth in 2018 | $203 million revenue change for each percentage point change in nominal household consumption growth. |
| Sales Tax Revenues — 2016 Gross Revenue Pool6 | $27.5 billion | $275 million revenue change for each percentage point change in 2016 gross revenue pool. |
| Sales Tax Revenues — 2017 Gross Revenue Pool7 | $28.8 billion | $288 million revenue change for each percentage point change in 2017 gross revenue pool. |
| Sales Tax Revenues — 2018 Gross Revenue Pool8 | $30.0 billion | $300 million revenue change for each percentage point change in 2018 gross revenue pool. |
| Corporations Tax Revenues — Revenue Base | 1.0 per cent growth in 2018–19 | |
| Corporations Tax Revenues — 2017 Tax Assessments9 | $13.0 billion | $130 million change in revenue for each percentage point change in 2017 Tax Assessments. |
| Corporations Tax Revenues — 2018 Ontario Corporate Taxable Income | $145 billion | $140 million change in revenue for each percentage point change in the federal estimate of 2018 Ontario Corporate Taxable Income. |
| Corporations Tax Revenues — 2019 Ontario Corporate Taxable Income | $148.4 billion | $48 million change in revenue for each percentage point change in 2019 Ontario Corporate Taxable Income. |
| Corporations Tax Revenues — 2018 Net Operating Surplus — Corporations |
1.5 per cent growth in 2018 | $99 million change in revenue for each percentage point change in 2018 net operating surplus growth. |
| Employer Health Tax Revenues — Revenue Base | 5.8 per cent growth in 2018–19 | |
| Employer Health Tax Revenues — Compensation of Employees | 5.9 per cent growth in 2018 | $63 million revenue change for each percentage point change in growth in compensation of employees. |
| Ontario Health Premium (OHP) Revenues — Revenue Base | 5.7 per cent growth in 2018–19 | |
| Ontario Health Premium (OHP) Revenues — Compensation of Employees | 5.9 per cent growth in 2018 | $27 million revenue change for each percentage point change in growth in compensation of employees. |
| Ontario Health Premium (OHP) Revenues — 2017 Tax-Year Assessments10 | $3.4 billion | $34 million revenue change for each percentage point change in 2017 OHP assessments. |
| Gasoline Tax Revenues — Revenue Base | 0.9 per cent growth in 2018–19 | |
| Gasoline Tax Revenues — Gasoline Pump Prices | 119.3 cents per litre in 2018 | $3 million revenue decrease (increase) for each cent per litre increase (decrease) in gasoline pump prices. |
| Fuel Tax Revenues — Revenue Base | 2.1 per cent growth in 2018–19 | |
| Fuel Tax Revenues — Real GDP | 2.2 per cent growth in 2018 | $11 million revenue change for each percentage point change in real GDP growth. |
| Land Transfer Tax Revenues — Revenue Base | 1.7 per cent increase in 2018–19 | |
| Land Transfer Tax Revenues — Housing Resales | 2.0 per cent increase in 2018–19 | $31 million revenue change for each percentage point change in both the number and prices of housing resales. |
| Land Transfer Tax Revenues — Resale Prices | No growth in 2018–19 | |
| Canada Health Transfer — Ontario Population Share | 38.7 per cent in 2018–19 | $39 million revenue change for each tenth of a percentage point change in Ontario’s population share. |
| Canada Social Transfer — Ontario Population Share | 38.7 per cent in 2018–19 | $14 million revenue change for each tenth of a percentage point change in Ontario’s population share. |
| Carbon Allowance Proceeds — Carbon Price ($ Canadian/tonne of carbon dioxide emissions) | $19 in 2018–19 | A one per cent increase (decrease) in the carbon price would result in a $20 million increase (decrease) in carbon allowance proceeds. |
Table 3.16 Footnotes:
[1] Revenue Base is revenue excluding the impact of measures, adjustments for past Public Accounts estimate variances and other one-time factors.
[2] , [3] , [4] , [5] , [9] , [10] Ontario 2017 Personal Income Tax and Corporations Tax are estimates because 2017 tax returns are yet to be assessed by the Canada Revenue Agency.
[6] , [7] , [8] The Gross Revenue Pool is a federal Department of Finance estimate and excludes the impact of Ontario measures.
Medium-Term Expense Outlook
The Province’s program expense outlook is projected to grow from $145.9 billion in 2018–19 to $155.8 billion in 2020–21. This reflects the government’s commitment to invest in priority areas such as health, education, child care and income security.
| Item | Medium-Term Outlook — 2018–19 | Medium-Term Outlook — 2019–20 | Medium-Term Outlook — 2020–21 | Average Annual Growth 2018–19 to 2020–21 |
|---|---|---|---|---|
| Programs — Health Sector | 61.3 | 64.2 | 66.6 | 4.3% |
| Programs — Education Sector1 | 29.1 | 30.1 | 31.5 | 4.1% |
| Programs — Postsecondary and Training Sector | 11.8 | 12.0 | 12.0 | 0.9% |
| Programs — Children’s and Social Services Sector | 17.9 | 18.7 | 19.8 | 5.2% |
| Programs — Justice Sector | 5.0 | 5.0 | 5.0 | -0.1% |
| Programs — Other Programs | 20.8 | 20.4 | 20.8 | -0.2% |
| Total Programs | 145.9 | 150.4 | 155.8 | 3.3% |
| Interest on Debt | 12.5 | 13.1 | 13.8 | 5.1% |
| Total Expense | 158.5 | 163.5 | 169.6 | 3.5% |
Table 3.17 Footnotes:
[1] Excludes Teachers’ Pension Plan, which is included in Other Programs.
Note: Numbers may not add due to rounding.
Highlights of the program expense outlook over the medium term include the following:
- Health sector expense is projected to grow from $61.3 billion in 2018–19 to $66.6 billion in 2020–21 — representing 4.3 per cent growth over the period — as a result of increased utilization of physician services, home care services, addressing mental health and addictions, long-term care home staffing and beds, responding to the opioid crisis, eliminating the annual deductible and co-payment for seniors under the Ontario Drug Benefit program, and introducing a new drug and dental program for people who do not have coverage under an extended health plan.
- Education sector expense is projected to grow from $29.1 billion in 2018–19 to $31.5 billion in 2020–21 — representing 4.1 per cent growth over the period — including investments in the child care system, increased funding for school boards to support higher student enrolment, as well as investments in special education, mental health supports and capital projects.
- Postsecondary and training sector expense is projected to grow from $11.8 billion in 2018–19 to $12.0 billion in 2020–21 — representing 0.9 per cent growth over the period. This modest expense growth builds on significant additional 2017–18 investments in the Ontario Student Assistance Program (OSAP) to support higher-than-forecast OSAP applications and awards, as well as investments such as innovative postsecondary programming, more responsive and flexible skills training, and enhancements to Ontario’s apprenticeship system.
- Children’s and social services sector expense is projected to grow from $17.9 billion in 2018–19 to $19.8 billion in 2020–21 — representing 5.2 per cent growth over the period. This is mainly due to investments in reforming the social assistance system, including multi-year rate increases with a focus on increasing benefits and reducing complex rules for people, and investments to expand services for people living with developmental disabilities.
- Justice sector expense is projected to remain stable at $5 billion between 2018–19 and 2020–21. The investments in the sector are mainly due to ongoing transformation of the justice system including corrections investments, implementation of the Safer Ontario Act, 2018, and bail/remand reform; the expansion of access to legal aid for low income Ontarians; and ongoing repair, rehabilitation and construction of courts and correctional facilities.
- Other programs expense is projected to remain relatively stable at approximately $20.8 billion between 2018–19 and 2020–21. The changes over this period reflect the impact of adjustments associated with investments under federal infrastructure programs (e.g., Public Transit Infrastructure Fund and Investment in Affordable Housing Program Extension), funding profile for the Climate Change Action Plan and actuarial assessments of pension expense among other factors.
The total expense outlook includes interest on debt expense, which is projected to grow from $12.5 billion in 2018–19 to $13.8 billion in 2020–21. This increase is required to fund investments in capital assets and the deficit arising from expenditures on programs and services.
Risks to the Expense Outlook
Table 3.18 provides a summary of key expense risks and sensitivities that could result from unexpected changes in economic conditions and program demands. A change in these factors could affect total expense, causing variances in the overall fiscal forecast.
These sensitivities are illustrative and can vary, depending on the nature and composition of potential risks.
| Program/Sector | 2018–19 Assumption | 2018–19 Sensitivity |
|---|---|---|
| Health Sector | Annual growth of 5.1 per cent | One per cent change in health spending: $613 million |
| Hospitals Sector Expense1 | Annual growth of 5.9 per cent | One per cent change in hospitals sector expense: $299 million |
| Drug Programs2 | Annual growth of 13.7 per cent | One per cent change in program expenditure of drug programs: $47.4 million |
| Ontario Health Insurance Plan (OHIP) | Annual growth of 3.0 per cent | One per cent change in OHIP expense: $146.6 million |
| Long-Term Care Homes | 78,229 long-term care home beds. Average Provincial annual operating cost per bed in a long-term care home: $54,730 | One per cent change in number of beds: approximately $42.8 million |
| Home Care | Approximately 30 million hours of personal support services |
One per cent change in hours of personal support services: approximately $10.9 million |
| Home Care | Approximately 8.9 million nursing and therapy visits and 2.2 million nursing shifts |
One per cent change in all nursing and therapy visits: approximately $8.6 million |
| Elementary and Secondary Schools | Approximately 1,993,000 average daily pupil enrolment |
One per cent enrolment change: approximately $170 million |
| Child Care | Approximately 111,000 monthly average fee subsidies | One per cent change in number of monthly average fee subsidies: approximately $12 million annually |
| Ontario Student Assistance Program | Approximately 420,000 Ontario students grants | One per cent change in number of grants: approximately $17 million |
| Ontario Works | 247,714 average annual caseload | One per cent caseload change: $29 million |
| Ontario Disability Support Program | 371,605 average annual caseload | One per cent caseload change: $56 million |
| Interest on Debt | Average cost of 10-year borrowing in 2018–19 forecast to be approximately 3.4 per cent | The impact of a 100 basis-point change in borrowing rates is forecast to be approximately $300 million |
Table 3.18 Footnotes:
[1] Hospital sector expense includes funding from the Ministry of Health and Long-Term Care and a number of Provincial programs from other ministries, as well as other third-party revenues.
[2] Drug Programs includes startup funding for OHIP+ .
Contingent Liabilities
In addition to the key demand sensitivities and economic risks to the fiscal plan, there are risks stemming from the government’s contingent liabilities. Whether these contingencies will result in actual liabilities for the Province is beyond the direct control of the government. Losses could result from legal settlements, defaults on projects, and loan and funding guarantees. Provisions for losses that are likely to occur and can be reasonably estimated are expensed and reported as liabilities in the Province’s financial statements. Any significant contingent liabilities related to the 2017–18 fiscal year will be disclosed as part of the 2017–2018 Annual Report and Consolidated Financial Statements, expected to be released later this year.
Average Negotiated Wage Increases
The government’s approach to managing compensation recognizes the need to maintain a stable, flexible and high-performing public-sector workforce that supports the government’s transformational priorities, and at the same time, ensures that public services remain sustainable.
Provincial public-sector wage increases continue to track below those in the private and municipal public sectors.
| Sectors | Per Cent Increase January 1, 2017 to December 31, 2017 |
|---|---|
| Private | 2.1 |
| Public Sector (Federal) | 1.4 |
| Public Sector (Municipal) | 2.0 |
| Public Sector (Provincial) | 1.9 |
Table 3.19 Footnotes:
Sources: Ontario Treasury Board Secretariat and Ontario Ministry of Labour.
Fiscal Prudence
As required by the Fiscal Transparency and Accountability Act, 2004, Ontario’s fiscal plan incorporates prudence in the form of a reserve to protect against unforeseen adverse changes in the Province’s revenue and expense. The reserve has been set at $0.7 billion in 2018–19, 2019–20 and 2020–21.
The fiscal plan also includes contingency funds (both operating and capital) to help mitigate expense risks — particularly in cases where health and safety may be compromised or services to the most vulnerable are jeopardized — that may otherwise adversely affect Ontario’s fiscal performance.
In keeping with sound fiscal practices, the Province’s revenue outlook is based upon prudent economic assumptions, as discussed earlier in this section.
Key Changes since the 2017 Budget
The government is projecting a deficit of $6.7 billion in 2018–19 and $6.6 billion in 2019–20. This is a result of a slightly lower revenue forecast as well the government’s plan to invest in priority areas to improve access to high-quality public services such as health care, child care, postsecondary education, social assistance, and mental health and addiction services, as well as expanding OHIP+ for seniors.
Compared to the 2017 Budget forecast, the outlook for revenues is on track in 2017–18, and lower in 2018‑19 and 2019–20 by $1.1 billion and $0.7 billion, respectively.
Ontario’s medium-term outlook for interest on debt expense is currently below the 2017 Budget estimate. Savings from lower-than-forecast interest rates in the 2017 Budget have offset the additional interest cost from deficits.
The reserve included in the fiscal plan is slightly higher in 2018–19 and slightly lower in 2019–20 compared with the forecast in the 2017 Budget . It is now set at $0.7 billion in each year over the medium term. For 2017–18, the reserve is not required for year-end and has been drawn down.
| Item | 2017–18 | 2018–19 | 2019–20 |
|---|---|---|---|
| Surplus/(Deficit) from the 2017 Budget | 0.0 | 0.0 | 0.0 |
| Total Revenue Changes | 0.1 | (1.1) | (0.7) |
| Expense Changes — Net Program Expense Changes | 0.4 | 5.7 | 6.3 |
| Expense Changes — Interest on Debt | (0.3) | (0.1) | (0.2) |
| Total Expense Changes | 0.1 | 5.5 | 6.2 |
| Change in Reserve | (0.6) | 0.1 | (0.2) |
| Fiscal Improvement/(Deterioration) | 0.6 | (6.7) | (6.6) |
| 2018 Budget Surplus/(Deficit) | 0.6 | (6.7) | (6.6) |
Table 3.20 Footnotes:
Note: Numbers may not add due to rounding.
Key Changes in the Medium-Term Revenue Outlook since the 2017 Budget
Compared to the 2017 Budget forecast, the outlook for revenues is on track in 2017–18, and lower in 2018‑19 and 2019–20 by $1.1 billion and $0.7 billion, respectively.
| Item | 2017–18 | 2018–19 | 2019–20 |
|---|---|---|---|
| 2016 Tax Returns | (0.7) | (0.7) | (0.7) |
| Adjustments in Respect of Prior Years | 0.5 | 0.0 | 0.0 |
| Nominal GDP | 0.1 | 0.1 | (0.2) |
| Increased Economic Uncertainty | (0.5) | (1.0) | (1.0) |
| Housing Market | (0.4) | (0.6) | (0.8) |
| Tax Revenue Measures | 0.1 | 0.4 | 0.5 |
| Government of Canada Transfers | (0.8) | 0.3 | 0.5 |
| Electricity Revenue | 0.3 | (0.5) | (0.1) |
| Ontario Lottery and Gaming Corporation (OLG) and Liquor Control Board of Ontario (LCBO) | 0.4 | 0.1 | 0.1 |
| Carbon Allowance Proceeds | 0.6 | 0.6 | 0.6 |
| Cannabis-Related Revenue | (0.0) | (0.0) | 0.1 |
| Other Revenue Sources | 0.3 | 0.3 | 0.4 |
| Total Revenue Changes | 0.1 | (1.1) | (0.7) |
Table 3.21 Footnotes:
Note: Numbers may not add due to rounding.
Processing of 2016 tax returns resulted in lower revenues assessed than estimated at the time of the 2017 Budget, which lowered the tax revenue base upon which growth is applied. In particular, weaker revenues from 2016 PIT returns more than offset the impact of stronger revenues from 2016 corporate tax returns.
Adjustments in respect of prior years tax revenues compared to estimates included in Public Accounts of Ontario 2016–2017 resulted in a net one-time increase in revenues in 2017–18, largely reflecting positive adjustments in respect of Corporations Tax partially offset by negative adjustments to PIT .
Nominal GDP growth is slightly stronger than projected in 2017, but weaker in 2019, which increased revenues in 2017–18 and 2018–19 but lowered revenues in 2019–20.
An environment of slower growth and increased economic uncertainty , such as that created by major U.S. policy changes including the recent cuts in corporate tax rates, has led the government to be more cautious in the projected revenue yields from economic growth.
The current projection for the housing market has resulted in lower revenue projected from Land Transfer Tax and the Harmonized Sales Tax.
Tax measures include the combined impacts of new tax revenue measures introduced in the 2017 Ontario Economic Outlook and Fiscal Review and those proposed in this Budget (see Chapter V, Section A: Tax Measures ). Also, it includes the impact on Ontario revenues of measures announced in the 2018 federal budget such as taxing passive investment income and disallowing artificial loses using equity-based financial arrangements.
Lower Government of Canada transfers in 2017–18 largely reflect re-profiled funding for infrastructure projects mainly due to revised timelines of project implementation. Higher transfers in 2018–19 and 2019‑20 reflect higher Canada Health and Social Transfers, re-profiled funding for infrastructure projects, and new funding for early learning and child care, partially offset by lower Equalization payments.
Electricity Revenue is projected to be higher in 2017–18 mainly due to higher net income from OPG reflecting the financial performance of OPG ’s Nuclear Funds and lower expenses. This increase is partially offset by the impact of the 2017 Ontario Energy Board (OEB) rate decisions with respect to OPG and Hydro One, and lower, fiscally neutral, Power Supply Contract Recoveries. The decrease in 2018–19 mainly reflects revised estimated impacts of a Provincial accounting consolidation adjustment to OPG net income to reflect International Financial Reporting Standards under Public Sector Accounting Standards; lower, fiscally neutral Power Supply Contract Recoveries; and lower projected revenues from Hydro One due to the impact of OEB rate decisions during 2017.
Revenue from the Ontario Lottery and Gaming Corporation (OLG) and the Liquor Control Board of Ontario (LCBO) is projected to be higher in 2017–18 as discussed earlier in this section. The slight increase in 2018–19 and 2019–20 reflects continued effective expense savings and strong performance anticipated from the slot and casino operations of OLG .
The change in Carbon Allowance Proceeds largely reflects an assumption of full market clearance of current and future vintage allowances, as opposed to 80 per cent assumed in the 2017 Budget . This revised projection is informed by the results of strong performance of the cap-and-trade auctions held in 2017–18, revised carbon price forecasts, and regulatory certainty in California, which is expected to encourage market participation.
Estimates of cannabis-related revenue related to the federal government’s intention to legalize and regulate recreational cannabis in 2018 have been included in the revenue outlook. The revenue outlook includes Ontario’s portion of the federal excise duty from cannabis sales in Ontario and the net income of the Ontario Cannabis Retail Corporation (OCRC).
The change in Other Revenue sources over the forecast period mainly reflect higher broader public-sector revenues projected from third-party revenue sources, such as fees, donations, miscellaneous revenues and changes from other non-tax revenue sources. It also includes changes in Sales and Rentals due to asset optimization.
| Item | 2017–18 | 2018–19 | 2019–20 | 2020–21 |
|---|---|---|---|---|
| Ontario Portion of Federal Cannabis Excise Duty | – | 35 | 80 | 115 |
| Ontario Cannabis Retail Corporation Net Income/(Loss) | (8) | (40) | 35 | 100 |
Ontario Portion of the Federal Cannabis Excise Duty
At the Finance Ministers’ Meeting in December 2017, Ontario and 11 other provinces and territories agreed in principle to join the federal government in a coordinated taxation framework for cannabis. Ontario intends to enter into an agreement with the federal government under which Ontario would receive 75 per cent of the federal excise duty collected on cannabis intended for sale in the province. Ontario’s outlook for cannabis excise duty revenue is based on reasonable assumptions about the pace of growth in recreational cannabis sales as retail stores are established over time.
Ontario Cannabis Retail Corporation
On December 12, 2017, the Ontario Cannabis Retail Corporation Act received Royal Assent, creating the OCRC, a subsidiary of the LCBO . Upon the intended federal implementation of cannabis legalization, the OCRC will be the only legal retailer and distributor of recreational cannabis in Ontario, and responsible for new stand-alone cannabis storefronts and an online distribution channel. In the initial years of legalization, net income from the OCRC will be limited as the organization incurs the initial startup costs of establishing its retail network.
Key Changes in the Medium-Term Expense Outlook since the 2017 Budget
The government is making investments to support the economy and job growth and to transform and strengthen the public services that people rely on. These new investments total $5.7 billion in 2018–19, $6.3 billion in 2019–20, and $8.3 billion in 2020–21, or $20.3 billion over three years.
| Item | 2018–19 | 2019–20 | 2020–21 |
|---|---|---|---|
| Improving Health and Mental Health — Better Health Care for Everyone in Ontario | 0.4 | 0.4 | 0.4 |
| Improving Health and Mental Health — Expanding Access to Mental Health and Addictions Services | 0.2 | 0.4 | 0.6 |
| Supporting Parents and Caregivers — Making Child Care More Accessible and Affordable | 0.1 | 0.4 | 1.7 |
| Helping the Most Vulnerable — Implementing Income Security Reform | 0.3 | 0.7 | 1.3 |
| Helping the Most Vulnerable — Investing in Developmental Services | 0.3 | 0.6 | 0.9 |
| Helping the Most Vulnerable — Improving Supports in School for Children with Special Needs | 0.1 | 0.1 | 0.1 |
| Helping the Most Vulnerable — Ending Gender-Based Violence | 0.1 | 0.1 | 0.1 |
| Caring for Seniors — Expanding OHIP+ for Seniors | – | 0.4 | 0.6 |
| Caring for Seniors — Expanding and Improving Home and Community Care for Clients and Caregivers and Investing in its Workforce | 0.3 | 0.2 | 0.3 |
| Caring for Seniors — Supporting Seniors to Live Independently | – | 0.4 | 0.4 |
| Caring for Seniors — Reducing the Wait Time for Long-Term Care | 0.1 | 0.1 | 0.2 |
| Caring for Seniors — Fairness for All Seniors | 0.1 | 0.1 | 0.1 |
| Support for Drugs and Dental Care — Reducing Prescription Drug and Dental Costs | 0.0 | 0.3 | 0.5 |
| Improving the Justice System — Continued Transformation of the Criminal Justice System | 0.1 | 0.1 | 0.1 |
| Growing the Economy and Creating Good Jobs — Making Postsecondary Education More Affordable and Investing in Postsecondary Education Infrastructure | 0.3 | 0.4 | 0.4 |
| Growing the Economy and Creating Good Jobs — Good Jobs and Growth Plan | 0.2 | 0.3 | 0.5 |
| Growing the Economy and Creating Good Jobs — Investing in Ontario’s Communities | 0.1 | 0.2 | 0.2 |
| Growing the Economy and Creating Good Jobs — Giving Students a Strong Foundation | 0.1 | 0.1 | 0.1 |
| Growing the Economy and Creating Good Jobs — Investments in Innovation and Transformative Technologies | 0.0 | 0.0 | 0.0 |
| Federal-Provincial Collaboration — Phase Two of Investing in Canada Plan | 0.2 | 0.5 | 1.1 |
| Federal-Provincial Collaboration — Early Learning and Child Care Bilateral Agreement | 0.1 | 0.1 | 0.1 |
| Federal-Provincial Collaboration — National Housing Strategy (Provincial Portion) | – | 0.1 | 0.1 |
| Other Changes | 2.7 | 0.5 | (1.3) |
| Total Investments | 5.7 | 6.3 | 8.3 |
Table 3.23 Footnotes:
Note: Numbers may not add due to rounding.
The program expense outlook over the medium term includes:
- Better Health Care for Everyone in Ontario: $1.3 billion over three years to ensure people have improved access to the high-quality health care they need, to support growing demand and implement new and innovative approaches to serving the people of Ontario.
- Expanding Access to Mental Health and Addictions Services: Additional investments of $1.2 billion over three years to improve access to a full range of mental health and addictions services for children, youth and adults across Ontario.
- Making Child Care More Accessible and Affordable: $2.2 billion over three years to continue to increase access to child care, introduce free preschool for children from the age of two-and-a-half until they are eligible for kindergarten starting in September 2020, and phasing in a wage grid in the early years child sector.
- Implementing Income Security Reform: An increase of $2.3 billion over three years to embark on a multi-year plan to reform income security, including increasing income support, reducing the burden of complex rules and simplifying benefits for those accessing social assistance.
- Investing in Developmental Services: An additional $1.8 billion over three years to expand services and enable choice, independence and inclusion for individuals with developmental disabilities.
- Improving Supports in School for Children with Special Needs: An additional $0.3 billion over three years to address waitlists for special education assessments and improve access to special education programs and services in schools.
- Ending Gender-Based Violence: Investments of $0.2 billion over three years for Ontario’s Gender-Based Violence Strategy to improve access to services for survivors of gender-based violence.
- Expanding OHIP+ for Seniors: Almost $1 billion over three years to provide seniors with free prescription drugs beginning August 1, 2019.
- Expanding and Improving Home and Community Care for Clients and Caregivers and Investing in its Workforce: Investments of $0.8 billion over three years to support home care, as well as training and skills development for personal support workers (PSWs) and pilot a new program to help PSWs plan and save for retirement.
- Supporting Seniors to Live Independently: Investments of $0.7 billion over two years, beginning in 2019–20 to support seniors who may be struggling to cover the costs of maintaining their homes, in order to improve the quality of life for seniors.
- Reducing the Wait Time for Long-Term Care: The government is investing $0.3 billion over three years starting with $50 million in 2018–19 to hire registered nurses in long-term care homes and setting a goal of increasing the provincial average to four hours of daily care per resident by 2022.
- Fairness for All Seniors: Investments of $0.2 billion over three years to support seniors to remain independent, connected, engaged, healthy and safe.
- Reducing Prescription Drug and Dental Costs: $0.8 billion over the first two years for the proposed new Ontario Drug and Dental Program starting in summer 2019.
- Continued Transformation of the Criminal Justice System: $0.3 billion over three years to achieve better outcomes for individuals in custody, including prioritizing individuals’ rehabilitation and reintegration into the community, and providing justice and social services to target the root causes of crime to reduce recidivism rates and support individuals re-entering the community upon release from custody.
- Making Postsecondary Education More Affordable and Investing in Postsecondary Education Infrastructure: $1.2 billion over three years to support higher-than-forecast applications and awards for the Ontario Student Assistance Program (OSAP ), as well as postsecondary infrastructure projects.
- Good Jobs and Growth Plan: $0.9 billion over three years to strengthen economic foundations and support the development of local talent and entrepreneurs and the growth of Ontario businesses, and investments in postsecondary institutions, a modernized apprenticeship system and a flexible employment and training system, as well as expand broadband connectivity, particularly in rural and northern areas of the province.
- Investing in Ontario’s Communities: $0.5 billion, over three years, for investments in Ontario’s communities including supporting the sustainability of francophone communities across the province, strengthening libraries, promoting cultural engagement and inclusion, and supporting socio-economic infrastructure projects and large-scale, transformation investment opportunities in northern Ontario.
- Giving Students a Strong Foundation: An additional $0.2 billion over three years to help students achieve their potential, including funding to help prepare students for success in secondary school.
- Investments in Innovation and Transformative Technologies: $45 million over three years to support the growth of the artificial intelligence sector.
- Phase Two of Investing in Canada Plan: $1.7 billion over three years to support public transit infrastructure; green infrastructure; community, culture and recreation infrastructure; and rural and northern communities infrastructure.
- Early Learning and Child Care Bilateral Agreement: $0.4 billion over three years under the early learning and child care bilateral agreement to increase accessibility and affordability of high-quality licensed child care and early learning opportunities, which is offset by an increase in federal revenue.
- National Housing Strategy: An additional $0.2 billion, over three years, for the provincial portion of the Federal–Provincial/Territorial Housing Partnership and the Canada Housing Benefit (under the National Housing Strategy), which will help with the provision of housing assistance for vulnerable Ontarians.
- Other Changes: Increases of $1.9 billion over three years, due in part to consolidation impacts related to some government organizations, investments for initiatives under the Climate Change Action Plan and re-profiling of funds due to construction delays for various infrastructure projects.
See Chapter I: A Plan for Care and Chapter II: Growing the Economy and Creating Good Jobs for additional details on these investments.
Details of Ontario’s Finances
The following tables and charts provide information on the Province’s historical financial performance, key fiscal indicators and fiscal plan.
| Item | 2015–16 | Actual 2016–17 | Interim 2017–18 | Plan 2018–19 |
|---|---|---|---|---|
| Taxation Revenue — Personal Income Tax | 31,141 | 30,671 | 32,319 | 35,612 |
| Taxation Revenue — Sales Tax | 23,455 | 24,750 | 25,954 | 26,808 |
| Taxation Revenue — Corporations Tax | 11,428 | 14,872 | 15,800 | 15,137 |
| Taxation Revenue — Education Property Tax | 5,839 | 5,868 | 5,968 | 6,076 |
| Taxation Revenue — Employer Health Tax | 5,649 | 5,908 | 6,184 | 6,554 |
| Taxation Revenue — Ontario Health Premium | 3,453 | 3,575 | 3,679 | 3,914 |
| Taxation Revenue — Gasoline Tax | 2,459 | 2,626 | 2,675 | 2,699 |
| Taxation Revenue — Land Transfer Tax | 2,118 | 2,728 | 3,091 | 3,142 |
| Taxation Revenue — Tobacco Tax | 1,226 | 1,230 | 1,251 | 1,250 |
| Taxation Revenue — Fuel Tax | 751 | 742 | 768 | 784 |
| Taxation Revenue — Beer, Wine and Spirits Taxes | 582 | 589 | 607 | 638 |
| Taxation Revenue — Ontario Portion of the Federal Cannabis Excise Duty | – | – | – | 35 |
| Taxation Revenue — Electricity Payments in Lieu of Taxes | 3,247 | 334 | 499 | 369 |
| Taxation Revenue — Other Taxes | 470 | 453 | 558 | 563 |
| Taxation Revenue — Total | 91,818 | 94,346 | 99,353 | 103,581 |
| Government of Canada — Canada Health Transfer | 13,089 | 13,910 | 14,359 | 14,934 |
| Government of Canada — Canada Social Transfer | 4,984 | 5,146 | 5,314 | 5,486 |
| Government of Canada — Equalization | 2,363 | 2,304 | 1,424 | 963 |
| Government of Canada — Infrastructure Programs | 146 | 732 | 1,533 | 1,703 |
| Government of Canada — Labour Market Programs | 927 | 965 | 969 | 998 |
| Government of Canada — Social Housing | 455 | 441 | 412 | 386 |
| Government of Canada — Other Federal Payments | 893 | 761 | 1,020 | 1,235 |
| Government of Canada — Direct Transfers to Broader Public-Sector Organizations | 284 | 285 | 297 | 301 |
| Government of Canada — Total | 23,141 | 24,544 | 25,328 | 26,006 |
| Income from Government Business Enterprises — Ontario Lottery and Gaming Corporation | 2,234 | 2,358 | 2,509 | 2,245 |
| Income from Government Business Enterprises — Liquor Control Board of Ontario | 1,956 | 2,349 | 2,196 | 2,234 |
| Income from Government Business Enterprises — Ontario Cannabis Retail Corporation | – | – | (8) | (40) |
| Income from Government Business Enterprises — Ontario Power Generation Inc./Hydro One Ltd.1 | 719 | 860 | 1,445 | 853 |
| Income from Government Business Enterprises — Total | 4,909 | 5,567 | 6,142 | 5,292 |
| Other Non-Tax Revenue — Reimbursements | 991 | 988 | 996 | 995 |
| Other Non-Tax Revenue — Vehicle and Driver Registration Fees | 1,565 | 1,727 | 1,962 | 2,003 |
| Other Non-Tax Revenue — Electricity Debt Retirement Charge | 859 | 621 | 604 | – |
| Other Non-Tax Revenue — Power Supply Contract Recoveries | 875 | 838 | 182 | 183 |
| Other Non-Tax Revenue — Sales and Rentals | 2,102 | 1,999 | 2,439 | 1,409 |
| Other Non-Tax Revenue — Carbon Allowance Proceeds | – | – | 2,395 | 1,979 |
| Other Non-Tax Revenue — Other Fees and Licences | 964 | 763 | 995 | 1,003 |
| Other Non-Tax Revenue — Net Reduction of Power Purchase Contract Liability | 172 | 129 | 74 | 41 |
| Other Non-Tax Revenue — Royalties | 274 | 272 | 297 | 295 |
| Other Non-Tax Revenue — Fees, Donations and Other Revenues from Hospitals, School Boards and Colleges | 7,493 | 7,957 | 8,283 | 8,552 |
| Other Non-Tax Revenue — Miscellaneous Other Non-Tax Revenue | 985 | 983 | 1,086 | 1,122 |
| Other Non-Tax Revenue — Total | 16,280 | 16,277 | 19,313 | 17,582 |
| Total Revenue | 136,148 | 140,734 | 150,136 | 152,461 |
Table 3.24 Footnotes:
[1] Includes income from Brampton Distribution Holdco Inc. for 2015–16 to 2016–17 from its interest in Hydro One Brampton Networks Inc. On February 28, 2017, the Province sold its entire interest in Hydro One Brampton Networks Inc. and it is no longer included as a government business enterprise.
Note: Numbers may not add due to rounding.
| Ministry Expense | 2015–16 | Actual 2016–17 | Interim 2017–18 | Plan 2018–19 |
|---|---|---|---|---|
| Accessibility Directorate of Ontario (Total) | 15 | 15 | 18.9 | 20.8 |
| Advanced Education and Skills Development (Total) | 9,901 | 10,131 | 11,128.4 | 11,788.5 |
| Agriculture, Food and Rural Affairs (Base) | 883 | 1,031 | 930.9 | 1,098.8 |
| Agriculture, Food and Rural Affairs — Time-Limited Investments in Infrastructure | 47 | – | 101.9 | 100.0 |
| Agriculture, Food and Rural Affairs (Total) | 929 | 1,031 | 1,032.8 | 1,198.8 |
| Attorney General (Total) | 1,859 | 1,937 | 2,051.8 | 2,012.6 |
| Board of Internal Economy (Total) | 205 | 219 | 252.3 | 352.3 |
| Children and Youth Services (Total) | 4,298 | 4,439 | 4,454.7 | 4,597.7 |
| Citizenship and Immigration (Total) | 102 | 105 | 108.4 | 122.2 |
| Community and Social Services (Base) | 11,298 | 11,614 | 12,378.1 | 13,312.8 |
| Community and Social Services — Time-Limited Investments in Affordable and Supportive Housing | – | 23 | 9.3 | – |
| Community and Social Services (Total) | 11,298 | 11,637 | 12,387.4 | 13,312.8 |
| Community Safety and Correctional Services (Base) | 2,565 | 2,681 | 2,805.5 | 3,027.0 |
| Community Safety and Correctional Services — Time-Limited Support for 2015 Pan/Parapan American Games Security | 122 | – | – | – |
| Community Safety and Correctional Services (Total) | 2,687 | 2,681 | 2,805.5 | 3,027.0 |
| Economic Development and Growth/Research, Innovation and Science (Total) | 928 | 1,073 | 1,026.1 | 1,072.4 |
| Economic Development and Growth/Research, Innovation and Science (Total) — Education (Base) | 25,967 | 26,580 | 27,493.6 | 29,075.3 |
| Eduation — Teachers’ Pension Plan | 110 | (377) | (460.0) | (861.0) |
| Education (Total) | 26,077 | 26,204 | 27,033.6 | 28,214.3 |
| Energy (Base) | 328 | 456 | 355.1 | 374.7 |
| Energy — Electricity Cost Relief Programs | – | 400 | 1,247.2 | 1,580.8 |
| Energy — Ontario Clean Energy Benefit | 860 | 21 | – | – |
| Energy — Strategic Asset Management and Transformation Related to Hydro One | 44 | 43 | 187.9 | 35.0 |
| Energy (Total) | 1,232 | 920 | 1,790.3 | 1,990.5 |
| Environment and Climate Change (Total) | 503 | 523 | 783.0 | 1,326.0 |
| Executive Offices (Base) | 33 | 48 | 57.6 | 58.3 |
| Executive Offices — Disaster Relief | 3 | 1 | 4.0 | – |
| Executive Offices (Total) | 36 | 49 | 61.6 | 58.3 |
| Finance (Base) | 1,048 | 862 | 885.1 | 986.2 |
| Finance — Ontario Municipal Partnership Fund | 513 | 505 | 506.3 | 510.0 |
| Finance — Power Supply Contract Costs | 875 | 838 | 181.8 | 182.8 |
| Finance (Total) | 2,436 | 2,205 | 1,573.1 | 1,679.0 |
| Francophone Affairs, Office of (Total) | 8 | 5 | 6.5 | 7.8 |
| Government and Consumer Services (Total) | 602 | 595 | 618.8 | 585.3 |
| Health and Long-Term Care (Total) | 54,925 | 55,945 | 58,289.5 | 61,277.7 |
| Indigenous Relations and Reconciliation (Base) | 75 | 128 | 92.2 | 101.3 |
| Indigenous Relations and Reconciliation — One-Time Investments including Settlements | 5 | – | 21.6 | – |
| Indigenous Relations and Reconciliation (Total) | 79 | 128 | 113.8 | 101.3 |
| Infrastructure (Base) | 213 | 161 | 265.8 | 213.3 |
| Infrastructure — Federal–Provincial Infrastructure Programs | – | 8 | 141.9 | 603.3 |
| Infrastructure (Total) | 213 | 169 | 407.7 | 816.6 |
| International Trade (Total) | 21 | 29 | 51.7 | 61.1 |
| Labour (Total) | 305 | 308 | 324.1 | 330.6 |
| Municipal Affairs/Housing (Base) | 923 | 994 | 1,051.2 | 1,006.8 |
| Municipal Affairs/Housing — Time-Limited Investments | 1 | 6 | 22.9 | 16.7 |
| Municipal Affairs/Housing — Time-Limited Investments in Municipal, Social and Affordable Housing | 165 | 544 | 297.0 | 324.3 |
| Municipal Affairs/Housing (Total) | 1,088 | 1,544 | 1,371.1 | 1,347.8 |
| Natural Resources and Forestry (Base) | 723 | 751 | 801.3 | 779.9 |
| Emergency Forest Firefighting | 95 | 107 | 117.3 | 69.8 |
| Natural Resources and Forestry (Total) | 818 | 858 | 918.6 | 849.7 |
| Northern Development and Mines (Total) | 701 | 814 | 764.1 | 813.7 |
| Seniors Affairs (Total) | 20 | 19 | 29.8 | 46.5 |
| Status of Women (Total) | 26 | 23 | 27.6 | 37.4 |
| Tourism, Culture and Sport (Base) | 1,431 | 1,540 | 1,568.1 | 1,514.2 |
| Tourism, Culture and Sport — Time-Limited Investments to Support 2015 Pan/Parapan American Games | 839 | – | – | – |
| Tourism, Culture and Sport (Total) | 2,270 | 1,540 | 1,568.1 | 1,514.2 |
| Transportation (Base) | 3,284 | 3,636 | 4,199.2 | 4,678.4 |
| Transportation — Time-Limited Investments in Infrastructure | – | – | 895.6 | 887.5 |
| Transportation (Total) | 3,284 | 3,636 | 5,094.8 | 5,565.9 |
| Treasury Board Secretariat (Base) | 220 | 233 | 230.4 | 346.9 |
| Treasury Board Secretariat — Employee and Pensioner Benefits | 987 | 1,002 | 1,155.0 | 1,271.0 |
| Treasury Board Secretariat — Operating Contingency Fund | – | – | 50.0 | 1,325.0 |
| Treasury Board Secretariat — Capital Contingency Fund | – | – | – | 275.0 |
| Treasury Board Secretariat (Total) | 1,207 | 1,235 | 1,435.4 | 3,217.9 |
| Interest on Debt1 | 11,589 | 11,709 | 11,965.0 | 12,542.8 |
| Year-End Savings2 | – | – | – | (1,225.0) |
| PRRT Savings | – | – | – | (200.0) |
| Total Expense | 139,663 | 141,725 | 149,494.3 | 158,464.5 |
Table 3.25 Footnotes:
[1] Interest on debt is net of interest capitalized during construction of tangible capital assets of $165 million in 2015–16, $158 million in 2016–17, $301 million in 2017–18 and $456 million in 2018–19.
[2] As in past years, the Year-End Savings provision reflects efficiencies through in-year expenditure management and underspending due to factors such as program management, and changes in project startups and implementation plans.
Note: Numbers may not add due to rounding.
| Sector | Total Infrastructure Expenditures 2017–18 Interim1 | 2018–19 Plan — Investment in Capital Assets2 | 2018–19 Plan — Transfers and Other Infrastructure Expenditures3 | 2018–19 Plan — Total Infrastructure Expenditures4 |
|---|---|---|---|---|
| Transportation — Transit | 5,099 | 5,978 | 1,536 | 7,514 |
| Transportation — Provincial Highways | 2,757 | 2,707 | 294 | 3,000 |
| Transportation — Other Transportation, Property and Planning | 251 | 223 | 162 | 384 |
| Health — Hospitals | 2,745 | 2,675 | 66 | 2,741 |
| Other Health | 275 | 84 | 192 | 276 |
| Education | 2,825 | 2,496 | 511 | 3,007 |
| Postsecondary — Colleges and Other | 886 | 783 | 10 | 793 |
| Postsecondary — Universities | 353 | – | 317 | 317 |
| Social | 607 | 14 | 475 | 489 |
| Justice | 298 | 292 | 275 | 567 |
| Other Sectors5 | 1,129 | 843 | 1,181 | 2,024 |
| Total Infrastructure Expenditures | 17,226 | 16,094 | 5,018 | 21,112 |
Table 3.26 Footnotes:
[1] Includes provincial investment in capital assets of $10.7 billion.
[2] Includes $456 million in interest capitalized during construction.
[3] Includes transfers to municipalities, universities and non-consolidated agencies.
[4] Includes third-party investments in hospitals, colleges and schools; and federal contributions to provincial infrastructure investments.
[5] Includes government administration, natural resources, and culture and tourism sectors.
Note: Numbers may not add due to rounding.
| Item | 2009–102 | 2010–11 | 2011–12 | 2012–13 | 2013–14 | 2014–15 | 2015–16 | Actual 2016–17 | Interim 2017–18 | Plan 2018–19 |
|---|---|---|---|---|---|---|---|---|---|---|
| Revenue | 102,553 | 113,594 | 116,401 | 120,319 | 122,955 | 126,152 | 136,148 | 140,734 | 150,136 | 152,461 |
| Expense — Programs | 112,696 | 117,600 | 118,783 | 118,661 | 122,253 | 125,246 | 128,074 | 130,016 | 137,529 | 145,922 |
| Expense — Interest on Debt3 | 9,119 | 10,005 | 10,587 | 10,878 | 11,155 | 11,221 | 11,589 | 11,709 | 11,965 | 12,543 |
| Total Expense | 121,815 | 127,605 | 129,370 | 129,539 | 133,408 | 136,467 | 139,663 | 141,725 | 149,494 | 158,465 |
| Reserve | – | – | – | – | – | – | – | – | – | 700 |
| Surplus/(Deficit) | (19,262) | (14,011) | (12,969) | (9,220) | (10,453) | (10,315) | (3,515) | (991) | 642 | (6,704) |
| Net Debt | 193,589 | 214,511 | 236,230 | 252,823 | 267,968 | 285,403 | 295,372 | 301,648 | 308,203 | 325,041 |
| Accumulated Deficit | 130,957 | 144,573 | 158,410 | 167,132 | 176,634 | 187,511 | 192,029 | 193,510 | 192,449 | 199,153 |
| Gross Domestic Product (GDP) at Market Prices | 597,876 | 630,983 | 659,740 | 680,086 | 695,354 | 726,053 | 762,029 | 794,835 | 829,984 | 863,690 |
| Primary Household Income | 412,847 | 424,251 | 444,076 | 459,111 | 472,921 | 489,436 | 512,566 | 528,419 | 554,567 | 573,178 |
| Population — July (000s) | 12,998 | 13,135 | 13,264 | 13,414 | 13,556 | 13,680 | 13,790 | 13,976 | 14,193 | 14,439 |
| Net Debt per Capita (dollars) | 14,894 | 16,331 | 17,810 | 18,848 | 19,767 | 20,863 | 21,419 | 21,583 | 21,715 | 22,511 |
| Household Income per Capita (dollars) | 31,763 | 32,299 | 33,481 | 34,227 | 34,887 | 35,776 | 37,170 | 37,808 | 39,072 | 39,697 |
| Interest on Debt as a Per Cent of Revenue | 8.9% | 8.8% | 9.1% | 9.0% | 9.1% | 8.9% | 8.5% | 8.3% | 8.0% | 8.2% |
| Net Debt as a Per Cent of GDP | 32.4% | 34.0% | 35.8% | 37.2% | 38.5% | 39.3% | 38.8% | 38.0% | 37.1% | 37.6% |
| Accumulated Deficit as a Per Cent of GDP | 21.9% | 22.9% | 24.0% | 24.6% | 25.4% | 25.8% | 25.2% | 24.3% | 23.2% | 23.1% |
Table 3.27 Footnotes:
[1] Revenue and Expense have been restated to reflect a fiscally neutral accounting change for the revised presentation of education property taxes, as described in the 2010 Budget ; a fiscally neutral accounting change related to the reclassification of government agencies and organizations, as described in the 2011 Ontario Economic Outlook and Fiscal Review ; a fiscally neutral reclassification of a number of tax measures that are transfers or grants, as described in the 2012 Budget; and a presentation change for revenue and expense of hospitals, school boards and colleges as described in the 2017 Ontario Economic Outlook and Fiscal Review .
[2] Starting in 2009–10, investments in minor tangible capital assets owned by the Province were capitalized and amortized to expense. All capital assets owned by consolidated organizations are being accounted for in a similar manner.
[3] Interest on debt is net of interest capitalized during construction of tangible capital assets of $202 million in 2014–15, $165 million in 2015–16, $158 million in 2016–17, $301 million in 2017–18, and $456 million in 2018–19.
Note: Numbers may not add due to rounding.
Sources : Statistics Canada and Ontario Ministry of Finance.
Chart Descriptions
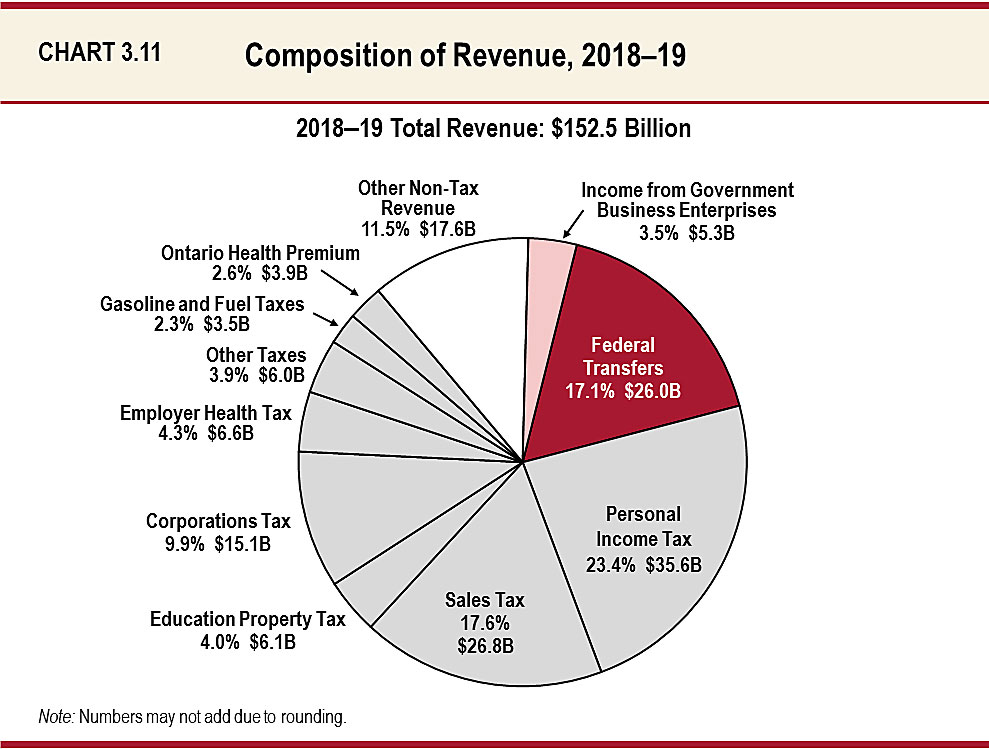
Chart 3.11: Composition of Revenue, 2018–19
This pie chart shows the composition of Ontario’s revenue in 2018–19, which totals $152.5 billion. The largest taxation revenue source is Personal Income Tax revenue at $35.6 billion, accounting for 23.4 per cent of total revenue. This is followed by Sales Tax at $26.8 billion, or 17.6 per cent of total revenue; and Corporations Tax at $15.1 billion, or 9.9 per cent of total revenue. Other components of taxation revenue include Education Property Tax at $6.1 billion, or 4.0 per cent of total revenue; Employer Health Tax at $6.6 billion, or 4.3 per cent; Gasoline and Fuel Taxes at $3.5 billion, or 2.3 per cent; the Ontario Health Premium at $3.9 billion, or 2.6 per cent; and Other Taxes at $6.0 billion, or 3.9 per cent of total revenue.
Total taxation revenue accounts for $103.6 billion, or 67.9 per cent of total revenue.
The other major non-taxation sources of revenue are Federal Transfers of $26.0 billion, or 17.1 per cent of total revenue; Income from Government Business Enterprises at $5.3 billion, or 3.5 per cent of total revenue; and various other non-tax revenue at $17.6 billion, or 11.5 per cent of total revenue.
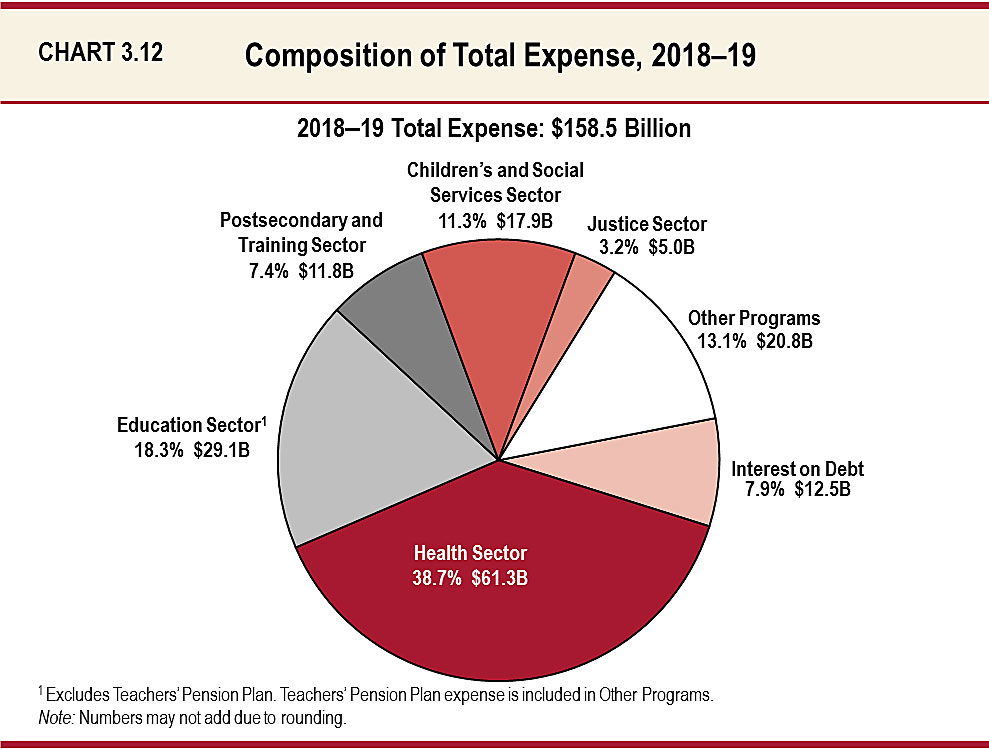
Chart 3.12: Composition of Total Expense, 2018–19
This pie chart shows the share of total expense and dollar amounts by sector in 2018–19.
Total expense in 2018–19 is $158.5 billion.
The largest expense is the Health Sector at $61.3 billion, accounting for 38.7 per cent of total expense.
The remaining sectors of total expense include the Education Sector at $29.1 billion or 18.3 per cent; the Postsecondary and Training Sector at $11.8 billion or 7.4 per cent; the Children’s and Social Services Sector at $17.9 billion or 11.3 per cent; the Justice Sector at $5.0 billion or 3.2 per cent; and Other Programs at $20.8 billion or 13.1 per cent. Interest on Debt, included as part of Total Expense, is $12.5 billion or 7.9 per cent.
Note that the Education Sector excludes the Teachers’ Pension Plan. Teachers’ Pension Plan expense is included in Other Programs.
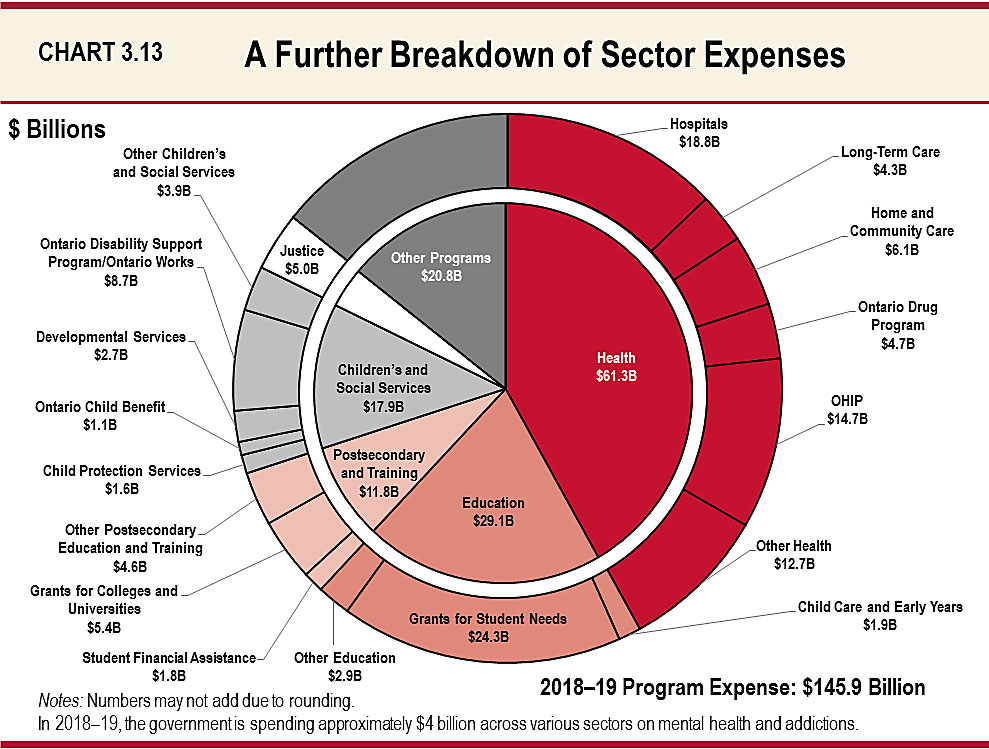
Chart 3.13: A Further Breakdown of Sector Expenses
This pie chart shows the breakdown of the dollar amounts by specific program expenses for 2018-19, which totals $145.9 billion.
The Health Sector expense is $61.3 billion and is distributed as: $18.8 billion for hospitals; $4.3 billion for Long-Term Care; $6.1 billion for home and community care; $4.7 billion for Ontario Drug Program; $14.7 billion for OHIP ; and $12.7 billion for other expenses.
The Education sector expense is $29.1 billion and is distributed as: $1.9 billion for Child Care and Early Years; $24.3 billion for Grants for Student Needs; and $2.9 billion for other expenses.
The Postsecondary and Training sector expense is $11.8 billion and is distributed as: $1.8 billion for student financial assistance; $5.4 billion for grants for colleges and universities; and $4.6 billion for other expenses.
The Children’s and Social Services sector expense is $17.9 billion and is distributed as: $1.6 billion for Child Protection Services; $1.1 billion for Ontario Child Benefit; $2.7 billion for Developmental Services and $8.7 billion for Ontario Disability Support Program/Ontario Works; and $3.9 billion for other sector expenses.
The Justice sector expense is $5.0 billion and Other Programs sector expense is $20.8 billion.
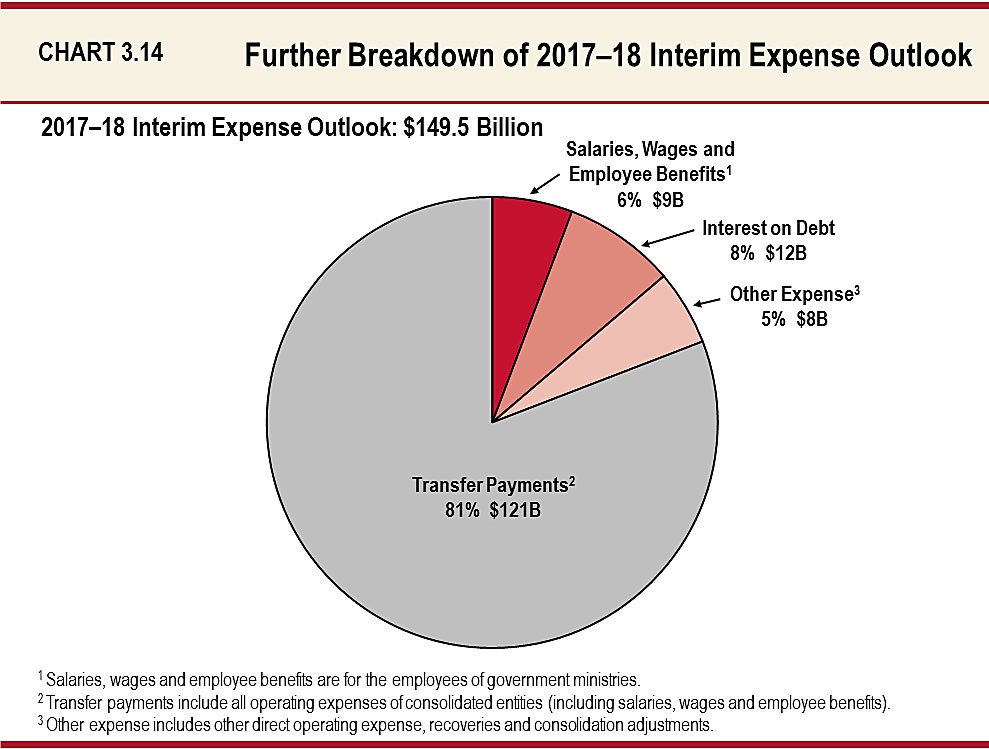
Chart 3.14: A Further Breakdown of 2017–18 Interim Expense Outlook
This pie chart provides a further breakdown of the 2017–18 interim expense outlook, which totals $149.5 billion.
Salaries, wages and employee benefits for the employees of government ministries represent approximately 6 per cent of the total, or $9 billion.
Transfer payments represent approximately 81 per cent of the total, or $121 billion. Transfer payments include all operating expenses of consolidated entities (including salaries, wages and employee benefits).
Other expense including other direct operating expense, recoveries and consolidation adjustments represents approximately 5 per cent of the total, or $8 billion.
Interest on debt represents approximately 8 per cent of the total, or $12 billion.