Economic Outlook
The Ministry of Finance is forecasting 1.9 per cent average annual growth in Ontario’s real gross domestic product (GDP) over the 2018–21 period. For prudent fiscal planning, these real GDP growth projections are slightly below the average of private-sector forecasts.
| Item | 2015 | 2016 | 2017 | 2018p | 2019p | 2020p | 2021p |
|---|---|---|---|---|---|---|---|
| Real GDP Growth | 2.9 | 2.6 | 2.7e | 2.2 | 1.8 | 1.9 | 1.7 |
| Nominal GDP Growth | 5.0 | 4.3 | 4.4e | 4.1 | 3.9 | 4.0 | 3.9 |
| Employment Growth | 0.7 | 1.1 | 1.8 | 1.7 | 1.1 | 0.9 | 0.8 |
| CPI Inflation | 1.2 | 1.8 | 1.7 | 2.2 | 2.2 | 2.1 | 1.9 |
Table 3.2 Footnotes:
e = estimate.
p = Ontario Ministry of Finance planning projection.
Sources: Statistics Canada and Ontario Ministry of Finance
Following a period of strong growth, Ontario’s economy is expected to expand at a more moderate pace over the next four years alongside slowing economic growth in the United States and rest of Canada, rising interest rates, a strengthening Canadian dollar and higher oil prices. Household spending on interest-rate-sensitive items is expected to moderate along with housing market activity.
Ontario’s Recent Economic Performance
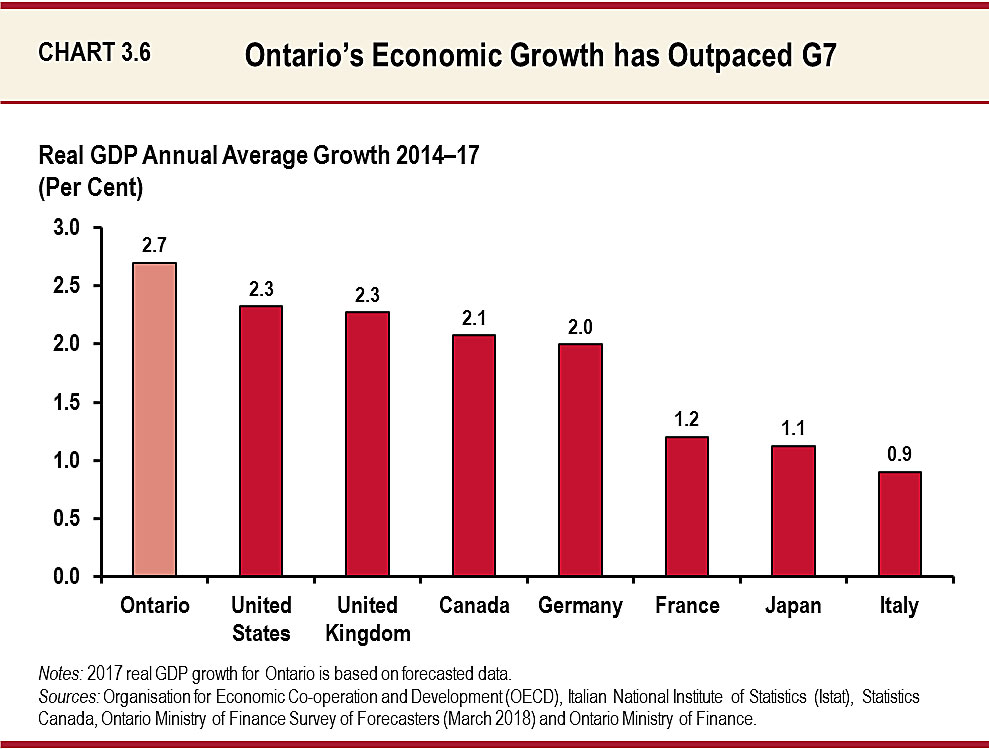
Ontario’s economy continues to grow in an uncertain and challenging global environment. Real GDP advanced at an average annual pace of 2.7 per cent over the 2014–17 period, stronger than the 2.0 per cent average annual growth between 2010–13. Since 2014, Ontario’s economy has grown more than Canada’s and all of the other G7 countries.
Ontario Creating High-Quality Jobs
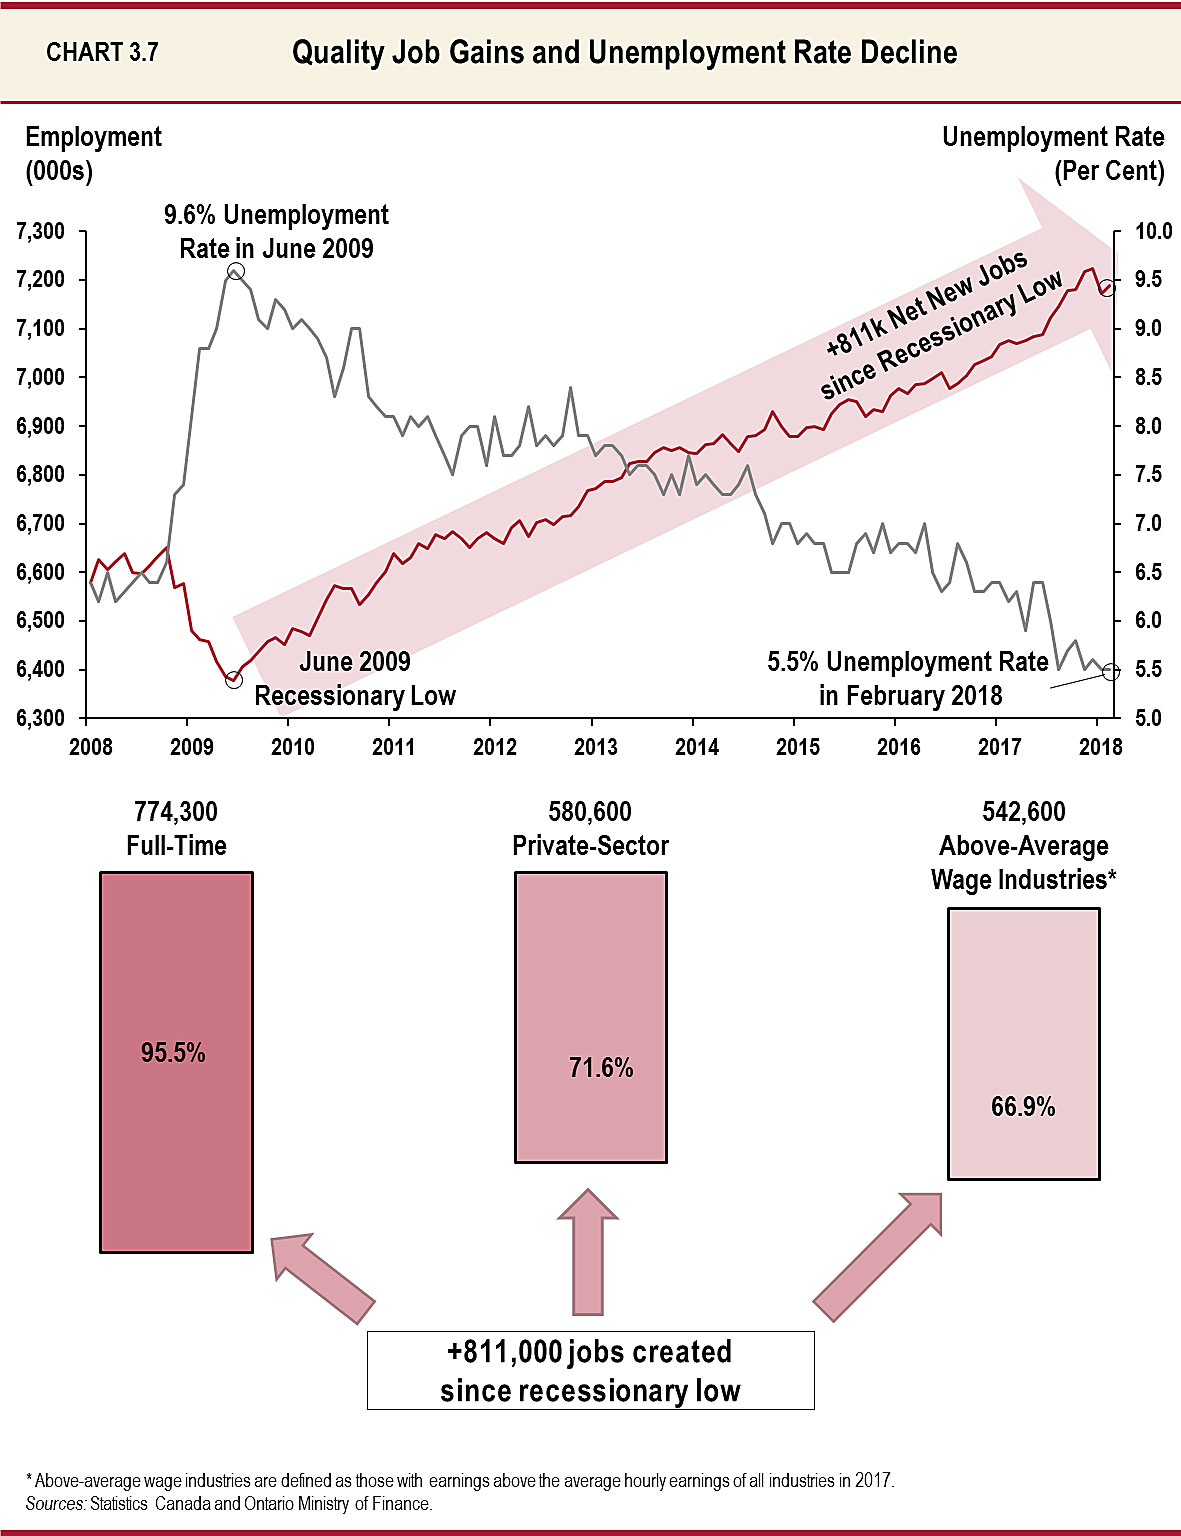
The strength of Ontario’s economy has supported solid employment gains. Since the recession, Ontario’s economy has created over 800,000 net new jobs. The majority of the jobs were created: in industries that pay above-average wages; in the private sector; and as full-time positions. The province’s unemployment rate has steadily declined from 9.6 per cent in June 2009 to a 17-year low of 5.5 per cent in February 2018, and has remained below the national average for 34 consecutive months.
Global Economic Environment
The global economic environment remains supportive of Ontario’s economic growth. The Canadian dollar and oil prices are both projected to rise modestly but remain well below the levels that prevailed between 2005 and 2014. Interest rates are expected to continue to rise at a modest pace but remain below long-term averages. Real GDP growth in the United States and Canada is expected to remain supportive. Forecasts for key external factors are summarized in Table 3.3. These are used as the basis for the Ministry of Finance’s forecast for Ontario’s economic growth.
| Item | 2015 | 2016 | 2017 | 2018p | 2019p | 2020p | 2021p |
|---|---|---|---|---|---|---|---|
| World Real GDP Growth (Per Cent) | 3.4 | 3.2 | 3.7e | 3.9 | 3.9 | 3.7 | 3.8 |
| U.S. Real GDP Growth (Per Cent) | 2.9 | 1.5 | 2.3 | 2.8 | 2.4 | 2.1 | 2.0 |
| Canada Real GDP Growth (Per Cent) | 1.0 | 1.4 | 3.0 | 2.2 | 1.8 | 1.9 | 1.7 |
| West Texas Intermediate Crude Oil ($US/bbl.) | 49 | 43 | 51 | 59 | 59 | 59 | 60 |
| Canadian Dollar (Cents US) | 78.3 | 75.5 | 77.0 | 80.1 | 80.9 | 81.2 | 81.2 |
| Three-Month Treasury Bill Rate1 (Per Cent) | 0.5 | 0.5 | 0.7 | 1.4 | 2.2 | 2.7 | 2.7 |
| 10-Year Government Bond Rate2 (Per Cent) | 1.5 | 1.3 | 1.8 | 2.4 | 3.0 | 3.5 | 3.5 |
Table 3.3 Footnotes:
e = estimate.
p = Ontario Ministry of Finance planning projection based on external sources.
[1], [2] Government of Canada interest rates.
Sources: IMF World Economic Outlook (October 2017 and January 2018), U.S. Bureau of Economic Analysis, Blue Chip Economic Indicators (October 2017 and February 2018), Statistics Canada, U.S. Energy Information Administration, Bank of Canada, Ontario Ministry of Finance Survey of Forecasters (March 2018) and Ontario Ministry of Finance.
Global economic growth has picked up broadly, with both emerging market and advanced economies recently outperforming expectations. Global real GDP growth is expected to strengthen broadly among both advanced and emerging economies from 3.7 per cent in 2017 to 3.9 per cent in both 2018 and 2019, followed by 3.7 per cent in 2020 and 3.8 per cent in 2021. The U.S. economy has been expanding at a robust pace and is expected to continue growing this year, with real GDP projected to increase by 2.8 per cent in 2018. Canada’s real GDP growth is forecast to moderate from 3.0 per cent in 2017 to 2.2 per cent in 2018, as growth returns to a moderate pace in most provinces following a strong performance last year. In many other advanced economies, including Japan and Euro member states, growth projections are relatively solid for 2018 and 2019.
In response to strong economic growth and associated capacity constraints raising the prospects of increased inflationary pressure, the Bank of Canada has hiked short-term rates three times since July 2017, raising the overnight rate from 0.50 per cent to 1.25 per cent, matching increases by the U.S. Federal Reserve last year. The yield on a three-month Canadian treasury bill is expected to rise to 1.4 per cent in 2018 from 0.7 per cent in 2017. Canadian long-term interest rates have also risen, reflecting stronger economic growth and expectations of further central bank tightening. Although rates have risen, global financial conditions remain supportive with interest rates still well below longer term averages.
Recently, oil prices have risen, supported by supply restrictions of the Organization of the Petroleum Exporting Countries (OPEC), potentially lower U.S. shale oil production and geopolitical tensions. However, forecasters expect only modest price gains over the projection period as higher oil prices will likely lead to a stronger production response in the United States, as shown by a recent increase in U.S. drilling activity.
Outlook for Continued Economic Growth
Exports and business investment are expected to be important contributors to Ontario’s economic growth over the forecast period. Strong global economic growth, particularly in the United States, and improved consumer confidence are expected to support this improvement. As well, there are signs that the Ontario economy is facing rising domestic capacity pressures. Consequently, business investment is projected to accelerate and continue to meet growth in demand. Business investment will continue to be supported by Ontario’s competitive business environment and strategic government actions. See Chapter II: Growing the Economy and Creating Good Jobs for a full discussion of government actions to support business investment and continued growth in economic prosperity.
Ontario’s exports are expected to rise by 1.8 per cent annually, on average, over the 2018–21 period. International exports are expected to continue to benefit from strong U.S. demand, led by continued gains in business investment. Interprovincial exports have picked up alongside stronger economic conditions in the rest of Canada. Although the Canadian dollar has risen over the past year, posing a competitive challenge for Ontario exporters, it remains well below the elevated levels that prevailed between 2005 and 2014. The currencies of other countries against which Ontario exporters compete have also risen against the U.S. dollar, helping the province’s relative competitiveness. Ontario and the United States both benefit from an integrated and productive global supply chain.
Business investment is expected to increase, with a strong gain in 2018, according to Statistics Canada’s latest Capital and Repair Expenditure Survey. Looking ahead, business investment is projected to rise by 4.2 per cent annually between 2018 and 2021 led by strong U.S. demand and rising domestic capacity pressures.
The labour market in Ontario experienced strong growth in 2017. Employment increased by 1.8 per cent and the average annual unemployment rate declined to 6.0 per cent. Employment is forecast to remain strong in 2018, increasing by 1.7 per cent or 121,000 net new jobs. Steady employment gains of 0.9 per cent annually, on average, are expected over the 2019–21 period. This is projected to gradually lower Ontario’s unemployment rate to 5.4 per cent by 2021.
While continued job growth and higher wages are expected to support consumer spending in Ontario, these gains are expected to be moderated by rising interest rates and high levels of household debt. Following growth of 4.0 per cent in 2017, annual real household consumption gains are forecast to average 2.4 per cent over the 2018–21 period.
After a period of elevated activity, the Ontario housing market began rebalancing in 2017. Following the strong gains in resale activity at the beginning of the year, sales and prices softened through the summer and then stabilized in the fall. Activity in early 2018 has declined as the market adjusts to the impact of the revised Guideline B-20 – Residential Mortgage Underwriting Practices and Procedures issued by the Office of the Superintendent of Financial Institutions (OSFI). Home prices are forecast to increase at a modest pace beyond 2018 as rising interest rates, historically high valuations, and mortgage debt temper healthy demographic-related demand.
Risks to Ontario’s Economic Outlook
There are a number of risks that could affect Ontario’s economic outlook. Externally, stronger global economic growth, including in the United States and the rest of Canada, may provide a boost to Ontario’s production. Potential changes to the North American Free Trade Agreement (NAFTA) and other protectionist measures could disrupt trade patterns and affect Ontario exporters. Recent tax reform in the United States may lessen Ontario’s competitiveness and weaken business investment. Domestically, high levels of household debt have left Ontario households more sensitive to rising interest rates. At the same time, the Ontario housing market is rebalancing after a period of sharp price appreciation. During this transition, there is a risk that faster-than-expected interest rate increases could lead to a more significant moderation in consumer spending growth and housing activity.
| Item | First Year | Second Year |
|---|---|---|
| Canadian Dollar Depreciates by Five Cents US | 0.1 to 0.7 | 0.2 to 0.8 |
| Crude Oil Prices Decrease by $10 US per Barrel | 0.1 to 0.3 | 0.1 to 0.3 |
| U.S. Real GDP Growth Increases by One Percentage Point | 0.2 to 0.6 | 0.3 to 0.7 |
| Canadian Interest Rates Increase by One Percentage Point | (0.1) to (0.5) | (0.2) to (0.6) |
Table 3.4 Footnotes:
Source: Ontario Ministry of Finance.
Ontario Economic Outlook Details
Table 3.5 provides details of the Ministry of Finance’s economic outlook for 2018–21.
| Item | Actual 2016 | Projection 2017e | Projection 2018 | Projection 2019 | Projection 2020 | Projection 2021 |
|---|---|---|---|---|---|---|
| Real Gross Domestic Product | 2.6 | 2.7 | 2.2 | 1.8 | 1.9 | 1.7 |
| Household Consumption | 3.0 | 4.0 | 3.0 | 2.2 | 2.0 | 2.1 |
| Residential Construction | 7.5 | 4.4 | (1.6) | 0.3 | 2.2 | 2.3 |
| Non-Residential Construction | (10.1) | 1.3 | 5.0 | 5.0 | 3.3 | 2.7 |
| Machinery and Equipment | (7.8) | 3.2 | 5.3 | 5.5 | 3.3 | 4.1 |
| Exports | 2.5 | (0.6) | 1.5 | 2.1 | 2.0 | 1.7 |
| Imports | 0.0 | 0.8 | 1.9 | 2.5 | 2.0 | 1.9 |
| Nominal Gross Domestic Product | 4.3 | 4.4 | 4.1 | 3.9 | 4.0 | 3.9 |
| Primary Household Income | 3.1 | 3.1 | 5.3 | 4.3 | 4.0 | 4.1 |
| Compensation of Employees | 3.3 | 3.6 | 5.9 | 4.5 | 4.2 | 4.2 |
| Net Operating Surplus — Corporations | 7.3 | 9.2 | 1.5 | 3.5 | 2.8 | 4.1 |
| Other Economic Indicators — Retail Sales | 7.1 | 6.4 | 4.3 | 3.8 | 3.9 | 3.3 |
| Other Economic Indicators — Housing Starts (000s) | 75.0 | 79.1 | 72.4 | 69.5 | 71.7 | 71.5 |
| Other Economic Indicators — Home Resales | 8.5 | (9.6) | 2.0 | 0.8 | 3.4 | 2.5 |
| Other Economic Indicators — Home Resale Prices | 15.1 | 9.5 | 0.0 | 3.1 | 5.0 | 5.0 |
| Other Economic Indicators — Consumer Price Index | 1.8 | 1.7 | 2.2 | 2.2 | 2.1 | 1.9 |
| Other Economic Indicators — Employment | 1.1 | 1.8 | 1.7 | 1.1 | 0.9 | 0.8 |
| Other Economic Indicators — Job Creation (000s) | 76 | 128 | 121 | 77 | 62 | 60 |
| Other Economic Indicators — Unemployment Rate (Per Cent) | 6.5 | 6.0 | 5.5 | 5.4 | 5.4 | 5.4 |
| Key External Variables1 — U.S. Real Gross Domestic Product | 1.5 | 2.3 | 2.8 | 2.4 | 2.1 | 2.0 |
| Key External Variables — WTI Crude Oil ($ US/bbl.) | 43 | 51 | 59 | 59 | 59 | 60 |
| Key External Variables — Canadian Dollar (Cents US) | 75.5 | 77.0 | 80.1 | 80.9 | 81.2 | 81.2 |
| Key External Variables — Three-Month Treasury Bill Rate2 | 0.5 | 0.7 | 1.4 | 2.2 | 2.7 | 2.7 |
| Key External Variables — 10-Year Government Bond Rate3 | 1.3 | 1.8 | 2.4 | 3.0 | 3.5 | 3.5 |
Table 3.5 Footnotes:
e = estimate
[1], [2], [3] Government of Canada interest rates (per cent).
Sources: Statistics Canada, Canada Mortgage and Housing Corporation, Canadian Real Estate Association, Bank of Canada, U.S. Bureau of Economic Analysis, Blue Chip Economic Indicators (October 2017 and February 2018), U.S. Energy Information Administration and Ontario Ministry of Finance
Private-Sector Forecasts
The Ministry of Finance consults with private-sector economists and tracks their forecasts to inform the government’s planning assumptions. In the process of preparing the 2018 Budget, the Minister of Finance met with private-sector economists to discuss their views. In addition, three economic experts reviewed the Ministry of Finance’s economic assumptions and found them to be reasonable.1
Private-sector economists are projecting continued growth for Ontario over the forecast period. On average, private-sector economists are calling for real GDP growth of 2.3 per cent in 2018, 1.9 per cent in 2019, 2.0 per cent in 2020, and 1.8 per cent in 2021. For prudent fiscal planning, the Ministry of Finance’s real GDP growth projections are slightly below the average private-sector forecast.
| Item | 2018 | 2019 | 2020 | 2021 |
|---|---|---|---|---|
| BMO Capital Markets (February) | 2.4 | 2.0 | – | – |
| Central 1 Credit Union (February) | 2.5 | 2.3 | 2.1 | 2.2 |
| Stokes Economic Consulting (February) | 2.4 | 2.0 | 2.0 | 2.1 |
| CIBC World Markets (January) | 2.3 | 1.7 | – | – |
| The Conference Board of Canada (February) | 1.9 | 1.8 | 1.9 | 2.0 |
| Desjardins Group (February) | 2.2 | 2.0 | 1.5 | 0.3 |
| IHS Global Insight (January) | 2.6 | 2.4 | 2.2 | 2.1 |
| Laurentian Bank Securities (February) | 2.1 | 1.9 | – | – |
| National Bank of Canada (February) | 2.6 | 1.4 | – | – |
| RBC Financial Group (December) | 2.1 | 1.8 | – | – |
| Scotiabank Group (February) | 2.3 | 1.8 | – | – |
| TD Bank Financial Group (December) | 2.3 | 1.9 | – | – |
| University of Toronto (January) | 2.2 | 2.1 | 2.3 | 2.3 |
| Private-Sector Survey Average | 2.3 | 1.9 | 2.0 | 1.8 |
| Ontario’s Planning Assumption | 2.2 | 1.8 | 1.9 | 1.7 |
Comparison to the 2017 Budget
Key changes since the 2017 Budget include:
- Higher real GDP growth in 2017 and 2018, followed by more modest growth in 2019 and stronger in 2020;
- Modestly higher nominal GDP growth in 2017, and on average modestly lower nominal GDP growth over the 2018–20 period;
- Higher Canadian dollar and stronger U.S. real GDP growth over the 2018–20 period; and
- Upward revisions to the three-month treasury bill rate over the 2018–20 period.
| Item | 2017 — 2017 Budget | 2017 — 2018 Budget | 2018p — 2017 Budget | 2018p — 2018 Budget | 2019p —2017 Budget | 2019p — 2018 Budget | 2020p — 2017 Budget | 2020p — 2018 Budget |
|---|---|---|---|---|---|---|---|---|
| Real Gross Domestic Product | 2.3 | 2.7 | 2.1 | 2.2 | 2.0 | 1.8 | 1.7 | 1.9 |
| Nominal Gross Domestic Product | 4.3 | 4.4 | 4.1 | 4.1 | 4.2 | 3.9 | 3.9 | 4.0 |
| Retail Sales | 3.9 | 6.4 | 3.7 | 4.3 | 3.8 | 3.8 | 3.3 | 3.9 |
| Housing Starts (000s) | 72.0 | 79.1 | 68.5 | 72.4 | 71.0 | 69.5 | 72.0 | 71.7 |
| Primary Household Income | 3.9 | 3.1 | 4.0 | 5.3 | 4.1 | 4.3 | 3.9 | 4.0 |
| Compensation of Employees | 4.1 | 3.6 | 4.5 | 5.9 | 4.6 | 4.5 | 4.2 | 4.2 |
| Net Operating Surplus — Corporations | 6.8 | 9.2 | 7.1 | 1.5 | 5.4 | 3.5 | 4.0 | 2.8 |
| Employment | 1.3 | 1.8 | 1.2 | 1.7 | 1.1 | 1.1 | 0.9 | 0.9 |
| Job Creation (000s) | 94 | 128 | 89 | 121 | 82 | 77 | 66 | 62 |
| Consumer Price Index | 2.0 | 1.7 | 2.0 | 2.2 | 2.0 | 2.2 | 2.0 | 2.1 |
| Key External Variables — U.S. Real Gross Domestic Product | 2.3 | 2.3 | 2.4 | 2.8 | 2.1 | 2.4 | 2.0 | 2.1 |
| Key External Variables — WTI Crude Oil ($ US/bbl.) | 54 | 51 | 59 | 59 | 62 | 59 | 64 | 59 |
| Key External Variables — Canadian Dollar (Cents US) | 74.5 | 77.0 | 75.5 | 80.1 | 78.5 | 80.9 | 80.0 | 81.2 |
| Key External Variables — Three-Month Treasury Bill Rate1 (Per Cent) | 0.5 | 0.7 | 0.8 | 1.4 | 1.5 | 2.2 | 1.9 | 2.7 |
| Key External Variables — 10-Year Government Bond Rate2 (Per Cent) | 1.9 | 1.8 | 2.4 | 2.4 | 3.0 | 3.0 | 3.2 | 3.5 |
Table 3.7 Footnotes:
p = Ontario Ministry of Finance planning projection.
[1], [2] Government of Canada interest rates.
Sources: Statistics Canada, Canada Mortgage and Housing Corporation, Bank of Canada, U.S. Energy Information Administration, U.S. Bureau of Economic Analysis, Blue Chip Economic Indicators (October 2017 and February 2018) and Ontario Ministry of Finance.
Chart Descriptions
Chart 3.6: Ontario’s Economic Growth has Outpaced G7
The bar chart shows the real GDP average annual per cent change for all G7 countries and Ontario from 2014 to 2017. The change in real GDP for each jurisdiction is as follows: Ontario (+2.7 per cent), United States (+2.3 per cent), United Kingdom (+2.3 per cent), Canada (+2.1 per cent), Germany (+2.0 per cent), France (+1.2 per cent), Japan (+1.1 per cent) and Italy (+0.9 per cent).
Notes: 2017 real GDP growth for Ontario is based on forecasted data.
Sources: Organisation for Economic Co-operation and Development (OECD), Italian National Institute of Statistics (Istat), Statistics Canada, Ontario Ministry of Finance Survey of Forecasters (March 2018) and Ontario Ministry of Finance.
Chart 3.7: Quality Job Gains and Unemployment Rate Decline
The economy continues to create high-quality jobs. Since the global recession, the unemployment rate has steadily declined from a high of 9.6 per cent in June 2009 to 5.5 per cent in February 2018. Also since June 2009, 811,000 net new jobs have been created in Ontario. Of the 811,000 net new jobs created, 774,300 (95.5 per cent) were full-time jobs, 580,600 (71.6 per cent) were in the private sector, and 542,600 (66.9 per cent) were jobs in industries* that pay above-average wages.
* Above-average wage industries are defined as those with earnings above the average hourly earnings of all industries in 2017.
Sources: Statistics Canada and Ontario Ministry of Finance.
| Month | Employment (000s) | Unemployment Rate (Per Cent) |
|---|---|---|
| 08-Jan | 6,578.80 | 6.4 |
| 08-Feb | 6,626.70 | 6.2 |
| 08-Mar | 6,605.80 | 6.5 |
| 08-Apr | 6,623.00 | 6.2 |
| 08-May | 6,638.20 | 6.3 |
| 08-Jun | 6,599.70 | 6.4 |
| 08-Jul | 6,596.80 | 6.5 |
| 08-Aug | 6,614.00 | 6.4 |
| 08-Sep | 6,632.70 | 6.4 |
| 08-Oct | 6,650.10 | 6.6 |
| 08-Nov | 6,568.00 | 7.3 |
| 08-Dec | 6,576.20 | 7.4 |
| 09-Jan | 6,480.50 | 8.1 |
| 09-Feb | 6,461.20 | 8.8 |
| 09-Mar | 6,458.80 | 8.8 |
| 09-Apr | 6,416.40 | 9.0 |
| 09-May | 6,385.70 | 9.5 |
| 09-Jun | 6,377.60 | 9.6 |
| 09-Jul | 6,407.40 | 9.5 |
| 09-Aug | 6,418.10 | 9.4 |
| 09-Sep | 6,438.00 | 9.1 |
| 09-Oct | 6,458.40 | 9.0 |
| 09-Nov | 6,465.50 | 9.3 |
| 09-Dec | 6,451.60 | 9.2 |
| 10-Jan | 6,483.70 | 9.0 |
| 10-Feb | 6,477.70 | 9.1 |
| 10-Mar | 6,471.10 | 9.0 |
| 10-Apr | 6,506.20 | 8.9 |
| 10-May | 6,543.20 | 8.7 |
| 10-Jun | 6,573.00 | 8.3 |
| 10-Jul | 6,566.90 | 8.6 |
| 10-Aug | 6,566.70 | 9.0 |
| 10-Sep | 6,534.30 | 9.0 |
| 10-Oct | 6,553.80 | 8.3 |
| 10-Nov | 6,578.90 | 8.2 |
| 10-Dec | 6,602.10 | 8.1 |
| 11-Jan | 6,638.10 | 8.1 |
| 11-Feb | 6,618.20 | 7.9 |
| 11-Mar | 6,629.40 | 8.1 |
| 11-Apr | 6,658.90 | 8.0 |
| 11-May | 6,649.10 | 8.1 |
| 11-Jun | 6,677.90 | 7.9 |
| 11-Jul | 6,670.20 | 7.7 |
| 11-Aug | 6,684.50 | 7.5 |
| 11-Sep | 6,668.50 | 7.9 |
| 11-Oct | 6,651.30 | 8.0 |
| 11-Nov | 6,668.60 | 8.0 |
| 11-Dec | 6,682.60 | 7.6 |
| 12-Jan | 6,669.80 | 8.1 |
| 12-Feb | 6,659.60 | 7.7 |
| 12-Mar | 6,692.40 | 7.7 |
| 12-Apr | 6,705.40 | 7.8 |
| 12-May | 6,672.60 | 8.2 |
| 12-Jun | 6,702.00 | 7.8 |
| 12-Jul | 6,709.30 | 7.9 |
| 12-Aug | 6,698.60 | 7.8 |
| 12-Sep | 6,714.30 | 7.9 |
| 12-Oct | 6,717.20 | 8.4 |
| 12-Nov | 6,735.80 | 7.9 |
| 12-Dec | 6,768.90 | 7.9 |
| 13-Jan | 6,771.70 | 7.7 |
| 13-Feb | 6,786.00 | 7.8 |
| 13-Mar | 6,785.50 | 7.8 |
| 13-Apr | 6,795.20 | 7.7 |
| 13-May | 6,822.60 | 7.5 |
| 13-Jun | 6,827.80 | 7.6 |
| 13-Jul | 6,828.20 | 7.6 |
| 13-Aug | 6,845.70 | 7.5 |
| 13-Sep | 6,856.10 | 7.3 |
| 13-Oct | 6,849.10 | 7.5 |
| 13-Nov | 6,856.90 | 7.3 |
| 13-Dec | 6,845.20 | 7.7 |
| 14-Jan | 6,843.00 | 7.4 |
| 14-Feb | 6,861.80 | 7.5 |
| 14-Mar | 6,864.30 | 7.4 |
| 14-Apr | 6,882.60 | 7.3 |
| 14-May | 6,864.90 | 7.3 |
| 14-Jun | 6,848.70 | 7.4 |
| 14-Jul | 6,879.70 | 7.6 |
| 14-Aug | 6,881.40 | 7.3 |
| 14-Sep | 6,892.30 | 7.1 |
| 14-Oct | 6,930.90 | 6.8 |
| 14-Nov | 6,899.40 | 7.0 |
| 14-Dec | 6,879.10 | 7.0 |
| 15-Jan | 6,878.70 | 6.8 |
| 15-Feb | 6,898.10 | 6.9 |
| 15-Mar | 6,899.60 | 6.8 |
| 15-Apr | 6,894.00 | 6.8 |
| 15-May | 6,925.80 | 6.5 |
| 15-Jun | 6,943.90 | 6.5 |
| 15-Jul | 6,953.90 | 6.5 |
| 15-Aug | 6,949.80 | 6.8 |
| 15-Sep | 6,919.60 | 6.9 |
| 15-Oct | 6,935.00 | 6.7 |
| 15-Nov | 6,930.30 | 7.0 |
| 15-Dec | 6,963.10 | 6.7 |
| 16-Jan | 6,976.40 | 6.8 |
| 16-Feb | 6,966.10 | 6.8 |
| 16-Mar | 6,984.60 | 6.7 |
| 16-Apr | 6,988.30 | 7.0 |
| 16-May | 6,998.70 | 6.5 |
| 16-Jun | 7,009.30 | 6.3 |
| 16-Jul | 6,977.00 | 6.4 |
| 16-Aug | 6,986.70 | 6.8 |
| 16-Sep | 7,003.50 | 6.6 |
| 16-Oct | 7,026.40 | 6.3 |
| 16-Nov | 7,034.90 | 6.3 |
| 16-Dec | 7,044.00 | 6.4 |
| 17-Jan | 7,068.60 | 6.4 |
| 17-Feb | 7,074.90 | 6.2 |
| 17-Mar | 7,069.60 | 6.3 |
| 17-Apr | 7,075.10 | 5.9 |
| 17-May | 7,083.80 | 6.4 |
| 17-Jun | 7,087.60 | 6.4 |
| 17-Jul | 7,122.40 | 6.0 |
| 17-Aug | 7,146.30 | 5.5 |
| 17-Sep | 7,178.20 | 5.7 |
| 17-Oct | 7,180.70 | 5.8 |
| 17-Nov | 7,217.70 | 5.5 |
| 17-Dec | 7,223.80 | 5.6 |
| 18-Jan | 7,172.90 | 5.5 |
| 18-Feb | 7,188.60 | 5.5 |
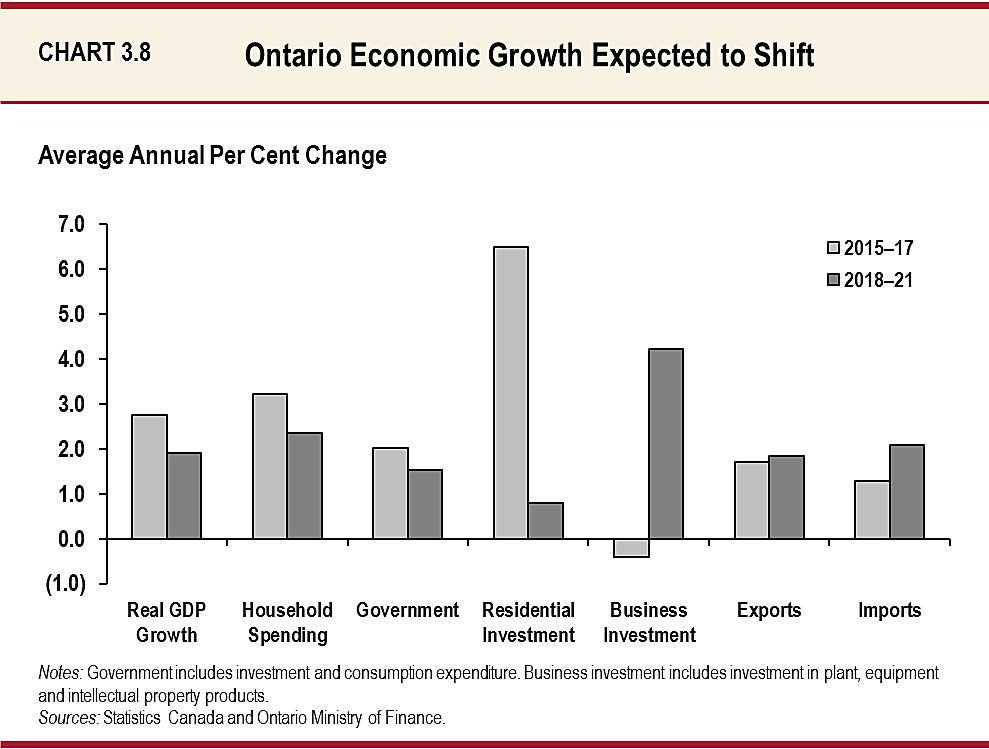
Chart 3.8: Ontario Economic Growth Expected to Shift
The bar chart shows the composition of Ontario economic growth over the 2015–17 period and the 2018–21 period. The overall economy is estimated to have averaged real GDP growth of 2.8 per cent over the 2015–17 period. Over this period, average annual growth is estimated at 3.2 per cent for household spending, 2.0 per cent for government, 6.5 per cent for residential investment, -0.4 per cent for business investment, 1.7 per cent for exports and 1.3 per cent for imports. Over the 2018–21 period, total real GDP growth is projected to average annual gains of 1.9 per cent. Over this period, average annual growth is estimated at 2.4 per cent for household spending, 1.5 per cent for government, 0.8 per cent for residential investment, 4.2 per cent for business investment, 1.8 per cent for exports and 2.1 per cent for imports.
Notes: Government includes investment and consumption expenditure. Business investment includes investment in plant, equipment and intellectual property products.
Sources: Statistics Canada and Ontario Ministry of Finance.
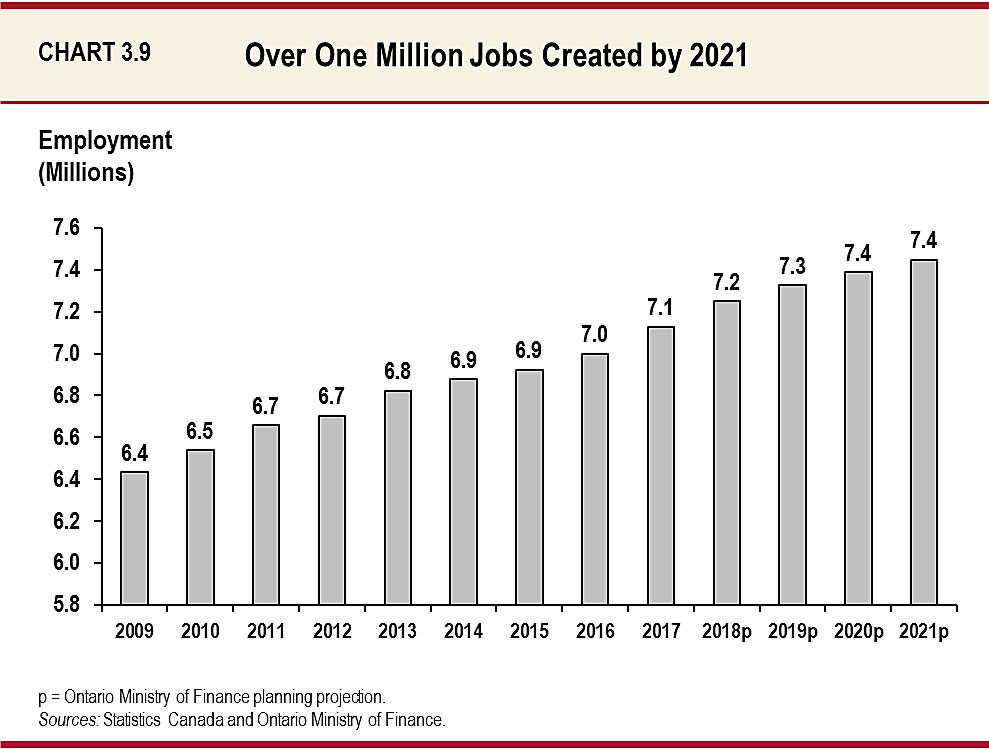
Chart 3.9: Over One Million Jobs Created by 2021
The bar chart shows the annual level of Ontario employment from 2009 to 2021. Ontario employment rose from 6.4 million in 2009 to 7.1 million in 2017. The Ontario Ministry of Finance projects employment will increase steadily to 7.4 million in 2021, for a gain of over 1,000,000 jobs since 2009.
| Year | Employment (Millions) |
|---|---|
| 2009 | 6.4 |
| 2010 | 6.5 |
| 2011 | 6.7 |
| 2012 | 6.7 |
| 2013 | 6.8 |
| 2014 | 6.9 |
| 2015 | 6.9 |
| 2016 | 7.0 |
| 2017 | 7.1 |
| 2018p | 7.2 |
| 2019p | 7.3 |
| 2020p | 7.4 |
| 2021p | 7.4 |
p = Ontario Ministry of Finance planning projection.
Sources: Statistics Canada and Ontario Ministry of Finance.
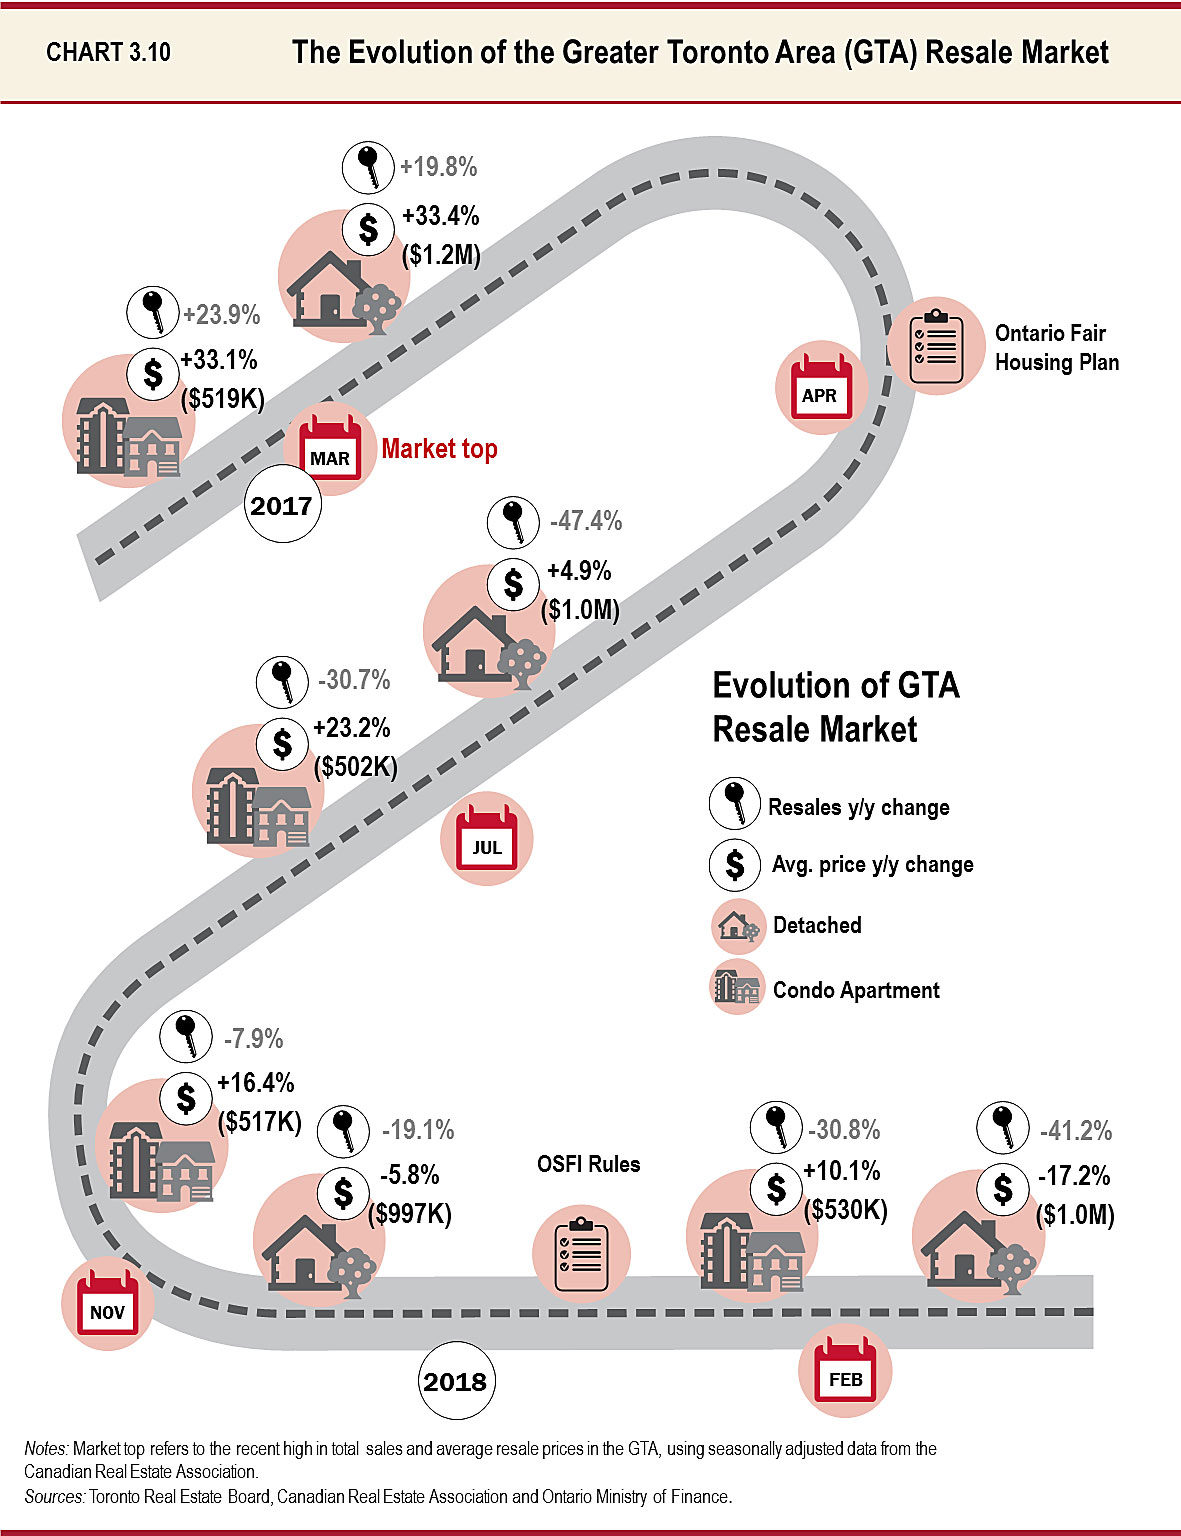
Chart 3.10: The Evolution of the Greater Toronto Area (GTA) Resale Market
This infographic describes the evolution of Greater Toronto Area’s (GTA) resale housing market for detached homes and condo apartments since the beginning of 2017. Based on seasonally adjusted data for total sales and average resale prices from the Canadian Real Estate Association (CREA), the overall GTA market reached a recent peak in March 2017. In the same month, Toronto Real Estate Board (TREB) data shows the average price for condo apartments reached $518,879, representing a 33.1 per cent year-over-year increase. Condo resales were up 23.9 per cent year-over-year. The average price for detached homes reached $1,214,422, representing a 33.4 per cent year-over-year increase.
Detached home resales increased 19.8 per cent year-over-year. In April 2017, the Government of Ontario introduced the Ontario Fair Housing Plan.
In July, TREB data shows the average condo apartment price increased 23.2 per cent year-over-year to $501,750 while sales dropped 30.7 per cent year-over-year. The average price for detached homes increased 4.9 per cent year-over-year to $1,000,336 while sales dropped 47.4 per cent year-over-year.
In November 2017, TREB data shows the average condo apartment price increased 16.4 per cent year-over-year to $516,965 while sales were down 7.9 per cent year-over-year. The average price for detached homes decreased 5.8 per cent year-over-year to $996,527 while sales dropped by 19.1 per cent year-over-year.
The Office of the Superintendent of Financial Institutions (OSFI) implemented the revised Guideline B-20 – Residential Mortgage Underwriting Practices and Procedures in January 2018.
In February 2018, the average condo price increased 10.1 per cent year-over-year to $529,782 while sales dropped 30.8 per cent year-over-year. The average price for detached homes decreased 17.2 per cent year-over-year to $1,000,736 while sales dropped 41.2 per cent year-over-year.
Notes: Market top refers to the recent high in total sales and average resale price in the GTA using seasonally adjusted data from the Canadian Real Estate Association.
Sources: Toronto Real Estate Board, Canadian Real Estate Association and Ontario Ministry of Finance.
Footnote
[1] The three experts are from the Policy and Economic Analysis Program at the Rotman Institute for International Business, Rotman School of Management, University of Toronto; The Centre for Spatial Economics; and The Conference Board of Canada.