Introduction
Ontario is delivering on its commitment to balance the budget in 2017–18, reflecting recent strong growth in the Ontario economy and sound fiscal management.
The government’s plan to balance the budget in 2017–18 is being achieved without making cuts to vital services that Ontario families rely on. Instead, the government has chosen to invest to support the economy and create jobs, while also making historic investments in infrastructure and implementing transformative actions to strengthen vital public services. This has led to improvements in health care, lower electricity bills, more affordable postsecondary education, greater access to child care, and strengthened supports for small businesses and seniors.
Since the recession, Ontario’s economy has strengthened, helping bring the unemployment rate down to a 17-year low. The province has exceeded all G7 countries in economic growth since 2014. While Ontario has been a net contributor to Equalization since first qualifying for the program in 2009–10, it is now projected to soon stop receiving federal Equalization payments, given its recent strength relative to other provinces in Canada.
While Ontario’s economy has been growing steadily, the government knows that more must be done to ensure that the benefits of a solid economy are being shared equally by all Ontarians. The government also knows that more must be done to prepare the people of Ontario for working in a rapidly changing economy, and growing uncertainty.
The government believes that the best way to deliver prosperity to more people in Ontario is by continuing to invest in the economy, and in public services that promote greater fairness and opportunity across the province. For this reason, the government has a plan to invest in key priorities and as a result, beginning in 2018–19, the Province is projecting a modest deficit of $6.7 billion, 0.8 per cent of gross domestic product (GDP).
These new investments will total $20.3 billion over three years and will focus on priority areas that will help create opportunity and make care more affordable such as health care, education, child care, seniors, social services, growing the economy and creating good jobs.
Moving forward, the government is committed to eliminating the deficit while balancing important investments in public services and fiscal responsibility. Investments will be assessed against a plan to manage overall growth in program spending through continued actions to reduce costs and make programs and services work more efficiently to meet the needs of today’s and future generations. At the same time while running deficits, the government is projecting that net debt-to-GDP will remain below its 2014–15 peak of 39.3 per cent and resume a downward trend in 2022–23.
Ontario’s Balanced Budget
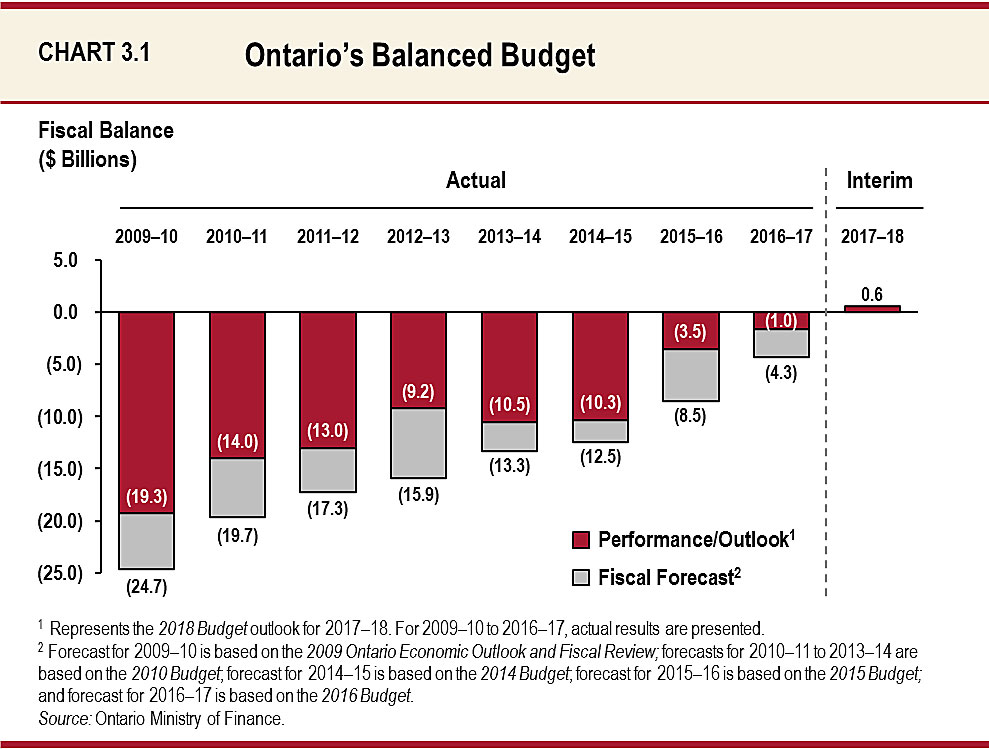
The government is forecasting a surplus of $0.6 billion in 2017–18, beating its fiscal target for the ninth year in a row, and delivering on the 2010 Budget commitment to balance the budget in 2017–18. By continuing to overachieve on its fiscal targets since 2009–10, the Province’s accumulated deficit is projected to be $36.2 billion lower, relative to annual forecasts.
The projected surplus would go towards reducing the amount of debt the government would have otherwise incurred this year. In fact, the net debt-to-GDP ratio has been on a declining track since 2014–15 and is projected to fall to 37.1 per cent in 2017–18, lower than the 2017 Budget projection of 37.5 per cent. In addition, interest on debt savings over the return to balance period now totals $24.4 billion, relative to the 2010 Budget forecast. Interest on debt expense, at 8 cents of every dollar of revenue, is lower in 2017‑18 than it has been over the past 25 years.
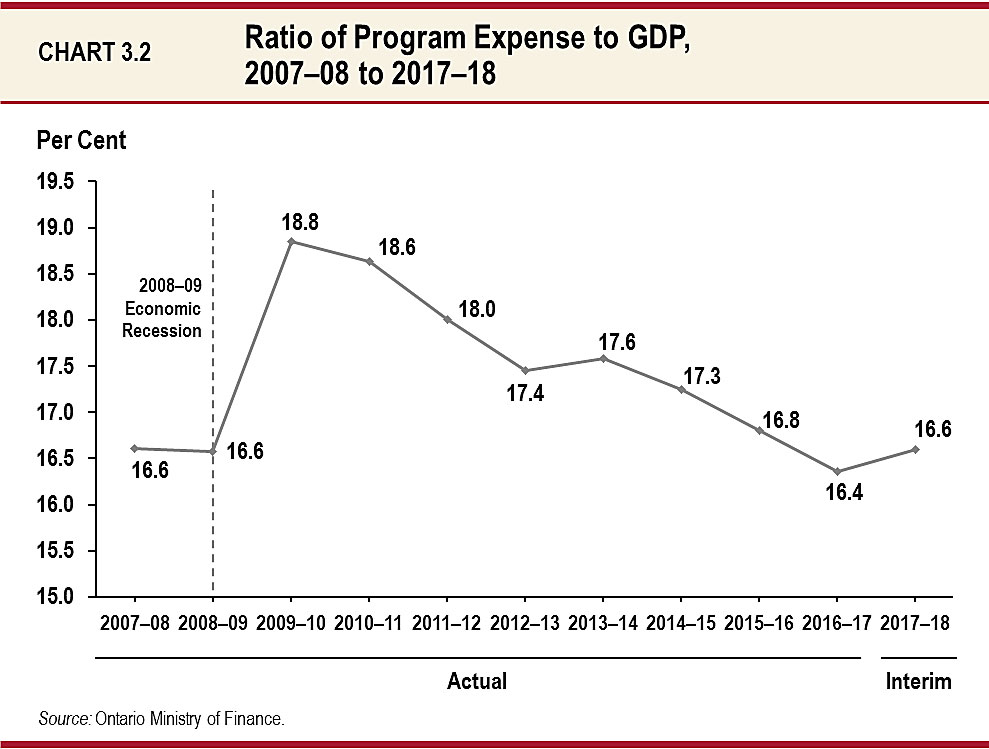
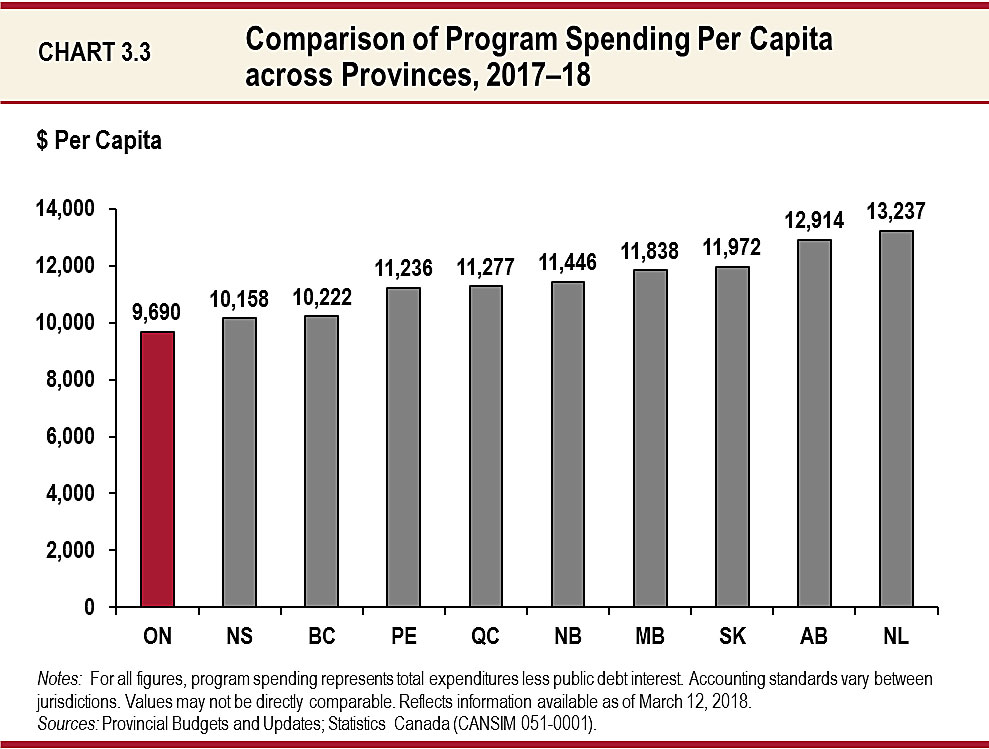
Supported by strong economic performance and responsible management of growth in program spending, Ontario’s program expense-to-GDP ratio is expected to remain at its pre-recession level of 16.6 per cent this year. Ontario is also projected to remain the province with the lowest program spending per capita in 2017–18. Together, this strengthened economic and fiscal footing positions the province well to make important investments while projecting deficits.
Ontario’s Economic Performance
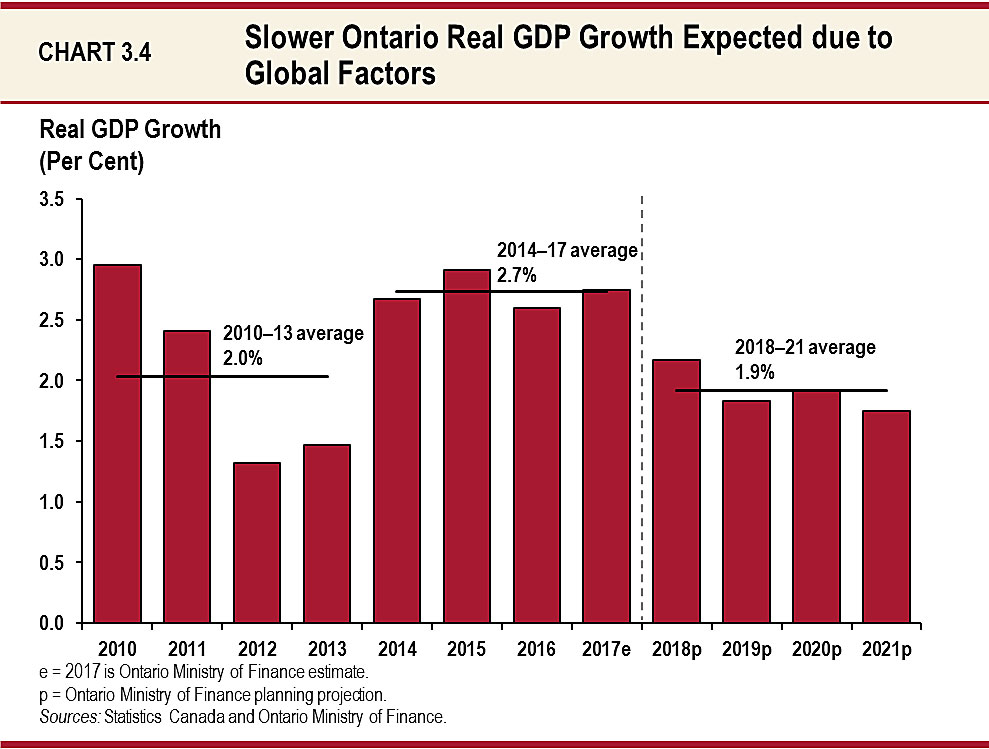
Ontario’s economy grew strongly over the last four years. Real GDP rose 2.7 per cent annually on average over the 2014–17 period, faster than average growth of 2.0 per cent between 2010–13. Since 2014, the province’s growth outpaced that of Canada and all other G7 economies. This strong growth helped more people find jobs and lowered the unemployment rate to a 17-year low. A less supportive global economic environment due to slightly higher interest rates, oil prices and the Canadian dollar is expected to moderate real GDP and employment gains over the next four years. Real GDP growth is expected to average 1.9 per cent per year between 2018 and 2021, in line with the national average. See Chapter III, Section B: Economic Outlook for a full discussion of Ontario’s economic outlook.
Despite Ontario’s solid economic underpinnings, there are a number of risks and challenges that could adversely affect the province’s competitiveness and economic growth, including recent tax reform in the United States, trade negotiations and other protectionist measures; high household debt; and the housing market.
Medium-Term Fiscal Plan
Ontario’s most valuable resource is its people. The hardworking people of Ontario are key to the province’s prosperity and deserve to be included in Ontario’s economic success. There are families that have yet to feel the benefits of this growth and continue to face mounting pressures on the cost of living and increasing household debt. The government believes that supporting public services that focus on creating opportunity and making care more affordable for the people of Ontario is good economic policy.
For this reason, the government is choosing to make investments of $20.3 billion over the next three years to support vital public services upon which the people of Ontario rely. This includes:
- $1.3 billion to provide better health care for everyone in Ontario;
- $1.2 billion to improve access to a full range of mental health and addictions services for children, youth and adults across Ontario;
- $2.2 billion to continue to increase access to affordable child care and introduce free preschool for children aged two-and-a-half until they are eligible for kindergarten starting in September 2020;
- $2.3 billion to embark on a multi-year plan to reform income security;
- $1.8 billion to expand services and enable choice, independence and inclusion for individuals with developmental disabilities;
- $1.0 billion to expand OHIP+ to seniors;
- $0.7 billion to support seniors to live independently;
- $0.8 billion to reduce prescription drug and dental costs; and
- $0.9 billion to build upon and strengthen economic foundations, support the development of local talent and entrepreneurs, and encourage the growth of businesses.
See Chapter I: A Plan for Care, Chapter II: Growing the Economy and Creating Good Jobs and Chapter III, Section C: Fiscal Plan for additional details on these investments.
As a result of these investments, program spending growth will average 3.3 per cent annually over the medium term. In addition, interest on debt expense is projected to grow from $12.5 billion in 2018–19 to $13.8 billion in 2020–21. This increase is mainly due to investments in capital assets and the deficit arising from expenditures on programs and services that the people of Ontario rely on.
The medium-term revenue outlook reflects growth in the economy, projecting to increase from $152.5 billion to $163.8 billion between 2018–19 and 2020–21, or at an average annual rate of 3.7 per cent. This revenue growth is largely based on the outlook for Ontario’s economy, with nominal GDP expected to rise at an annual average rate of 3.9 per cent over the same period.
To support new investments amid a moderate revenue forecast, the government is now forecasting deficits over the next three years of $6.7 billion in 2018–19, $6.6 billion in 2019–20, and $6.5 billion in 2020–21. This represents a projected deficit-to-GDP ratio of 0.8 per cent in 2018–19, declining to 0.7 per cent by 2020–21.
A Responsible Fiscal Recovery Plan
In fulfilling its promise to balance the budget in 2017–18, the government has demonstrated its ability to responsibly manage the province’s finances and take on challenges that may arise from uncertainty in the economy. The government remains committed to a recovery plan that will continue to take a balanced approach of investing and supporting key programs and services for Ontarians, and keeping the province’s finances on a sustainable footing.
| Item | Interim 2017–18 | Medium-Term Plan 2018–19 | Medium-Term Plan 2019–20 | Medium-Term Plan 2020–21 | Recovery Plan 2021–22 | Recovery Plan 2022–23 | Recovery Plan 2023–24 | Recovery Plan 2024–25 | Recovery Plan 2025–26 |
|---|---|---|---|---|---|---|---|---|---|
| Revenue | 150.1 | 152.5 | 157.6 | 163.8 | 169.5 | 174.9 | 180.4 | 186.5 | 192.9 |
| Expense — Programs | 137.5 | 145.9 | 150.4 | 155.8 | 159.5 | 162.7 | 166 | 169.3 | 172.7 |
| Expense — Interest on Debt | 12.0 | 12.5 | 13.1 | 13.8 | 14.9 | 15.5 | 16.3 | 16.5 | 16.9 |
| Total Expense | 149.5 | 158.5 | 163.5 | 169.6 | 174.4 | 178.2 | 182.2 | 185.8 | 189.6 |
| Surplus/(Deficit) Before Reserve | 0.6 | (6.0) | (5.9) | (5.8) | (4.9) | (3.3) | (1.8) | 0.7 | 3.3 |
| Reserve | – | 0.7 | 0.7 | 0.7 | 0.7 | 0.7 | 0.7 | 0.7 | 0.7 |
| Surplus/(Deficit) | 0.6 | (6.7) | (6.6) | (6.5) | (5.6) | (4.0) | (2.5) | 0.0 | 2.6 |
Table 3.1 Footnotes:
Note: Numbers may not add due to rounding.
The government’s plan to return to balance is deliberate and focused, to ensure identified fiscal targets are met in the coming years, and hinges on:
- Continuing responsible management of program spending to ensure public services are achieving outcomes in the most effective, efficient and sustainable way possible, holding the average annual rate of program spending growth to 2.5 per cent between 2018–19 and 2024–25;
- Maintaining fairness, accountability and integrity of provincial revenues (see Chapter V: Taxation);
- Managing the Province’s borrowing program prudently to minimize interest on debt costs (see Chapter III, Section D: Borrowing and Debt Management);
- Working collaboratively with the federal government to ensure that fiscal arrangements are adequate, flexible and sustainable, and that the federal–provincial relationship works for the people of Ontario (see Chapter IV: Fairness and Opportunity through Partnerships); and
- Maintaining a prudent level for the reserve to protect the recovery plan against unforeseen adverse changes in the Province’s revenue and expense forecasts.
The government remains committed to a recovery plan that returns to balanced budgets, while creating policies and programs that both benefit the people of Ontario and create the conditions for more robust economic expansion. A stronger Ontario, with a better economy and sustained job creation, is not just measured by GDP, but by the quality and reach of the opportunities that the government creates. The government will continue to balance fiscal responsibility while making strategic investments to build a strong foundation in Ontario to create greater opportunities for individuals and companies to thrive.
Making Government Services Work Better for Ontarians
Ontario remains committed to a recovery plan that will lead to a balanced budget in a responsible way. The ongoing focus is to improve outcomes — whether for individuals, businesses or the environment — and deliver value ensuring that every dollar spent aligns with achieving these outcomes in the most effective way possible.
Over the medium term and the recovery plan period, growth in program spending will be managed to an average annual rate of 2.5 per cent between 2018–19 and 2024–25. This will be supported by an ongoing focus on continuous improvement — making sure public services are achieving outcomes in the most effective, efficient and sustainable way possible. This involves:
- Finding ways to increase the reach of public services with existing program resources;
- Using innovative approaches and digital solutions to modernize public services, making them more user-centred and cost-effective; and
- Accelerating system transformation to maximize effectiveness, build longer-term sustainability and bend cost curves.
Ensuring Responsible Management of Spending
Management of program expenditures will be guided by a focus on innovation, improved user experience, better outcomes and reduced costs. Simply put, it means asking: Are the needs of Ontarians being met through provincial public services? Are programs being delivered in the right way? Can programs and services be improved or enhanced? Program modifications or changes will be informed by the best available evidence, and assessed for their ability to achieve intended outcomes.
This will involve making better use of current program resources, finding ways to reduce program costs to deliver to more clients, or making use of technology and other innovations to streamline and simplify service delivery. For example:
- Since 2006, the Ministry of Health and Long-Term Care has worked to negotiate agreements with drug manufacturers that have resulted in significant rebates to the government. Between 2006–07 and 2016–17, the rebates grew from $31 million to $1.1 billion, for agreements on more than 1,400 products. In addition, in 2010, Ontario joined the pan-Canadian Pharmaceutical Alliance to leverage the purchasing power of all 13 provinces and territories, as well as the federal drug plans. Together this group has negotiated significantly lower drug prices, more than any one province or territory could do on its own.
- Typically, Ontarians have accessed court services in person. The Ministry of the Attorney General has been working to increase convenience and efficiency by making more services available online. Ontarians can now file online for small claims court and superior court civil matters.
- The Family Responsibility Office (FRO) is working to ensure that clients have flexibility and ease in accessing services. By leveraging leading practices in analytics, service design, behavioural insights and digital technologies, FRO is using evidence to inform operations and improve services. The result is that more families will get the support payments they are entitled to through court-ordered support responsibilities.
Using Innovative Approaches to Modernize Public Services
Improving Programs and Services through Experimentation and Evidence
Ontario’s Behavioural Insights Unit (BIU) is developing low-to-no-cost solutions, and generating evidence on what works — and what does not work — before scaling up. The BIU collaborates with its partners across the public sector to create more efficient processes, improve outcomes and deliver better services to Ontarians.
Where evidence shows that new approaches improve outcomes or enhance service experience for the people of Ontario, initiatives will be scaled up system wide.
Towards a Digitally Inclusive Ontario
In 2017, the Province introduced the Ontario Digital Service (ODS) to make services faster, simpler and better for people, communities and businesses. Better online services help make people’s lives better — seamlessly connecting them to health care services, demonstrating the affordability of college and university, or simplifying processes such as renewing a health card or driver’s licence.
At the heart of this approach is designing services that are easier to use and make life better for Ontarians. For example:
- The newly redesigned online Ontario Student Assistance Program (OSAP) application and calculator made it easier for students to see how much financial support is available to them, putting higher education within reach for thousands of Ontarians. The total number of OSAP awards increased by 16 per cent to 420,000 recipients from 2016–17 to 2017–18.
- A new OHIP+ prescription drug checker tool helps families see which medications are available and covered, with over 3,000 searches done daily, on average.
- The government is partnering with Code for Canada to develop a digital solution that will help adult learners easily compare, explore and discover programs that best fit their educational needs. Learners and service providers are directly participating in the creation of this solution.
Building on these results, ODS will implement a common Digital Service Standard for all online government services, so that Ontarians can access services easily from anywhere, any time and on any device.
These programs will be supported by a new government-wide Digital Inclusion Strategy that will be developed at ODS.
Enhancing Government Efforts to Transform Programs
Management of program expenditure will also build upon government action already underway to evaluate current government programs to make them work more efficiently and meet the needs of the people of Ontario. The government will support, leverage and enhance efforts to modernize and transform public services. This means the government will continue to:
- Find savings through program improvements and cost avoidance (i.e., less costly services now, or better outcomes and prevention of downstream costs), while maintaining high quality of services and supports;
- Reduce duplication across service sectors by harmonizing program delivery, reallocating existing resources to more effective programs, and scaling down investments that no longer demonstrate value for money; and
- Establish and assess investment priorities to manage overall sustainability of program spending.
The government is committed to openness and transparency. It is important that the needs of Ontarians and their ideas help identify program options and form the solutions. Program transformation and modernization will be informed by their experience, knowledge and lessons learned. The government will also harness the expertise of thought leaders and experts. Jurisdictions with effective innovation, modernization and expenditure management processes will be consulted.
Industry leaders, academic experts and representatives from the general public will be engaged to help guide program transformation, and make recommendations to the government on how to best achieve outcomes and improve user experience while focusing on cost savings or avoidance.
The investments that the government is currently making are restructuring and transforming public services to make them work more efficiently and meet the needs of the people of Ontario. Targeted investments in key sectors aim to accelerate system transformation, maximize effectiveness and build longer-term sustainability. For example:
- Increasing access to child care so that more children and their families can choose high-quality licensed care in a safe and convenient setting. Child care is an integral part of women’s economic empowerment, and an investment in the future of Ontario.
- Expanding mental health and addictions services to ensure that people living with mental illness or substance abuse disorder have the supports they need to recover and lead a healthy life. This focus is not only on health services such as greater access to psychotherapy and harm reduction services, but also on housing — ensuring that those living with mental illness or substance abuse disorder have a stable home as they recover. These investments will improve mental health outcomes, support active community participation and help to prevent negative outcomes down the road. See Chapter I: A Plan for Care for details.
- Investments in hospitals support the needs of local communities and residents, and ensures immediate and short-term health care needs are met. The government is also investing in care outside of hospitals — in the home and community. See Chapter I: A Plan for Care for details.
These investments will harness innovative approaches to business practices and service delivery to achieve desired outcomes and make programs more user-centred.
Government Transparency and Financial Management
Ontario continues to further strengthen government transparency, financial management and fiscal accountability in supporting its fiscal plan and exercising effective stewardship of public funds.
Government Transparency
Open Government
Ontario is taking a new, open approach to how government works by breaking down silos and driving active public engagement. The government is engaging with more Ontarians in different ways. Budget Talks, an online consultation tool, is just one example of how the Province is engaging with citizens to help shape the policies and programs that will be part of Ontario’s future.
As part of its involvement in the Open Government Partnership, Ontario has been working with the public, non-governmental organizations and community groups to develop commitments that leverage innovation and technology to increase transparency, accountability and public participation.
Ontario is also proactively sharing government data and information so that Ontarians can better understand how government works. Government policies and directives are shared online to help show how decisions are made inside government. In addition to sharing more data, the government is also making data more accessible and easier for Ontarians to navigate. Public Accounts data is now released under an Open Government licence and using an interactive visualization tool powered by machine-readable data, making it easier to understand ministry expenditures.
In 2017, Ontario was the first province in Canada to adopt the International Open Data Charter, strengthening its commitment to an open-by-default approach. Open government is driving public engagement and enabling more businesses, not-for-profits and public-sector partners to use high-value data and develop customer-centric tools.
Recent Developments in Public Sector Accounting Standards
The government continues to provide input to the Public Sector Accounting Board (PSAB) on a number of initiatives, including PSAB’s review of its conceptual framework, employment benefits such as pensions, accounting for financial instruments and foreign currency translation, and public-private partnerships. New accounting standards on foreign currency translation and financial instruments are effective for the 2019–20 fiscal year, although the PSAB is reviewing the effective date of these standards at its March 2018 meeting. The impact of these standards, if any, has not been reflected in the fiscal plan. In addition, the government will ensure its accounting and reporting are amended as required to implement the new standards on revenue and asset retirement obligations once issued.
Users, including the legislature and the public, need accountability in government reporting and decision-making. As a result, it is essential that public-sector financial statements reflect the substance of the government’s activities.
Financial Management
Enterprise Risk Management
The Province continues to implement enterprise risk management (ERM) across the Ontario Public Service, which includes improving risk assessment in planning and decision-making processes and building risk management capacity across the enterprise. This implementation will support the achievement of government objectives through the enterprise-wide integration of risk management into decision-making, policy development, operations and transformation activities of ministries and Provincial agencies. The adoption of an enterprise-wide approach to risk management will strengthen the government’s capacity to both create and protect value in programs and services.
Modernizing Financial Management Tools
The government is undertaking multiple initiatives to strengthen and modernize support for fiscal plan management. Enhancing the integration of information technology and deploying more advanced reporting and analysis tools will streamline the planning, budgeting, forecasting, consolidation and reporting processes that support the delivery of the fiscal plan and the Public Accounts.
Chart Descriptions
Chart 3.1: Ontario’s Balanced Budget
This bar chart shows Ontario’s actual deficits versus deficit targets from 2009–10 through 2016–17, and the fiscal outlook for 2017–18.
In the 2009 Ontario Economic Outlook and Fiscal Review, Ontario projected a $24.7 billion deficit for 2009–10. The actual result for 2009–10 was a deficit of $19.3 billion.
The 2010 Budget projected deficits of $19.7 billion for 2010–11, $17.3 billion for 2011–12, $15.9 billion for 2012–13, and $13.3 billion for 2013–14. The actual deficits were $14.0 billion in 2010–11, $13.0 billion in 2011–12, $9.2 billion in 2012–13, and $10.5 billion in 2013–14.
In the 2014 Budget, Ontario projected a $12.5 billion deficit for 2014–15. The actual result for 2014–15 was a deficit of $10.3 billion.
In the 2015 Budget, Ontario projected an $8.5 billion deficit for 2015–16. The actual result for 2015–16 was a deficit of $3.5 billion.
In the 2016 Budget, Ontario projected a $4.3 billion deficit for 2016–17 and balance for 2017–18. The actual result for 2016–17 was a deficit of $1.0 billion.
In the 2018 Budget, the government is projecting an interim surplus of $0.6 billion in 2017–18.
Source: Ontario Ministry of Finance.
Chart 3.2: Ratio of Program Expense to GDP, 2007–08 to 2017–18
This line chart shows the per cent ratio of Ontario’s program expense to nominal GDP from 2007–08 to 2017–18. Based on interim expense projections, program expense to GDP in 2017–18 is expected to remain at its pre-recession level of 16.6 per cent.
| Year | Program Expense to GDP |
|---|---|
| 2007–08 | 16.6 (actual) |
| 2008–09 | 16.6 (actual) |
| 2009–10 | 18.8 (actual) |
| 2010–11 | 18.6 (actual) |
| 2011–12 | 18.0 (actual) |
| 2012–13 | 17.4 (actual) |
| 2013–14 | 17.6 (actual) |
| 2014–15 | 17.3 (actual) |
| 2015–16 | 16.8 (actual) |
| 2016–17 | 16.4 (actual) |
| 2017–18 | 16.6 (interim) |
Source: Ontario Ministry of Finance.
Chart 3.3: Comparison of Program Spending Per Capita across Provinces, 2017‑18
This bar chart shows the dollar per capita program spending across provinces for 2017–18. Ontario has the lowest program spending per capita at $9,690. Newfoundland and Labrador has the highest program spending per capita across provinces.
| Province | Per Capita Program Spending |
|---|---|
| Ontario | 9,690 |
| Nova Scotia | 10,158 |
| British Columbia | 10,222 |
| Prince Edward Island | 11,236 |
| Quebec | 11,277 |
| New Brunswick | 11,446 |
| Manitoba | 11,838 |
| Saskatchewan | 11,972 |
| Alberta | 12,914 |
| Newfoundland and Labrador | 13,237 |
Chart 3.4: Slower Ontario Real GDP Growth Expected due to Global Factors
This chart illustrates that slower Ontario real GDP growth is expected. The chart shows actual annual real GDP growth for Ontario from 2010 to 2016, estimated growth for 2017 and projected growth from 2018 to 2021. The average annual real GDP growth was 2.0 per cent for the 2010–13 period, 2.7 per cent for the 2014–17 period and 1.9 per cent for the 2018–21 period.
| Year | Real GDP |
|---|---|
| 2010 | 2.9 |
| 2011 | 2.4 |
| 2012 | 1.3 |
| 2013 | 1.5 |
| 2014 | 2.7 |
| 2015 | 2.9 |
| 2016 | 2.6 |
| 2017e | 2.7 |
| 2018p | 2.2 |
| 2019p | 1.8 |
| 2020p | 1.9 |
| 2021p | 1.7 |
e = 2017 is Ontario Ministry of Finance estimate.
p = Ontario Ministry of Finance planning projection.
Sources: Statistics Canada and Ontario Ministry of Finance.
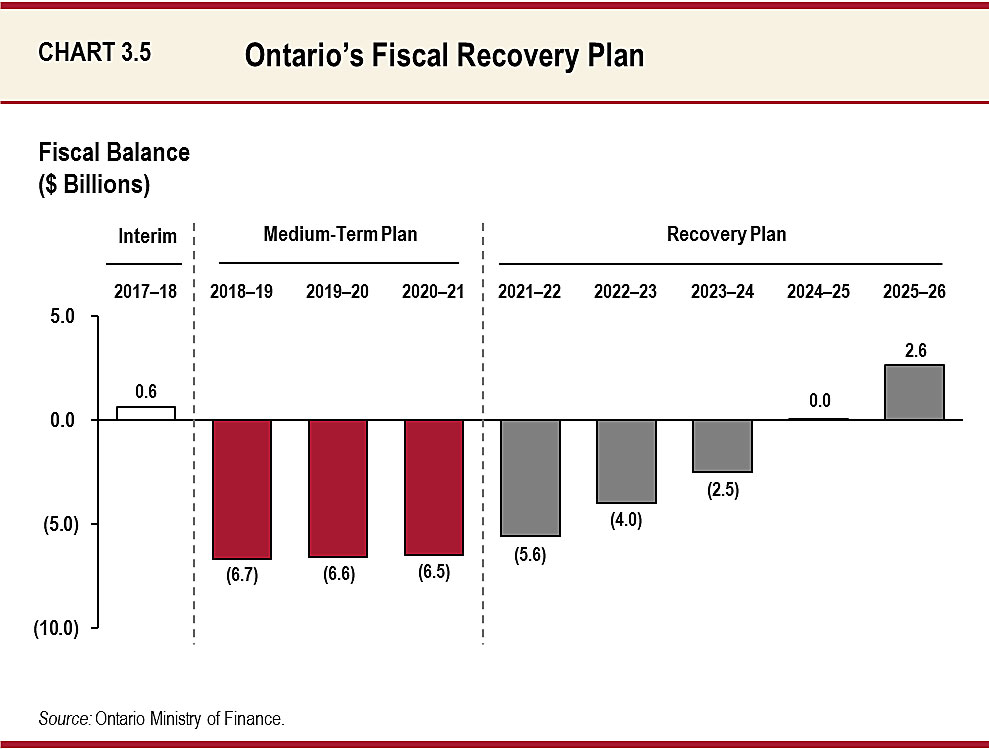
Chart 3.5: Ontario’s Fiscal Recovery Plan
This bar chart shows Ontario’s medium-term fiscal plan to 2020–21 and recovery plan to 2025–26, with balance projected in 2024–25, and a surplus projected in 2025–26. Each year, the government has set projections for fiscal targets that it will aim to meet, as follows:
| Year | Surplus/(Deficit) Target |
|---|---|
| 2017–18 | 0.6 |
| 2018–19 | -6.7 |
| 2019–20 | -6.6 |
| 2020–21 | -6.5 |
| 2021–22 | -5.6 |
| 2022–23 | -4 |
| 2023–24 | -2.5 |
| 2024–25 | 0 |
| 2025–26 | 2.6 |
Source: Ontario Ministry of Finance.