Introduction
Ontario conducts its borrowing program responsibly, respecting the people and businesses of Ontario by prudently managing interest on debt costs. To date, $25.9 billion, or 78 per cent, of this year’s long-term public borrowing requirement has been completed. The Province’s interim borrowing requirement in 2018–19 has decreased by $1.9 billion compared to the forecast which was based on the findings of the Independent Financial Commission of Inquiry (Commission).
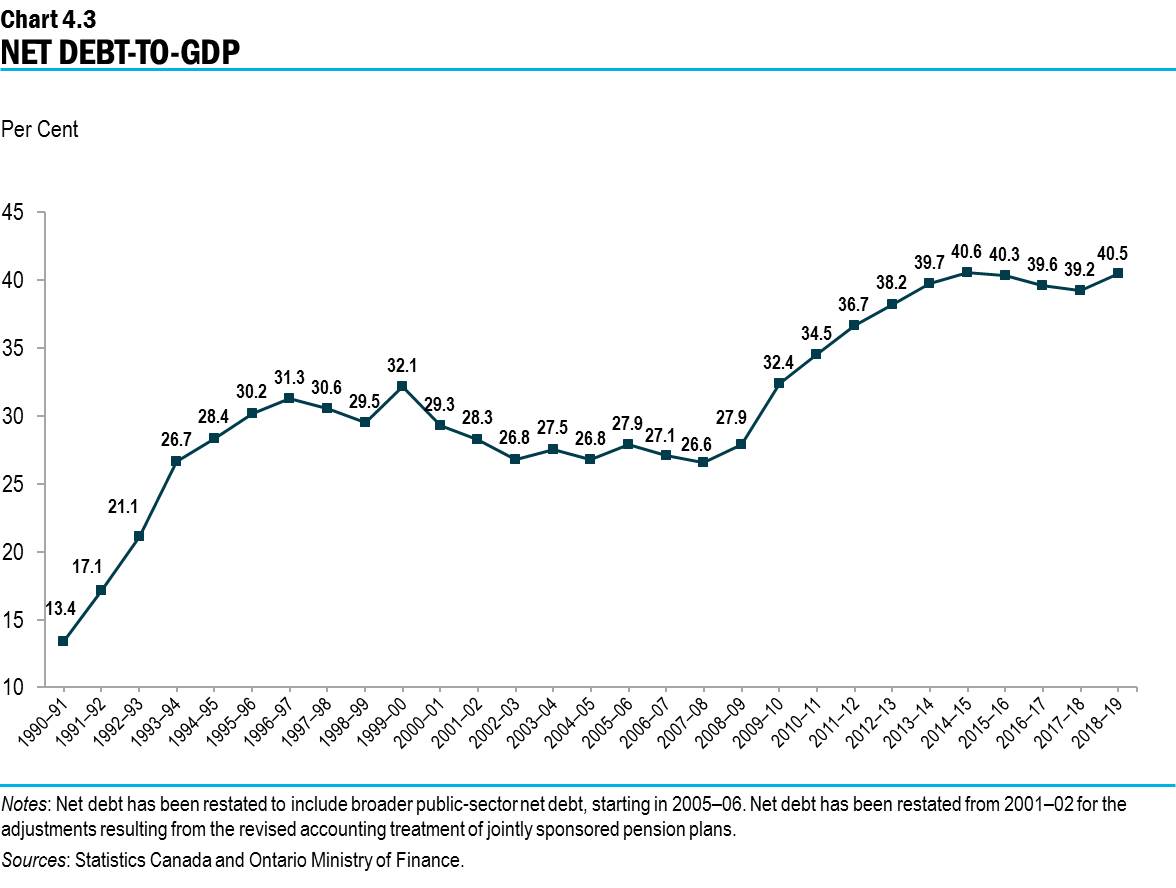
The Province has reported deficits in 24 of the last 29 years. Over the same period, Provincial net debt grew by close to one-third of a trillion dollars, and Ontario’s ratio of net debt-to-GDP ratio grew from 13.4 per cent to a forecast of 40.5 per cent in 2018–19.
As recommended by the Commission, the government will conduct analysis to determine and set an appropriate target and timeline to reduce the Province’s ratio of net debt-to-GDP to a sustainable level.
Long-Term Public Borrowing
The Province’s total long-term borrowing in 2018–19 is forecast to be $33.2 billion, $1.9 billion less than the forecast for 2018–19 which was based on the findings of the Commission.
| 2018 Budget | Outlook Based on Commission of Inquiry | Change from Commission of Inquiry Outlook | Current Outlook | |
|---|---|---|---|---|
| Deficit/(Surplus) | 6.7 | 15.0 | (0.5) | 14.5 |
| Investment in Capital Assets | 14.2 | 14.2 | (1.4) | 12.8 |
| Non-Cash Adjustments | (7.1) | (7.4) | – | (7.4) |
| Loans to Infrastructure Ontario | 0.4 | 0.4 | – | 0.4 |
| Other Net Loans/Investments | 1.5 | 0.5 | (0.6) | (0.0) |
| Debt Maturities | 21.5 | 21.5 | 0.3 | 21.8 |
| Debt Redemptions | 0.1 | 0.1 | 0.1 | 0.1 |
| Total Funding Requirement | 37.3 | 44.3 | (2.1) | 42.1 |
| Canada Pension Plan Borrowing | (0.0) | (0.0) | – | (0.0) |
| Decrease/(Increase) in Short-Term Borrowing | – | – | – | – |
| Increase/(Decrease) in Cash and Cash Equivalents | 6.0 | 3.3 | 0.2 | 3.5 |
| Pre-Borrowing from 2017–18 | (11.5) | (12.4) | – | (12.4) |
| Total Long-Term Public Borrowing | 31.7 | 35.1 | (1.9) | 33.2 |
Table 4.1 footnotes:
Note: Numbers may not add due to rounding.
The Province will target completion of its 2018–19 long-term public borrowing before the end of the current fiscal year, and subject to favourable market conditions, engage in pre-borrowing for 2019–20. As of October 31, 2018, $25.9 billion, or 78 per cent, of this year’s long-term public borrowing was completed.
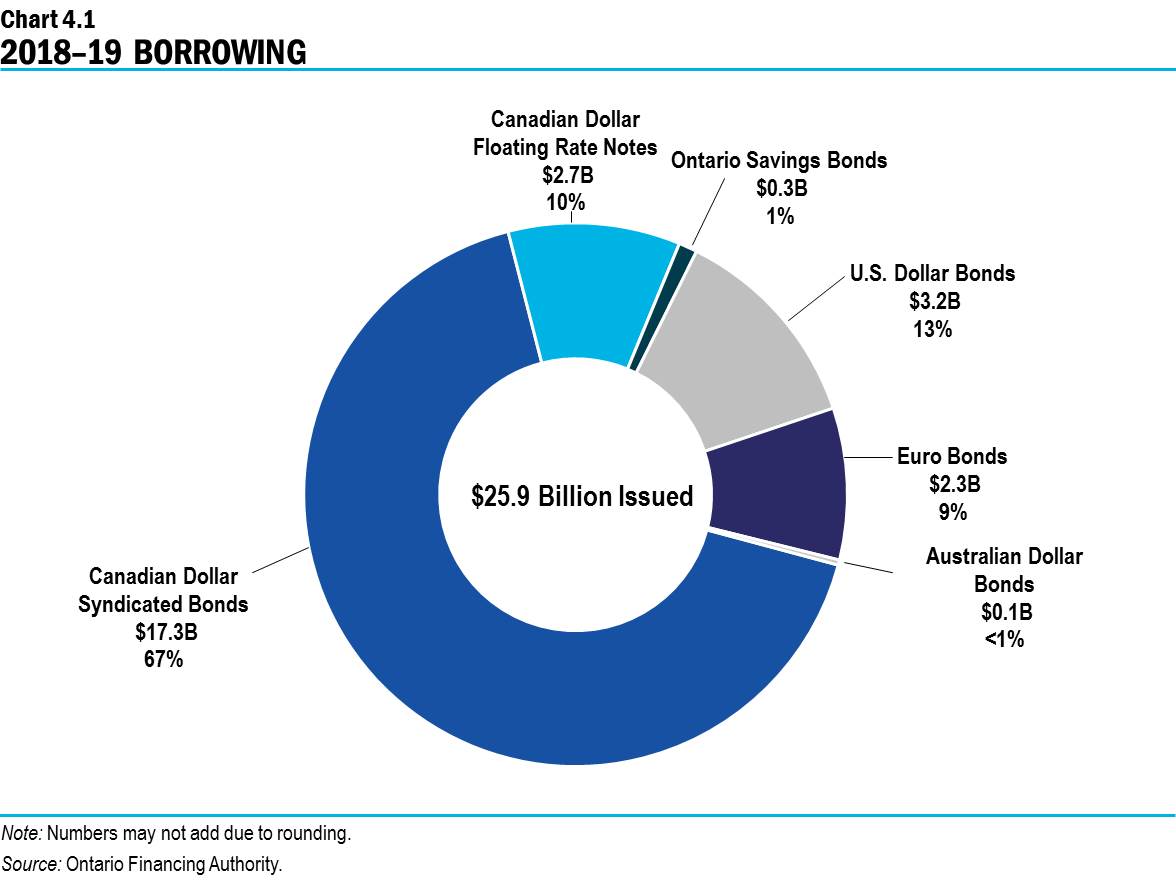
Approximately 78 per cent of this year’s borrowing to date has been completed in Canadian dollars, largely through syndicated issues. The remaining $5.7 billion, or 22 per cent, of borrowing has been completed in foreign currencies, primarily in the U.S. dollar and euro markets.
The Province is targeting Canadian dollar borrowing to be approximately 70 per cent of total borrowing for the fiscal year. The Province will actively assess this target and adjust it further, if needed, to reflect market conditions.
The Province regularly borrows in currencies other than Canadian dollars to diversify its investor base. This helps reduce Ontario’s overall borrowing costs and ensures the Province will continue to have access to capital if domestic market conditions become more challenging.
The Province plans to issue its next Green Bond by the end of the fiscal year, after realigning the program to support the new government’s approach to addressing environmental challenges. See Chapter 1, Section C: Respecting Consumers and Families for more details on Ontario’s new environmental initiatives.
Ontario’s Green Bonds capitalize on the Province’s ability to raise funds at low interest rates while respecting the taxpayers of Ontario. They serve as an important tool to help Ontario finance projects that support the government’s approach to addressing environmental challenges without adversely impacting businesses or the people of Ontario.
Net Debt
In 2018–19, the net debt-to-GDP ratio is projected to be 40.5 per cent, or 0.3 percentage points lower than the 40.8 per cent forecast by the Commission.1 However, it is 2.9 percentage points higher than was forecast in the 2018 Budget primarily due to an increase in the deficit resulting from the government accepting recommendations of the Commission on revising the accounting treatment for global adjustment refinancing and jointly sponsored pension plans (JSPPs). The revised accounting treatment for JSPPs includes the impact of adopting the accounting treatment on a retroactive basis from 2001–02 onwards which added a cumulative $14.6 billion to net debt.
The Province has reported deficits in 24 of the last 29 years. Over the same period, Provincial net debt grew by close to one-third of a trillion dollars, or $311.6 billion, and Ontario’s net debt-to-GDP ratio grew from 13.4 per cent to a forecast of 40.5 per cent in 2018–19.
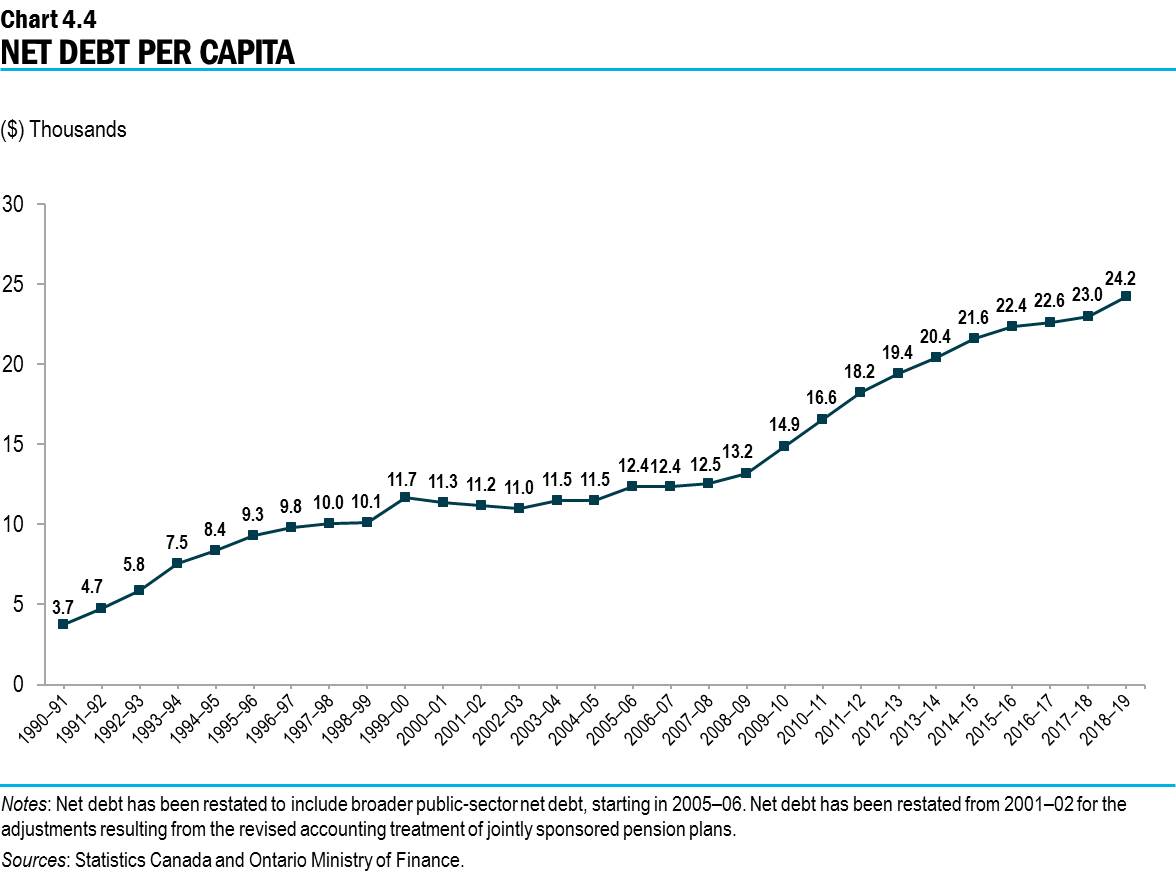
Net debt per capita has increased from $13,163 per person or $52,652 per family of four at the beginning of the 2008–09 global economic downturn to a projected $24,231 per person or $96,924 per family of four in 2018–19. This rate of increase per person was 4.5 per cent per year greater than Ontario’s inflation over that period.
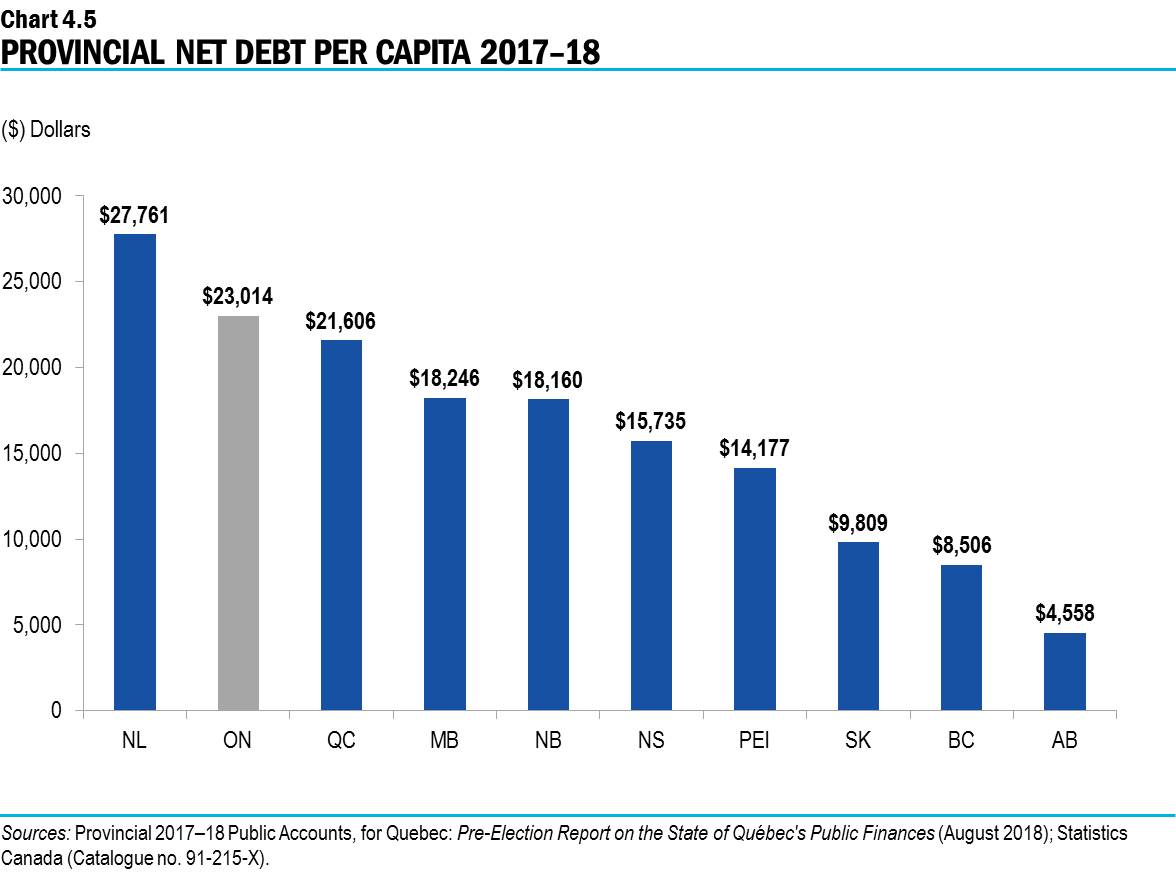
Compared to other provinces, Ontario had the second highest debt load per person in Canada, behind only Newfoundland and Labrador.
A high level of debt crowds out other government priorities and is unfair to future generations. It also limits the government’s flexibility to respond to economic downturns. That is why the government is taking action to manage Ontario’s debt load, having already reduced the deficit to $14.5 billion from the inherited $15.0 billion deficit reported by the Commission. In addition, as recommended in the Commission’s report, the government will conduct analysis to determine and set an appropriate target and timeline to reduce the Province’s ratio of net debt-to-GDP to a sustainable level. To that end, the government will be developing a debt reduction strategy in order to address these challenges. See Chapter 1, Section A: Restoring Trust, Transparency and Accountability for more details on the debt reduction strategy.
Reducing Ontario’s Electricity Sector Stranded Debt
Ontario Electricity Financial Corporation (OEFC) results for 2017–18 showed revenue over expense of $1.9 billion, reducing the OEFC’s unfunded liability (or “stranded debt”) from $3.2 billion as at March 31, 2017, to $1.3 billion as at March 31, 2018.
Cost of Debt
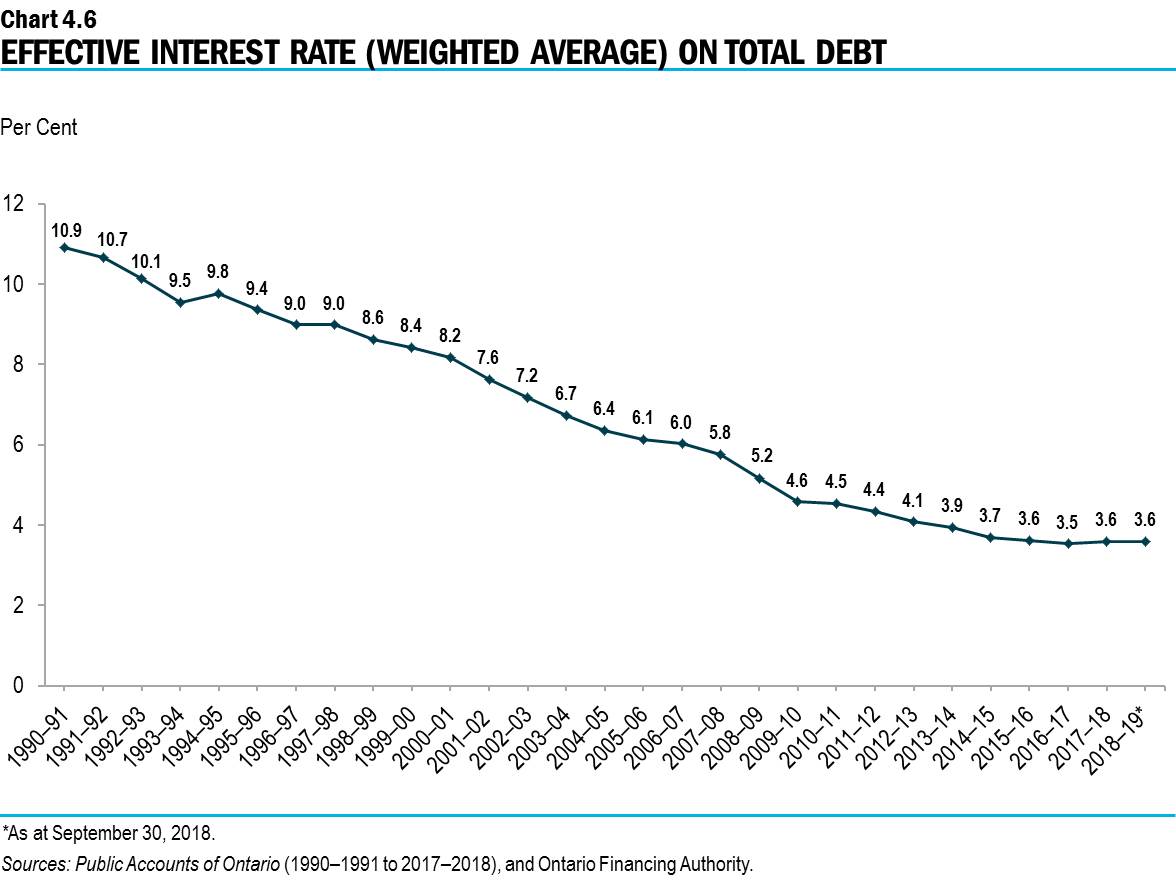
The global decline in interest rates over the last 25 years has begun to reverse. This decline has meant that in spite of the Province’s debt load increasing substantially, particularly over the past 10 years, IOD has not risen as quickly. However, with interest rates now rising, the Province faces higher IOD costs going forward. Chart 4.6 shows the effective interest rate that the Province is paying on its total debt portfolio of over one-third of a trillion dollars and that those rates, after having declined for a quarter of a century, have now begun to rise.
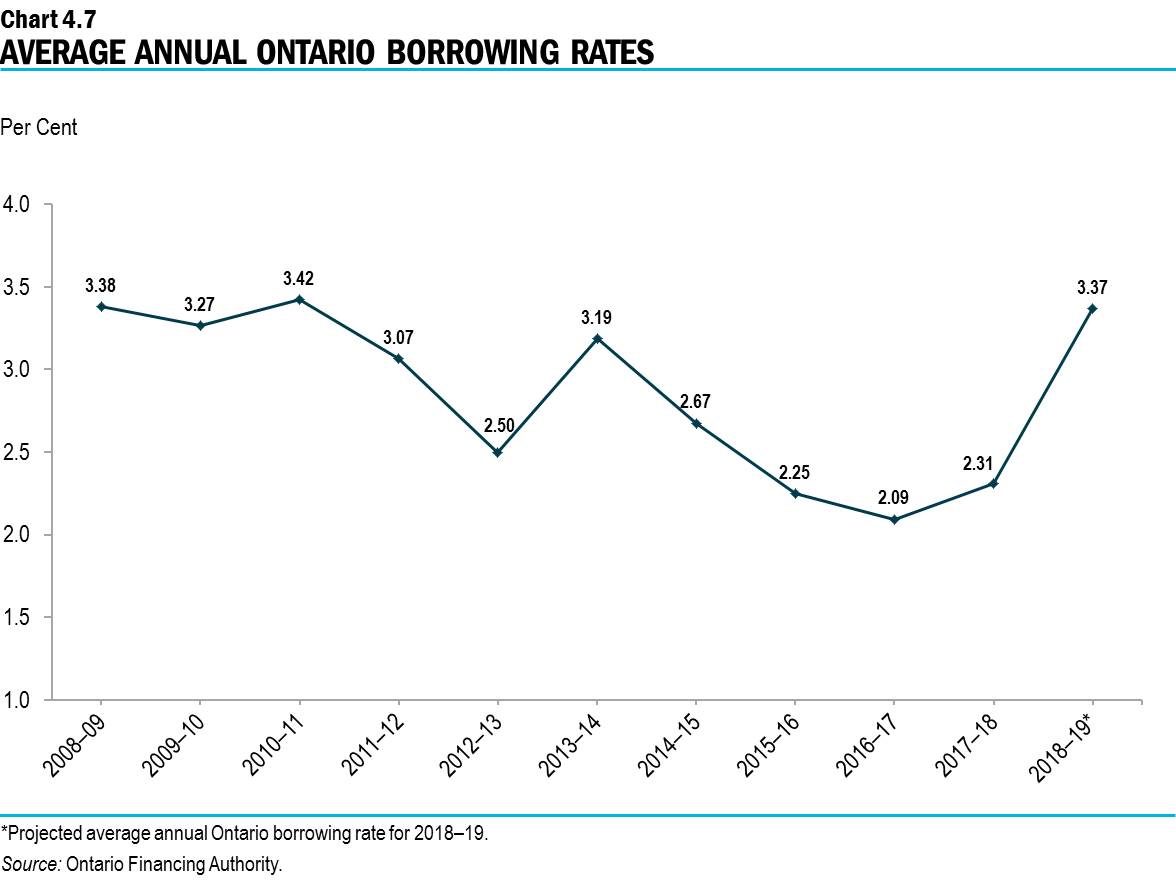
This rise in interest rates on the total debt portfolio is reflected by the fact that the interest rates which the Province must pay on new, or refinanced debt issued every year have also risen. As shown in Chart 4.7, rates have begun to rise, with the forecast for 2018–19 increasing by more than one and a quarter percentage points since the low point in 2016–17, reinforcing the need for a debt reduction strategy.
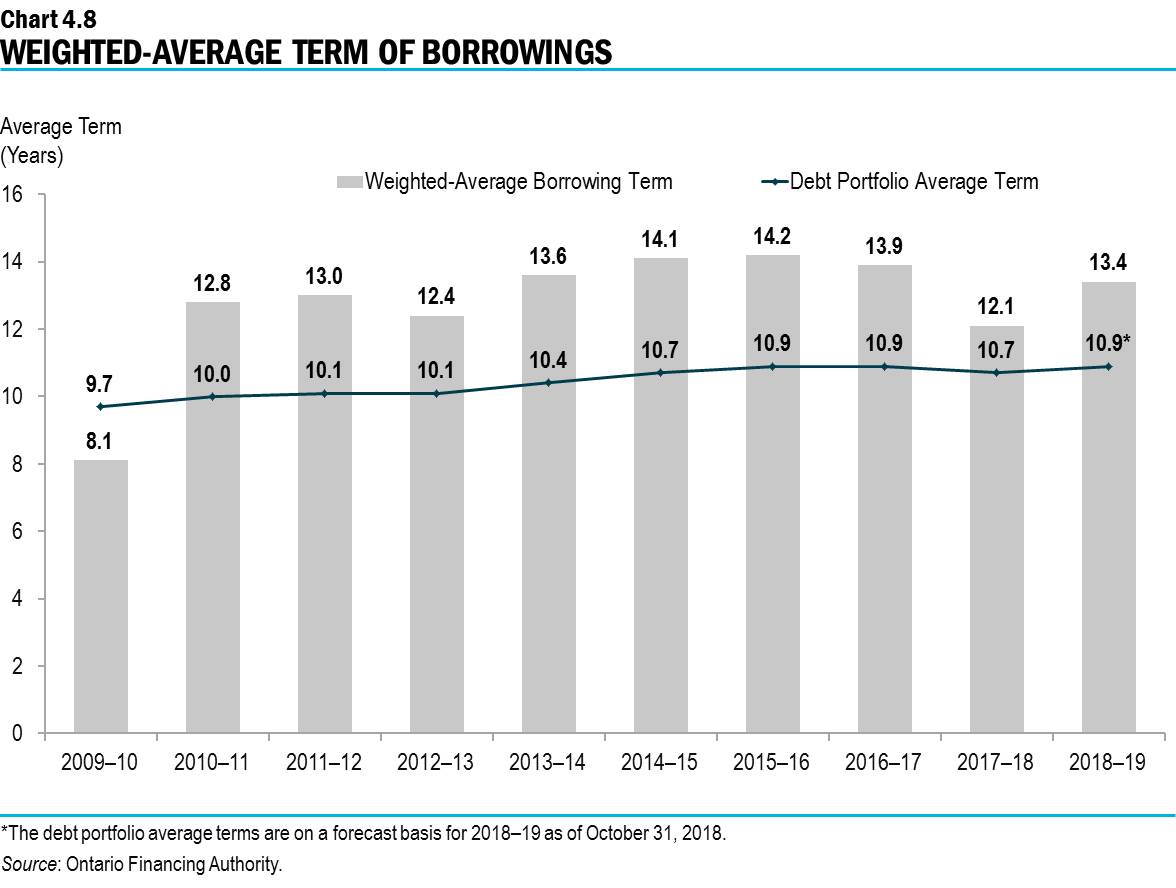
A further one percentage point increase in interest rates above forecast would add an additional $450 million in interest costs in the first full year. Unlike other Provincial expenses, interest costs cannot provide services that help the people of Ontario in their daily lives. To protect the Province from this increase in interest rates, the government has extended the term of its debt to lower the amount that must be refinanced every year. This strategy is similar to a homeowner extending the term of their mortgage to protect themselves against rising mortgage rates. Going back to the beginning of fiscal 2010–11, Ontario has issued $77.3 billion of bonds longer than 30 years to lock in low rates.
As a result, the weighted-average term to maturity of long-term Provincial debt issued has been extended significantly, from 9.7 years in 2009–10 to 10.9 years for 2018–19 as of October 31, 2018. The Province monitors interest rates daily. It continually assesses and determines, based on demand for its debt and how high interest rates rise across the yield curve, whether it remains cost-effective to continue to extend the term of its debt.
Footnotes
[1] To ensure consistency and comparability of numbers between the current outlook and the Commission’s baseline forecast, the Commission’s Net Debt as a Per Cent of GDP estimate has been revised from 40.5 per cent to 40.8 per cent after updating GDP with the most recent numbers from Statistics Canada’s Provincial and Territorial Economic Accounts, 2017.
Chart Descriptions
Chart 4.1: 2018–19 Borrowing
As of October 31, 2018, $25.9 billion of this year’s long-term public borrowing has been completed. This consisted of $17.3 billion (67 per cent) of Canadian dollar syndicated bonds, $2.7 billion (10 per cent) of Canadian Dollar Floating Rate Notes, $0.3 billion (1 per cent) of Ontario Savings Bonds, $3.2 billion (13 per cent) of U.S. dollar bonds, $2.3 billion (9 per cent) of euro bonds, $0.1 billion (<1 per cent) of Australian dollar bonds.
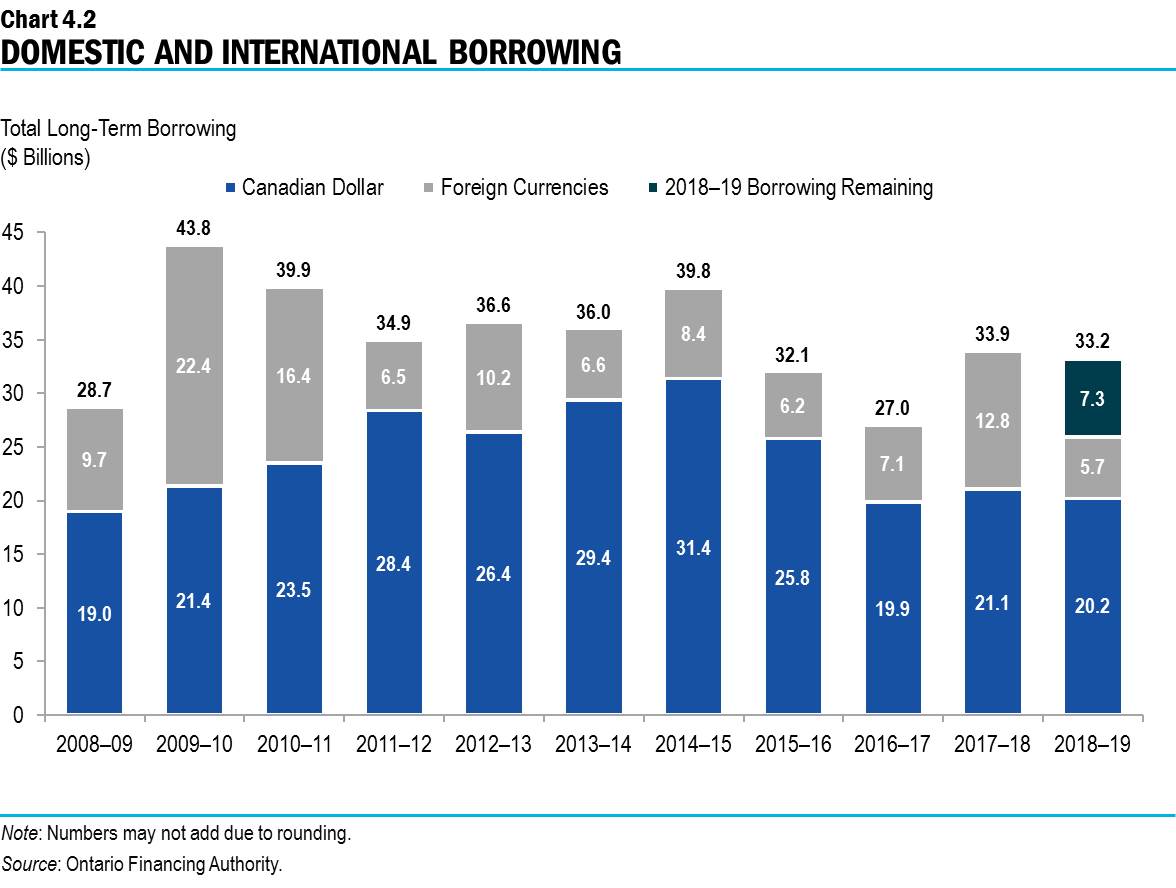
Chart 4.2: Domestic and International Borrowing
The Province’s total long-term borrowing in 2018–19 is forecast to be $33.2 billion — $20.2 billion was borrowed in the Canadian dollar market, $5.7 billion was borrowed in foreign currencies and $7.3 billion remaining.
| Year | Canadian Dollar ($ Billions) | Foreign Currencies ($ Billions) | Total ($ Billions) |
|---|---|---|---|
| 2008–09 | 19 | 9.7 | 28.7 |
| 2009–10 | 21.4 | 22.4 | 43.8 |
| 2010–11 | 23.5 | 16.4 | 39.9 |
| 2011–12 | 28.4 | 6.5 | 34.9 |
| 2012–13 | 26.4 | 10.2 | 36.6 |
| 2013–14 | 29.4 | 6.6 | 36.0 |
| 2014–15 | 31.4 | 8.4 | 39.8 |
| 2015–16 | 25.8 | 6.2 | 32.1 |
| 2016–17 | 19.9 | 7.1 | 27.0 |
| 2017–18 | 21.1 | 12.8 | 33.9 |
| 2018–19 | 20.2 | 5.7 | 33.2 |
Chart 4.3: Net Debt-to-GDP
Ontario’s net debt-to-GDP ratio is forecast at 40.5 per cent in 2018–19.
| Year | Net Debt-to-GDP (%) |
|---|---|
| 1990–91 | 13.4 |
| 1991–92 | 17.1 |
| 1992–93 | 21.1 |
| 1993–94 | 26.7 |
| 1994–95 | 28.4 |
| 1995–96 | 30.2 |
| 1996–97 | 31.3 |
| 1997–98 | 30.6 |
| 1998–99 | 29.5 |
| 1999–00 | 32.1 |
| 2000–01 | 29.3 |
| 2001–02 | 28.3 |
| 2002–03 | 26.8 |
| 2003–04 | 27.5 |
| 2004–05 | 26.8 |
| 2005–06 | 27.9 |
| 2006–07 | 27.1 |
| 2007–08 | 26.6 |
| 2008–09 | 27.9 |
| 2009–10 | 32.4 |
| 2010–11 | 34.5 |
| 2011–12 | 36.7 |
| 2012–13 | 38.2 |
| 2013–14 | 39.7 |
| 2014–15 | 40.6 |
| 2015–16 | 40.3 |
| 2016–17 | 39.6 |
| 2017–18 | 39.2 |
| 2018–19 | 40.5 |
Chart 4.4: Net Debt Per Capita
Ontario’s net debt per capita is forecast at $24.2 thousand per person in 2018–19.
| Year | Net Debt Per Capita ($ Thousands) |
|---|---|
| 1990–91 | 3.7 |
| 1991–92 | 4.7 |
| 1992–93 | 5.8 |
| 1993–94 | 7.5 |
| 1994–95 | 8.4 |
| 1995–96 | 9.3 |
| 1996–97 | 9.8 |
| 1997–98 | 10.0 |
| 1998–99 | 10.1 |
| 1999–00 | 11.7 |
| 2000–01 | 11.3 |
| 2001–02 | 11.2 |
| 2002–03 | 11.0 |
| 2003–04 | 11.5 |
| 2004–05 | 11.5 |
| 2005–06 | 12.4 |
| 2006–07 | 12.4 |
| 2007–08 | 12.5 |
| 2008–09 | 13.2 |
| 2009–10 | 14.9 |
| 2010–11 | 16.6 |
| 2011–12 | 18.2 |
| 2012–13 | 19.4 |
| 2013–14 | 20.4 |
| 2014–15 | 21.6 |
| 2015–16 | 22.4 |
| 2016–17 | 22.6 |
| 2017–18 | 23.0 |
| 2018–19 | 24.2 |
Chart 4.5: Provincial Net Debt Per Capita 2017–18
Ontario had the second highest debt load per person in Canada, behind only Newfoundland and Labrador.
| Province | Net Debt Per Capita ($) |
|---|---|
| Newfoundland and Labrador | 27,761 |
| Ontario | 23,014 |
| Quebec | 21,606 |
| Manitoba | 18,246 |
| New Brunswick | 18,160 |
| Nova Scotia | 15,735 |
| Prince Edward Island | 14,177 |
| Saskatchewan | 9,809 |
| British Columbia | 8,506 |
| Alberta | 4,558 |
Chart 4.6: Effective Interest Rate (Weighted-Average) on Total Debt
As of September 30, 2018, the effective interest rate (calculated as a weighted average) is forecast to be 3.6 per cent on the Province’s total debt, unchanged from 2017–18.
| Year | Effective Interest Rate (%) |
|---|---|
| 1990–91 | 10.9 |
| 1991–92 | 10.7 |
| 1992–93 | 10.1 |
| 1993–94 | 9.5 |
| 1994–95 | 9.8 |
| 1995–96 | 9.4 |
| 1996–97 | 9.0 |
| 1997–98 | 9.0 |
| 1998–99 | 8.6 |
| 1999–00 | 8.4 |
| 2000–01 | 8.2 |
| 2001–02 | 7.6 |
| 2002–03 | 7.2 |
| 2003–04 | 6.7 |
| 2004–05 | 6.4 |
| 2005–06 | 6.1 |
| 2006–07 | 6.0 |
| 2007–08 | 5.8 |
| 2008–09 | 5.2 |
| 2009–10 | 4.6 |
| 2010–11 | 4.5 |
| 2011–12 | 4.4 |
| 2012–13 | 4.1 |
| 2013–14 | 3.9 |
| 2014–15 | 3.7 |
| 2015–16 | 3.6 |
| 2016–17 | 3.5 |
| 2017–18 | 3.6 |
| 2018–19 | 3.6 |
Chart 4.7: Average Annual Ontario Borrowing Rates
Average annual Ontario borrowing rates have begun to rise with a forecast increase of more than one and a quarter percentage points since the lowest point in 2016–17.
| Year | Average Annual Borrowing Rate (%) |
|---|---|
| 2008–09 | 3.38 |
| 2009–10 | 3.27 |
| 2010–11 | 3.42 |
| 2011–12 | 3.07 |
| 2012–13 | 2.50 |
| 2013–14 | 3.19 |
| 2014–15 | 2.67 |
| 2015–16 | 2.25 |
| 2016–17 | 2.09 |
| 2017–18 | 2.31 |
| 2018–19 | 3.37 |
Chart 4.8: Weighted-Average Term of Borrowings
The average term of Ontario’s debt portfolio has been extended from 9.7 years in 2009–10 to 10.9 years as of October 31, 2018. The weighted-average borrowing term for 2018–19 was 13.4 years as of October 31, 2018.
| Year | 2009–10 | 2010–11 | 2011–12 | 2012–13 | 2013–14 | 2014–15 | 2015–16 | 2016–17 | 2017–18 | 2018–19 |
|---|---|---|---|---|---|---|---|---|---|---|
| Weighted-Average Borrowing Term (Years) | 8.1 | 12.8 | 13.0 | 12.4 | 13.6 | 14.1 | 14.2 | 13.9 | 12.1 | 13.4 |
| Debt Portfolio Average Term (Years) | 9.7 | 10.0 | 10.1 | 10.1 | 10.4 | 10.7 | 10.9 | 10.9 | 10.7 | 10.9 |