Introduction
The government is committed to restoring trust, transparency and accountability in Ontario’s finances. To this end, the government has accepted the recommendations of the Independent Financial Commission of Inquiry (Commission) and undertaken a number of targeted tax and efficiency measures to enhance economic growth and ensure value for every tax dollar spent. The Government for the People is demonstrating that these actions are achieving results with a lower projected deficit than the baseline provided by the Commission. Improving the Province’s fiscal health is paramount, which means returning the budget to balance on a modest, reasonable and pragmatic timetable.
Current Fiscal Outlook
On July 17, 2018, the government took action to restore the public’s confidence in Ontario’s books by establishing the Independent Financial Commission of Inquiry to look into the Province’s past spending and accounting practices.
The Commission’s report provided the government with a revised 2018–19 fiscal outlook compared to the 2018 Budget. The report states that, instead of the $6.7 billion deficit projected in the 2018 Budget, the Province’s revised baseline deficit is $15 billion.
Actions undertaken by the government to find efficiencies and reduce spending have resulted in $3.2 billion in program expense savings relative to the Commission’s outlook. Savings of $2.7 billion for taxpayers, largely due to eliminating planned tax increases and cancelling the cap-and-trade carbon tax, have been reflected in the revenue outlook. Taken together, these changes result in a projected deficit of $14.5 billion, a $0.5 billion improvement to the Commission’s baseline deficit forecast.
| Actual 2017–18 |
Commission Revised Baseline 2018–19 |
Change | Current Outlook 2018–19 |
|
|---|---|---|---|---|
| Revenue | 150.6 | 150.9 | (2.7) | 148.2 |
| Expense — Programs | 142.4 | 152.4 | (3.2) | 149.2 |
| Expense — Interest on Debt | 11.9 | 12.5 | – | 12.5 |
| Total Expense | 154.3 | 164.9 | (3.2) | 161.8 |
| Surplus/(Deficit) Before Reserve | (3.7) | (14.0) | 0.5 | (13.5) |
| Reserve | – | 1.0 | – | 1.0 |
| Surplus/(Deficit) | (3.7) | (15.0) | 0.5 | (14.5) |
| Net Debt as a Per Cent of GDP | 39.2 | 40.8 | 40.5 | |
| Accumulated Deficit as a Per Cent of GDP | 25.3 | N.A. | 26.1 |
Table 3.1 footnotes:
Notes: Numbers may not add due to rounding. To ensure consistency and comparability of numbers between the current outlook, the Commission’s baseline forecast and prior year results, the Commission’s Net Debt as a Per Cent of GDP estimate has been revised from 40.5 per cent after updating GDP with the most recent numbers from Statistics Canada’s Provincial and Territorial Economic Accounts, 2017.
2018–19 In-Year Revenue Changes
In addition to the $1.5 billion in revenue changes recommended by the Commission, the revenue outlook also reflects decisions and actions undertaken by this government. As a result, revenue is now projected to be $2.7 billion lower in 2018–19 than the Commission’s forecast.
| 2018–19 | |
|---|---|
| Not Proceeding with 2018 Budget and Prior Planned Tax Increases | (308) |
| Cancelling Cap-and-Trade Carbon Tax | (1,507) |
| Low-Income Individuals and Families Tax (LIFT) Credit | (125) |
| Ontario Power Generation Inc./Hydro One Ltd. | (59) |
| Cannabis Implementation | (3) |
| Other Changes | (689) |
| Total In-Year Revenue Changes | (2,691) |
Table 3.3 footnotes:
[1] Changes shown are in addition to those recommended by the Commission.
Note: Numbers may not add due to rounding.
A number of tax changes planned by the previous government are being cancelled, benefiting taxpayers and reducing the 2018–19 revenue forecast by $308 million, including not proceeding with:
- Adjustments to rates, brackets, surtax and credits for Ontario Personal Income Tax;
- Phasing out the Small Business Limit;
- Ontario Research and Development Tax Credit enhancements;
- Targeting the Employer Health Tax exemption; and
- Increasing the beer basic tax rate on November 1, 2018.
The government’s decision to cancel the cap-and-trade carbon tax results in a reduction in revenues of $1,507 million in 2018–19.
The Low-income Individuals and Families Tax (LIFT) Credit announced in this document reduces the 2018–19 revenue forecast by $125 million related to the impact on revenues during the January 1, 2019 to March 31, 2019 period. See the Annex: Details of Tax Measures for more information.
The Province’s projected combined revenue from Ontario Power Generation Inc. and Hydro One Limited has been reduced based on their current updated outlook.
Revised federal timelines and changes in implementing legalized cannabis sales have resulted in a net reduction of $3 million in revenues related to cannabis. This is due to lower projected revenues from the Provincial share of the federal excise duty by $18 million. This is partially offset by avoiding $15 million in net costs primarily related to construction of retail storefronts by the Ontario Cannabis Store.
Other changes include an updated estimate of the impact of past budget tax measures, freezing driver’s licence fees and a provision built into the fiscal plan for tax measures to strengthen Ontario’s economy. This could include options for paralleling a potential federal government response to Ontario’s written request to accelerate capital cost depreciation of new depreciable assets to address the competitiveness challenges posed by U.S. tax reform.
2018–19 In-Year Expense Changes
In addition to the $6.4 billion in expense changes recommended by the Commission, the program spending outlook also reflects savings of $3.2 billion, reflecting decisions and actions undertaken by the government to put in place immediate spending controls and return the Province to a more fiscally sustainable path. As a result, spending is now projected to be $3.2 billion, or about two per cent lower, in 2018–19 than the Commission’s baseline forecast.
| 2018–19 | |
|---|---|
Savings from Expenditure Management Restrictions and Updated Forecasts The government is actively reviewing all spending to ensure government expenditures are delivering the best value for the people of Ontario. Savings have been found in the following areas:
|
(1,146.7) |
Savings from Ongoing Review of Programs The government has undertaken a comprehensive review of investments from the 2018 Budget and has taken steps to reduce expenditures. Savings include: not proceeding with previously planned spending related to cap-and-trade carbon tax proceeds and budget measures such as reform of OHIP+, regional infrastructure projects and other expenditure programs that did not provide value for money. |
(1,835.6) |
In-Year Approvals The government has made targeted investments for communities and families in the following areas:
|
302.6 |
Other Changes, Including Changes to the Contingency Fund and Offsets for In-Year Approvals |
(484.8) |
Interest on Debt Change |
– |
Net In-Year Expense Changes |
(3,164.6) |
Table 3.4 footnotes:
[1] Changes shown are in addition to those recommended by the Commission.
Note: Numbers may not add due to rounding.
Fiscal Prudence
The Fiscal Transparency and Accountability Act, 2004 requires Ontario’s fiscal plan to incorporate prudence in the form of a reserve to protect the current outlook against unforeseen adverse changes in the Province’s revenue and expense. As recommended by the Independent Financial Commission of Inquiry, the reserve is set at $1.0 billion, consistent with its historical level.
The current outlook also maintains contingency funds to safeguard essential services. The Commission has stated in its report, that the contingency fund which was set significantly higher in 2018–19 than in the preceding eight years, is likely sufficient to cover expense risks for the remainder of the 2018–19 fiscal year.
Details of Ontario’s Finances
| 2015–16 | 2016–17 | Actual 2017–18 |
Current Outlook 2018–19 |
|
|---|---|---|---|---|
| Taxation Revenue — Personal Income Tax | 31,141 | 30,671 | 32,900 | 34,946 |
| Taxation Revenue — Sales Tax1 | 23,455 | 24,750 | 25,925 | 26,727 |
| Taxation Revenue — Corporations Tax | 11,428 | 14,872 | 15,612 | 13,766 |
| Taxation Revenue — Education Property Tax2 | 5,839 | 5,868 | 5,883 | 6,076 |
| Taxation Revenue — Employer Health Tax | 5,649 | 5,908 | 6,205 | 6,494 |
| Taxation Revenue — Ontario Health Premium | 3,453 | 3,575 | 3,672 | 3,870 |
| Taxation Revenue — Gasoline Tax | 2,459 | 2,626 | 2,701 | 2,699 |
| Taxation Revenue — Land Transfer Tax | 2,118 | 2,728 | 3,174 | 2,710 |
| Taxation Revenue — Tobacco Tax | 1,226 | 1,230 | 1,244 | 1,250 |
| Taxation Revenue — Fuel Tax | 751 | 742 | 760 | 784 |
| Taxation Revenue — Beer, Wine and Spirits Taxes | 582 | 589 | 601 | 630 |
| Taxation Revenue — Ontario Portion of the Federal Cannabis Excise Duty | – | – | – | 17 |
| Taxation Revenue — Electricity Payments in Lieu of Taxes | 3,247 | 334 | 494 | 369 |
| Taxation Revenue — Other Taxes | 470 | 453 | 552 | 563 |
| Taxation Revenue — Total | 91,818 | 94,346 | 99,723 | 100,901 |
| Government of Canada — Canada Health Transfer | 13,089 | 13,910 | 14,359 | 14,934 |
| Government of Canada — Canada Social Transfer | 4,984 | 5,146 | 5,314 | 5,486 |
| Government of Canada — Equalization | 2,363 | 2,304 | 1,424 | 963 |
| Government of Canada — Infrastructure Programs | 146 | 732 | 1,065 | 1,703 |
| Government of Canada — Labour Market Programs | 927 | 965 | 969 | 998 |
| Government of Canada — Social Housing Agreement | 455 | 441 | 419 | 386 |
| Government of Canada — Other Federal Payments | 893 | 761 | 996 | 1,235 |
| Government of Canada — Direct Transfers to Broader Public-Sector Organizations | 284 | 285 | 314 | 301 |
| Government of Canada — Total | 23,141 | 24,544 | 24,860 | 26,006 |
| Income from Government Business Enterprises — Ontario Lottery and Gaming Corporation | 2,234 | 2,358 | 2,487 | 2,245 |
| Income from Government Business Enterprises — Liquor Control Board of Ontario | 1,956 | 2,349 | 2,207 | 2,234 |
| Income from Government Business Enterprises — Ontario Cannabis Store | – | – | (6) | (25) |
| Income from Government Business Enterprises — Ontario Power Generation Inc./Hydro One Ltd.3 | 719 | 860 | 1,464 | 794 |
| Income from Government Business Enterprises — Total | 4,909 | 5,567 | 6,152 | 5,248 |
| Other Non-Tax Revenue — Reimbursements | 991 | 988 | 1,000 | 995 |
| Other Non-Tax Revenue — Vehicle and Driver Registration Fees | 1,565 | 1,727 | 1,912 | 2,001 |
| Other Non-Tax Revenue — Electricity Debt Retirement Charge | 859 | 621 | 593 | – |
| Other Non-Tax Revenue — Power Supply Contract Recoveries | 875 | 838 | 185 | 183 |
| Other Non-Tax Revenue — Sales and Rentals | 2,102 | 1,999 | 2,426 | 1,409 |
| Other Non-Tax Revenue — Carbon Allowance Proceeds | – | – | 2,401 | 472 |
| Other Non-Tax Revenue — Other Fees and Licences | 964 | 974 | 1,029 | 1,006 |
| Other Non-Tax Revenue — Net Reduction of Power Purchase Contracts | 172 | 129 | 74 | 41 |
| Other Non-Tax Revenue — Royalties | 274 | 272 | 290 | 295 |
| Other Non-Tax Revenue — Fees, Donations and Other Revenues from Hospitals, School Boards and Colleges | 7,493 | 7,957 | 8,309 | 8,552 |
| Other Non-Tax Revenue — Miscellaneous Other Non-Tax Revenue | 985 | 772 | 1,640 | 1,122 |
| Other Non-Tax Revenue — Total | 16,280 | 16,277 | 19,859 | 16,076 |
| Total Revenue | 136,148 | 140,734 | 150,594 | 148,231 |
Table 3.5 footnotes:
[1] Sales Tax revenue is net of the Ontario Sales Tax Credit and the energy component of the Ontario Energy and Property Tax Credit.
[2] Education Property Tax revenue is net of the property tax credit component of the Ontario Energy and Property Tax Credit and the Ontario Senior Homeowners’ Property Tax Grant.
[3] Includes income from Brampton Distribution Holdco Inc. for 2015–16 to 2016–17 from its interest in Hydro One Brampton Networks Inc. On February 28, 2017, the Province sold its entire interest in Hydro One Brampton Networks Inc. and it is no longer included as a Government Business Enterprise.
Note: Numbers may not add due to rounding.
| Ministry Expense | 2015–16 | 2016–17 | Actual 2017–18 |
Current Outlook 2018–19 |
|---|---|---|---|---|
| Agriculture, Food and Rural Affairs (Total) | 929 | 1,031 | 1,006 | 1,177.2 |
| Attorney General (Total) | 1,859 | 1,937 | 2,041 | 1,970.7 |
| Board of Internal Economy (Total) | 205 | 219 | 303 | 352.3 |
| Children, Community and Social Services (Total) | 15,313 | 15,789 | 16,416 | 17,008.3 |
| Community Safety and Correctional Services (Total) | 2,687 | 2,683 | 2,792 | 2,906.8 |
| Economic Development, Job Creation and Trade (Total) | 966 | 1,118 | 1,098 | 1,025.9 |
| Education (Base) | 25,967 | 26,580 | 27,300 | 29,012.0 |
| Education — Teachers’ Pension Plan2 | 1,590 | 987 | 1,659 | 1,725.0 |
| Education (Total) | 27,557 | 27,567 | 28,958 | 30,737.0 |
| Energy, Northern Development and Mines (Total) | 1,933 | 1,734 | 4,225 | 4,829.7 |
| Environment, Conservation and Parks (Total) | 601 | 639 | 894 | 975.0 |
| Executive Offices (Total) | 37 | 46 | 48 | 46.7 |
| Finance (Base) | 1,048 | 862 | 875 | 945.7 |
| Finance — Ontario Municipal Partnership Fund | 513 | 505 | 506 | 510.0 |
| Finance — Power Supply Contract Costs | 875 | 838 | 185 | 182.8 |
| Finance (Total) | 2,436 | 2,205 | 1,567 | 1,638.5 |
| Government and Consumer Services (Total) | 767 | 715 | 793 | 652.9 |
| Health and Long-Term Care (Total) | 55,267 | 56,293 | 59,260 | 61,678.2 |
| Indigenous Affairs (Total) | 79 | 128 | 1,210 | 95.3 |
| Infrastructure (Base) | 93 | 90 | 71 | 112.9 |
| Infrastructure — Federal–Provincial Infrastructure Programs | – | 8 | 248 | 603.3 |
| Infrastructure (Total) | 93 | 97 | 320 | 716.2 |
| Labour (Total) | 304 | 308 | 317 | 319.3 |
| Municipal Affairs and Housing (Total) | 1,088 | 1,544 | 1,375 | 1,211.6 |
| Natural Resources and Forestry (Base) | 624 | 635 | 678 | 655.1 |
| Natural Resources and Forestry — Emergency Forest Firefighting | 95 | 107 | 117 | 169.8 |
| Natural Resources and Forestry (Total) | 719 | 742 | 795 | 824.9 |
| Office of Francophone Affairs (Total) | 8 | 5 | 6 | 6.1 |
| Seniors and Accessibility (Total) | 37 | 37 | 48 | 65.0 |
| Tourism, Culture and Sport (Total) | 2,289 | 1,561 | 1,590 | 1,450.2 |
| Training, Colleges and Universities (Total) | 9,927 | 10,154 | 11,150 | 11,374.2 |
| Transportation (Base) | 3,284 | 3,636 | 4,113 | 4,373.2 |
| Transportation — Federal-Provincial Infrastructure Programs | – | – | 404 | 887.5 |
| Transportation (Total) | 3,284 | 3,636 | 4,517 | 5,260.8 |
| Treasury Board Secretariat (Base) | 180 | 190 | 190 | 292.9 |
| Treasury Board Secretariat — Employee and Pensioner Benefits3 | 1,338 | 1,082 | 1,442 | 1,335.0 |
| Treasury Board Secretariat — Operating Contingency Fund | – | – | – | 1,006.6 |
| Treasury Board Secretariat — Capital Contingency Fund | – | – | – | 275.0 |
| Treasury Board Secretariat (Total) | 1,518 | 1,272 | 1,632 | 2,909.5 |
| Interest on Debt4 | 11,589 | 11,709 | 11,903 | 12,542.8 |
| Year-End Savings | – | – | – | – |
| Total Expense | 141,494 | 143,169 | 154,266 | 161,775.0 |
Table 3.6 footnotes:
[1] Numbers reflect current ministry structures that were announced on June 29, 2018.
[2], [3] Numbers reflect the pension expense that was calculated based on recommendations of the Independent Financial Commission of Inquiry, as described in Note 19 to the Consolidated Financial Statements in Public Accounts of Ontario 2017–2018.
[4] Interest on debt is net of interest capitalized during construction of tangible capital assets of $165 million in 2015–16, $159 million in 2016–17, $157 million in 2017–18, and $456 million in 2018–19.
Note: Numbers may not add due to rounding.
| Sector | Total Infrastructure Expenditures 2017–18 Actual1 |
2018–19 Current Outlook Investment in Capital Assets2 |
2018–19 Current Outlook Transfers and Other Infrastructure Expenditures3 |
2018–19 Current Outlook Total Infrastructure Expenditures4 |
|---|---|---|---|---|
| Transportation — Transit | 4,657 | 4,725 | 1,364 | 6,088 |
| Transportation — Provincial Highways | 2,534 | 2,697 | 275 | 2,972 |
| Transportation — Other Transportation, Property and Planning | 237 | 217 | 75 | 292 |
| Health — Hospitals | 2,403 | 2,559 | 66 | 2,625 |
| Health — Other Health | 239 | 84 | 190 | 273 |
| Education | 2,188 | 2,476 | 511 | 2,987 |
| Postsecondary — Colleges and Other | 639 | 757 | 9 | 765 |
| Postsecondary — Universities | 572 | – | 250 | 250 |
| Social | 595 | 14 | 361 | 374 |
| Justice | 284 | 292 | 261 | 553 |
| Other Sectors5 | 1,009 | 816 | 1,063 | 1,879 |
| Total Infrastructure Expenditures | 15,358 | 14,637 | 4,422 | 19,059 |
Table 3.7 footnotes:
[1] Includes Provincial investment in capital assets of $12.2 billion.
[2] Includes $456 million in interest capitalized during construction.
[3] Includes transfers to municipalities, universities and non-consolidated agencies.
[4] Includes third-party investments in hospitals, colleges and schools; and provisional federal contributions to Provincial infrastructure investments.
[5] Includes government administration, natural resources, and culture and tourism sectors.
Note: Numbers may not add due to rounding.
| 2009–10 | 2010–11 | 2011–12 | 2012–13 | 2013–14 | 2014–15 | 2015–16 | 2016–17 | Actual 2017–18 |
Current Outlook 2018–19 |
|
|---|---|---|---|---|---|---|---|---|---|---|
| Revenue | 102,553 | 113,594 | 116,401 | 120,319 | 122,955 | 126,152 | 136,148 | 140,734 | 150,594 | 148,231 |
| Expense — Programs | 112,696 | 120,843 | 121,222 | 120,103 | 123,330 | 126,199 | 129,905 | 131,460 | 142,363 | 149,232 |
| Expense — Interest on Debt3 | 9,119 | 10,005 | 10,587 | 10,878 | 11,155 | 11,221 | 11,589 | 11,709 | 11,903 | 12,543 |
| Total Expense | 121,815 | 130,848 | 131,809 | 130,981 | 134,485 | 137,420 | 141,494 | 143,169 | 154,266 | 161,775 |
| Reserve | – | – | – | – | – | – | – | – | – | 1,000 |
| Surplus/(Deficit) | (19,262) | (17,254) | (15,408) | (10,662) | (11,530) | (11,268) | (5,346) | (2,435) | (3,672) | (14,544) |
| Net Debt | 193,589 | 217,754 | 241,912 | 259,947 | 276,169 | 294,557 | 306,357 | 314,077 | 323,834 | 347,055 |
| Accumulated Deficit | 130,957 | 147,816 | 164,092 | 174,256 | 184,835 | 196,665 | 203,014 | 205,939 | 209,023 | 223,567 |
| Gross Domestic Product (GDP) at Market Prices | 597,876 | 630,983 | 659,740 | 680,086 | 695,352 | 726,053 | 759,440 | 792,932 | 825,805 | 857,557 |
| Primary Household Income | 412,847 | 424,251 | 444,076 | 459,111 | 472,921 | 489,436 | 511,577 | 519,413 | 544,062 | 567,914 |
| Population — July (000s)4 | 12,998 | 13,136 | 13,261 | 13,391 | 13,511 | 13,618 | 13,707 | 13,875 | 14,071 | 14,323 |
| Net Debt per Capita (Dollars) | 14,893 | 16,577 | 18,242 | 19,413 | 20,441 | 21,631 | 22,350 | 22,636 | 23,014 | 24,231 |
| Household Income per Capita (Dollars) | 31,762 | 32,297 | 33,486 | 34,286 | 35,003 | 35,942 | 37,322 | 37,434 | 38,664 | 39,651 |
| Interest on Debt as a Per Cent of Revenue | 8.9% | 8.8% | 9.1% | 9.0% | 9.1% | 8.9% | 8.5% | 8.3% | 7.9% | 8.5% |
| Net Debt as a Per Cent of GDP | 32.4% | 34.5% | 36.7% | 38.2% | 39.7% | 40.6% | 40.3% | 39.6% | 39.2% | 40.5% |
| Accumulated Deficit as a Per Cent of GDP | 21.9% | 23.4% | 24.9% | 25.6% | 26.6% | 27.1% | 26.7% | 26.0% | 25.3% | 26.1% |
Table 3.8 footnotes:
[1] Amounts reflect a change in pension expense that was calculated based on recommendations of the Independent Financial Commission of Inquiry, as described in Note 19 to the Consolidated Financial Statement, in Public Accounts of Ontario 2017–2018. Amounts for net debt and accumulated deficit also reflect this change.
[2] Revenues and expenses have been restated to reflect the following fiscally neutral changes: i) revised presentation of education property taxes to be included in the taxation revenues; ii) reclassification of certain Government Business Enterprises to other government organizations; iii) reclassification of a number of tax measures that provide a financial benefit through the tax system to be reported as expenses; and iv) change in presentation of third-party revenue for hospitals, school boards and colleges to be reported as revenue.
[3] Interest on debt is net of interest capitalized during construction of tangible capital assets of $165 million in 2015–16, $159 million in 2016–17, $157 million in 2017–18, and $456 million in 2018–19.
[4] Population figures are for July 1 of the fiscal year indicated (i.e., for 2009–10, the population on July 1, 2009 is shown).
Note: Numbers may not add due to rounding.
Sources: Statistics Canada, Ontario Ministry of Finance and Treasury Board Secretariat.
Footnotes
[1] Office of the Auditor General of Ontario, “Review of the 2018 Pre-Election Report on Ontario’s Finances,” (2018), http://www.auditor.on.ca/en/content/specialreports/specialreports/2018Pre-Election_en.pdf
Chart Descriptions
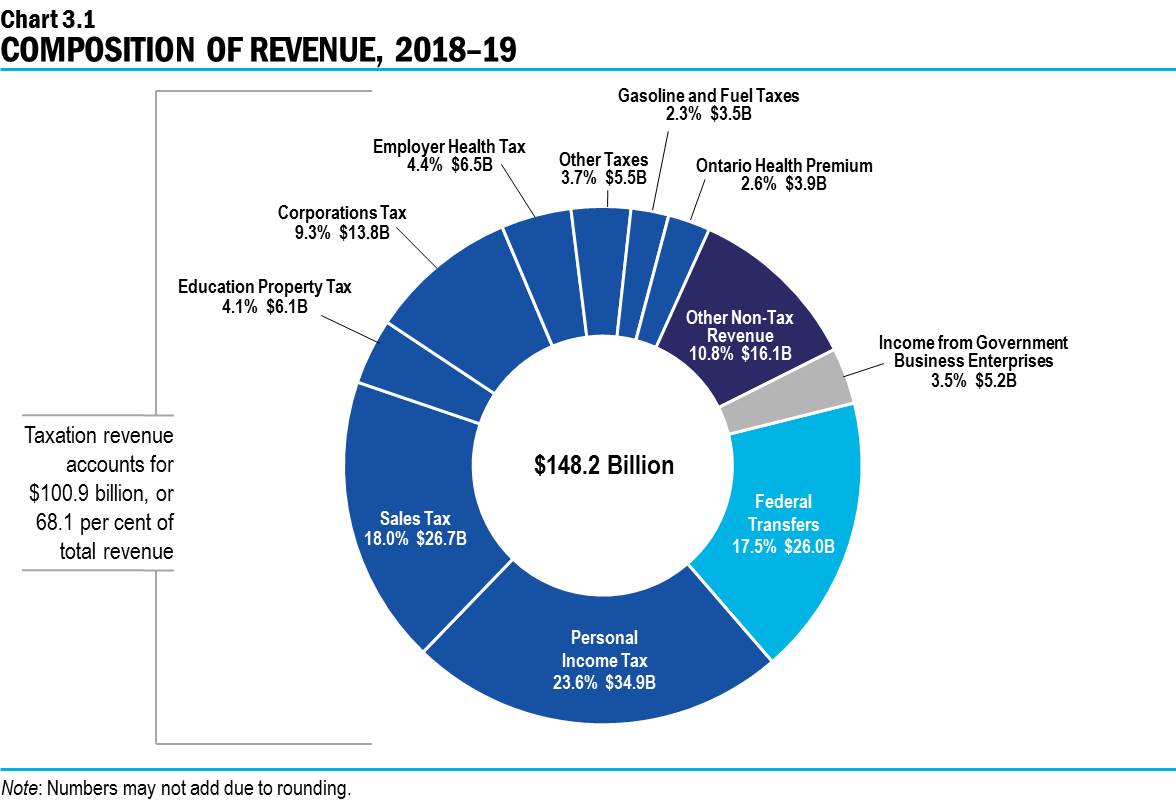
Chart 3.1: Composition of Revenue, 2018–19
This pie chart shows the composition of Ontario’s revenue in 2018–19, which totals $148.2 billion. The largest taxation revenue source is Personal Income Tax revenue at $34.9 billion, accounting for 23.6 per cent of total revenue. This is followed by Sales Tax at $26.7 billion, or 18.0 per cent of total revenue; and Corporations Tax at $13.8 billion, or 9.3 per cent of total revenue. Other components of taxation revenue include Education Property Tax at $6.1 billion, or 4.1 per cent of total revenue; Employer Health Tax at $6.5 billion, or 4.4 per cent; Gasoline and Fuel Taxes at $3.5 billion, or 2.3 per cent; the Ontario Health Premium at $3.9 billion, or 2.6 per cent; and Other Taxes at $5.5 billion, or 3.7 per cent of total revenue.
Total taxation revenue accounts for $100.9 billion, or 68.1 per cent of total revenue.
The other major non-taxation sources of revenue are Federal Transfers of $26.0 billion, or 17.5 per cent of total revenue; Income from Government Business Enterprises at $5.2 billion, or 3.5 per cent of total revenue; and various Other Non-Tax Revenue at $16.1 billion, or 10.8 per cent of total revenue.
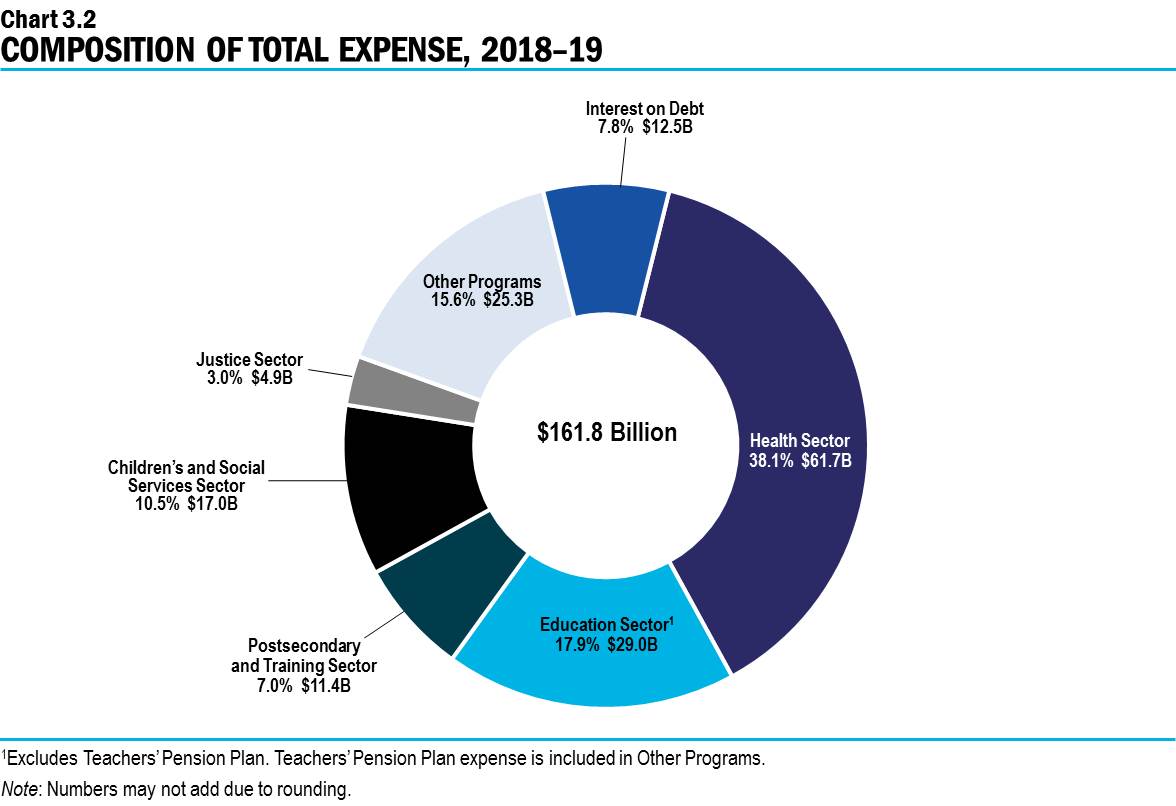
Chart 3.2: Composition of Total Expense, 2018–19
This pie chart shows the share of Ontario’s total expense and dollar amounts by sector in 2018–19.
Total expense in 2018–19 is $161.8 billion.
The largest expense is the Health Sector at $61.7 billion, accounting for 38.1 per cent of total expense.
The remaining sectors of total expense include the Education Sector at $29.0 billion or 17.9 per cent; the Postsecondary and Training Sector at $11.4 billion or 7.0 per cent; the Children’s and Social Services Sector at $17.0 billion or 10.5 per cent; the Justice Sector at $4.9 billion or 3.0 per cent; and Other Programs at $25.3 billion or 15.6 per cent. Interest on Debt, included as part of Total Expense, is $12.5 billion or 7.8 per cent.
Note that the Education Sector excludes the Teachers’ Pension Plan. Teachers’ Pension Plan expense is included in Other Programs.