Introduction
The Province’s interim borrowing requirement in 2019–20 has decreased by $4.1 billion compared to the forecast from the 2019 Budget due to lower deficits. The Province conducts its borrowing program responsibly and prudently to manage interest on debt (IOD) costs. To date, $21.3 billion, or 67 per cent, of this year’s $31.9 billion long-term borrowing requirement has been completed.
The Province’s net debt-to-GDP ratio was 39.6 per cent at the end of fiscal year 2018–19 and is forecast to rise to 40.0 per cent in 2019–20 as debt continues to rise more quickly than the growth in Ontario’s GDP. However, the net-debt-to-GDP ratio is now projected to be 0.7 percentage points lower than the 40.7 per cent forecast in the 2019 Budget. This spring, the government set out its objective for Ontario’s net debt-to-GDP ratio to reach more sustainable levels, underpinned by the debt burden reduction strategy. The government remains committed to keeping the net debt-to-GDP ratio, through to 2022–23, to less than the Independent Financial Commission of Inquiry’s (Commission) forecast for 2018–19 of 40.8 per cent.
The Province’s net debt is estimated to reach $353.7 billion by the end of 2019–20. With the largest subnational debt in the world, Ontario is forecast to pay $12.9 billion, or more than $1 billion per month in interest costs in 2019–20. Interest on debt is the fourth largest expense in the Budget after health care, education and social services. Spending on interest to service the debt means this money is not available to provide essential programs to help the people of Ontario in their daily lives or to reduce their taxes. A high level of debt is unfair to future generations and limits the Province’s flexibility in responding to economic downturns. This is why the government’s debt burden reduction strategy remains necessary.
The government is committed to implementing the actions outlined in the 2019 Budget to address the debt burden and put the Province’s finances on a more sustainable path.
Long-Term Public Borrowing
The Province’s total long-term borrowing in 2019–20 is forecast to be $31.9 billion, $4.1 billion less than the forecast from the 2019 Budget primarily due to the lower deficits in 2018–19 and 2019–20. The borrowing program is forecast to be $31.7 billion in 2020–21 and $31.2 billion in 2021–22. Total projected long-term borrowing requirements over the three years of the current outlook have decreased by a total of $5.5 billion compared to the 2019 Budget forecast due to lower deficits.
| 2019 Budget | In-Year Change | Current Outlook 2019–20 |
Current Outlook 2020–21 |
Current Outlook 2021–22 |
|
|---|---|---|---|---|---|
| Deficit/(Surplus) | 10.3 | (1.3) | 9.0 | 6.7 | 5.4 |
| Investment in Capital Assets | 11.6 | – | 11.6 | 11.0 | 10.4 |
| Non-Cash Adjustments | (7.7) | – | (7.7) | (7.7) | (7.7) |
| Loans to Infrastructure Ontario | 0.2 | – | 0.2 | 0.1 | 0.2 |
| Other Net Loans/Investments | 0.7 | 0.0 | 0.7 | 0.5 | (0.1) |
| Debt Maturities/Redemptions | 27.5 | (0.1) | 27.4 | 26.6 | 24.0 |
| Total Funding Requirement | 42.5 | (1.3) | 41.2 | 37.2 | 32.2 |
| Decrease/(Increase) in Short-Term Borrowing | (1.2) | – | (1.2) | (1.0) | (1.0) |
| Increase/(Decrease) in Cash and Cash Equivalents | (5.3) | (2.8) | (8.1) | (4.5) | – |
| Total Long-Term Public Borrowing | 36.0 | (4.1) | 31.9 | 31.7 | 31.2 |
Note: Numbers may not add due to rounding.
Source: Ontario Financing Authority.
As of October 24, 2019, $21.3 billion, or 67 per cent, of this year’s long-term public borrowing was completed. The Province expects to complete its 2019–20 long-term public borrowing program before the end of the current fiscal year, and subject to favourable market conditions, engage in pre borrowing for 2020–21.
Approximately 69 per cent of this year’s long-term borrowing to date has been completed in Canadian dollars. The remaining $6.7 billion, or 31 per cent, has been completed in foreign currencies, primarily in the U.S. dollar market.
The Province will continue to regularly borrow in currencies other than the Canadian dollar to diversify its investor base. This helps reduce Ontario’s overall borrowing costs and ensures the Province will continue to have access to capital if domestic market conditions become more challenging. The Province’s target range for Canadian dollar borrowing remains 70 to 80 per cent of total borrowing for the fiscal year. The Province will actively assess this range and adjust it further, if needed, to reflect market conditions.
Green Bonds remain a core component of Ontario’s borrowing program and are an important tool used to help finance public transit initiatives, extreme weather-resistant infrastructure, and energy efficiency and conservation projects. Ontario is currently the largest issuer of Canadian dollar Green Bonds, with five issues totalling $4.0 billion and with $3.5 billion currently outstanding. October marked the fifth anniversary of Ontario’s Green Bond program. The Province plans to launch its next Green Bond before the end of this fiscal year, and possibly another if market conditions allow.
Ontario’s Debt Burden
With the Province’s net debt projected to reach $353.7 billion by the end of 2019–20, Ontario continues to have the largest debt of any subnational jurisdiction in the world. A high level of debt creates risk for future generations and for the government’s ability to respond to an economic downturn or an unexpected rise in interest rates.
It also contributes to the risk of interest charges becoming unsustainable. In 2019–20, interest payments to service the Province’s debt are forecast to be $12.9 billion, an increase of $0.5 billion from 2018–19. This is more than $1 billion per month that cannot be used for other investment priorities, such as education, health care and infrastructure, or tax reductions.
Forecasts for interest on debt expense between 2019–20 and 2021–22 represent improvements in the range of $0.4 billion to $0.5 billion per fiscal year from the projections in the 2019 Budget. This is due to lower-than-projected deficits and lower than forecasted interest rates on new or refinanced debt issued over the current outlook period. Even with these improvements, the people of Ontario will pay almost $900 per person in interest payments this year to service the Province’s debt. This is why the government’s debt burden reduction strategy remains necessary.
The government is committed to implementing the actions outlined in the 2019 Budget to address the debt burden and put the Province’s finances on a more sustainable path.
Net Debt
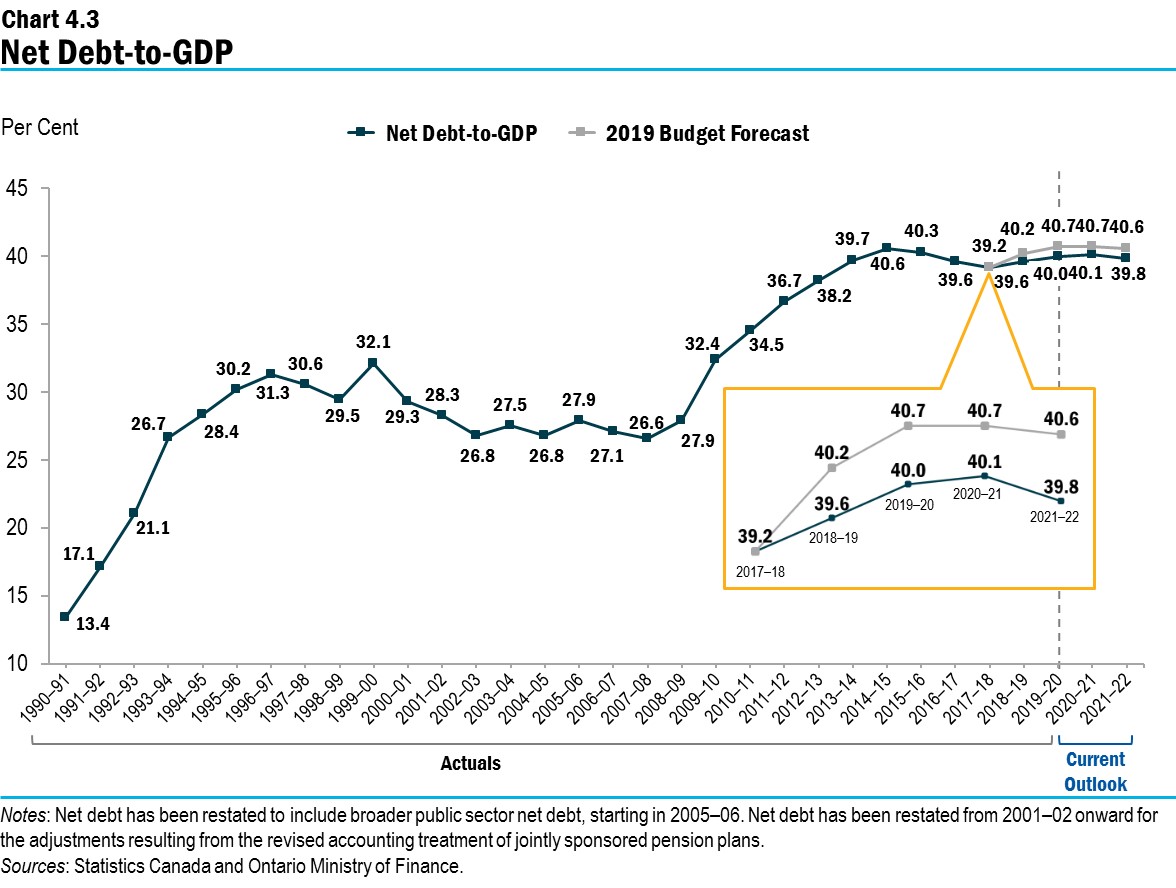
The government remains committed to keeping the net debt-to-GDP ratio, through to 2022–23, to less than the Commission’s forecast for 2018–19 of 40.8 per cent. In 2019–20, the net debt-to-GDP ratio is projected to be 40.0 per cent, or 0.7 percentage points lower than the 40.7 per cent forecast in the 2019 Budget. Going forward, the net debt-to-GDP ratio for the current outlook period is forecast to be 0.6 percentage points lower in 2020–21 and 0.8 percentage points lower in 2021–22 than forecast in the 2019 Budget, as a result of the government’s debt burden reduction strategy and lower than forecast interest rates.
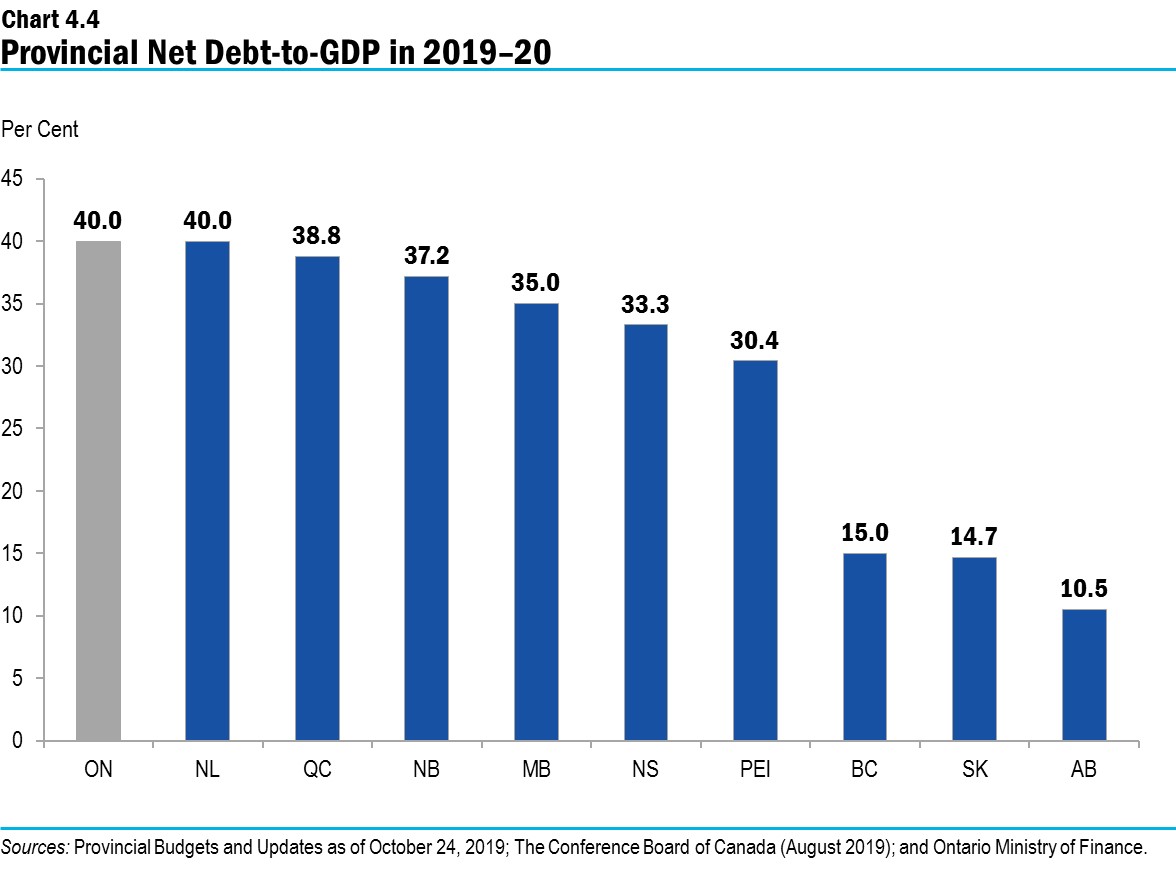
When compared with the other provinces, Ontario, along with Newfoundland and Labrador, is forecast to have the highest net debt-to-GDP ratio in Canada in 2019–20.
Progress on the Debt Burden Reduction Strategy
In the 2019 Budget, the government set out its objective for Ontario’s net debt-to-GDP ratio to reach more sustainable levels, underpinned by the debt burden reduction strategy.
Government action to date to support economic growth and modernize public services has resulted in an improved fiscal outlook compared with the inherited fiscal challenge.
In 2018–19, the Province reported a deficit of $7.4 billion. This lower-than-projected deficit contributed to a decline in the net debt-to-GDP ratio. The Province reported a net debt-to-GDP ratio of 39.6 per cent for 2018–19, down over one percentage point from the 40.8 per cent forecast by the Commission.
With deficits projected to steadily decline over the medium-term outlook, the fiscal plan supports the government’s commitment to reducing the debt burden. The net debt-to-GDP ratio is forecast to fall to 39.8 per cent by 2021–22.
Recognizing the risks that can arise from unsustainable debt levels, the government has set out a path to restore the fiscal health of the Province and reduce the debt burden. By taking action to address the debt challenge today, the government will ensure the sustainability of key services in the future for the people of Ontario. The government will continue to implement the debt burden reduction strategy and is demonstrating its commitment to transparency by reporting on progress to date.
Ontario’s path of fiscal improvement and debt burden reduction is also supported by the government’s commitment to spending smarter, while ensuring value for every taxpayer dollar. The government has launched its 2020–21 multi-year planning process, which will be informed by a dedicated ongoing review of all programs to allow for further program modernization, efficiencies and effectiveness. It is also supported by a number of significant transformation initiatives to build smarter government. See Chapter 1, Section F: A Plan to Build Ontario Together by Making Government Smarter for more details on these initiatives and planning for efficiency and modernization.
Cost of Debt
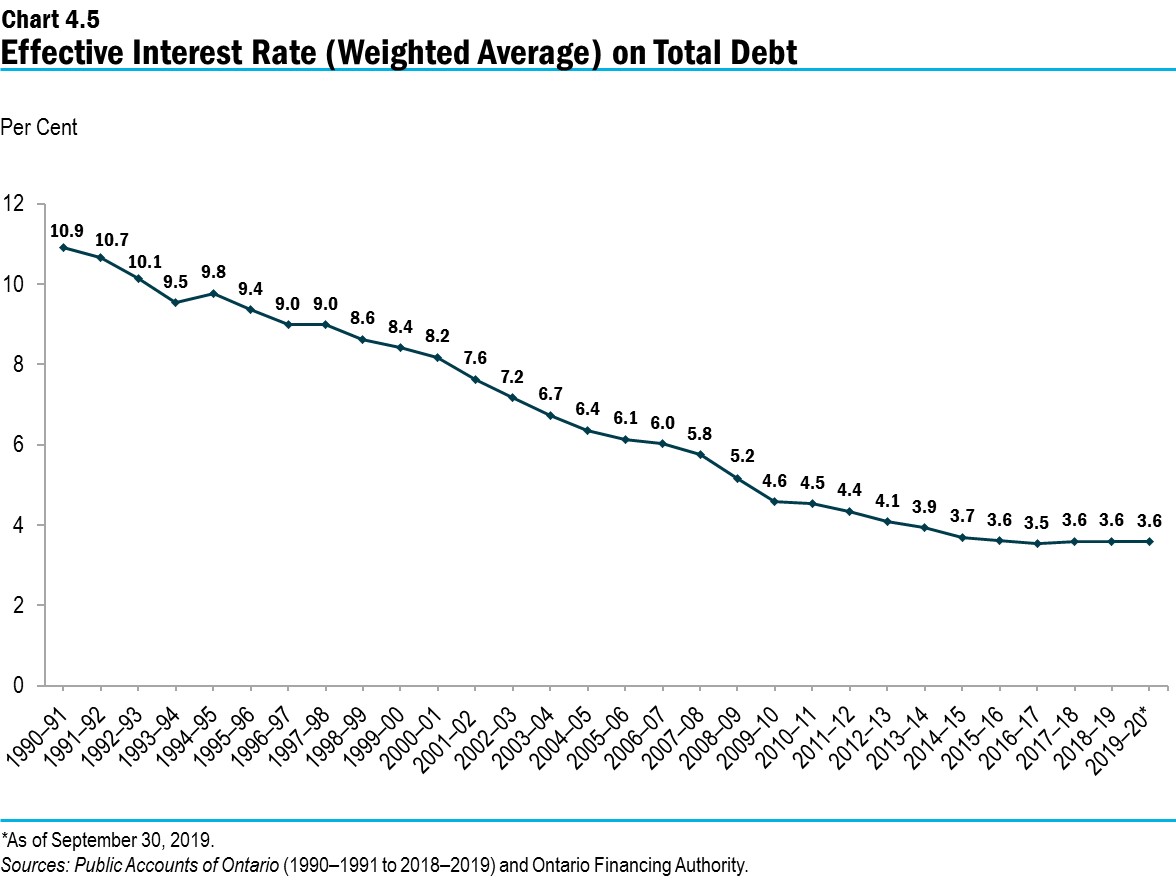
An over 25-year decline in interest rates has meant that the interest on debt (IOD) has not risen as quickly as the Province’s debt, especially over the last 10 years, despite the Province’s debt load more than doubling over that period. Chart 4.5 shows the 3.6 per cent effective interest rate the Province is paying on its total debt portfolio of over one-third of a trillion dollars: these rates have declined for a quarter century and are forecast to remain low over the fiscal period covered by the 2019 Ontario Economic Outlook and Fiscal Review.
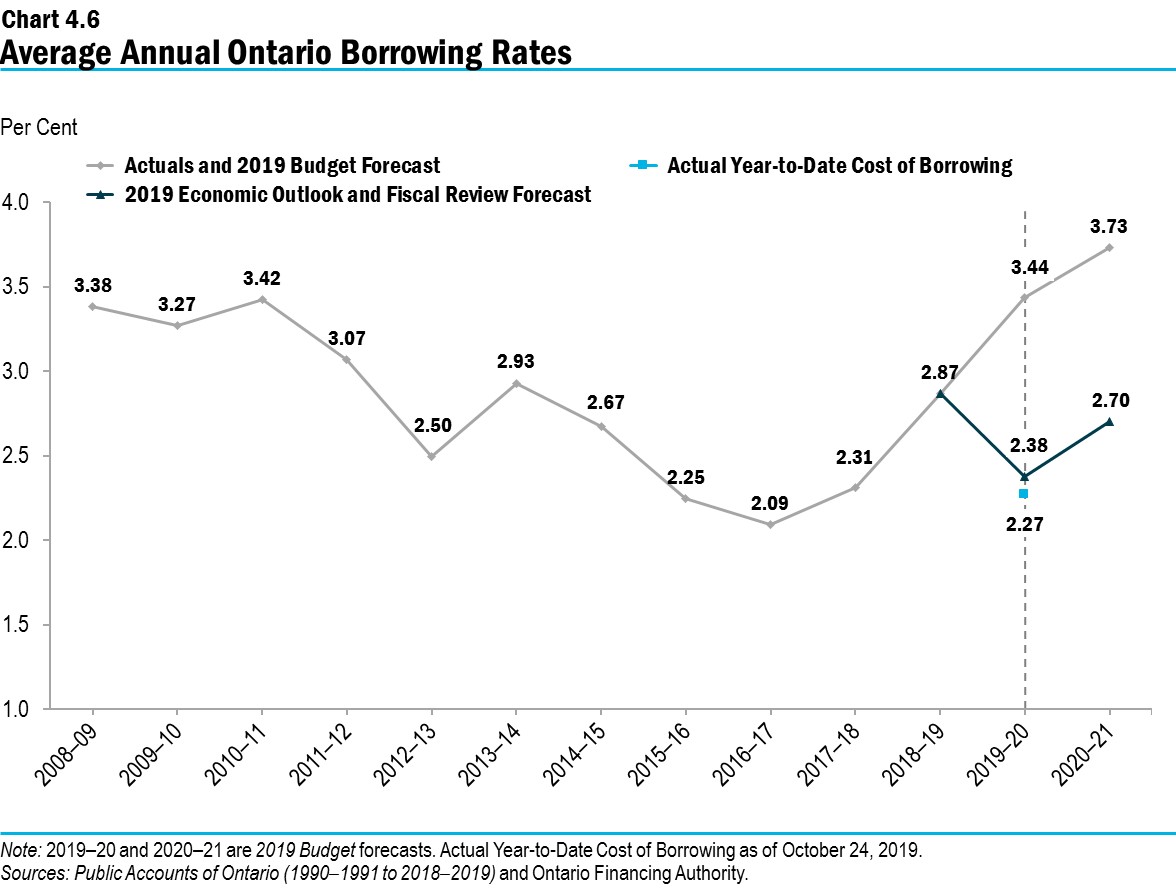
The interest rates that the Province must pay every year on new or refinanced debt issued rose for the past two years but are forecast to decline in 2019–20. Nevertheless, the forecast average interest costs of 2.38 per cent in 2019–20 and 2.70 per cent in 2020–21 are higher than the low point in 2016–17. This is highlighted in Chart 4.6, which shows historical borrowing rates on debt issued and the forecast used to estimate the future cost of borrowing or IOD expense. Year-to-date borrowing costs at 2.27 per cent are also above the 2016–17 average borrowing rate. The forecast borrowing rate for 2021–22, at 4.40 per cent, remains at the forecast level of the 2019 Budget as the Province continues to incorporate prudence by using the average of Ontario’s borrowing rates over the past 20 years.
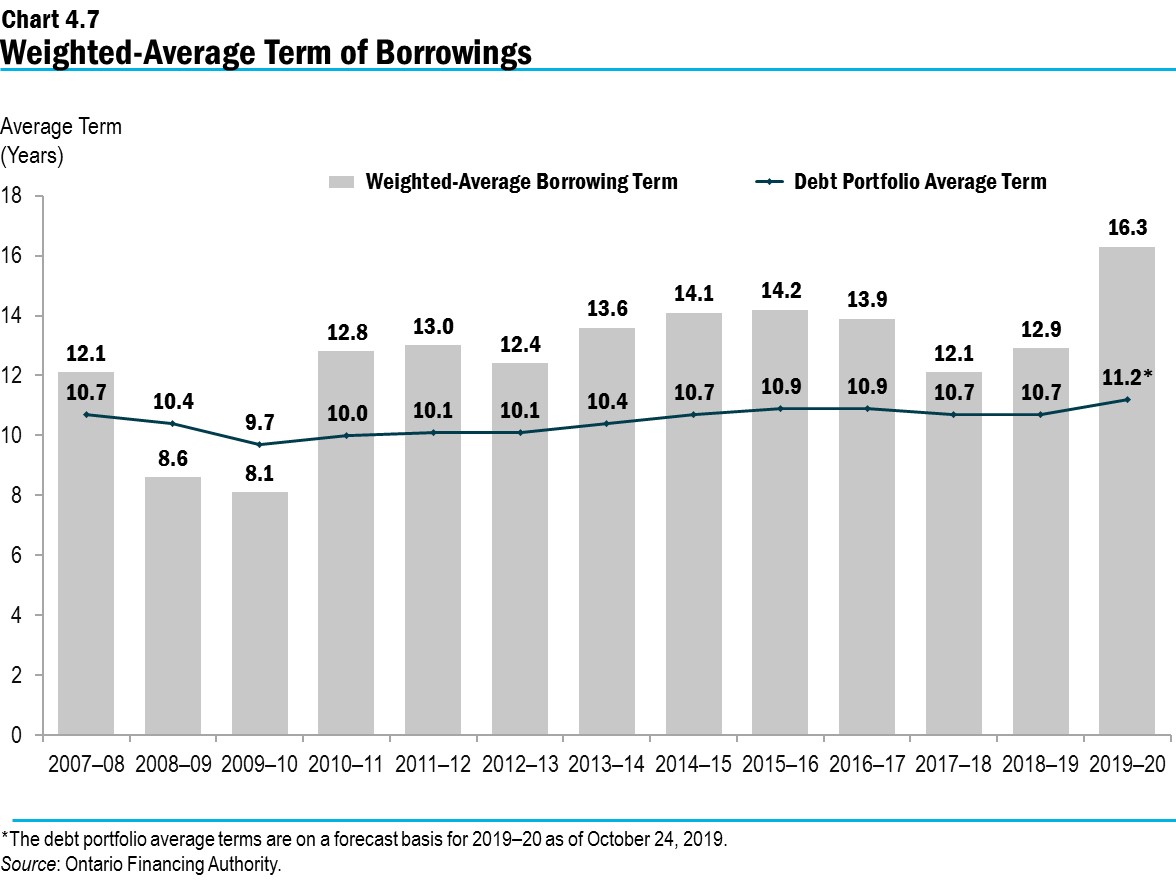
A one percentage point change in interest rates from the forecast would change interest costs by over $300 million in the first full year. To protect the Province from increases in interest rates from their historical lows, the government has extended the term of its debt to lower the amount that must be refinanced every year. Going back to the beginning of 2010–11, to lock in low rates, Ontario has issued $87.9 billion of bonds 30 years or longer, or approximately one-quarter of total debt, including $7.8 billion so far in 2019–20.
As a result, the average term of Ontario’s debt portfolio has been extended, from 9.7 years in 2009–10 to 11.2 years in 2019–20 as of October 24, 2019. The Province monitors interest rates daily. It continually assesses and determines, based on demand for its debt and interest rates across the yield curve, whether it remains cost-effective to continue to extend the term of its debt. The Province currently plans to continue to keep the average term of its debt in the same extended range that it has been over the past five years.
While net debt-to-GDP is the primary measure of sustainability of the debt burden the Province faces, another ratio that measures the affordability of debt is the IOD-to-revenue ratio. It represents how much the Province needs to spend on interest for every revenue dollar received. The current forecast is 8.3 cents of interest cost for every dollar of revenue in 2019–20. This means that the Province is spending 8.3 cents of every dollar it receives to pay interest, instead of using this revenue to provide critical services to the people of Ontario, or to lower taxes.
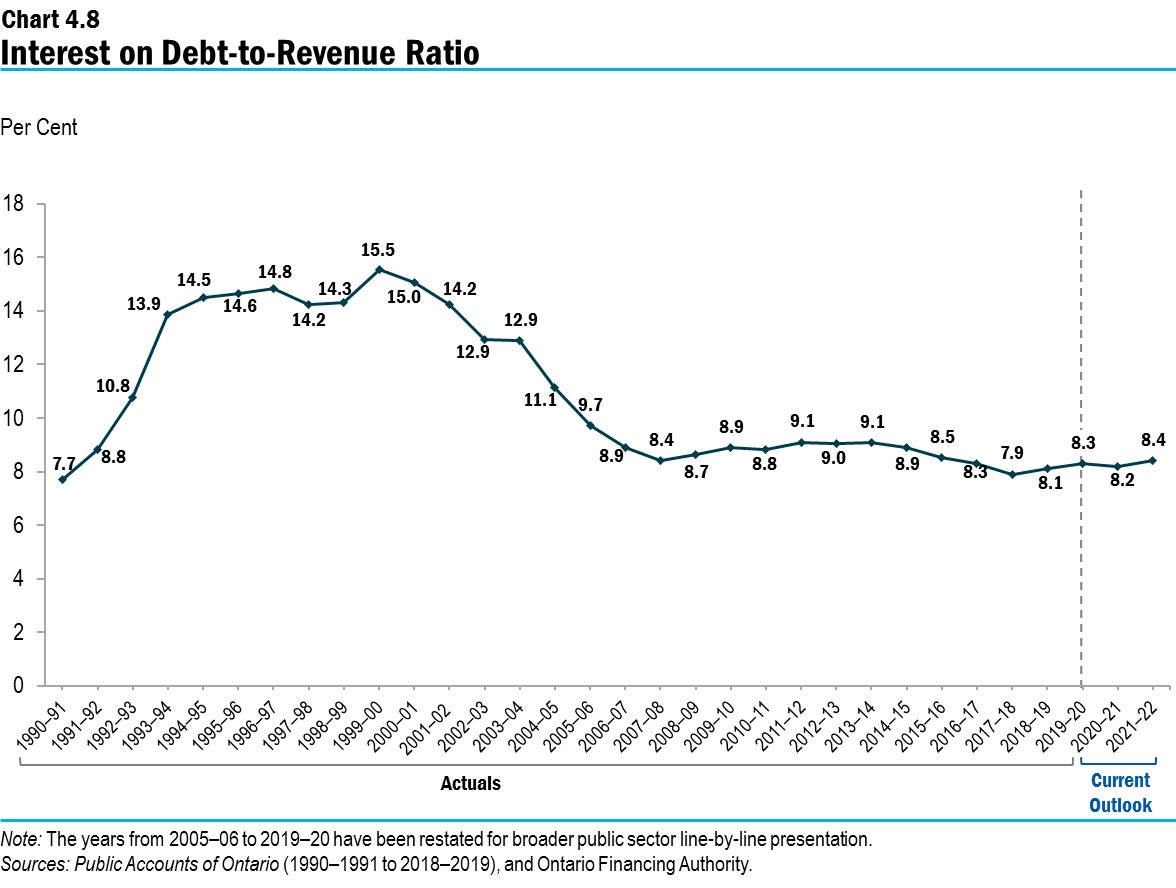
Chart Descriptions
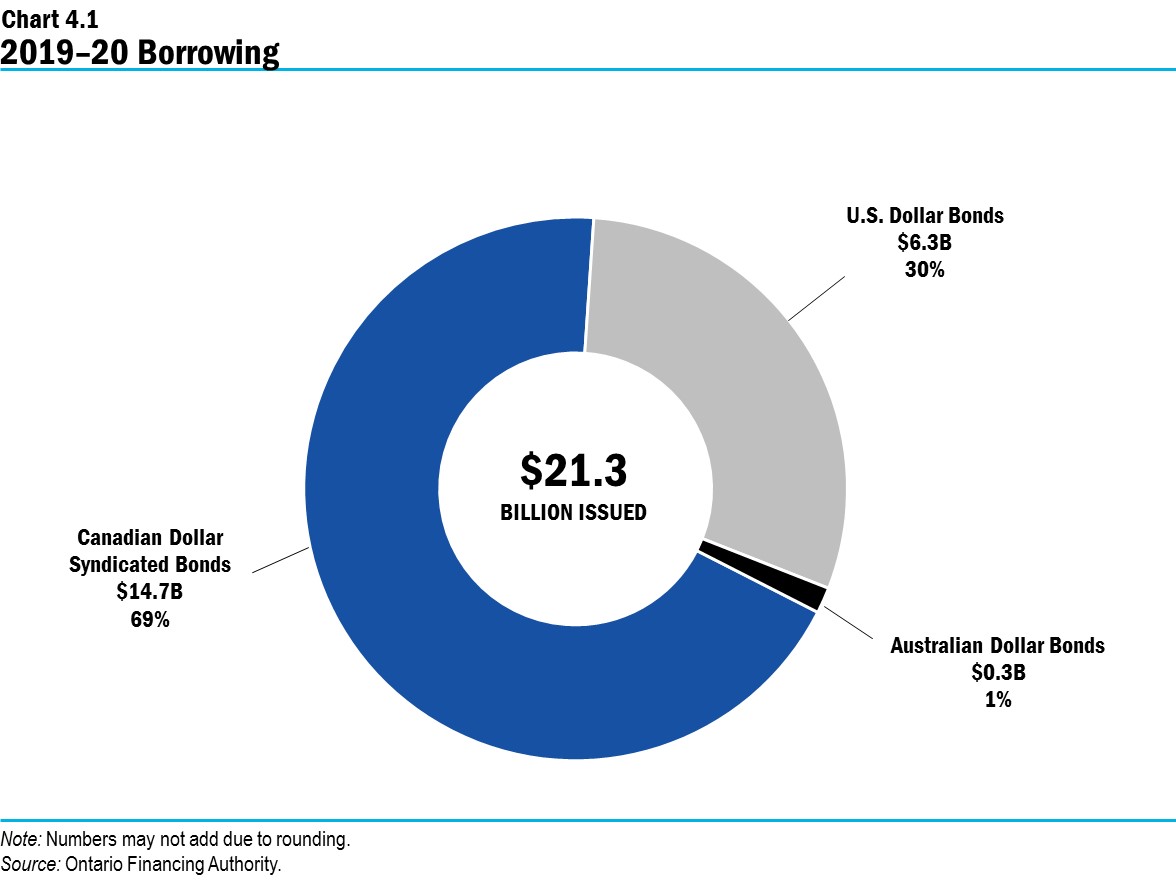
Chart 4.1: 2019–20 Borrowing
As of October 24, 2019, $21.3 billion of this year’s long-term public borrowing has been completed. This consisted of $14.7 billion (69 per cent) of Canadian dollar syndicated bonds, $6.3 billion (30 per cent) of U.S. dollar bonds, and $0.3 billion (1 per cent) of Australian dollar bonds.
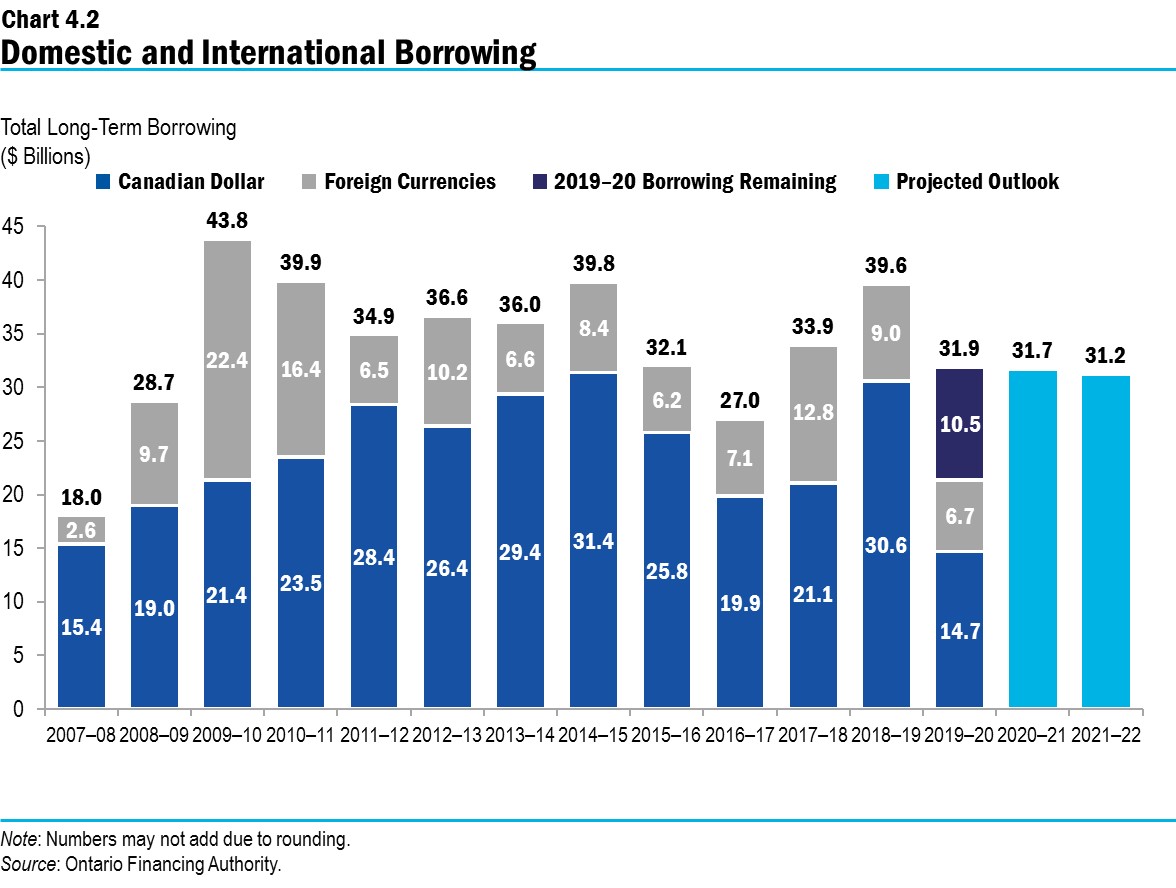
Chart 4.2: Domestic and International Borrowing
The Province’s total long-term borrowing in 2019–20 is forecast to be $31.9 billion — $14.7 billion was borrowed in the Canadian dollar market, $6.7 billion was borrowed in foreign currencies and $10.5 billion remaining.
| Year | Canadian Dollar ($ Billions) |
Foreign Currencies ($ Billions) |
Total ($ Billions) |
Projected Outlook ($ Billions) |
|---|---|---|---|---|
| 2007–08 | 15.4 | 2.6 | 18.0 | – |
| 2008–09 | 19.0 | 9.7 | 28.7 | – |
| 2009–10 | 21.4 | 22.4 | 43.8 | – |
| 2010–11 | 23.5 | 16.4 | 39.9 | – |
| 2011–12 | 28.4 | 6.5 | 34.9 | – |
| 2012–13 | 26.4 | 10.2 | 36.6 | – |
| 2013–14 | 29.4 | 6.6 | 36.0 | – |
| 2014–15 | 31.4 | 8.4 | 39.8 | – |
| 2015–16 | 25.8 | 6.2 | 32.1 | – |
| 2016–17 | 19.9 | 7.1 | 27.0 | – |
| 2017–18 | 21.1 | 12.8 | 33.9 | – |
| 2018–19 | 30.6 | 9.0 | 39.6 | – |
| 2019–20 | 14.7 | 6.7 | 31.9 | – |
| 2020–21 | – | – | – | 31.7 |
| 2021–22 | – | – | – | 31.2 |
Chart 4.3: Net Debt-to-GDP
Ontario’s net debt-to-GDP ratio is forecast at 40.0 per cent in 2019–20.
| Year | Net Debt-to-GDP (%) |
2019 Budget Forecast (%) |
|---|---|---|
| 1990–91 | 13.4 | – |
| 1991–92 | 17.1 | – |
| 1992–93 | 21.1 | – |
| 1993–94 | 26.7 | – |
| 1994–95 | 28.4 | – |
| 1995–96 | 30.2 | – |
| 1996–97 | 31.3 | – |
| 1997–98 | 30.6 | – |
| 1998–99 | 29.5 | – |
| 1999–00 | 32.1 | – |
| 2000–01 | 29.3 | – |
| 2001–02 | 28.3 | – |
| 2002–03 | 26.8 | – |
| 2003–04 | 27.5 | – |
| 2004–05 | 26.8 | – |
| 2005–06 | 27.9 | – |
| 2006–07 | 27.1 | – |
| 2007–08 | 26.6 | – |
| 2008–09 | 27.9 | – |
| 2009–10 | 32.4 | – |
| 2010–11 | 34.5 | – |
| 2011–12 | 36.7 | – |
| 2012–13 | 38.2 | – |
| 2013–14 | 39.7 | – |
| 2014–15 | 40.6 | – |
| 2015–16 | 40.3 | – |
| 2016–17 | 39.6 | – |
| 2017–18 | 39.2 | 39.2 |
| 2018–19 | 39.6 | 40.2 |
| 2019–20 | 40.0 | 40.7 |
| 2020–21 | 40.1 | 40.7 |
| 2021–22 | 39.8 | 40.6 |
Chart 4.4: Provincial Net Debt-to-GDP in 2019–20
When compared with the other provinces, Ontario, along with Newfoundland and Labrador, are forecast to have the highest net debt-to-GDP ratio in Canada in 2019–20.
| Province | Net
Debt-to-GDP (%) |
|---|---|
| Ontario | 40.0 |
| Newfoundland and Labrador | 40.0 |
| Quebec | 38.8 |
| New Brunswick | 37.2 |
| Manitoba | 35.0 |
| Nova Scotia | 33.3 |
| Prince Edward Island | 30.4 |
| British Columbia | 15.0 |
| Saskatchewan | 14.7 |
| Alberta | 10.5 |
Chart 4.5: Effective Interest Rate (Weighted-Average) on Total Debt
As of September 30, 2019, the effective interest rate (calculated as a weighted average) for 2019–20 is forecast to be 3.6 per cent on the Province’s total debt.
| Year | Effective Interest Rate (%) |
|---|---|
| 1990–91 | 10.9 |
| 1991–92 | 10.7 |
| 1992–93 | 10.1 |
| 1993–94 | 9.5 |
| 1994–95 | 9.8 |
| 1995–96 | 9.4 |
| 1996–97 | 9.0 |
| 1997–98 | 9.0 |
| 1998–99 | 8.6 |
| 1999–00 | 8.4 |
| 2000–01 | 8.2 |
| 2001–02 | 7.6 |
| 2002–03 | 7.2 |
| 2003–04 | 6.7 |
| 2004–05 | 6.4 |
| 2005–06 | 6.1 |
| 2006–07 | 6.0 |
| 2007–08 | 5.8 |
| 2008–09 | 5.2 |
| 2009–10 | 4.6 |
| 2010–11 | 4.5 |
| 2011–12 | 4.4 |
| 2012–13 | 4.1 |
| 2013–14 | 3.9 |
| 2014–15 | 3.7 |
| 2015–16 | 3.6 |
| 2016–17 | 3.5 |
| 2017–18 | 3.6 |
| 2018–19 | 3.6 |
| 2019–20 | 3.6 |
Chart 4.6: Average Annual Ontario Borrowing Rates
The actual year-to-date cost of borrowing is 2.27 per cent, as of October 24, 2019.
| Year | Actuals and 2019 Budget Forecast (%) |
Actual Year-to-Date Cost of Borrowing (%) |
2019 Economic Outlook and Fiscal Review Forecast (%) |
|---|---|---|---|
| 2008–09 | 3.38 | – | – |
| 2009–10 | 3.27 | – | – |
| 2010–11 | 3.42 | – | – |
| 2011–12 | 3.07 | – | – |
| 2012–13 | 2.50 | – | – |
| 2013–14 | 2.93 | – | – |
| 2014–15 | 2.67 | – | – |
| 2015–16 | 2.25 | – | – |
| 2016–17 | 2.09 | – | – |
| 2017–18 | 2.31 | – | – |
| 2018–19 | 2.87 | – | – |
| 2019–20 | 3.44 | 2.27 | 2.38 |
| 2020–21 | 3.73 | – | 2.70 |
Chart 4.7: Weighted-Average Term of Borrowings
The average term of Ontario’s debt portfolio has been extended from 9.7 years in 2009–10 to 11.2 years as of October 24, 2019. The weighted-average borrowing term for 2019–20 was 16.3 years as of October 24, 2019.
| Year | 2007–08 | 2008–09 | 2009–10 | 2010–11 | 2011–12 | 2012–13 | 2013–14 | 2014–15 | 2015–16 | 2016–17 | 2017–18 | 2018–19 | 2019–20 |
|---|---|---|---|---|---|---|---|---|---|---|---|---|---|
| Weighted-Average Borrowing Term (Years) | 12.1 | 8.6 | 8.1 | 12.8 | 13.0 | 12.4 | 13.6 | 14.1 | 14.2 | 13.9 | 12.1 | 12.9 | 16.3 |
| Debt Portfolio Average Term (Years) | 10.7 | 10.4 | 9.7 | 10.0 | 10.1 | 10.1 | 10.4 | 10.7 | 10.9 | 10.9 | 10.7 | 10.7 | 11.2 |
Chart 4.8: Interest on Debt-to-Revenue Ratio
Interest on debt-to-revenue is forecast to be 8.3 per cent in 2019–20.
| Year | Effective Interest Rate (%) |
|---|---|
| 1990–91 | 7.7 |
| 1991–92 | 8.8 |
| 1992–93 | 10.8 |
| 1993–94 | 13.9 |
| 1994–95 | 14.5 |
| 1995–96 | 14.6 |
| 1996–97 | 14.8 |
| 1997–98 | 14.2 |
| 1998–99 | 14.3 |
| 1999–00 | 15.5 |
| 2000–01 | 15.0 |
| 2001–02 | 14.2 |
| 2002–03 | 12.9 |
| 2003–04 | 12.9 |
| 2004–05 | 11.1 |
| 2005–06 | 9.7 |
| 2006–07 | 8.9 |
| 2007–08 | 8.4 |
| 2008–09 | 8.7 |
| 2009–10 | 8.9 |
| 2010–11 | 8.8 |
| 2011–12 | 9.1 |
| 2012–13 | 9.0 |
| 2013–14 | 9.1 |
| 2014–15 | 8.9 |
| 2015–16 | 8.5 |
| 2016–17 | 8.3 |
| 2017–18 | 7.9 |
| 2018–19 | 8.1 |
| 2019–20 | 8.3 |
| 2020–21 | 8.2 |
| 2021–22 | 8.4 |