Introduction
The 2019 Ontario Economic Outlook and Fiscal Review is reporting progress on the Province’s fiscal plan, with fiscal improvements in all years compared to the plan set out in the 2019 Budget. The government has been responsive by making changes since the 2019 Budget in a way that is prudent and ensures critical public services are supported on an ongoing basis, while maintaining its commitment to balance the budget by 2023–24.
The government is projecting a $1.3 billion improvement to the 2019–20 deficit, to $9.0 billion from $10.3 billion. Over the medium term, the government continues to project steadily declining deficits of $6.7 billion in 2020–21 and $5.4 billion in 2021–22.
The net debt-to-GDP ratio is projected to be 40.0 per cent in 2019–20, 0.7 percentage points lower than the 40.7 per cent forecast in the 2019 Budget. The government is projecting lower net debt-to-GDP ratios over the medium-term outlook relative to the 2019 Budget projections.
| Actual 2018–19 |
Current Outlook 2019–20 |
Medium-Term Outlook 2020–21 |
Medium-Term Outlook 2021–22 |
|
|---|---|---|---|---|
| Revenue | 153.7 | 155.8 | 161.5 | 165.4 |
| Expense — Programs | 148.8 | 150.9 | 154.0 | 155.9 |
| Expense — Interest on Debt | 12.4 | 12.9 | 13.2 | 13.9 |
| Total Expense | 161.1 | 163.8 | 167.2 | 169.8 |
| Surplus/(Deficit) Before Reserve | (7.4) | (8.0) | (5.7) | (4.4) |
| Reserve | – | 1.0 | 1.0 | 1.0 |
| Surplus/(Deficit) | (7.4) | (9.0) | (6.7) | (5.4) |
| Net Debt as a Per Cent of GDP | 39.6 | 40.0 | 40.1 | 39.8 |
| Accumulated Deficit as a Per Cent of GDP | 25.3 | 25.4 | 25.2 | 24.9 |
Note: Numbers may not add due to rounding.
The following sections detail the actions taken by the government since the release of the 2019 Budget to deliver its fiscal plan.
Key 2019–20 Changes since the 2019 Budget
The government is projecting a $1.3 billion improvement to the 2019–20 deficit, to $9.0 billion from $10.3 billion.
The improvement includes an increase of $1.6 billion in revenue, which is primarily due to higher personal and corporate income tax revenue. At the same time, the government has continued to make life better for the people of Ontario by allocating an additional $1.3 billion to key priorities in 2019–20, which are partially offset by contingency fund draws for a net increase in program spending of $0.8 billion. Interest on debt expense is projected to decrease by $0.4 billion as a result of lower 2018–19 and 2019–20 deficits and lower-than-forecast interest rates. The reserve has been maintained at $1.0 billion.
| 2019 Budget |
Current Outlook |
In-Year Change |
|
|---|---|---|---|
| Revenue | 154.2 | 155.8 | 1.6 |
| Expense — Programs | 150.1 | 150.9 | 0.8 |
| Expense — Interest on Debt | 13.3 | 12.9 | (0.4) |
| Total Expense | 163.4 | 163.8 | 0.3 |
| Surplus/(Deficit) Before Reserve | (9.3) | (8.0) | 1.3 |
| Reserve | 1.0 | 1.0 | – |
| Surplus/(Deficit) | (10.3) | (9.0) | 1.3 |
Note: Numbers may not add due to rounding.
Revenue
The 2019–20 total revenue outlook is $155.8 billion, $1,596 million higher than the 2019 Budget forecast.
| 2019–20 | |
|---|---|
| 2019 Budget Total Revenue | 154,165 |
| In-Year Revenue Changes — Corporations Tax | 936 |
| In-Year Revenue Changes — Personal Income Tax | 525 |
| In-Year Revenue Changes — Land Transfer Tax | 90 |
| In-Year Revenue Changes — All Other Taxes | 54 |
| Total Taxation Revenue | 1,606 |
| Other Non-Tax Revenue | (9) |
| Total In-Year Revenue Changes | 1,596 |
| 2019 Ontario Economic Outlook and Fiscal Review Total Revenue | 155,761 |
Note: Numbers may not add due to rounding.
Details of 2019–20 Revenue Changes
Highlights of changes to the 2019–20 revenue forecast since the 2019 Budget are as follows:
- Corporations Tax revenue is $936 million higher mainly due to increased revenues indicated by the processing of 2018 tax returns.
- Personal Income Tax revenue is $525 million higher due to increased revenues indicated by processing 2018 and prior-year tax returns.
- Land Transfer Tax revenue is $90 million higher, reflecting a strengthening in provincial housing resales.
- All Other Taxes combined increased by $54 million based largely on higher than anticipated revenue collections since the 2019 Budget.
- Other Non-Tax Revenues are $9 million lower, mainly reflecting relief from previously scheduled fee increases including: freezing key driver, vehicle and commercial fees until July 1, 2020; the impact of an extension of the fee waiver for a change-of-sex designation on birth registrations; and the elimination of the Driver’s Licence Check service fee for a single driver’s licence check order.
Expense
The 2019–20 total expense outlook is $163.8 billion, $341 million higher than the 2019 Budget forecast and includes $1.3 billion in new allocated spending towards health care, education, child care, and social services for the province’s most vulnerable people. These investments are being partially funded by drawing on already budgeted contingency funds, resulting in a $0.8 billion net increase in program expense.
| 2019–20 | |
|---|---|
| 2019 Budget Total Expense | 163,444 |
| Changes since the 2019 Budget — Health Sector1 | 404 |
| Changes since the 2019 Budget — Education Sector | 186 |
| Changes since the 2019 Budget — Postsecondary Education and Training Sector2 | 0 |
| Changes since the 2019 Budget — Children’s and Social Services Sector | 637 |
| Changes since the 2019 Budget — Justice Sector | – |
| Changes since the 2019 Budget — Other Programs Excluding Contingency Funds3 | 94 |
| Total New Allocated Spending | 1,322 |
| Contingency Funds | (551) |
| Net Program Expense Changes since the 2019 Budget | 771 |
| Interest on Debt Change | (430) |
| Total Expense Changes since the 2019 Budget | 341 |
| 2019 Ontario Economic Outlook and Fiscal Review Total Expense | 163,785 |
Table 3.4 footnotes:
[1], [2], [3] Sectors are reported based on the 2019 Budget ministry structure. Impacts on sectors resulting from changes to ministry structures made since the 2019 Budget will be reflected in future updates.
Note: Numbers may not add due to rounding. Sector changes shown in the table exclude fiscally neutral accounting presentation adjustments.
Details of 2019–20 Expense Changes
The following key program expense changes have occurred since the 2019 Budget:
Health Sector expense has increased by $404 million in 2019–20 mainly due to:
- Additional funding of $227 million for items such as increased utilization of physician and other services under the Ontario Health Insurance Plan (OHIP) and providing relief to long-term care residents by removing the prescription co-payment requirement completely;
- Additional funding of $68 million for hospitals to help end hallway health care by addressing capacity issues, wait times and access to life saving programs. The investment will also reduce the need for patients to travel across the province, the country and south of the border to receive care;
- An investment of $41 million to support Public Health Units as the ministry considers options to modernize public health, completes engagement with stakeholders and finalizes implementation approaches; and
- Additional funding of $26 million to support municipal land ambulance operations.
Education Sector expense has increased by $186 million in 2019–20 mainly due to:
- An increase of $122 million to help municipal partners provide child care programs; and
- An increase of $64 million to support elementary and secondary education programs.
Children’s and Social Services Sector expense has increased by $637 million in 2019–20 mainly due to:
- An investment in social services of $310 million to support social assistance, developmental services, child welfare and other programs to help vulnerable populations while transformation is underway. This includes continuing to deliver the Transition Child Benefit and not proceeding with planned changes to Ontario Works and Ontario Disability Support Program earnings exemptions;
- An additional investment of $279 million in the Province’s autism program to continue to support children and youth with Autism Spectrum Disorder, including issuing childhood budgets, and bringing children off the waitlist while working towards implementing a needs-based and sustainable autism program, and providing continuity of service to families with existing behaviour plans;
- An investment of $43 million in youth justice services while the government continues to work on modernization approaches; and
- An investment of $6 million to support the language training program for newcomers to help them gain the language skills they need to successfully work and live in Ontario.
Other Programs Sector expense excluding contingency funds has increased by $94 million in 2019–20 mainly due to:
- Funding of $60 million to fight forest fires across the province keeping people and property safe while protecting the province’s forests;
- Additional funding of $14 million for maintenance work to keep Ontario’s highways safe and reliable;
- Funding of $12 million for the Ontario Wine Fund, the Small Cidery and Small Distillery Support Program and the Vineyard Improvement Program to support Ontario grape growers, wineries, small distilleries and craft cideries; and
- Funding of $8 million to create the Audit and Accountability Fund to allow municipal and school board partners to conduct reviews of programs and services with a goal of finding efficiencies.
Contingency Funds decreased by $551 million to offset select program expense changes that have occurred since the 2019 Budget.
Interest on Debt expense is $430 million lower than projected in the 2019 Budget, primarily as a result of lower 2018–19 and 2019–20 deficits and lower-than-forecast interest rates.
Prudence
The 2019 Budget included a reserve of $1.0 billion in 2019–20 to protect the fiscal outlook against unforeseen adverse changes to revenue and expense. The reserve remains unchanged at $1.0 billion to ensure a prudent risk management approach given uncertainties remaining in the fiscal outlook for 2019–20.
Contingency funds are also maintained to help mitigate expense risks that may otherwise adversely affect Ontario’s fiscal performance. The current contingency fund level is $0.5 billion in 2019–20.
Key Changes to the Medium-Term Fiscal Outlook since the 2019 Budget
The government continues to project steadily declining deficits over the medium term, with fiscal improvements of $0.1 billion in both 2020–21 and 2021–22, since the 2019 Budget. The government is now projecting deficits of $6.7 billion in 2020–21 and $5.4 billion in 2021–22.
Over the medium term, projected revenue has increased by $1.7 billion in 2020–21 and 2021–22, relative to the 2019 Budget. Over the same period, total expense is projected to increase by $1.5 billion in 2020–21, and $1.6 billion in 2021–22.
| Current Outlook 2019–20 |
Medium-Term Outlook 2020–21 |
Medium-Term Outlook 2021–22 |
|
|---|---|---|---|
| Surplus/(Deficit) from the 2019 Budget | (10.3) | (6.8) | (5.6) |
| Revenue Changes (see Table 3.6) | 1.6 | 1.7 | 1.7 |
| Expense Changes — Total Program Expense Changes (see Table 3.8) | 0.8 | 2.0 | 2.1 |
| Expense Changes — Interest on Debt Changes | (0.4) | (0.5) | (0.5) |
| Total Expense Changes | 0.3 | 1.5 | 1.6 |
| Change in Reserve | – | – | – |
| Fiscal Improvement/(Deterioration) | 1.3 | 0.1 | 0.1 |
| 2019 Ontario Economic Outlook and Fiscal Review Surplus/(Deficit) | (9.0) | (6.7) | (5.4) |
Note: Numbers may not add due to rounding.
Revenue
Ontario’s economy continues to generate higher revenues than expected at the time of the 2019 Budget.
| Current Outlook 2019–20 |
Medium-Term Outlook 2020–21 |
Medium-Term Outlook 2021–22 |
|
|---|---|---|---|
| 2019 Budget Total Revenue | 154.2 | 159.8 | 163.7 |
| Revenue Changes — Personal Income Tax | 0.5 | 0.4 | 0.5 |
| Revenue Changes — Corporations Tax | 0.9 | 1.0 | 1.0 |
| Revenue Changes — Other Taxes Combined | 0.1 | 0.2 | 0.2 |
| Revenue Changes — Cannabis Revenue | – | 0.1 | 0.1 |
| Total Revenue Changes since 2019 Budget | 1.6 | 1.7 | 1.7 |
| 2019 Ontario Economic Outlook and Fiscal Review Total Revenue | 155.8 | 161.5 | 165.4 |
Note: Numbers may not add due to rounding.
Details of Revenue Changes
- Processing of 2018 tax returns boosted the base upon which Personal Income Tax (PIT) and Corporations Tax (CT) growth is applied, increasing the level of revenues in each forecasted year from 2019–20 and onwards. The taxation revenue forecast includes the net impact of tax reductions announced in this document. See Annex: Details of Tax Measures for more information;
- Higher amounts from all Other Taxes Combined recorded to date have increased the forecast for 2019–20 onwards;
- Projected revenues related to Cannabis—including the Ontario portion of the federal cannabis excise duty and the Ontario Cannabis Store (OCS) net income/(loss) — have increased by approximately $0.1 billion in the medium-term outlook due to an increase in the number of private cannabis retail stores from 25 stores to 75 stores and the introduction of new cannabis product classes. For more information, refer to the following Cannabis-Related Revenue section; and
- Net changes to all other revenue sources combined remains close to the 2019 Budget outlook. This includes relief from previously scheduled fee increases including: freezing key driver, vehicle and commercial fees until July 1, 2020; the impact of an extension of the fee waiver for a
change-of-sex designation on birth registrations; and the elimination of the Driver’s Licence Check service fee for a single driver’s licence check order.
Cannabis-Related Revenue
Estimates of cannabis-related revenue include Ontario’s portion of the federal cannabis excise duty and the net income of the OCS. Ontario’s outlook for cannabis-related revenue reflects the Province’s temporary measure of permitting up to 75 private cannabis retail stores and the introduction of new cannabis product classes. The cannabis‐related revenue outlook will change as further retail store authorizations are issued, including the up to 18 additional stores on First Nation reserves that were recently announced.
| Revenue | Current Outlook 2019–20 |
Medium-Term Outlook 2020–21 |
Medium-Term Outlook 2021–22 |
|---|---|---|---|
| Ontario Portion of Federal Cannabis Excise Duty | 70 | 140 | 150 |
| Ontario Cannabis Store Net Income/(Loss) | 10 | 75 | 80 |
Expense
The government continues to support the people of Ontario as part of a balanced plan to invest in critical services. The government is investing an additional $4.9 billion, over three years, in programs such as health care, education, child care, and social services for the province’s most vulnerable people, relative to the 2019 Budget.
| Current Outlook 2019–20 |
Medium-Term Outlook 2020–21 |
Medium-Term Outlook 2021–22 |
|
|---|---|---|---|
| 2019 Budget Total Expense | 163.4 | 165.6 | 168.2 |
| Program Expense Changes since 2019 Budget — Health Sector1 | 0.4 | 0.5 | 0.5 |
| Program Expense Changes since 2019 Budget — Education Sector | 0.2 | 0.2 | 0.2 |
| Program Expense Changes since 2019 Budget — Postsecondary Education and Training Sector2 | 0.0 | 0.0 | 0.0 |
| Program Expense Changes since 2019 Budget — Children’s and Social Services Sector | 0.6 | 0.8 | 0.7 |
| Program Expense Changes since 2019 Budget — Justice Sector | – | 0.1 | 0.1 |
| Program Expense Changes since 2019 Budget — Other Programs3 | (0.5) | 0.3 | 0.5 |
| Total Program Expense Changes | 0.8 | 2.0 | 2.1 |
| Change in Interest on Debt | (0.4) | (0.5) | (0.5) |
| Total Expense Changes since 2019 Budget | 0.3 | 1.5 | 1.6 |
| 2019 Ontario Economic Outlook and Fiscal Review Total Expense | 163.8 | 167.2 | 169.8 |
Table 3.8 footnotes:
[1], [2], [3] Sectors are reported based on the 2019 Budget ministry structure. Impacts on sectors resulting from changes to ministry structures made since the 2019 Budget will be reflected in future updates.
Note: Numbers may not add due to rounding. Sector changes shown in the table exclude fiscally neutral accounting presentation adjustments.
Details of Expense Changes
The expense outlook over the medium term is higher, mainly because:
- Health Sector expense is projected to increase by $0.4 billion in 2019–20 and $0.5 billion in both 2020–21 and 2021–22, primarily due to utilization changes for physician and other services under OHIP and community-based health care services;
- Education Sector expense is projected to increase by $0.2 billion in each year, primarily due to investments in child care programs;
- Postsecondary Education and Training Sector expense has been maintained since the 2019 Budget. Key initiatives in this sector include restoring financial sustainability to the Ontario Student Assistance Plan (OSAP) and making sustained investments in Ontario’s universities, colleges and employment and training programs;
- Children’s and Social Services Sector expense is projected to increase by $0.6 billion in 2019–20, $0.8 billion in 2020–21 and $0.7 billion in 2021–22, compared to the 2019 Budget, primarily due to increasing investments in the Ontario Autism Program and deferring changes in social assistance while transformation is underway;
- Justice Sector expense is projected to increase by $0.1 billion in each of 2020–21 and 2021–22, primarily due to compensation investments for the Ontario Provincial Police, correctional services workers, provincial lawyers and judicial officers; and
- Other Programs Sector expense is projected to decrease by $0.5 billion in 2019–20, and increase by $0.3 billion in 2020–21 and $0.5 billion in 2021–22, to help mitigate expense risks as part of the government’s prudent planning approach.
Interest on Debt expense is projected to be lower over the medium term, relative to the 2019 Budget forecast, due to lower 2018–19 and 2019–20 deficits and lower-than-forecast interest rates.
Prudence
The 2019 Budget included a reserve of $1.0 billion in 2019–20, 2020–21 and 2021–22 to protect the fiscal outlook against unforeseen adverse changes to revenue and expense. The reserve remains unchanged at $1.0 billion in each year over the medium-term outlook, reflecting prudent fiscal management. Contingency funds are also maintained over the medium term to help mitigate expense risks.
Transparency and Risks
The government is committed to being open and transparent about the state of Ontario’s finances. This principle is reflected in the new Fiscal Sustainability, Transparency and Accountability Act, 2019 (FSTAA) which stipulates that Ontario’s fiscal policy should be based on cautious assumptions. FSTAA also requires that a mid-year review of Ontario’s finances be released on or before November 15th of each year. In compliance with the legislated framework this document is being released in advance of that deadline.
While mid-year updates to the government’s finances are informed by the latest information available, key information still to be received over the remainder of the fiscal year have further upside and downside risks which could materially affect the fiscal outlook. Revenue could be affected by changes in the economy, such as global events, and taxes collected, while expenses could be impacted by changes in utilization of large demand driven programs. For example,
- For every percentage point change in forecasted nominal GDP growth, taxation revenues are expected to change by $705 million.
- A one per cent increase in the number of Ontario Disability Support Program recipients costs the province an additional $56 million.
As a matter of transparent fiscal risk management practices, risks are monitored throughout the fiscal year by Treasury Board, with the goal of ensuring that robust and prudent methodologies are used to develop forecasts. Other important risk management tools include closely tracking the pace of implementation of initiatives and proactively identifying emerging program and policy risks. Comprehensive analysis of known risks informs the fiscal planning processes, including the development of plans to mitigate and manage fiscal risks, as well as integrating risks into medium-term fiscal projections when appropriate.
The Fiscal Sustainability, Transparency and Accountability Act, 2019, requires Ontario’s fiscal plan to incorporate prudence in the form of a reserve to protect the fiscal outlook against unforeseen adverse changes in the Province’s revenue and expense, including those resulting from changes in Ontario’s economic performance. Additionally, contingency funds are maintained to help mitigate expense risks — for example, in cases where health and safety may be compromised and which may otherwise adversely affect Ontario’s fiscal performance. In keeping with sound fiscal practices, the Province’s revenue outlook is based on prudent economic assumptions, as discussed in Chapter 2: Economic Outlook.
Details of Ontario’s Finances
| Actual 2016–17 |
Actual 2017–18 |
Actual 2018–19 |
Current Outlook 2019–20 |
|
|---|---|---|---|---|
| Taxation Revenue — Personal Income Tax | 30,671 | 32,900 | 35,381 | 37,125 |
| Taxation Revenue — Sales Tax | 24,750 | 25,923 | 27,804 | 28,067 |
| Taxation Revenue — Corporations Tax | 14,872 | 15,612 | 16,606 | 16,107 |
| Taxation Revenue — Education Property Tax | 5,868 | 5,883 | 6,171 | 6,197 |
| Taxation Revenue — Employer Health Tax | 5,908 | 6,205 | 6,544 | 6,791 |
| Taxation Revenue — Ontario Health Premium | 3,575 | 3,672 | 3,819 | 4,035 |
| Taxation Revenue — Gasoline Tax | 2,626 | 2,701 | 2,709 | 2,741 |
| Taxation Revenue — Land Transfer Tax | 2,728 | 3,174 | 2,761 | 2,967 |
| Taxation Revenue — Tobacco Tax | 1,230 | 1,244 | 1,241 | 1,205 |
| Taxation Revenue — Fuel Tax | 742 | 760 | 774 | 789 |
| Taxation Revenue — Beer, Wine and Spirits Taxes | 589 | 603 | 607 | 603 |
| Taxation Revenue — Ontario Portion of the Federal Cannabis Excise Duty | – | – | 19 | 70 |
| Taxation Revenue — Electricity Payments in Lieu of Taxes | 334 | 494 | 435 | 488 |
| Taxation Revenue — Other Taxes | 453 | 552 | 653 | 558 |
| Taxation Revenue — Total | 94,346 | 99,723 | 105,524 | 107,744 |
| Government of Canada — Canada Health Transfer | 13,910 | 14,359 | 14,852 | 15,646 |
| Government of Canada — Canada Social Transfer | 5,146 | 5,314 | 5,451 | 5,653 |
| Government of Canada — Equalization | 2,304 | 1,424 | 963 | – |
| Government of Canada — Infrastructure Programs | 732 | 1,065 | 605 | 1,043 |
| Government of Canada — Labour Market Programs | 965 | 969 | 1,015 | 1,036 |
| Government of Canada — Social Housing Agreement | 441 | 419 | 394 | 359 |
| Government of Canada — Other Federal Payments | 761 | 996 | 1,420 | 1,386 |
| Government of Canada — Direct Transfers to Broader Public-Sector Organizations | 285 | 314 | 390 | 330 |
| Government of Canada — Total | 24,544 | 24,860 | 25,090 | 25,453 |
| Income from Government Business Enterprises — Ontario Lottery and Gaming Corporation | 2,358 | 2,487 | 2,464 | 2,414 |
| Income from Government Business Enterprises — Liquor Control Board of Ontario | 2,349 | 2,207 | 2,276 | 2,339 |
| Income from Government Business Enterprises — Ontario Cannabis Store | – | (6) | (42) | 10 |
| Income from Government Business Enterprises — Ontario Power Generation Inc./Hydro One Ltd.1 | 860 | 1,464 | 772 | 1,058 |
| Income from Government Business Enterprises — Total | 5,567 | 6,152 | 5,470 | 5,821 |
| Other Non-Tax Revenue — Reimbursements | 988 | 1,000 | 998 | 981 |
| Other Non-Tax Revenue — Vehicle and Driver Registration Fees | 1,727 | 1,912 | 1,991 | 2,055 |
| Other Non-Tax Revenue — Electricity Debt Retirement Charge2 | 621 | 593 | 15 | – |
| Other Non-Tax Revenue — Power Supply Contract Recoveries | 838 | 185 | 173 | 125 |
| Other Non-Tax Revenue — Sales and Rentals3 | 1,999 | 2,450 | 1,477 | 1,592 |
| Other Non-Tax Revenue — Carbon Allowance Proceeds4 | – | 2,401 | 472 | – |
| Other Non-Tax Revenue — Other Fees and Licences | 974 | 1,029 | 1,088 | 1,080 |
| Other Non-Tax Revenue — Net Reduction of Power Purchase Contracts | 129 | 74 | 41 | 30 |
| Other Non-Tax Revenue — Royalties | 272 | 290 | 251 | 287 |
| Other Non-Tax Revenue — Fees, Donations and Other Revenues from Hospitals, School Boards and Colleges | 7,957 | 8,309 | 9,237 | 9,364 |
| Other Non-Tax Revenue — Miscellaneous Other Non-Tax Revenue | 772 | 1,616 | 1,873 | 1,230 |
| Other Non-Tax Revenue — Total | 16,277 | 19,859 | 17,616 | 16,744 |
| Total Revenue | 140,734 | 150,594 | 153,700 | 155,761 |
Table 3.9 footnotes:
[1] Includes income from Brampton Distribution Holdco Inc. for 2016–17 only from its interest in Hydro One Brampton Networks Inc. On February 28, 2017, the Province sold its entire interest in Hydro One Brampton Networks Inc. and it is no longer included as a Government Business Enterprise.
[2] The Debt Retirement Charge cost was removed from residential electricity users’ electricity bills as of January 1, 2016 and for all other consumers as of April 1, 2018. Residual revenues recorded afterwards due to higher than expected amounts received following the 2017–18 year-end, compared to the estimated accrual amounts in 2017–18.
[3] Higher Sales and Rentals revenues in 2016–17 and 2017–18 compared to 2018–19 and 2019–20 are mainly due to significant, non-recurring asset sale initiatives such as the sale of Hydro One shares.
[4] Declining Carbon Allowance Proceeds reflects the passing of the Cap and Trade Cancellation Act, 2018 on October 31, 2018.
Note: Numbers may not add due to rounding.
| Ministry Expense | Actual 2016–17 | Actual 2017–18 | Actual 2018–19 |
Current Outlook 2019–20 |
|---|---|---|---|---|
| Agriculture, Food and Rural Affairs (Base) | 1,020 | 892 | 970 | 841.2 |
| Agriculture, Food and Rural Affairs — Time-Limited Investments in Infrastructure | – | 102 | 96 | 38.5 |
| Agriculture, Food and Rural Affairs (Total) | 1,020 | 994 | 1,066 | 879.8 |
| Attorney General (Total) | 1,651 | 1,688 | 1,714 | 1,603.7 |
| Board of Internal Economy (Total) | 218 | 296 | 371 | 287.5 |
| Children, Community and Social Services (Total) | 15,679 | 16,315 | 16,862 | 17,223.1 |
| Colleges and Universities3 (Base) | 8,997 | 9,369 | 9,822 | 9,996.9 |
| Colleges and Universities — Student Financial Assistance | 1,048 | 1,663 | 2,043 | 1,372.2 |
| Colleges and Universities — Time-Limited Infrastructure Funding under the Strategic Investment Fund | 200 | 209 | 119 | – |
| Colleges and Universities4 (Total) | 10,245 | 11,241 | 11,984 | 11,369.1 |
| Economic Development, Job Creation and Trade (Total) | 1,016 | 987 | 922 | 773.3 |
| Education (Base) | 26,551 | 27,260 | 28,747 | 29,969.5 |
| Education — Teachers’ Pension Plan5 | 987 | 1,659 | 1,678 | 1,732.0 |
| Education (Total) | 27,538 | 28,919 | 30,425 | 31,701.5 |
| Energy, Northern Development and Mines (Base) | 1,291 | 1,407 | 1,479 | 1,165.8 |
| Energy, Northern Development and Mines — Electricity Cost Relief Programs | 426 | 2,834 | 4,242 | 4,012.7 |
| Energy, Northern Development and Mines (Total) | 1,717 | 4,242 | 5,721 | 5,178.5 |
| Environment, Conservation and Parks (Base) | 620 | 699 | 459 | 606.2 |
| Environment, Conservation and Parks — Time-Limited Investments | – | 145 | 223 | – |
| Environment, Conservation and Parks (Total) | 620 | 844 | 682 | 606.2 |
| Executive Offices (Total) | 37 | 41 | 38 | 37.5 |
| Finance (Base) | 829 | 844 | 954 | 819.5 |
| Finance — Ontario Municipal Partnership Fund | 505 | 506 | 510 | 505.0 |
| Finance — Power Supply Contract Costs | 838 | 191 | 173 | 125.1 |
| Finance (Total) | 2,172 | 1,541 | 1,637 | 1,449.6 |
| Francophone Affairs (Total) | 5 | 6 | 6 | 5.8 |
| Government and Consumer Services (Total) | 1,669 | 1,771 | 1,757 | 1,687.2 |
| Health and Long-Term Care6 (Total) | 56,211 | 59,138 | 61,904 | 63,830.8 |
| Heritage, Sport, Tourism and Culture Industries7 (Base) | 1,463 | 1,589 | 1,562 | 1,511.5 |
| Heritage, Sport, Tourism and Culture Industries — Time-Limited Funding: Ontario 150 and Pan/Parapan American Games | 96 | 6 | – | – |
| Heritage, Sport, Tourism and Culture Industries8 (Total) | 1,559 | 1,595 | 1,562 | 1,511.5 |
| Indigenous Affairs (Base) | 85 | 86 | 75 | 72.2 |
| Indigenous Affairs — One-Time Investments including Settlements9 | 40 | 1,122 | 215 | – |
| Indigenous Affairs (Total) | 125 | 1,208 | 290 | 72.2 |
| Infrastructure (Base) | 165 | 228 | 162 | 415.8 |
| Infrastructure — Federal–Provincial Infrastructure Programs | 8 | 248 | 352 | 133.7 |
| Infrastructure (Total) | 172 | 476 | 513 | 549.5 |
| Labour, Training, and Skills Development10 (Total) | 292 | 302 | 307 | 292.9 |
| Municipal Affairs and Housing (Base) | 974 | 1,034 | 843 | 840.5 |
| Municipal Affairs and Housing — Time-Limited Investments | 565 | 334 | 636 | 270.9 |
| Municipal Affairs and Housing (Total) | 1,539 | 1,368 | 1,479 | 1,111.5 |
| Natural Resources and Forestry (Base) | 535 | 606 | 508 | 568.8 |
| Natural Resources and Forestry — Emergency Forest Firefighting | 107 | 117 | 208 | 129.8 |
| Natural Resources and Forestry (Total) | 642 | 723 | 716 | 698.6 |
| Seniors and Accessibility (Total) | 37 | 48 | 52 | 50.8 |
| Solicitor General (Total) | 2,448 | 2,549 | 2,681 | 2,644.7 |
| Transportation (Base) | 3,592 | 4,054 | 4,420 | 4,487.5 |
| Transportation — Federal–Provincial Infrastructure Programs | – | 404 | 297 | 638.5 |
| Transportation (Total) | 3,592 | 4,458 | 4,718 | 5,126.0 |
| Treasury Board Secretariat (Base) | 172 | 172 | 182 | 287.5 |
| Treasury Board Secretariat — Employee and Pensioner Benefits11 | 1,082 | 1,442 | 1,165 | 1,352.0 |
| Treasury Board Secretariat — Operating Contingency Fund | – | – | – | 224.1 |
| Treasury Board Secretariat — Capital Contingency Fund | – | – | – | 325.0 |
| Treasury Board Secretariat (Total) | 1,254 | 1,614 | 1,346 | 2,188.6 |
| Interest on Debt12 | 11,709 | 11,903 | 12,384 | 12,905.0 |
| Year-End Savings | – | – | – | – |
| Total Expense | 143,169 | 154,266 | 161,135 | 163,784.8 |
Table 3.10 footnotes:
[1], [3], [4], [7], [8], [10] On October 21, 2019 the government announced that the Ministry of Labour would become the Ministry of Labour, Training and Skills Development; the Ministry of Training, Colleges and Universities would become the Ministry of Colleges and Universities; and the Ministry of Tourism, Culture and Sport would become the Ministry of Heritage, Sport, Tourism and Culture Industries. Changes to names of these ministries are reflected in the 2019 Ontario Economic Outlook and Fiscal Review; any resulting changes to ministry expense will be reflected in future updates.
[2] Ministry expenses have been reclassified to aggregate all expenses incurred related to the Government Real Estate Portfolio (GREP) under the Ministry of Government and Consumer Services and projects supported through Infrastructure Ontario under the Ministry of Infrastructure, which hold responsibility for the activities of these two government entities. The actual results are presented on similar basis for consistency.
[5], [11] Numbers reflect the pension expense that was calculated based on recommendations of the Independent Financial Commission of Inquiry, as described in Note 19 to the Consolidated Financial Statements in Public Accounts of Ontario 2017–2018.
[6] On June 20, 2019 the government announced that the Ministry of Health and Long-Term Care would become the Ministry of Health and the Ministry of Long-Term Care. Future updates will report the two ministries separately.
[9] Numbers reflect the payment or liability related to one-time investments for land claim settlements and other items. The amounts fluctuate based on the land claims negotiated in each year.
[12] Interest on debt is net of interest capitalized during construction of tangible capital assets of $159 million in 2016–17, $157 million in 2017–18, $175 million in 2018–19 and $475 million in 2019–20.
Note: Numbers may not add due to rounding.
| Sector | Total Infrastructure Expenditures 2018–19 Actual1 |
2019–20 Current Outlook Investment in Capital Assets2 |
2019–20 Current Outlook Transfers and Other Infrastructure Expenditures3 |
2019–20 Current Outlook Total Infrastructure Expenditures |
|---|---|---|---|---|
| Transportation — Transit | 4,706 | 4,294 | 1,234 | 5,527 |
| Transportation — Provincial Highways | 2,320 | 2,577 | 160 | 2,737 |
| Transportation — Other Transportation, Property and Planning | 254 | 189 | 96 | 284 |
| Health — Hospitals | 2,782 | 2,354 | 3 | 2,357 |
| Health — Other Health | 200 | 78 | 158 | 237 |
| Education | 2,509 | 2,416 | 10 | 2,426 |
| Postsecondary — Colleges and Other | 800 | 297 | 2 | 299 |
| Postsecondary — Universities | 242 | – | 52 | 52 |
| Social | 429 | 25 | 272 | 297 |
| Justice | 259 | 487 | 130 | 617 |
| Other Sectors4 | 1,368 | 850 | 939 | 1789 |
| Total Infrastructure Expenditures | 15,870 | 13,566 | 3,056 | 16,623 |
| Less: Other Partner Funding5 | 2,499 | 1,891 | – | 1,891 |
| Total6 | 13,371 | 11,675 | 3,056 | 14,732 |
Table 3.11 footnotes:
[1] Includes Provincial investment in capital assets of $13 billion.
[2] Includes $475 million in interest capitalized during construction.
[3] Includes transfers to municipalities, universities and non-consolidated agencies.
[4] Includes government administration, natural resources, and the culture and tourism industries.
[5] Other Partner Funding refers to third-party investments primarily in hospitals, colleges and schools.
[6] Includes Federal/Municipal contributions to provincial infrastructure investments.
Note: Numbers may not add due to rounding.
| 2010–11 | 2011–12 | 2012–13 | 2013–14 | 2014–15 | 2015–16 | 2016–17 | 2017–18 | Actual 2018–19 |
Current Outlook 2019–20 |
|
|---|---|---|---|---|---|---|---|---|---|---|
| Revenue | 113,594 | 116,401 | 120,319 | 122,955 | 126,152 | 136,148 | 140,734 | 150,594 | 153,700 | 155,761 |
| Expense — Programs | 120,843 | 121,222 | 120,103 | 123,330 | 126,199 | 129,905 | 131,460 | 142,363 | 148,751 | 150,880 |
| Expense — Interest on Debt3 | 10,005 | 10,587 | 10,878 | 11,155 | 11,221 | 11,589 | 11,709 | 11,903 | 12,384 | 12,905 |
| Total Expense | 130,848 | 131,809 | 130,981 | 134,485 | 137,420 | 141,494 | 143,169 | 154,266 | 161,135 | 163,785 |
| Reserve | – | – | – | – | – | – | – | – | – | 1,000 |
| Surplus/(Deficit) | (17,254) | (15,408) | (10,662) | (11,530) | (11,268) | (5,346) | (2,435) | (3,672) | (7,435) | (9,024) |
| Net Debt | 217,754 | 241,912 | 259,947 | 276,169 | 294,557 | 306,357 | 314,077 | 323,834 | 338,496 | 353,743 |
| Accumulated Deficit | 147,816 | 164,092 | 174,256 | 184,835 | 196,665 | 203,014 | 205,939 | 209,023 | 216,642 | 224,666 |
| Gross Domestic Product (GDP) at Market Prices | 630,983 | 659,740 | 680,086 | 695,352 | 726,053 | 759,440 | 792,932 | 825,805 | 854,742 | 883,663 |
| Primary Household Income | 424,251 | 444,076 | 459,111 | 472,921 | 489,436 | 511,577 | 519,413 | 544,062 | 570,072 | 592,882 |
| Population — July (000s)4 | 13,136 | 13,261 | 13,391 | 13,511 | 13,618 | 13,707 | 13,875 | 14,073 | 14,319 | 14,567 |
| Net Debt per Capita (dollars) | 16,577 | 18,242 | 19,413 | 20,441 | 21,631 | 22,350 | 22,636 | 23,012 | 23,640 | 24,285 |
| Household Income per Capita (dollars) | 32,297 | 33,486 | 34,286 | 35,003 | 35,942 | 37,322 | 37,434 | 38,661 | 39,814 | 40,702 |
| Interest on Debt as a Per Cent of Revenue | 8.8% | 9.1% | 9.0% | 9.1% | 8.9% | 8.5% | 8.3% | 7.9% | 8.1% | 8.3% |
| Net Debt as a Per Cent of GDP | 34.5% | 36.7% | 38.2% | 39.7% | 40.6% | 40.3% | 39.6% | 39.2% | 39.6% | 40.0% |
| Accumulated Deficit as a Per Cent of GDP | 23.4% | 24.9% | 25.6% | 26.6% | 27.1% | 26.7% | 26.0% | 25.3% | 25.3% | 25.4% |
Table 3.12 footnotes:
[1] Amounts reflect a change in pension expense that was calculated based on recommendations of the Independent Financial Commission of Inquiry, as described in Note 19 to the Consolidated Financial Statements, in Public Accounts of Ontario 2017–2018. Amounts for net debt and accumulated deficit also reflect this change.
[2] Revenues and expenses have been restated to reflect the following fiscally neutral changes: i) revised presentation of education property taxes to be included in the taxation revenues; ii) reclassification of certain Government Business Enterprises to other government organizations; iii) reclassification of a number of tax measures that provide a financial benefit through the tax system to be reported as expenses; and iv) change in presentation of third-party revenue for hospitals, school boards and colleges to be reported as revenue.
[3] Interest on debt is net of interest capitalized during construction of tangible capital assets of $165 million in 2015–16, $159 million in 2016–17, $157 million in 2017–18, $175 million in 2018–19 and $475 million in 2019–20.
[4] Population figures are for July 1 of the fiscal year indicated (i.e., for 2010–11, the population on July 1, 2010 is shown).
Note: Numbers may not add due to rounding.
Sources: Statistics Canada, Ontario Ministry of Finance and Treasury Board Secretariat.
Chart Descriptions
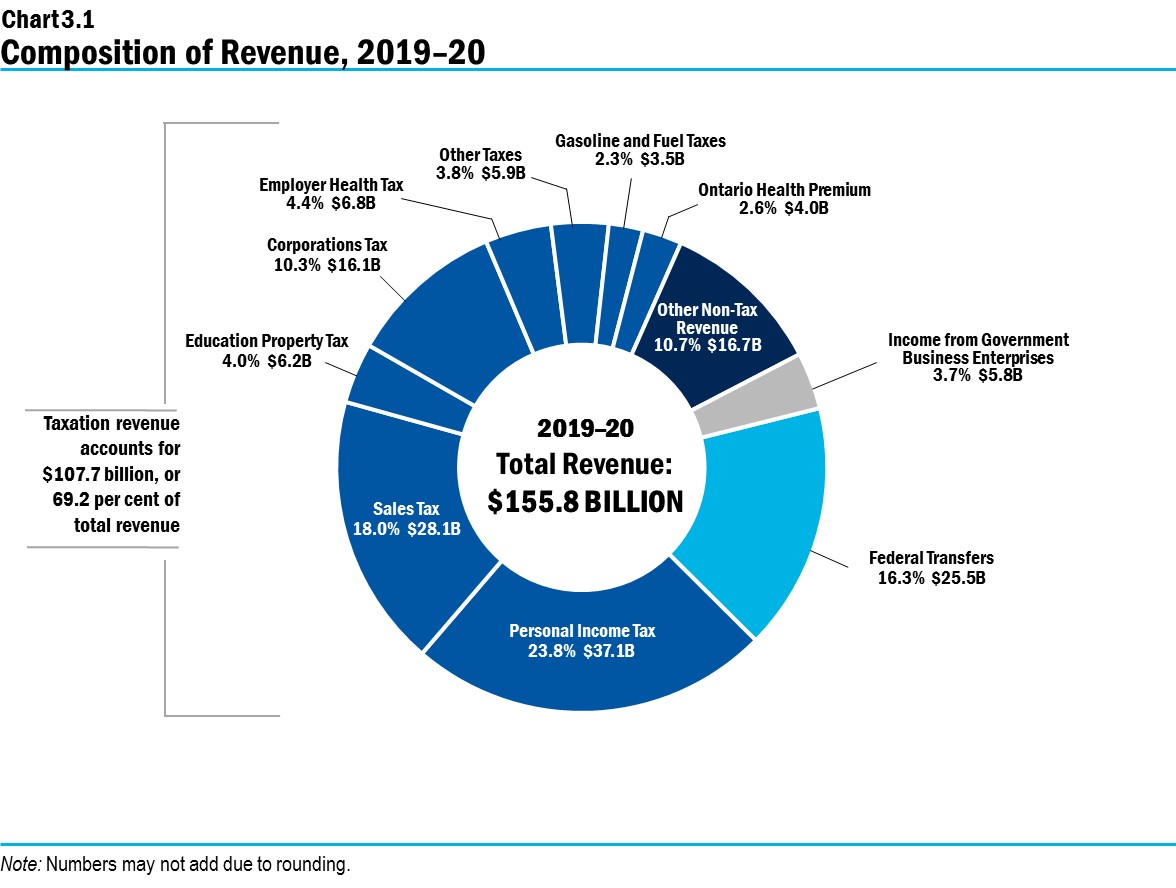
Chart 3.1: Composition of Revenue, 2019–20
This pie chart shows the composition of Ontario’s revenue in 2019–20, which totals $155.8 billion. The largest taxation revenue source is Personal Income Tax revenue at $37.1 billion, accounting for 23.8 per cent of total revenue. This is followed by Sales Tax at $28.1 billion, or 18.0 per cent of total revenue; and Corporations Tax at $16.1 billion, or 10.3 per cent of total revenue. Other components of taxation revenue include Education Property Tax at $6.2 billion, or 4.0 per cent of total revenue; Employer Health Tax at $6.8 billion, or 4.4 per cent; Gasoline and Fuel Taxes at $3.5 billion, or 2.3 per cent; the Ontario Health Premium at $4.0 billion, or 2.6 per cent; and Other Taxes at $5.9 billion, or 3.8 per cent of total revenue.
Total taxation revenue accounts for $107.7 billion, or 69.2 per cent of total revenue.
The other major non-taxation sources of revenue are Federal Transfers of $25.5 billion, or 16.3 per cent of total revenue; Income from Government Business Enterprises at $5.8 billion, or 3.7 per cent of total revenue; and various Other Non-Tax Revenue at $16.7 billion, or 10.7 per cent of total revenue.
Note: Numbers may not add due to rounding.
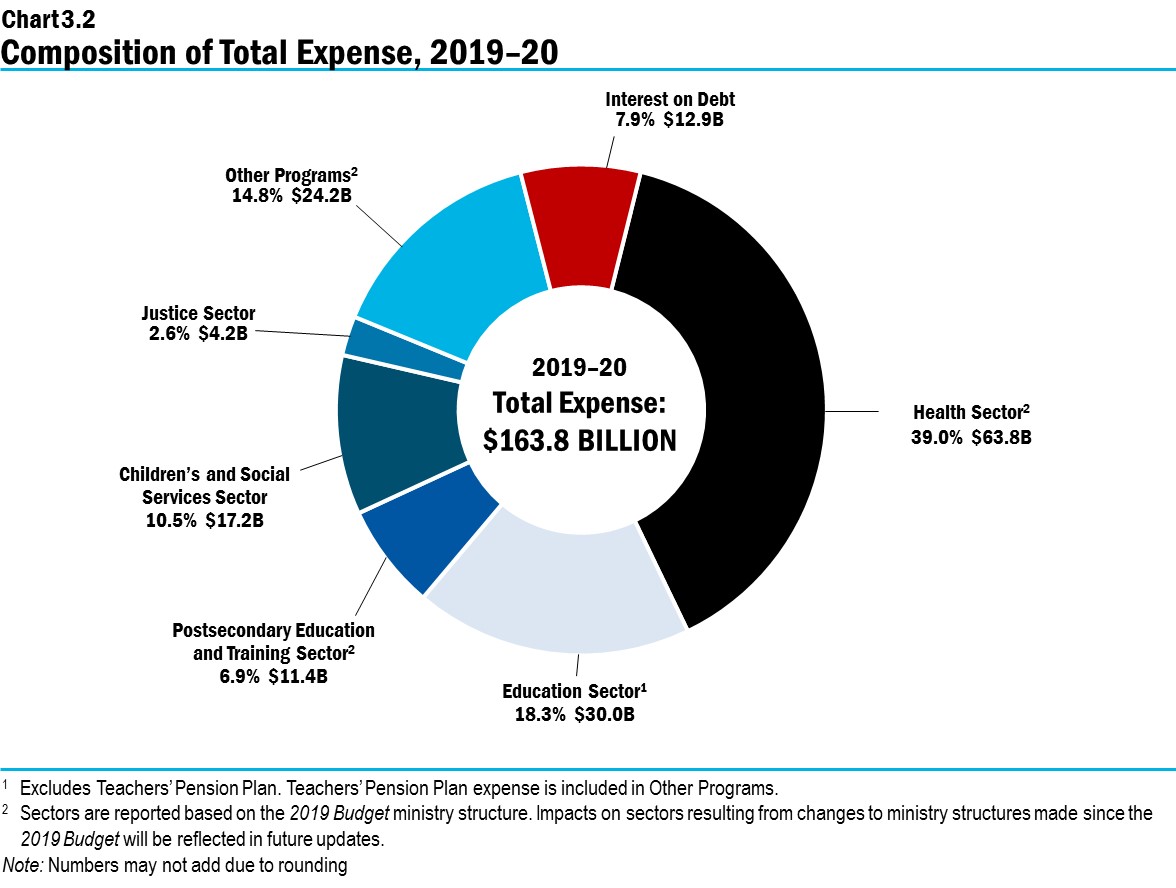
Chart 3.2: Composition of Total Expense, 2019–20
This pie chart shows the share of Ontario’s total expense and dollar amounts by sector in 2019–20.
Total expense in 2019–20 is $163.8 billion.
The largest expense is the Health Sector at $63.8 billion, accounting for 39.0 per cent of total expense.
The remaining sectors of total expense include the Education Sector at $30.0 billion or 18.3 per cent; the Postsecondary Education and Training Sector at $11.4 billion or 6.9 per cent; the Children’s and Social Services Sector at $17.2 billion or 10.5 per cent; the Justice Sector at $4.2 billion or 2.6 per cent; and Other Programs at $24.2 billion or 14.8 per cent. Interest on Debt, included as part of Total Expense, is $12.9 billion or 7.9 per cent.
Note that the Education Sector excludes the Teachers’ Pension Plan. Teachers’ Pension Plan expense is included in Other Programs.
Note that sectors are reported based on the 2019 Budget ministry structure. Impacts on sectors resulting from changes to ministry structures made since the 2019 Budget will be reflected in future updates.
Note: Numbers may not add due to rounding.