Introduction
Before the outbreak of the novel coronavirus (COVID‑19), Ontario’s economy was growing at a moderate pace. Supported by the province’s strong economic fundamentals and the government’s actions to lower business costs, reduce regulatory burdens and advance workforce skills, Ontario’s real gross domestic product (GDP) increased by an estimated 1.6 per cent in 2019. This occurred despite a challenging external economic environment with widespread weakening growth around the globe and significant disruptions to international trade.
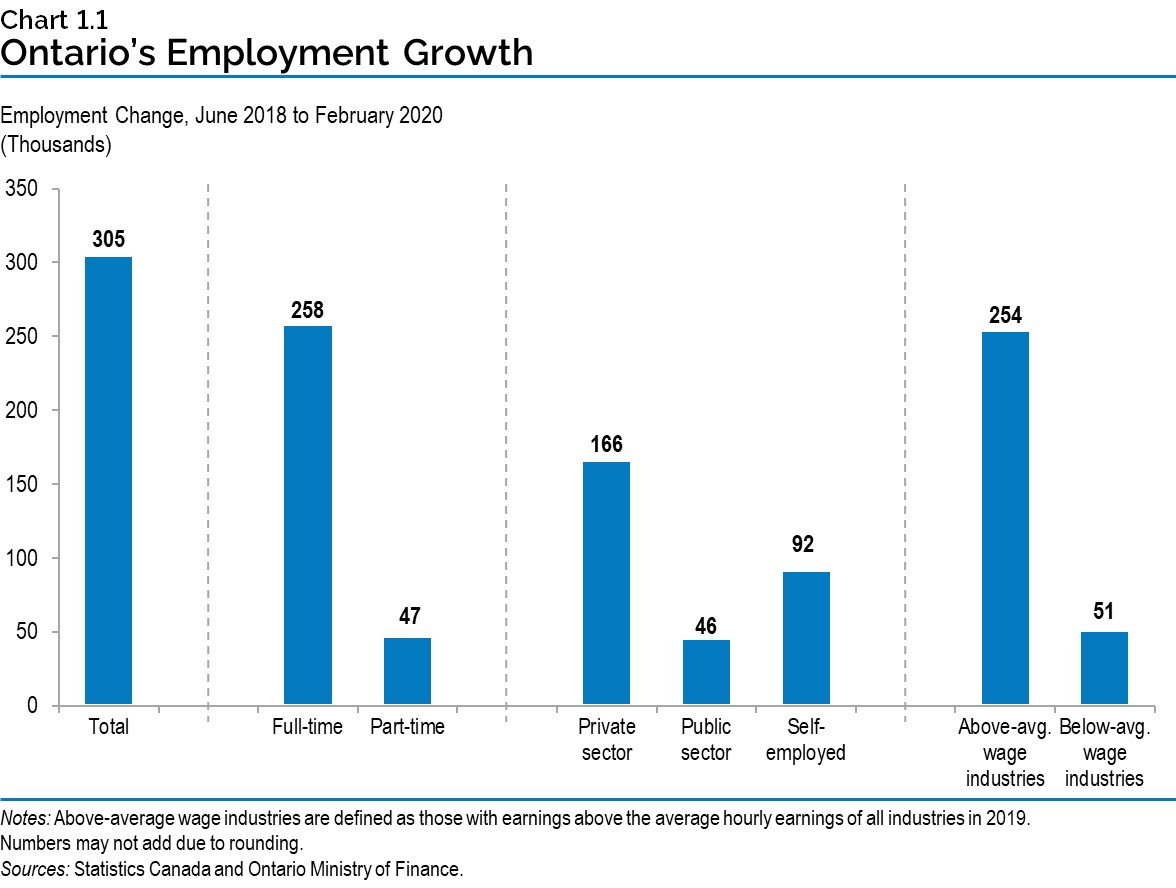
Job creation was robust in 2019, with Ontario adding 210,200 (+2.9 per cent) net new jobs, the strongest pace of growth since 2003. The unemployment rate held steady at 5.6 per cent, matching the 2018 rate, the lowest since the late 1980s. More than 300,000 net new jobs were created since June 2018, with the majority of these in the private sector, full time and in industries paying above average wages.
The outbreak and global spread of COVID‑19 has negatively impacted the global economy, disrupted financial markets and significantly increased near-term economic uncertainty. Although it is clear that Ontario has and will continue to be impacted, the extent of the full impact on the province remains uncertain.
In response to COVID‑19, coordinated action by governments and central banks around the globe are supporting people, families, businesses and the economy. G7 Finance Ministers are closely monitoring the impacts of the spread of COVID‑19 and stand ready to cooperate further on timely and effective measures. The Province continues to work closely with the Government of Canada to coordinate its response to the outbreak.
Recent updates by private-sector forecasters have included much slower rates of growth than projected just a few weeks ago. Furthermore, private-sector forecasters point to the elevated uncertainty and risks related to the COVID‑19 outbreak and recognize the importance of coordinated government action to support the economy. For planning purposes, the Ontario Ministry of Finance is assuming Ontario’s real GDP to remain unchanged on an annual basis in 2020 and advance by 2.0 per cent in 2021. This outlook, which is subject to a greater-than-usual uncertainty, assumes economic growth begins to improve in the second half of 2020 and into 2021.
Recent Economic Performance
While Ontario’s economy has been affected by the recent global slowdown related to the COVID‑19 outbreak, strong economic fundamentals and government policies helped support economic growth in the province in 2019. Ontario’s real GDP advanced by 0.6 per cent in the third quarter of 2019, following a 0.8 per cent gain in the second quarter. Real GDP is estimated to have increased by 1.6 per cent in 2019, higher than the 1.4 per cent forecasted at the time of the 2019 Budget.
The province added 210,200 net new jobs (+2.9 per cent) in 2019, the strongest percentage increase since 2003, outpacing national employment growth and every other province. With the labour force growing in line with employment, Ontario’s unemployment rate held steady at 5.6 per cent in 2019, matching the 2018 rate, the lowest annual rate since the late 1980s.
Since June 2018, Ontario has added more than 300,000 net new jobs, while the unemployment rate declined. Employment gains since June 2018 have mostly been full time, in the private sector and in industries paying above-average wages.
Solid job creation and wage growth have contributed to the 5.5 per cent increase in household disposable income since mid-2018. Also contributing to rising disposable income are actions taken by the government that will provide relief for families and individuals totalling $3.1 billion in 2020. This includes measures such as cancelling the cap-and-trade carbon tax, providing tax relief for low income workers, reducing college and university tuition and undoing scheduled tax and fee increases.
Global Economic Developments
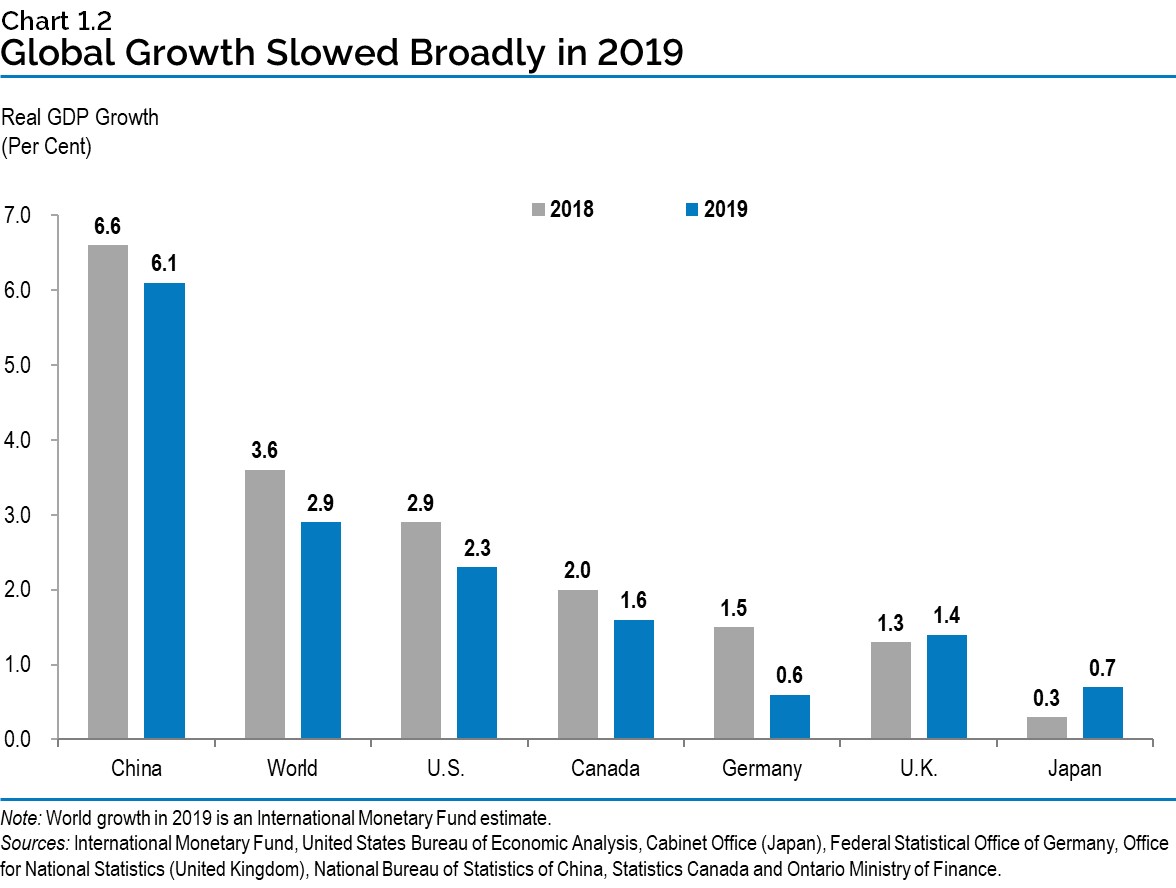
Global economic growth weakened in 2019 with real GDP growth slowing to 2.9 per cent from 3.6 per cent in 2018. Trade disruptions and geopolitical uncertainty weighed on trade flows, especially for manufactured goods. The imposition of U.S. and Chinese tariffs disrupted supply chains, which has contributed to a marked slowdown in global export growth.
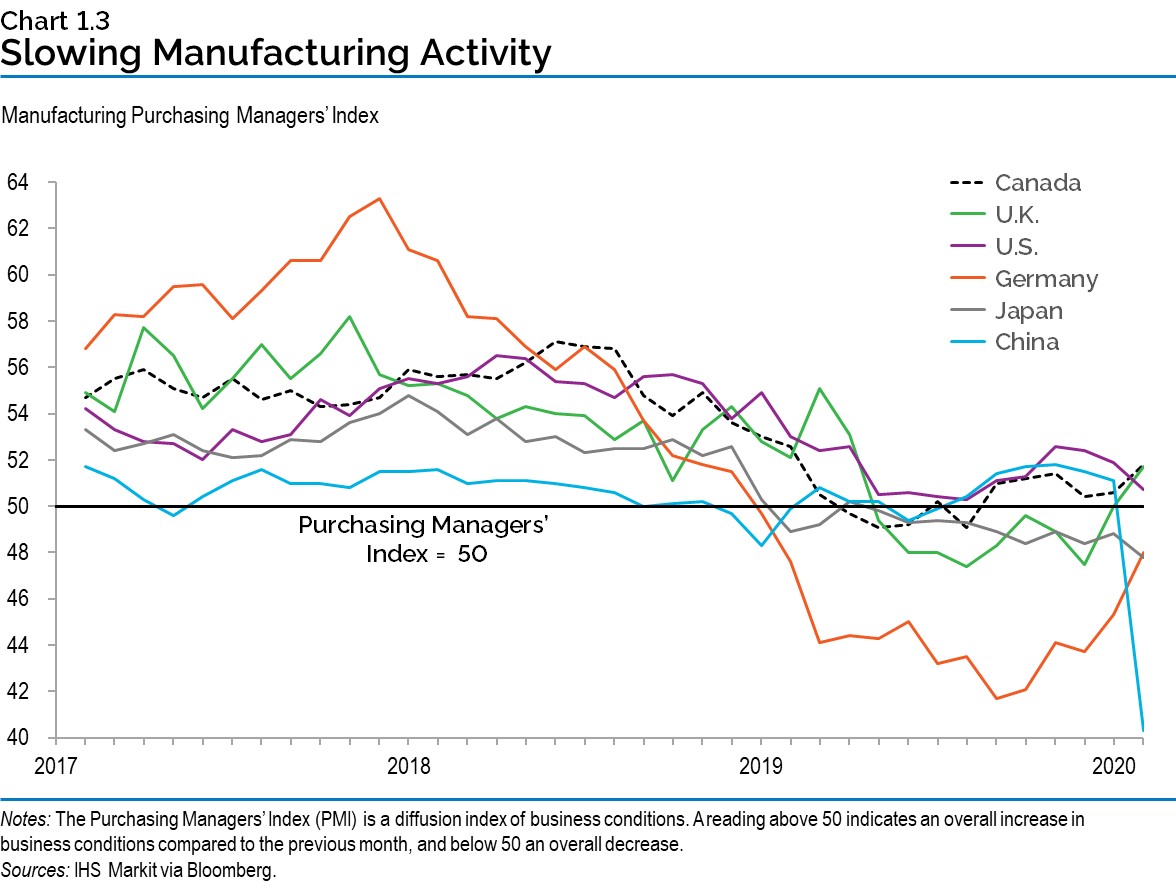
Supply chain and trade impacts had broad effects on global manufacturing. Since the COVID‑19 outbreak, disruptions in production and supply chains, along with increased uncertainty, further intensified the downward trend in manufacturing, as indicated by China’s manufacturing activity in February 2020.
The COVID‑19 Outbreak
The outbreak of COVID‑19 was first reported in late 2019 in Wuhan, the capital of China’s Hubei province. On January 30, 2020, the World Health Organization (WHO) declared a global emergency and then on March 11, 2020, a global pandemic. In addition to the human impact of the virus, the global economy has weakened, and uncertainty has increased while financial market volatility has risen significantly.
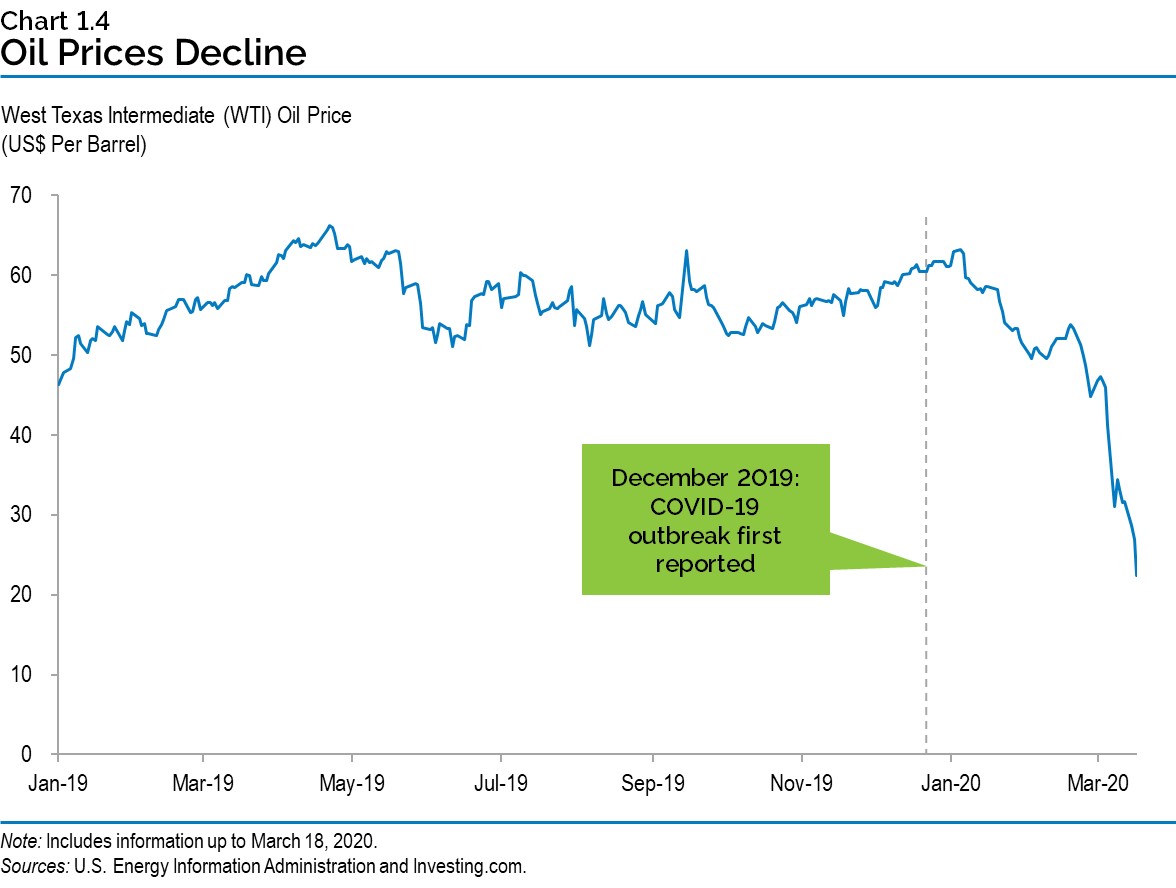
The decline in economic activity has resulted in weakening demand for oil. In March, Organization of Petroleum Exporting Countries (OPEC) and other oil producing countries were unable to agree to production cuts and Saudi Arabia ramped up production. The combination of weakening demand and increased supply led West Texas Intermediate (WTI) oil prices to decline steadily between mid-February and mid-March. The price of Western Canadian Select oil has also declined sharply to historic lows. This is having a significant impact on the Canadian economy, especially for oil producing provinces such as Alberta, Saskatchewan and Newfoundland and Labrador. There is a high degree of uncertainty around the outlook for oil demand, supply and prices in the current environment.
Financial Market Volatility
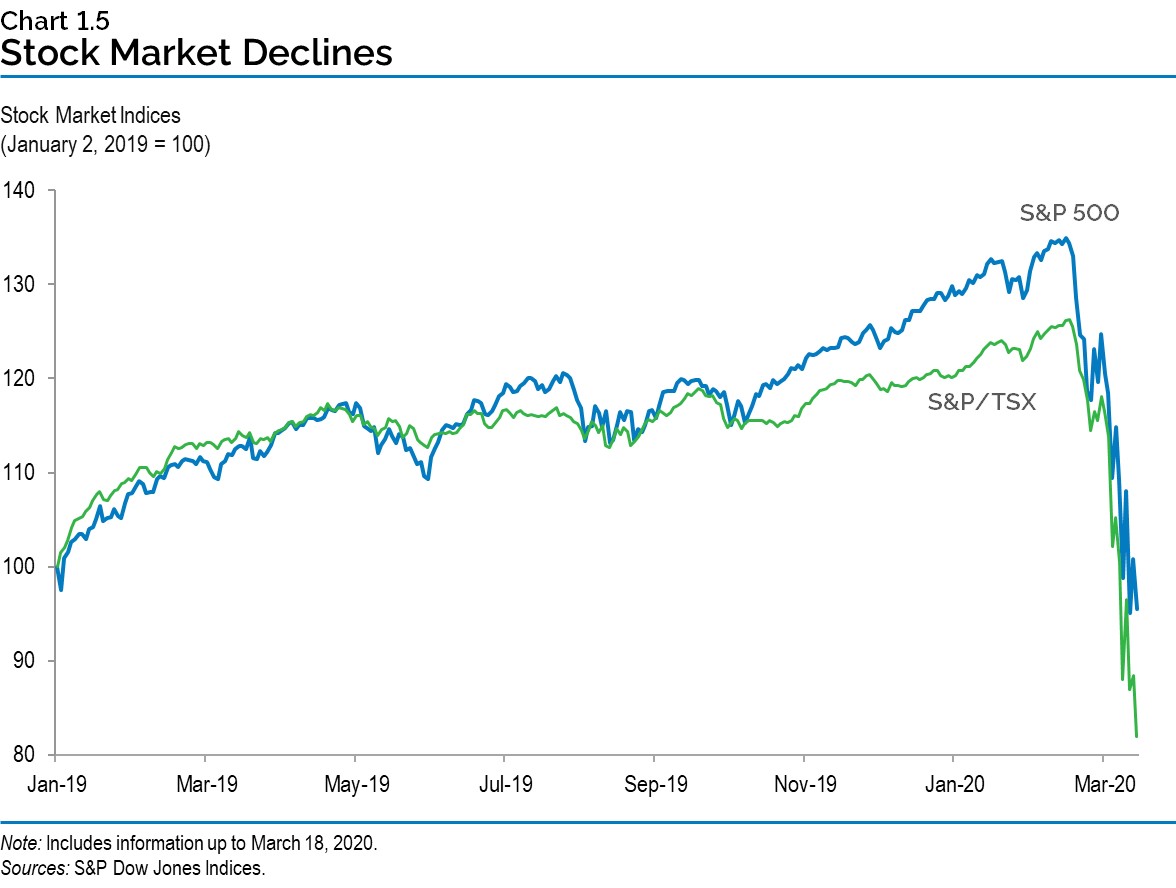
Major stock indices have declined significantly as COVID‑19 continues to spread globally and impact earnings expectations across a wide range of economic sectors. Both the S&P 500 and the Canadian S&P/TSX indices have declined markedly since late February. While the energy and financial sectors have been particularly hard hit, all market sectors have seen large declines. The Chicago Board Options Exchange (CBOE) Volatility Index (VIX), a key indicator of stock market volatility, reached its highest level since 2008 in March.
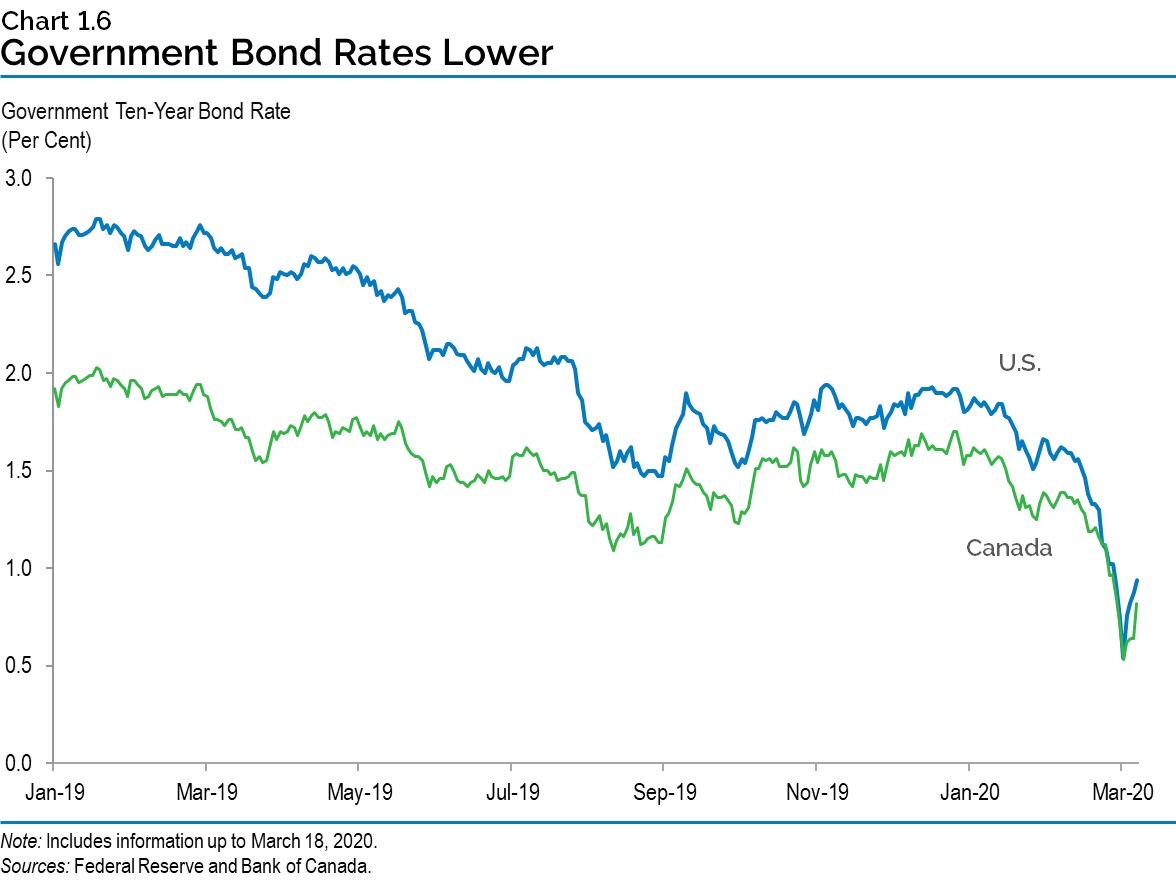
Concerns over the impact of COVID‑19 on the global economy and the sharp decline in equity values have increased investor demand for relatively safer government bonds, pushing yields lower. Since the beginning of February, both the ten-year U.S. and Canadian government bond rates have declined, reaching record lows in mid-March.
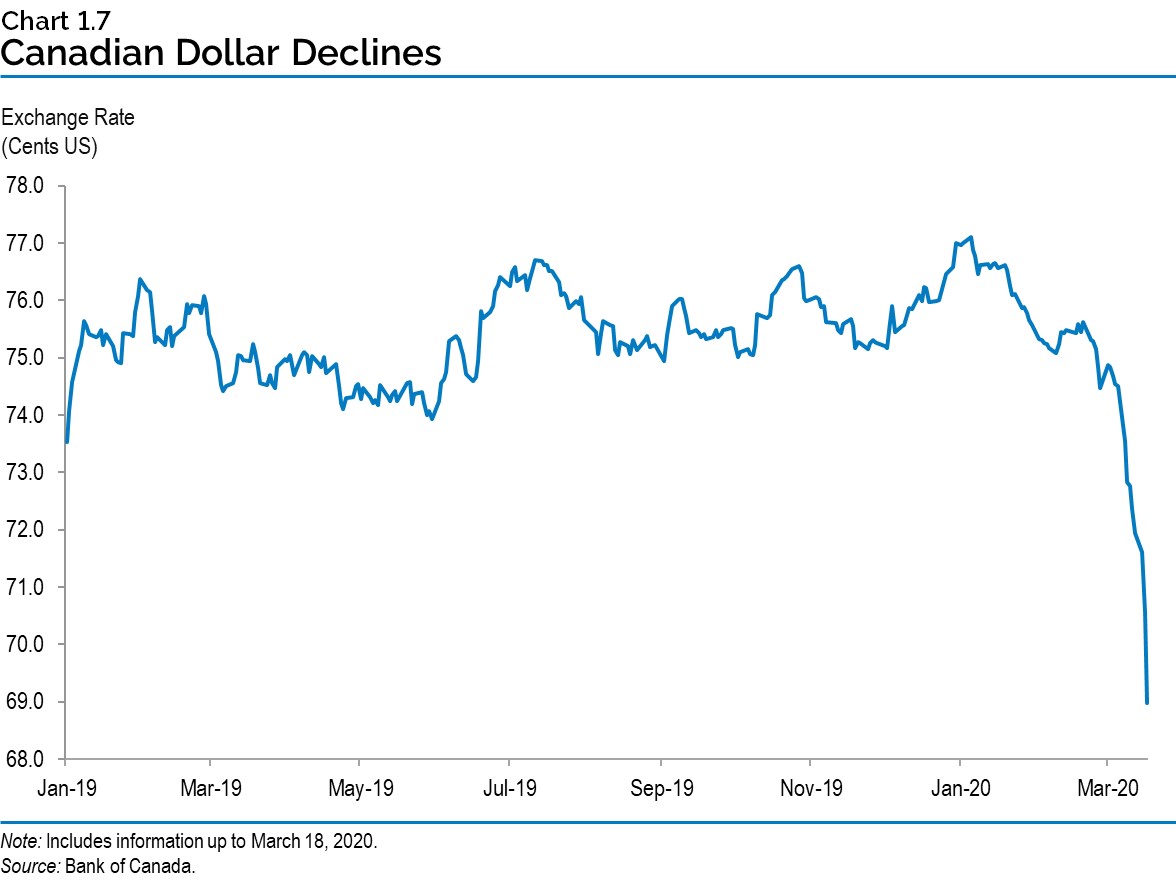
Foreign exchange markets have also been affected by the heightened global economic uncertainty and financial market developments. Demand has strengthened for the U.S. dollar. Since the onset of COVID‑19 in North America, the Canadian dollar has declined compared to the U.S. dollar, after trending close to 75 cents US for most of last year.
Central Bank and Government Actions
Governments in all regions have announced billions of dollars in a broad array of measures intended to support both businesses and households impacted by the COVID‑19 outbreak. G7 Finance Ministers and Central Bankers are closely monitoring the impacts of the spread of COVID‑19 and stand ready to cooperate further on timely and effective measures.
| Monetary Policy Support | Increased Liquidity and Lending | Business Support | Household Support | Health Care Spending | |
|---|---|---|---|---|---|
| Canada | ✔ | ✔ | ✔ | ✔ | ✔ |
| Australia | ✔ | ✔ | ✔ | ✔ | ✔ |
| China | ✔ | ✔ | ✔ | ✔ | ✔ |
| Germany | ✔ | ✔ | ✔ | ✔ | ✔ |
| Italy | ✔ | ✔ | ✔ | ✔ | ✔ |
| Japan | ✔ | ✔ | ✔ | ✔ | ✔ |
| South Korea | ✔ | ✔ | ✔ | ✔ | ✔ |
| United Kingdom | ✔ | ✔ | ✔ | ✔ | ✔ |
| United States | ✔ | ✔ | ✔ | ✔ | ✔ |
Sources: Reuters and government and central bank statements.
In March 2020, the U.S. Federal Reserve reduced key policy rates by 1.50 percentage points to near zero and has stated that it is prepared to use a full range of tools to support households and businesses. As part of this, the Federal Reserve launched a $700 billion quantitative easing program including purchasing U.S. Treasuries and mortgage-backed securities.
The Bank of Canada has reduced policy interest rates by a full percentage point. In addition to reductions in policy interest rates, the Bank of Canada has announced, among other policy measures, funding support for small- and medium-size businesses. The Government of Canada in cooperation with federal financial Crown corporations, the Bank of Canada, the Office of the Superintendent of Financial Institutions and commercial lenders are providing over $500 billion in credit and liquidity support for individuals and businesses.
The Canadian government announced on March 11, 2020 a plan to respond to the COVID‑19 outbreak by establishing a more than $1 billion COVID‑19 Response Fund. This plan includes investments to limit the spread of the virus in Canada and prepare for its possible broader economic impact on people and businesses.
On March 13, 2020 the Canadian government announced additional support to businesses by establishing a Business Credit Availability Program. This program will allow the Business Development Bank of Canada and Export Development Canada (EDC) to provide more than $10 billion of additional support to businesses.
The federal government announced further measures on March 18, 2020, bringing the total to $82.4 billion. This includes $55 billion in deferred individual and corporate tax payments. Additionally, the Government of Canada’s COVID‑19 Economic Response Plan will provide up to $27 billion in direct support to Canadian workers and businesses through measures such as temporary income support for workers affected by the outbreak, wage subsidies for eligible small business employers and one-time special payments through the Goods and Services Tax credit and the Canada Child Benefit.
To address COVID‑19, the Ontario government is also providing a timely and robust response package building on the measures announced by the federal government as part of a coordinated response. The Ontario government will continue to take further actions as required and is committed to coordinating with all levels of government to ensure the response is timely and effective.
Economic Planning Assumptions
The current global economic environment remains highly uncertain. The COVID‑19 outbreak has had a negative impact on the global, Canadian and Ontario economies. The severity of the economic impact will depend on how widespread the outbreak becomes and how long it lasts. In coordination with other governments, the Province has taken swift measures to protect public health and to support individuals and businesses.
The COVID‑19 outbreak has significantly impacted the near-term economic growth outlook and forecasts have been trending down. The Ontario Ministry of Finance is assuming Ontario’s real GDP to remain unchanged on an annual basis in 2020 and advance by 2.0 per cent in 2021. This outlook, which is subject to greater-than-usual uncertainty, assumes economic growth improves in the second half of 2020 and into 2021.
Following solid gains in 2019, employment growth is expected to slow and average 0.5 per cent in 2020, while the unemployment rate is expected to increase by one percentage point to an annual average of 6.6 per cent. Wage growth is also expected to moderate, with growth in compensation to employees decreasing from 4.1 per cent in 2019 to 2.7 per cent in 2020. Slowing employment income along with recent measures to encourage consumers to stay at home is expected to weaken household consumption growth from 3.6 per cent in 2019 to 2.4 per cent in 2020. Corporate profits are expected to decline 2.4 per cent this year, with larger declines in industries most likely to be impacted by the spread of COVID‑19.
With COVID‑19 disruptions eventually dissipating, and its impacts eased by strong coordinated government support, growth is expected to improve in the second half of 2020 and lift consumer, business and investor confidence heading into 2021. Pent up demand for goods and services along with an improving labour market would add momentum, supporting stronger consumer spending. Low borrowing costs and continued population growth will support the housing market, with home resales expected to grow in 2021. However, some sectors will take longer to recover, potentially limiting the extent of the rebound in GDP growth in the near term.
Risks
Ontario’s economy continues to face a number of risks, largely related to the COVID‑19 outbreak. Ontario’s strong economic fundamentals and the coordinated government response to COVID‑19 will provide support during this challenging time. In this highly uncertain environment, it is very difficult to accurately predict the performance of the global, national or provincial economy.
Sharp slowdowns in economic activity are typically followed by strong recoveries as confidence improves, disrupted activity resumes and deferred investments and consumer spending occur. Once the impact of COVID‑19 dissipates, it is likely that economies will see a period of relatively strong growth.
There will also be risks for longer term economic growth in addition to existing challenges such as the slowing growth of the working-age population. For example, elevated debt levels combined with reductions in wealth may keep spending below long-term trends.
Summary of Key Economic Indicators
Table 1.2 provides details of the economy’s recent performance and the Ontario Ministry of Finance’s economic planning assumptions for the 2020 to 2021 period. This is compared to those in the 2019 Ontario Economic Outlook and Fiscal Review and the 2019 Budget.
| 2018 | 2019e | 2020p | 2021p | |
|---|---|---|---|---|
| March 2020 Economic and Fiscal Update — Real Gross Domestic Product | 2.2 | 1.6 | 0.0 | 2.0 |
| March 2020 Economic and Fiscal Update — Nominal Gross Domestic Product | 3.7 | 3.9 | 2.0 | 4.0 |
| March 2020 Economic and Fiscal Update — Employment1 | 1.6 | 2.9 | 0.5 | 1.0 |
| March 2020 Economic and Fiscal Update — Unemployment Rate2 (Per Cent) | 5.6 | 5.6 | 6.6 | 6.6 |
| March 2020 Economic and Fiscal Update — Compensation of Employees | 5.5 | 4.1 | 2.7 | 4.3 |
| March 2020 Economic and Fiscal Update — Net Operating Surplus — Corporations | (0.9) | 2.7 | (2.4) | 8.3 |
| March 2020 Economic and Fiscal Update — Nominal Household Consumption | 4.4 | 3.6 | 2.4 | 4.1 |
| 2019 Ontario Economic Outlook and Fiscal Review — Real Gross Domestic Product | 2.3 | 1.4 | 1.5 | 1.5 |
| 2019 Ontario Economic Outlook and Fiscal Review — Nominal Gross Domestic Product | 3.5 | 3.4 | 3.3 | 3.3 |
| 2019 Ontario Economic Outlook and Fiscal Review — Employment3 | 1.6 | 2.6 | 1.2 | 1.0 |
| 2019 Ontario Economic Outlook and Fiscal Review — Unemployment Rate4 (Per Cent) | 5.6 | 5.6 | 5.5 | 5.5 |
| 2019 Ontario Economic Outlook and Fiscal Review — Compensation of Employees | 5.3 | 4.3 | 4.0 | 3.7 |
| 2019 Ontario Economic Outlook and Fiscal Review — Net Operating Surplus — Corporations | (3.7) | 0.6 | 0.6 | 2.7 |
| 2019 Ontario Economic Outlook and Fiscal Review — Nominal Household Consumption | 4.8 | 3.8 | 3.8 | 3.7 |
| 2019 Ontario Budget — Real Gross Domestic Product | 2.2 | 1.4 | 1.6 | 1.5 |
| 2019 Ontario Budget — Nominal Gross Domestic Product | 3.4 | 3.4 | 3.4 | 3.2 |
| 2019 Ontario Budget — Employment5 | 1.6 | 1.3 | 1.0 | 1.0 |
| 2019 Ontario Budget — Unemployment Rate6 (Per Cent) | 5.6 | 5.5 | 5.5 | 5.5 |
| 2019 Ontario Budget — Compensation of Employees | 5.2 | 3.9 | 3.8 | 3.8 |
| 2019 Ontario Budget — Net Operating Surplus — Corporations | (0.3) | 3.1 | 2.7 | 1.6 |
| 2019 Ontario Budget — Nominal Household Consumption | 4.7 | 3.6 | 3.4 | 3.6 |
e = Ontario Ministry of Finance estimate.
p = Ontario Ministry of Finance planning projection.
[1], [2], [3], [4], [5], [6] Actual for 2019.
Sources: Statistics Canada and Ontario Ministry of Finance.
Regular Reporting on the Economy
The Fiscal Sustainability, Transparency and Accountability Act, 2019 (FSTAA) states that the quarterly Ontario Economic Accounts (OEA) shall be released within 45 days after the Statistics Canada release of the National Income and Expenditure Accounts. This deadline is included in the Premier and Minister’s Accountability Guarantee.
The OEA provides a comprehensive overall assessment of the performance of Ontario’s economy. Private-sector economists use this to assess the current state of the province’s economy and as a basis for updating their forecasts. The OEA forms the basis for the government’s economic and revenue forecasts, providing a key foundation for the Province’s fiscal plan.
In compliance with the legislation, the quarterly OEA will be released according to the following schedule:
| Reference Period | Expected Statistics Canada Release of National Income and Expenditure Accounts | Fiscal Sustainability, Transparency and Accountability Act, 2019 Required Release | Corresponding Deadline for Release of Ontario Economic Accounts |
|---|---|---|---|
| Fourth Quarter (October-December) 2019 | February 28, 2020 | Within 45 days | By April 14, 2020 |
| First Quarter (January-March) 2020 | May 29, 2020 | Within 45 days | By July 13, 2020 |
| Second Quarter (April-June) 2020 | August 28, 2020 | Within 45 days | By October 13, 2020 |
| Third Quarter (July-September) 2020 | December 1, 2020 | Within 45 days | By January 15, 2021 |
| Fourth Quarter (October-December) 2020 | March 2, 2021 | Within 45 days | By April 16, 2021 |
Also, the government is committed to release its long-range assessment of Ontario’s economic and fiscal environment before June 7, 2020. This long-term update will describe anticipated changes in the economy and population over the next 20 years. It will also include the potential impact of these changes on the public sector and fiscal policy, and an analysis of key issues that will affect the long-term sustainability of the economy and of the public sector.
Chart Descriptions
Chart 1.1: Ontario’s Employment Growth
The bar chart shows different characteristics of Ontario employment gains between June 2018 and February 2020. Total employment increased by 305,000 since June 2018, with full-time employment up by 258,000 and part-time employment up by 47,000. Private-sector employment increased by 166,000, while public-sector employment rose by 46,000 thousand and self-employment was up by 92,000. Employment in above-average wage industries rose by 254,000 compared with a 51,000-employment increase in below-average wage industries.
Notes: Above-average wage industries are identified as those with earnings above the average hourly earnings of all industries in 2019. Numbers may not add due to rounding.
Sources: Statistics Canada and Ontario Ministry of Finance.
Chart 1.2: Global Growth Slowed Broadly in 2019
The bar chart shows annual real GDP growth for China, the World, the U.S., Ontario, Canada, Germany, the U.K. and Japan for 2018 and 2019, in per cent.
Real GDP growth, in per cent, for each country in 2018 and 2019 was: China, 6.6 and 6.1; the World, 3.6 and 2.9; the U.S., 2.9 and 2.3; Canada, 2.0 and 1.6; Germany, 1.5 and 0.6; the U.K., 1.3 and 1.4; and Japan, 0.3 and 0.7.
Notes: World growth in 2019 is an International Monetary Fund estimate.
Sources: International Monetary Fund, United States Bureau of Economic Analysis, Cabinet Office (Japan), Federal Statistical Office of Germany, Office for National Statistics (United Kingdom) and National Bureau of Statistics of China, Statistics Canada and Ontario Ministry of Finance.
Chart 1.3: Slowing Manufacturing Activity
The line chart shows monthly manufacturing Purchasing Managers’ Index (PMI) for China, the United States, Canada, the United Kingdom, Japan and Germany from February 2017 to February 2020. All countries show a weakening in manufacturing business conditions in 2019. In the United Kingdom, Germany and Japan, manufacturing business conditions declined over most of the year. In China and Canada, conditions declined early in 2019 and improved modestly in late 2019. In the United States, the manufacturing PMI softened to close to 50 in mid-2019 before modestly improving. As of February 2020, the manufacturing PMI is above 50 in Canada, the United Kingdom and the United States, while it is below 50 in Germany, Japan and China.
Notes: The Purchasing Managers’ Index (PMI) is a diffusion index of business conditions. A reading above 50 indicates an overall increase in business conditions compared to the previous month, and below 50 an overall decrease.
Source: IHS Markit via Bloomberg.
Chart 1.4: Oil Prices Decline
The line chart shows daily values for the West Texas Intermediate (WTI) oil price in US dollars per barrel from January 2019 to March 2020. The price averaged $57.0 US in 2018. After the COVID‑19 outbreak was first reported in December 2019, the price declined to below $30 US per barrel in March.
Note: Includes information up to March 18, 2020
Sources: U.S. Energy Information Administration and Investing.com.
Chart 1.5: Stock Market Declines
The line chart shows daily values for the S&P 500 index and the S&P/TSX composite index, with January 2, 2019 set equal to 100. Both indices increased from 100 in January 2019 to mid-February 2020, with the S&P 500 reaching a high of 134.9 and the S&P/TSX reaching a high of 126.3. Both indices declined sharply in March 2020
Note: Includes information up to March 18, 2020.
Sources: S&P Dow Jones Indices.
Chart 1.6: Government Bond Rates Move Lower
The line chart shows daily values for Canadian and U.S. 10-year government bond rates, in per cent, from January 2019 to March 2020.
The Canadian 10-year government bond rate declined from an average of 2.0 per cent in January 2019 to an average of 1.2 per cent in August 2019. It then stabilized, averaging 1.5 per cent from September 2019 to February 2020.
The U.S. 10-year government bond rate declined from an average of 2.7 per cent in January 2019 to an average of 1.6 per cent in August 2019. It then stabilized, averaging 1.7 per cent from September 2019 to February 2020. By mid-March 2020, the rate had declined significantly, reaching record lows.
By mid-March 2020, both the Canadian and U.S. 10-year government bond rates had declined significantly, reaching record lows.
Note: Includes information up to March 18, 2020
Sources: Federal Reserve and Bank of Canada.
Chart 1.7: Canadian Dollar Declines
The line chart shows daily values for the Canada to U.S. dollar exchange rate in cents US, from January 2019 to March 2020. The exchange rate averaged 75.4 cents US from January 2019 to February 2020. By mid-March 2020, the exchange rate had fallen to roughly 70 cents US.
Note: Includes information up to March 18, 2020
Sources: Bank of Canada.