Introduction
At the time of publishing the March 2020 Economic and Fiscal Update, global economic conditions remain uncertain as a result of the COVID‑19 outbreak.
This fiscal update incorporates immediate measures taken by the government in order to respond to the COVID‑19 outbreak, including additional health care resources and contingencies, and direct support for people and jobs.
The government’s plan also includes higher-than-usual reserve and contingency funds as a measure of prudence to protect against additional unforeseen adverse changes to revenue and expense.
The Province is actively monitoring risks — working with its partners and other levels of government in a coordinated fashion to mitigate impacts — and through its prudent planning, there exists fiscal flexibility to respond as conditions evolve.
Ontario’s Fiscal Plan
The government is projecting a deficit of $9.2 billion in 2019–20, which represents an improvement of $1.1 billion relative to the 2019 Budget.
As a result of the response to the COVID‑19 outbreak, the government is planning for a deficit of $20.5 billion in 2020–21.
Net debt-to-GDP is forecast to be 39.9 per cent in 2019–20, lower than the 40.7 per cent forecast in the 2019 Budget and is projected to increase to 41.7 per cent by 2020–21.
| Actual 2018–19 |
Interim1 2019–20 |
Plan 2020–21 |
|
|---|---|---|---|
| Revenue | 153.7 | 156.7 | 156.3 |
| Expense — Programs | 148.8 | 153.1 | 161.1 |
| Expense — Interest on Debt | 12.4 | 12.6 | 13.2 |
| Total Expense | 161.1 | 165.7 | 174.3 |
| Surplus/(Deficit) Before Reserve | (7.4) | (9.0) | (18.0) |
| Reserve | – | 0.2 | 2.5 |
| Surplus/(Deficit) | (7.4) | (9.2) | (20.5) |
| Net Debt as a Per Cent of GDP | 39.5% | 39.9% | 41.7% |
| Accumulated Deficit as a Per Cent of GDP | 25.3% | 25.3% | 26.8% |
[1] Interim represents the March 2020 Economic and Fiscal Update projection for the 2019–20 fiscal year.
Note: Numbers may not add due to rounding.
Sources: Ontario Ministry of Finance and Treasury Board Secretariat.
Details of Revenue
2019–20 Revenue Performance
Total revenue in 2019–20 is estimated to be about $2.6 billion higher than projected in the 2019 Budget. The estimates are based on revenue information available to March 18, 2020. Information arriving subsequent to this date will be reflected in future updates, including the Public Accounts of Ontario 2019–2020.
| Interim1 2019–20 |
|
|---|---|
| 2019 Budget Total Revenue | 154,165 |
| Taxation Revenue — Sales Tax | 1,056 |
| Taxation Revenue — Personal Income Tax | 1,028 |
| Taxation Revenue — Corporations Tax | 256 |
| Taxation Revenue — Education Property Tax | 128 |
| Taxation Revenue — Land Transfer Tax | 87 |
| Taxation Revenue — All Other Taxes Combined | (33) |
| Total Taxation Revenue | 2,522 |
| Government of Canada — Canada Health Transfer | 186 |
| Government of Canada — Infrastructure | (397) |
| Government of Canada — All Other Federal Transfers Combined | 169 |
| Total Government of Canada | (42) |
| Total Income from Government Business Enterprises | (86) |
| Total Other Non-Tax Revenue | 172 |
| Total Revenue Changes since the 2019 Budget | 2,566 |
| March 2020 Economic and Fiscal Update Total Revenue | 156,731 |
[1] Interim represents the March 2020 Economic and Fiscal Update projection for the 2019–20 fiscal year.
Note: Numbers may not add due to rounding.
Source: Ontario Ministry of Finance.
Highlights of changes to estimated 2019–20 revenue compared to the 2019 Budget forecast are as follows:
- Sales Tax revenue is $1,056 million higher reflecting revised federal Harmonized Sales Tax (HST) entitlement updates for years up to and including 2020, mainly driven by higher 2018 amounts.
- Personal Income Tax revenue increased by $1,028 million due to higher amounts from processing of 2018 and prior-year tax returns and stronger growth in employment and incomes in 2019.
- Corporations Tax revenue increased by $256 million due to higher amounts from processing of 2018 and prior year tax returns, partially offset by lower corporate profits in 2019 and 2020.
- Education Property Tax revenue is $128 million higher reflecting lower-than-anticipated revenue losses due to assessment appeals.
- Land Transfer Tax revenue is $87 million higher reflecting stronger home resales.
- All Other Taxes Combined are $33 million lower mainly due to revenues from Beer, Wine and Spirits Taxes, Gasoline Tax, Tobacco Tax and Employer Health Tax (EHT), partially offset by higher revenues from the Ontario Health Premium. This includes the 2019–20 impact of the government’s proposal to increase the EHT exemption to $1 million in 2020 to provide relief for employers in response to the COVID‑19 outbreak. See Annex: Details of Tax Measures for more information.
- Canada Health Transfer revenues are higher by $186 million mainly due to $194 million in additional federal funding for critical health care system needs and to support mitigation efforts of the COVID‑19 outbreak.
- Government of Canada revenues for funding infrastructure projects are lower by $397 million due to revised project timelines.
- One-time funding from the Low Carbon Economy Leadership Fund of $169 million increased revenues from All Other Federal Transfers Combined.
- Net Income from Government Business Enterprises is down $86 million mainly arising from lower-than-anticipated net income from the Ontario Lottery and Gaming Corporation (OLG), largely due to revenue from casinos.
- Other Non-Tax Revenue Combined is higher by $172 million, mainly due to an increase in other fees, licences and permits, and miscellaneous revenues from consolidated government agencies.
2020–21 Revenue Outlook
The revenue forecast for 2020–21 is projected to be $156.3 billion, representing a decrease of $0.5 billion relative to the 2019–20 interim estimate.
| Actual 2018–19 |
Interim1 2019–20 |
Plan 2020–21 |
|
|---|---|---|---|
| Revenue — Personal Income Tax | 35.4 | 37.6 | 37.3 |
| Revenue — Sales Tax | 27.8 | 29.1 | 29.1 |
| Revenue — Corporations Tax | 16.6 | 15.4 | 15.2 |
| Revenue — Ontario Health Premium | 3.8 | 4.1 | 4.1 |
| Revenue — Education Property Tax | 6.2 | 6.2 | 6.3 |
| Revenue — All Other Taxes | 15.7 | 16.2 | 16.3 |
| Total Taxation Revenue | 105.5 | 108.7 | 108.2 |
| Government of Canada | 25.1 | 25.4 | 26.3 |
| Income from Government Business Enterprises | 5.5 | 5.7 | 4.1 |
| Other Non-Tax Revenue | 17.6 | 16.9 | 17.6 |
| March 2020 Economic and Fiscal Update Total Revenue | 153.7 | 156.7 | 156.3 |
[1] Interim represents the March 2020 Economic and Fiscal Update projection for the 2019–20 fiscal year.
Note: Numbers may not add due to rounding.
Source: Ontario Ministry of Finance.
The taxation revenue forecast reflects the current economic planning assumptions and the impacts of government policy commitments. Taxation revenue is projected to decrease 0.4 per cent in 2020–21, lower than the projected pace of nominal GDP growth of 2.0 per cent in 2020. This represents reasonable assumptions regarding revenue growth based on past experience in periods when there was a sudden slowdown in economic activity.
Personal Income Tax (PIT) revenue is projected to decline by 0.8 per cent. This is partly due to one-time revenue of $0.5 billion recognized in 2019–20 related to revised estimates of revenues earned in prior years.
The Sales Tax revenue projection is based primarily on the outlook for consumer spending. Sales Tax revenue is projected to decline 0.2 per cent in 2020–21, mainly due to $1.0 billion of one-time revenue recognized in 2019–20 related to revised entitlement estimates earned in prior years.
The forecast for Corporations Tax revenue is projected to decline 1.7 per cent in 2020–21. The forecast reflects a modest decline of 2.4 per cent in the corporate operating surplus. Recent government tax cuts including the accelerated write-off of capital investments, reducing the small business tax rate from 3.5 per cent to 3.2 per cent and not paralleling the federal government in phasing out the small business deduction are reflected in the revenue forecast, as well as the proposed Regional Opportunities Investment Tax Credit.
The Ontario Health Premium revenue forecast is based primarily on the projected growth in the compensation of employees. Ontario Health Premium revenue is projected to increase 0.8 per cent in 2020–21.
Education Property Tax revenue is projected to increase 0.9 per cent in 2020–21, reflecting the additions to the property assessment base as a result of new construction activities.
Revenues from All Other Taxes combined are projected to increase 0.4 per cent in 2020–21. This includes higher revenues expected from Land Transfer Tax and Beer, Wine and Spirits Taxes. The outlook includes tax measures to provide tax relief to businesses, including those negatively impacted by the COVID‑19 outbreak. See Annex: Details of Tax Measures for more information.
The forecast for Government of Canada transfers is based on existing federal–provincial funding agreements and formulas, including the Canada Health Transfer, Canada Social Transfer, funding for labour market programs and Canada-Ontario Community Housing Initiatives.
The outlook for Income from Government Business Enterprises (GBEs) is based on Ontario Ministry of Finance estimates for Hydro One Ltd. and projections provided by Ontario Power Generation (OPG), the Ontario Cannabis Store (OCS), the Liquor Control Board of Ontario (LCBO) and the Ontario Lottery and Gaming Corporation (OLG). Revenues from GBEs are projected to decline from $5.7 billion to $4.1 billion between 2019–20 and 2020–21, mainly due to the expected impact of weaker economic conditions and the COVID‑19 outbreak on OLG income from casinos.
The forecast for Other Non-Tax Revenue is based on projections provided by government ministries and Provincial agencies. The outlook for Other Non-Tax revenues is projected to change from $16.9 billion in 2019–20 to $17.6 billion in 2020–21.
Changes since the 2019 Budget
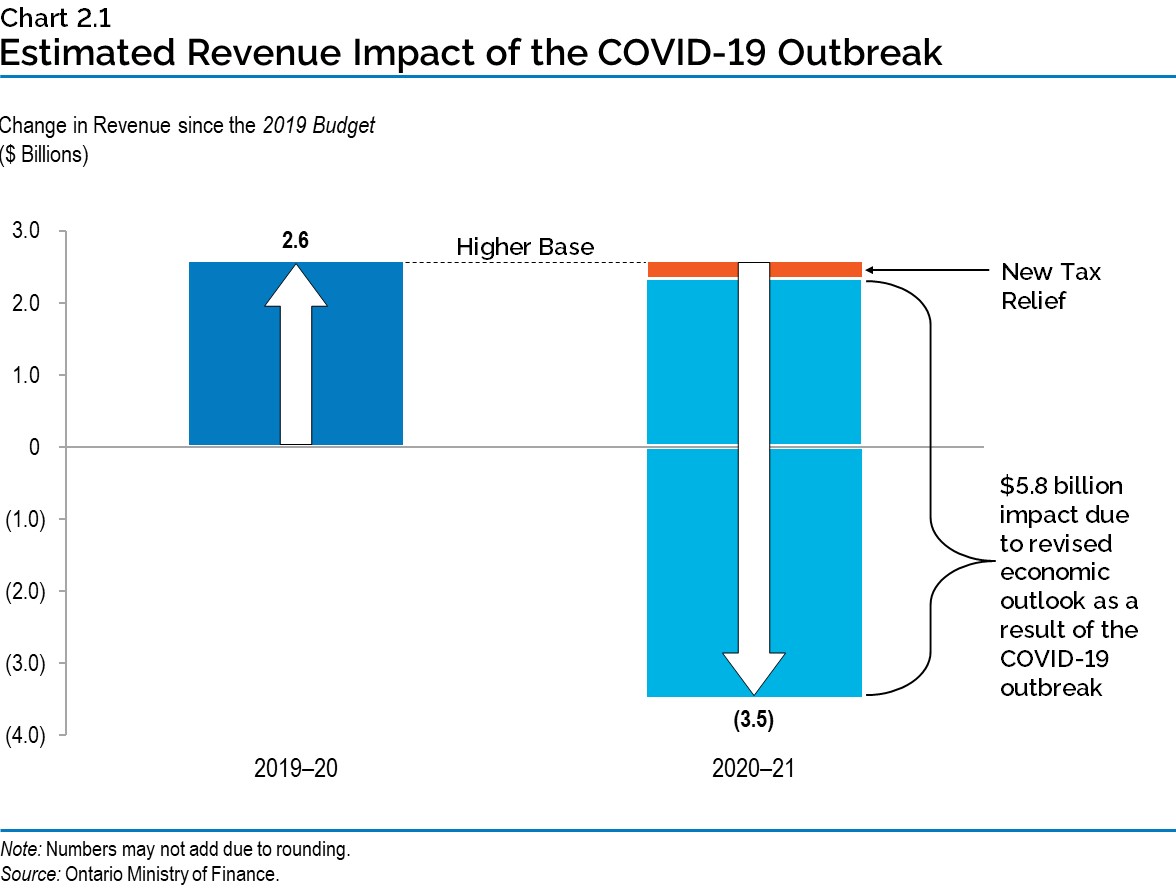
Projected 2020–21 revenues are $3.5 billion lower than at the time of the 2019 Budget. The estimated overall impact on revenues of the COVID‑19 outbreak is about $5.8 billion in 2020–21.
Risks to the Revenue Outlook
There are a variety of risks to the economic planning assumptions underlying the revenue forecast. As outlined in Chapter 1: Economic Update, global economic risks are elevated due to the adverse impact of the COVID‑19 outbreak. Table 2.4 highlights some of the key sensitivities and risks to the fiscal plan that could arise from unexpected changes in economic conditions. These estimates are only guidelines; actual results will vary depending on the composition and interaction of various factors. The risks identified are based on average long-term relationships that could have the most material impact on the largest revenue sources.
| Economic Factors | Revenue Sources | 2020–21 Sensitivities |
|---|---|---|
| Nominal GDP | Total Taxation Revenue | $700 million revenue change for each percentage point change in nominal GDP growth. Can vary significantly, depending on the composition and source of changes in GDP growth. |
| Compensation of Employees | Personal Income Tax, Ontario Health Premium and Employer Health Tax | $440 million revenue change for each percentage point change in growth in compensation of employees. |
| Household Consumption Expenditures | Harmonized Sales Tax | $197 million revenue change for each percentage point change in growth of household consumption expenditures. |
| Net Operating Surplus of Corporations | Corporations Tax | $100 million revenue change for each percentage point change in growth of net corporations operating surplus. |
| Housing Resales and Resale Prices | Land Transfer Tax | $29 million revenue change for each percentage point change in growth of either the number or prices of housing resales. |
| Ontario Population Share | Canada Health Transfer | $42 million revenue change for each one‑tenth of a percentage point change in Ontario’s population share. |
| Ontario Population Share | Canada Social Transfer | $15 million revenue change for each one‑tenth of a percentage point change in Ontario’s population share. |
Source: Ontario Ministry of Finance.
The variance from the interim revenue published in the Budget plan to actual revenue published in the Public Accounts is usually small. For example, on average, over the 1993–94 and 2018–19 periods, there was a positive 0.2 per cent change in total revenue. Although the average total revenue variance is relatively small, in any given year, it can be larger as new information on revenues arrives, notably tax return processing from the preceding year.
Since 1993–94, on average, the Province experienced a positive 1.3 per cent variance from the Budget plan to actual for total revenue. Although the average total revenue variance is relatively small, in any given year, the variance can be fairly large, ranging from a high of 7.2 per cent in 1999–2000 to a low of -7.1 per cent in 2003–04.
Details of Expense
Expense Outlook
In addition to the immediate resources to respond to the COVID‑19 outbreak, the government is making additional investments in critical programs and services. Compared to the outlook presented in the 2019 Budget, program expense is projected to be higher by $3.0 billion in 2019–20 and $9.1 billion in 2020–21.
| Interim1 2019–20 |
Plan 2020–21 |
|
|---|---|---|
| 2019 Budget Total Expense2 | 163.4 | 165.6 |
| Program Expense Changes since the 2019 Budget — Health Sector | 0.9 | 3.3 |
| Program Expense Changes since the 2019 Budget — Education Sector3 | 0.1 | 0.5 |
| Program Expense Changes since the 2019 Budget — Postsecondary Education Sector | 0.0 | 0.1 |
| Program Expense Changes since the 2019 Budget — Children’s and Social Services Sector | 0.8 | 1.2 |
| Program Expense Changes since the 2019 Budget — Justice Sector | 0.2 | 0.3 |
| Program Expense Changes since the 2019 Budget — Other Programs | 1.1 | 3.7 |
| Total Program Expense Changes | 3.0 | 9.1 |
| Change in Interest on Debt | (0.7) | (0.5) |
| Total Expense Changes since the 2019 Budget | 2.3 | 8.7 |
| March 2020 Economic and Fiscal Update Total Expense | 165.7 | 174.3 |
[1] Interim represents the March 2020 Economic and Fiscal Update projection for the 2019–20 fiscal year.
[2] The 2019 Budget expense outlook has been restated for reclassification and program transfer changes. These changes are fiscally neutral. For details see Table 2.6 in the Improved Transparency in Financial Reporting section.
[3] Excludes changes to the Teachers’ Pension Plan. Teachers’ Pension Plan expense changes are included in Other Programs.
Note: Numbers may not add due to rounding.
Sources: Ontario Ministry of Finance and Treasury Board Secretariat.
The expense outlook is higher compared to the 2019 Budget mainly because:
- Health sector expense is projected to increase by a further $0.9 billion in 2019–20 and $3.3 billion in 2020–21 primarily due to funding to respond to the COVID‑19 outbreak and investments in the hospital sector, utilization changes for physician and other services under the Ontario Health Insurance Plan (OHIP), community-based health care services to address hallway health care and build a connected and sustainable health care system. Key initiatives include:
- Health care investments to protect people and equip Ontario’s health care professionals with the resources they need to address the COVID‑19 outbreak, including:
- New acute and critical care beds and 25 assessment centres at hospitals;
- Providing personal protective equipment and other critical medical supplies to staff working on the front line;
- Increasing emergency capacity in long-term care homes to assist in COVID‑19 prevention and containment efforts of affected residents, and to assist in relieving pressures in hospitals;
- Providing public health units with additional resources to continue efforts to identify and contain COVID‑19 including increasing capacity for home and laboratory testing;
- Enhancing community capacity for patients in retirement homes and assisted living facilities, so hospitals can focus on providing care for complex COVID‑19 patients requiring hospitalization; and
- A COVID‑19 health sector response contingency fund of $1.0 billion for any emerging needs to support the Province’s timely response to the outbreak.
- An across-the-board increase for all public hospitals, and operating funding for newly opened beds and facility expansions to help hospitals meet the challenges of a growing population, increase access to highly specialized and innovative treatments and to tackle hallway health care;
- Annualized investments in small‐ and medium‐sized and multi-site hospitals to help address hallway health care;
- Targeted investments beginning in 2020–21 to build hospital and community capacity in Durham, Scarborough and London — three regions with among the highest levels of hallway health care;
- Additional investments to improve the quality of care and resident experience, and address recommendations from the Public Inquiry into the Safety and Security of Residents in the Long‑Term Care Homes System; and
- Continued investment in municipal land ambulance operations to improve coordination and enhance patient care.
- Health care investments to protect people and equip Ontario’s health care professionals with the resources they need to address the COVID‑19 outbreak, including:
- Education sector expense is projected to increase by $0.1 billion in 2019–20 and $0.5 billion in 2020–21 primarily due to increased funding for school boards to support higher student enrolment and investments in child care programs. Key initiatives include:
- Funding to support elementary and secondary education programs through the Priorities and Partnership Fund;
- Funding for student transportation;
- Supporting student mental health, including providing $25 million in permanent funding for approximately 180 mental health workers in secondary schools to better serve students with mild to moderate mental health issues;
- Focusing on priority areas including Science, Technology, Engineering and Math (STEM);
- Providing additional opportunities for students to focus on a career path that matches their skills and interests through the expansion of programs, such as the Specialist High Skill Majors; and
- Funding to reflect a one per cent annual increase to compensation costs for teachers and education sector workers.
- Postsecondary Education sector expense is projected to remain largely unchanged in 2019–20 and increase by $0.1 billion in 2020–21. The government is making sustained investments in Ontario’s universities and colleges, and student financial assistance. Key initiatives include:
- Temporarily deferring loan payments and interest accrual for six months for Ontario Student Assistance Program (OSAP) borrowers to ease the financial burden on students during the COVID‑19 outbreak;
- Increased funding to institutions to support the expansion of Masters degrees and PhD spaces;
- Continued support for students, through initiatives, such as the expansion of the Campus Safety Grant and additional support for students with disabilities; and
- Increases in capital expense related to renewal funding for postsecondary infrastructure.
- Children’s and Social Services sector expense is projected to increase by $0.8 billion in 2019–20 and $1.2 billion in 2020–21 primarily due to additional supports for people facing economic hardship during the COVID‑19 outbreak, investments in the Ontario Autism Program, social assistance, developmental services and child welfare, and additional investments to support children with physical and/or developmental disabilities. Key initiatives include:
- Investments to support people and respond to the COVID‑19 outbreak such as:
- Expanding access to temporary emergency assistance for people in financial need with no access to financial support and simplifying the application process to help people quickly;
- Covering outbreak-related costs, such as food, shelter and medical supplies for social assistance recipients; and
- Enhancing supports for residential facilities, including in developmental services, programs supporting survivors of domestic violence and protective care for children and youth.
- Annual funding of $600 million for the Ontario Autism Program;
- A strategy to combat human trafficking, including building public awareness, intervening early and supporting survivors;
- Special Services at Home program to support approximately 4,700 more children with developmental and/or physical disabilities and their families in 2020–21; and
- Developmental services, child welfare and other programs to help vulnerable populations.
- Investments to support people and respond to the COVID‑19 outbreak such as:
- Justice sector expense is projected to increase by $0.2 billion in 2019–20 and $0.3 billion in 2020–21 primarily due to compensation costs for the Ontario Provincial Police (OPP), correctional services staff, provincial government lawyers and judicial officers. Other key initiatives include:
- Services that help front-line staff experiencing post-traumatic stress disorder;
- Hiring additional OPP officers and correctional services staff to support efficient and high‑quality policing services and keeping correctional institutions safe;
- Obligations to support payments related to OPP operations and the Crown Liabilities and Proceedings Act, 2019;
- Providing additional resources to combat human trafficking in Ontario; and
- Investments to maintain stability in the justice system and to ensure ongoing service operations in response to the COVID‑19 outbreak.
- Other Programs sector expense is projected to increase by $1.1 billion in 2019–20 and $3.7 billion in 2020–21, primarily due to:
- Investments to respond to the COVID‑19 outbreak and provide direct support for people and the economy, while protecting jobs and making life more affordable for families including:
- Proposing to double the Guaranteed Annual Income System (GAINS) payment for six months for low-income seniors. This increase would provide immediate additional financial support to vulnerable seniors who may need additional support to cover essential expenses during the COVID‑19 outbreak;
- Helping to address seniors’ isolation by coordinating the delivery of meals and other essentials;
- Providing retirement homes with additional funding to implement infection control and active screening measures to protect residents;
- Assisting municipalities and other service providers so they can respond quickly to local needs associated with the COVID‑19 outbreak;
- Taking measures to maintain housing stability by enhancing existing programs delivered by local service managers to help people at risk of homelessness;
- Providing supports for Indigenous peoples and communities, including emergency assistance for urban Indigenous people in financial need, transportation costs for health care professionals and critical supplies to remote First Nations, and funding to address emergency planning and self-isolation needs for people in First Nation communities;
- Supporting workers through additional funding for skills training programs;
- Additional funding to address pressures in electricity cost relief programs, including the cost of the new Ontario Electricity Rebate for eligible residential, farm and small business consumers. This rebate ensures that electricity bills for an average residential consumer are kept more affordable;
- An investment in the Municipal Modernization Program to support 405 small and rural municipalities invest in service delivery reviews and projects aimed at increasing municipal efficiency, and funding for disaster relief assistance; and
- Additional funding for maintenance work to keep Ontario’s highways safe and reliable.
- Investments to respond to the COVID‑19 outbreak and provide direct support for people and the economy, while protecting jobs and making life more affordable for families including:
Contingency funds are maintained to help mitigate expense risks that may otherwise adversely affect Ontario’s fiscal performance.
Interest on Debt is projected to be lower by $0.7 billion in 2019–20 and $0.5 billion in 2020–21, relative to the 2019 Budget forecast, primarily due to lower-than-forecast interest rates.
Contingent Liabilities
In addition to the key demand sensitivities and economic risks, there are risks to the fiscal plan stemming from the government’s contingent liabilities. Whether these contingencies will result in actual liabilities for the Province is beyond the direct control of the government. Losses could result from legal settlements, defaults on projects, and loan and funding guarantees. Provisions for losses that are likely to occur and can be reasonably estimated are expensed and reported as liabilities in the Province’s financial statements. Any significant contingent liabilities related to the 2019–20 fiscal year will be disclosed as part of the Public Accounts of Ontario 2019–2020 to be released later this year.
Ensuring Fiscal Prudence
Introduced as part of the 2019 Budget, the Fiscal Sustainability, Transparency and Accountability Act, 2019 (FSTAA) requires Ontario’s fiscal plan to incorporate prudence in the form of a reserve to protect the outlook against unforeseen adverse changes in the Province’s revenue and expense. The government has included additional prudence above historic levels, which provides the fiscal flexibility to respond to changing global circumstances. The reserve has been set at $2.5 billion in 2020–21, significantly higher compared to the 2019 Budget forecast. This level of the reserve is the highest for a plan year since the Province first established reserves in fiscal plans in 1996.
Contingency funds are also maintained to help mitigate expense risks — for example, in cases where health and safety may be compromised — that may otherwise adversely affect Ontario’s fiscal performance. The contingency fund level is set at $1.3 billion in 2020–21.
In keeping with sound fiscal practices, the Province’s revenue outlook is based on reasonable economic assumptions. See Chapter 1: Economic Update for more details.
Improved Transparency in Financial Reporting
In order to enhance transparency and comparability in financial reporting, the 2019 Budget outlook has been restated for reclassification and key program transfer changes.
Ministry expenses have been reclassified to aggregate all expenses incurred related to the Government Real Estate Portfolio (GREP) under the Ministry of Government and Consumer Services, projects supported through Infrastructure Ontario under the Ministry of Infrastructure, and programs supported through the Ontario Trillium Foundation under the Ministry of Heritage, Sport, Tourism and Culture Industries. This reporting change has the impact of transferring funding to the above-noted three ministries from the remaining ministries’ budgets. Note 17 to the Public Accounts of Ontario 2018–2019 provided further details on this change in presentation.
The 2019 Budget has also been restated to reflect the transfer of Training and Skills Development programs from the Ministry of Colleges and Universities to the Ministry of Labour, Training and Skills Development. The impacts of this transfer are reflected between the Postsecondary Education and Other Program sectors.
These changes in reporting and presentation have no impact on the Province’s annual surplus/deficit, net debt or accumulated deficit and are reflected in the figures presented in the March 2020 Economic and Fiscal Update.
For ease of reference, Table 2.6 illustrates how the 2019 Budget plan has been restated.
| 2019–20 | 2020–21 | |
|---|---|---|
| 2019 Budget — Health Sector | 63.5 | 64.6 |
| 2019 Budget — Education Sector1 | 29.8 | 29.8 |
| 2019 Budget — Postsecondary Education and Training Sector | 11.4 | 11.5 |
| 2019 Budget — Children’s and Social Services Sector | 16.7 | 16.5 |
| 2019 Budget — Justice Sector | 4.9 | 4.8 |
| 2019 Budget — Other Programs | 23.8 | 24.7 |
| 2019 Budget — Total Program Expense | 150.1 | 151.9 |
| Changes due to Reclassification2 — Health Sector | (0.1) | (0.1) |
| Changes due to Reclassification — Education Sector3 | (0.0) | (0.0) |
| Changes due to Reclassification — Postsecondary Education and Training Sector | (0.0) | (0.0) |
| Changes due to Reclassification — Children’s and Social Services Sector | (0.1) | (0.1) |
| Changes due to Reclassification — Justice Sector | (0.6) | (0.5) |
| Changes due to Reclassification — Other Programs | 0.7 | 0.7 |
| Changes due to Reclassification — Total Program Expense | – | – |
| Changes due to Ministry Restructuring4 — Health Sector | – | – |
| Changes due to Ministry Restructuring — Education Sector5 | (0.0) | (0.0) |
| Changes due to Ministry Restructuring — Postsecondary Education Sector | (0.9) | (1.0) |
| Changes due to Ministry Restructuring — Children’s and Social Services Sector | – | – |
| Changes due to Ministry Restructuring — Justice Sector | – | – |
| Changes due to Ministry Restructuring — Other Programs | 0.9 | 1.0 |
| Changes due to Ministry Restructuring — Total Program Expense | – | – |
| Reclassified 2019 Budget — Health Sector | 63.4 | 64.6 |
| Reclassified 2019 Budget — Education Sector6 | 29.8 | 29.8 |
| Reclassified 2019 Budget — Postsecondary Education Sector | 10.5 | 10.5 |
| Reclassified 2019 Budget — Children’s and Social Services Sector | 16.6 | 16.5 |
| Reclassified 2019 Budget — Justice Sector | 4.3 | 4.2 |
| Reclassified 2019 Budget — Other Programs | 25.5 | 26.4 |
| Reclassified 2019 Budget — Total Program Expense | 150.1 | 151.9 |
[1], [3], [5], [6] Excludes the Teachers’ Pension Plan, which is included in Other Programs.
[2] Ministry expenses have been reclassified to aggregate all expenses incurred related to the Government Real Estate Portfolio (GREP) under the Ministry of Government and Consumer Services, projects supported through Infrastructure Ontario under the Ministry of Infrastructure, and programs supported through the Ontario Trillium Foundation under the Ministry of Heritage, Sport, Tourism and Culture Industries. Note 17 to the Public Accounts of Ontario 2018–2019 provided further details on this change in presentation.
[4] On October 21, 2019 the government announced that the Ministry of Labour would become the Ministry of Labour, Training and Skills Development and is consolidated in Other Programs; the Ministry of Training, Colleges and Universities would become the Ministry of Colleges and Universities; the Ministry of Health and Ministry of Long-Term Care are consolidated in the Health sector.
Note: Numbers may not add due to rounding.
Source: Ontario Treasury Board Secretariat.
Details on Ontario’s Finances
| Actual 2017–18 |
Actual 2018–19 |
Interim1 2019–20 |
Plan 2020–21 |
|
|---|---|---|---|---|
| Taxation Revenue — Personal Income Tax | 32,900 | 35,381 | 37,628 | 37,316 |
| Taxation Revenue — Sales Tax | 25,923 | 27,804 | 29,132 | 29,078 |
| Taxation Revenue — Corporations Tax | 15,612 | 16,606 | 15,427 | 15,170 |
| Taxation Revenue — Education Property Tax | 5,883 | 6,171 | 6,213 | 6,270 |
| Taxation Revenue — Employer Health Tax | 6,205 | 6,544 | 6,820 | 6,823 |
| Taxation Revenue — Ontario Health Premium | 3,672 | 3,819 | 4,055 | 4,089 |
| Taxation Revenue — Gasoline Tax | 2,701 | 2,709 | 2,737 | 2,733 |
| Taxation Revenue — Land Transfer Tax | 3,174 | 2,761 | 2,964 | 3,029 |
| Taxation Revenue — Tobacco Tax | 1,244 | 1,241 | 1,149 | 1,108 |
| Taxation Revenue — Fuel Tax | 760 | 774 | 766 | 766 |
| Taxation Revenue — Beer, Wine and Spirits Taxes | 603 | 607 | 575 | 585 |
| Taxation Revenue — Ontario Portion of the Federal Cannabis Excise Duty | – | 19 | 70 | 155 |
| Taxation Revenue — Electricity Payments in Lieu of Taxes | 494 | 435 | 527 | 505 |
| Taxation Revenue — Other Taxes | 552 | 653 | 597 | 561 |
| Taxation Revenue — Total | 99,723 | 105,524 | 108,660 | 108,189 |
| Government of Canada — Canada Health Transfer | 14,359 | 14,852 | 15,832 | 16,252 |
| Government of Canada — Canada Social Transfer | 5,314 | 5,451 | 5,650 | 5,832 |
| Government of Canada — Equalization | 1,424 | 963 | – | – |
| Government of Canada — Infrastructure Programs | 1,065 | 605 | 646 | 1,013 |
| Government of Canada — Labour Market Programs | 969 | 1,015 | 1,039 | 1,092 |
| Government of Canada — Social Housing Agreement | 419 | 394 | 359 | 331 |
| Government of Canada — Other Federal Payments | 996 | 1,420 | 1,556 | 1,418 |
| Government of Canada — Direct Transfers to Broader Public-Sector Organizations | 314 | 390 | 329 | 407 |
| Government of Canada — Total | 24,860 | 25,090 | 25,411 | 26,345 |
| Income from Government Business Enterprises — Ontario Lottery and Gaming Corporation | 2,487 | 2,464 | 2,324 | 809 |
| Income from Government Business Enterprises — Liquor Control Board of Ontario | 2,207 | 2,276 | 2,347 | 2,394 |
| Income from Government Business Enterprises — Ontario Cannabis Store | (6) | (42) | 10 | 80 |
| Income from Government Business Enterprises — Ontario Power Generation Inc./Hydro One Ltd. | 1,464 | 772 | 1,054 | 862 |
| Income from Government Business Enterprises — Total | 6,152 | 5,470 | 5,735 | 4,145 |
| Other Non-Tax Revenue — Reimbursements | 1,000 | 998 | 982 | 1,029 |
| Other Non-Tax Revenue — Vehicle and Driver Registration Fees | 1,912 | 1,991 | 2,031 | 2,072 |
| Other Non-Tax Revenue — Electricity Debt Retirement Charge2 | 593 | 15 | – | – |
| Other Non-Tax Revenue — Power Supply Contract Recoveries | 185 | 173 | 124 | 94 |
| Other Non-Tax Revenue — Sales and Rentals3 | 2,450 | 1,477 | 1,573 | 1,621 |
| Other Non-Tax Revenue — Carbon Allowance Proceeds4 | 2,401 | 472 | – | – |
| Other Non-Tax Revenue — Other Fees and Licences | 1,029 | 1,088 | 1,191 | 1,284 |
| Other Non-Tax Revenue — Net Reduction of Power Purchase Contracts | 74 | 41 | 30 | 28 |
| Other Non-Tax Revenue — Royalties | 290 | 251 | 290 | 276 |
| Other Non-Tax Revenue — Fees, Donations and Other Revenues from Hospitals, School Boards and Colleges | 8,309 | 9,237 | 9,369 | 9,740 |
| Other Non-Tax Revenue — Miscellaneous Other Non-Tax Revenue | 1,616 | 1,873 | 1,335 | 1,443 |
| Other Non-Tax Revenue — Total | 19,859 | 17,616 | 16,925 | 17,587 |
| Total Revenue | 150,594 | 153,700 | 156,731 | 156,266 |
[1] Interim represents the March 2020 Economic and Fiscal Update projection for the 2019–20 fiscal year.
[2] The Debt Retirement Charge cost was removed from residential electricity users’ electricity bills as of January 1, 2016 and for all other consumers as of April 1, 2018. Residual revenues recorded afterwards due to higher than expected amounts received following the 2017–18 year-end, compared to the estimated accrual amounts in 2017–18.
[3] Higher Sales and Rentals revenues in 2017–18 compared to 2018–19 and Interim 2019–20 are mainly due to significant, non‑recurring asset sale initiatives such as the sale of Hydro One shares.
[4] Declining Carbon Allowance Proceeds reflects the passing of the Cap and Trade Cancellation Act, 2018 on October 31, 2018.
Note: Numbers may not add due to rounding.
Source: Ontario Ministry of Finance.
| Ministry Expense | Actual 2017–18 |
Actual 2018–19 |
Interim3 2019–20 |
Plan 2020–21 |
|---|---|---|---|---|
| Agriculture, Food and Rural Affairs (Base) | 384 | 330 | 309 | 314.8 |
| Agriculture, Food and Rural Affairs — Federal-Provincial Infrastructure Programs | 102 | 96 | 94 | 104.0 |
| Agriculture, Food and Rural Affairs — Municipal Infrastructure Program Investments4 | 195 | 257 | 231 | 10.0 |
| Agriculture, Food and Rural Affairs — Demand-Driven Risk Management Programs | 312 | 383 | 520 | 359.6 |
| Agriculture, Food and Rural Affairs (Total)5 | 993 | 1,065 | 1,154 | 788.4 |
| Attorney General (Total) | 1,742 | 1,787 | 1,778 | 1,682.2 |
| Board of Internal Economy (Total) | 296 | 371 | 280 | 280.8 |
| Children, Community and Social Services (Total) | 16,300 | 16,841 | 17,375 | 17,697.2 |
| Colleges and Universities (Base) | 8,594 | 9,028 | 9,095 | 9,392.7 |
| Colleges and Universities — Student Financial Assistance | 1,663 | 2,043 | 1,322 | 1,274.4 |
| Colleges and Universities — Time-Limited Infrastructure Funding under the Strategic Investment Fund | 209 | 119 | – | – |
| Colleges and Universities (Total) | 10,465 | 11,190 | 10,417 | 10,667.1 |
| Economic Development, Job Creation and Trade (Base) | 418 | 356 | 343 | 368.8 |
| Economic Development, Job Creation and Trade — Time-Limited Investments | 422 | 430 | 259 | 209.0 |
| Economic Development, Job Creation and Trade (Total) | 840 | 786 | 602 | 577.8 |
| Education (Base) | 27,265 | 28,746 | 29,839 | 30,272.4 |
| Education — Teachers’ Pension Plan6 | 1,659 | 1,678 | 1,570 | 1,620.7 |
| Education (Total) | 28,923 | 30,424 | 31,409 | 31,893.2 |
| Energy, Northern Development and Mines (Base) | 1,283 | 1,363 | 1,031 | 1,049.4 |
| Energy, Northern Development and Mines — Electricity Cost Relief Programs | 2,834 | 4,242 | 5,573 | 5,602.6 |
| Energy, Northern Development and Mines (Total) | 4,117 | 5,605 | 6,604 | 6,652.0 |
| Environment, Conservation and Parks (Base) | 706 | 464 | 626 | 656.9 |
| Environment, Conservation and Parks — Time-Limited Investments | 145 | 223 | 3 | – |
| Environment, Conservation and Parks (Total) | 851 | 687 | 629 | 656.9 |
| Executive Offices (Total) | 37 | 34 | 32 | 37.5 |
| Finance (Base) | 843 | 885 | 798 | 862.0 |
| Finance — Investment Management Corporation of Ontario7 | – | 67 | 90 | 161.1 |
| Finance — Ontario Municipal Partnership Fund | 506 | 510 | 505 | 501.9 |
| Finance — Power Supply Contract Costs | 191 | 173 | 124 | 94.1 |
| Finance — COVID‑19 Response: Support for People and Jobs Fund | – | – | – | 1,965.6 |
| Finance (Total) | 1,540 | 1,636 | 1,517 | 3,584.6 |
| Francophone Affairs (Total) | 6 | 6 | 6 | 6.1 |
| Government and Consumer Services (Base) | 668 | 651 | 640 | 641.1 |
| Government and Consumer Services — Realty | 982 | 1,012 | 1,112 | 1,024.4 |
| Government and Consumer Services (Total) | 1,650 | 1,664 | 1,752 | 1,665.6 |
| Health (Total) | 54,982 | 57,573 | 59,921 | 63,215.3 |
| Heritage, Sport, Tourism and Culture Industries (Base) | 940 | 935 | 950 | 946.9 |
| Heritage, Sport, Tourism and Culture Industries — Ontario Cultural Media Tax Credits | 509 | 588 | 656 | 704.3 |
| Heritage, Sport, Tourism and Culture Industries — Ontario Cultural Media Tax Credits – Amounts Related to Prior Years | 145 | 40 | 80 | – |
| Heritage, Sport, Tourism and Culture Industries (Total) | 1,594 | 1,562 | 1,686 | 1,651.3 |
| Indigenous Affairs (Base) | 86 | 75 | 78 | 82.2 |
| Indigenous Affairs — One-Time Investments including Settlements8 | 1,122 | 215 | 14 | – |
| Indigenous Affairs — Indigenous Affairs (Total) | 1,208 | 290 | 92 | 82.2 |
| Infrastructure (Base) | 227 | 161 | 203 | 221.8 |
| Infrastructure — Federal–Provincial Infrastructure Programs | 248 | 352 | 122 | 310.5 |
| Infrastructure — Waterfront Toronto Revitalization (Port Lands Flood Protection) | – | – | 118 | 128.4 |
| Infrastructure — Municipal Infrastructure Program Investments9 | – | – | – | 202.0 |
| Infrastructure (Total) | 475 | 513 | 444 | 862.6 |
| Labour, Training, and Skills Development (Base) | 212 | 205 | 213 | 244.3 |
| Labour, Training, and Skills Development — Ontario Apprenticeship Training Tax Credit10 | 126 | 112 | 65 | 21.5 |
| Labour, Training, and Skills Development — Demand-Driven Employment and Training Programs | 916 | 943 | 970 | 1,027.7 |
| Labour, Training, and Skills Development (Total) | 1,254 | 1,259 | 1,247 | 1,293.4 |
| Long-Term Care (Total) | 4,163 | 4,329 | 4,441 | 4,628.4 |
| Municipal Affairs and Housing (Base) | 417 | 475 | 479 | 481.7 |
| Municipal Affairs and Housing — Time-Limited Investments | 559 | 636 | 315 | 226.2 |
| Municipal Affairs and Housing — Social Housing Agreement - Payments to Service Managers11 | 392 | 367 | 341 | 315.2 |
| Municipal Affairs and Housing (Total) | 1,368 | 1,478 | 1,135 | 1,023.1 |
| Natural Resources and Forestry (Base) | 609 | 505 | 546 | 551.3 |
| Natural Resources and Forestry — Emergency Forest Firefighting | 117 | 208 | 137 | 100.0 |
| Natural Resources and Forestry (Total) | 726 | 713 | 683 | 651.3 |
| Seniors and Accessibility (Total) | 48 | 52 | 57 | 58.2 |
| Solicitor General (Total) | 2,561 | 2,681 | 2,773 | 2,849.5 |
| Transportation (Base) | 4,184 | 4,543 | 4,945 | 4,944.6 |
| Transportation — Federal–Provincial Infrastructure Programs | 404 | 297 | 332 | 640.0 |
| Transportation (Total) | 4,588 | 4,840 | 5,277 | 5,584.6 |
| Treasury Board Secretariat (Base) | 194 | 201 | 236 | 298.9 |
| Treasury Board Secretariat — Employee and Pensioner Benefits12 | 1,442 | 1,165 | 1,468 | 1,389.0 |
| Treasury Board Secretariat — Operating Contingency Fund | – | – | 100 | 1,155.0 |
| Treasury Board Secretariat — Capital Contingency Fund | – | – | – | 145.0 |
| Treasury Board Secretariat (Total) | 1,636 | 1,365 | 1,804 | 2,987.9 |
| Interest on Debt13 | 11,903 | 12,384 | 12,599 | 13,199.3 |
| Total Expense | 154,266 | 161,135 | 165,714 | 174,276.4 |
[1] Numbers reflect current ministry structure.
[2] Ministry expenses have been restated for reclassification and program transfer changes. These changes are fiscally neutral. The actual results are presented on similar basis for consistency.
[3] Interim represents the March 2020 Economic and Fiscal Update projection for the 2019–20 fiscal year.
[4], [9] Municipal infrastructure program funding transferring from the Ministry of Agriculture, Food and Rural Affairs to the Ministry of Infrastructure in 2020–21.
[5] The 2019–20 amount includes extraordinary production insurance payout of $175 million above annual forecast due to 2019 crop conditions and $137 million of in-year transfers from the Ministry of Infrastructure to deliver infrastructure programs.
[6], [12] Numbers reflect the pension expense that was calculated based on recommendations of the Independent Financial Commission of Inquiry, as described in Note 19 to the Consolidated Financial Statements in Public Accounts of Ontario 2017–2018.
[7] Based on the requirements of Public Sector Accounting Standards, the Province consolidated the Investment Management Corporation of Ontario into the Ministry of Finance.
[8] Numbers reflect the payment or liability related to one-time investments for land claim settlements and other items. The amounts fluctuate based on the land claims negotiated in each year.
[10] Eliminated for eligible apprenticeship programs that commenced on or after November 15, 2017. 2017–18 to 2019–20 include tax credit amounts related to prior years.
[11] The annual decline from 2017–18 to 2020–21 is mainly due to declining federal obligations, such as maturing mortgages, under the Social Housing Agreement.
[13] Interest on debt is net of interest capitalized during construction of tangible capital assets of $157 million in 2017–18, $175 million in 2018–19, $476 million in 2019–20, and $234 million in 2020–21.
Note: Numbers may not add due to rounding.
Sources: Ontario Ministry of Finance and Treasury Board Secretariat.
| Total Infrastructure Expenditures 2019–20 Interim1, 2 |
2020–21
Plan Investment in Capital Assets3 |
2020–21 Plan Transfers and Other Infrastructure Expenditures4 |
2020–21
Plan Total Infrastructure Expenditures |
|
|---|---|---|---|---|
| Transportation — Transit | 5,650 | 3,738 | 1,095 | 4,833 |
| Transportation — Provincial Highways | 2,746 | 2,452 | 145 | 2,597 |
| Transportation — Other Transportation, Property and Planning | 262 | 131 | 82 | 213 |
| Health — Hospitals | 2,559 | 2,061 | 3 | 2,064 |
| Health — Other Health | 243 | 74 | 169 | 243 |
| Education | 2,632 | 2,241 | 10 | 2,251 |
| Postsecondary Education — Colleges and Other | 338 | 472 | 62 | 534 |
| Postsecondary Education — Universities | 52 | – | 100 | 100 |
| Social | 283 | 23 | 140 | 163 |
| Justice | 365 | 519 | 96 | 615 |
| Other Sectors5 | 1,610 | 989 | 1,034 | 2,024 |
| Total Infrastructure Expenditures | 16,741 | 12,701 | 2,936 | 15,637 |
| Less: Other Partner Funding6 | 2,252 | 2,136 | – | 2,136 |
| Total7 | 14,489 | 10,566 | 2,936 | 13,502 |
[1] Interim represents the March 2020 Economic and Fiscal Update projection for the 2019–20 fiscal year.
[2] Includes Provincial investment in capital assets of $11.6 billion.
[3] Includes interest capitalized during construction of $234 million.
[4] Includes transfers to municipalities, universities and non-consolidated agencies.
[5] Includes government administration, natural resources, and culture and tourism industries.
[6] Other Partner Funding refers to third-party investments primarily in hospitals, colleges and schools.
[7] Includes Federal/Municipal contributions to provincial infrastructure investments.
Note: Numbers may not add due to rounding.
Source: Ontario Treasury Board Secretariat.
The fluctuation in planned spending between 2019–20 interim and 2020–21 plan is not the result of project cancellations. It is a result of the timing of the historic investments that the government is making. For example:
- The change in the transit sector is primarily due to the timing of planned investments for the GO Rail Expansion program; and
- The change in the health sector is a result of the timing of funding for various major hospital projects reaching substantial completion between 2019–20 and 2020–21.
| 2011–12 | 2012–13 | 2013–14 | 2014–15 | 2015–16 | 2016–17 | 2017–18 | Actual 2018–19 |
Interim3 2019–20 |
Plan 2020–21 |
|
|---|---|---|---|---|---|---|---|---|---|---|
| Revenue | 116,401 | 120,319 | 122,955 | 126,152 | 136,148 | 140,734 | 150,594 | 153,700 | 156,731 | 156,266 |
| Expense — Programs | 121,222 | 120,103 | 123,330 | 126,199 | 129,905 | 131,460 | 142,363 | 148,751 | 153,115 | 161,077 |
| Expense — Interest on Debt4 | 10,587 | 10,878 | 11,155 | 11,221 | 11,589 | 11,709 | 11,903 | 12,384 | 12,599 | 13,199 |
| Total Expense | 131,809 | 130,981 | 134,485 | 137,420 | 141,494 | 143,169 | 154,266 | 161,135 | 165,714 | 174,276 |
| Reserve | – | – | – | – | – | – | – | – | 200 | 2,500 |
| Surplus/(Deficit) | (15,408) | (10,662) | (11,530) | (11,268) | (5,346) | (2,435) | (3,672) | (7,435) | (9,184) | (20,510) |
| Net Debt | 241,912 | 259,947 | 276,169 | 294,557 | 306,357 | 314,077 | 323,834 | 338,496 | 355,160 | 379,175 |
| Accumulated Deficit | 164,092 | 174,256 | 184,835 | 196,665 | 203,014 | 205,939 | 209,023 | 216,642 | 225,626 | 243,636 |
| Gross Domestic Product (GDP) at Market Prices | 660,436 | 680,791 | 696,192 | 727,042 | 760,435 | 790,749 | 826,945 | 857,384 | 890,962 | 909,175 |
| Primary Household Income | 444,771 | 459,895 | 473,807 | 490,423 | 512,570 | 520,486 | 543,084 | 567,086 | 589,206 | 606,882 |
| Population — July (000s)5 | 13,261 | 13,391 | 13,511 | 13,618 | 13,707 | 13,875 | 14,073 | 14,319 | 14,567 | 14,831 |
| Net Debt per Capita (dollars) | 18,242 | 19,413 | 20,441 | 21,631 | 22,350 | 22,636 | 23,012 | 23,640 | 24,382 | 25,567 |
| Household Income per Capita (dollars) | 33,539 | 34,345 | 35,069 | 36,014 | 37,394 | 37,511 | 38,592 | 39,605 | 40,449 | 40,920 |
| Net Debt as a Per Cent of Revenue | 207.8% | 216.0% | 224.6% | 233.5% | 225.0% | 223.2% | 215.0% | 220.2% | 226.6% | 242.6% |
| Interest on Debt as a Per Cent of Revenue | 9.1% | 9.0% | 9.1% | 8.9% | 8.5% | 8.3% | 7.9% | 8.1% | 8.0% | 8.4% |
| Net Debt as a Per Cent of GDP | 36.6% | 38.2% | 39.7% | 40.5% | 40.3% | 39.7% | 39.2% | 39.5% | 39.9% | 41.7% |
| Accumulated Deficit as a Per Cent of GDP | 24.8% | 25.6% | 26.5% | 27.1% | 26.7% | 26.0% | 25.3% | 25.3% | 25.3% | 26.8% |
[1] Amounts reflect a change in pension expense that was calculated based on recommendations of the Independent Financial Commission of Inquiry, as described in Note 19 to the Consolidated Financial Statements, in the Public Accounts of Ontario 2017–2018. Amounts for net debt and accumulated deficit also reflect this change.
[2] Revenues and expenses have been restated to reflect the following fiscally neutral changes: i) revised presentation of education property taxes to be included in the taxation revenues; ii) reclassification of certain Government Business Enterprises to other government organizations; iii) reclassification of a number of tax measures that provide a financial benefit through the tax system to be reported as expenses; and iv) change in presentation of third-party revenue for hospitals, school boards and colleges to be reported as revenue.
[3] Interim represents the March 2020 Economic and Fiscal Update projection for the 2019–20 fiscal year.
[4] Interest on debt is net of interest capitalized during construction of tangible capital assets of $159 million in 2016–17, $157 million in 2017–18, $175 million in 2018–19, $476 million in 2019–20, and $234 million in 2020–21.
[5] Population figures are for July 1 of the fiscal year indicated (i.e., for 2011–12, the population on July 1, 2011 is shown).
Note: Numbers may not add due to rounding.
Sources: Statistics Canada, Ontario Ministry of Finance and Treasury Board Secretariat.
Chart Descriptions
Chart 2.1: Estimated Revenue Impact of the COVID‑19 Outbreak
This waterfall chart shows the change in revenue from the 2019 Budget and the estimated impacts of new tax relief and the economic impact of the COVID‑19 outbreak. Compared to the 2019 Budget, 2019–20 revenues have increased by $2.6 billion. The higher base from 2019–20 carries forward to 2020–21 and is offset by new tax relief and the estimated impact of the revised economic outlook (−$5.8 billion), for a total decline of $3.5 billion in 2020–21 from the 2019 Budget projection.
Note: Numbers may not add due to rounding.
Source: Ontario Ministry of Finance.