Introduction
The Province took advantage of strong demand for its debt and continued low interest rates, to pre‑borrow $4.1 billion in 2019–20. By borrowing a total of $36.0 billion in 2019–20, in line with the forecast in the 2019 Budget and $4.1 billion more than projected in the 2019 Ontario Economic Outlook and Fiscal Review (2019 Fall Economic Statement), the Province was able to reduce the long-term borrowing requirement by $4.1 billion in 2020–21.
Long-Term Public Borrowing
The Province’s total long-term borrowing will primarily be used to fund deficits, refinance maturing debt and make investments in capital assets. The Province will modestly increase short-term borrowing to keep the proportion of short-term debt to total debt outstanding near the middle of the six to eight per cent range that has been maintained over the past decade.
| 2019 Budget |
In-Year Change |
Interim1 2019–20 |
Plan 2020–21 |
|
|---|---|---|---|---|
| Deficit/(Surplus) | 10.3 | (1.1) | 9.2 | 20.5 |
| Investment in Capital Assets | 11.6 | 0.0 | 11.6 | 10.4 |
| Non-Cash Adjustments | (7.7) | 0.7 | (7.0) | (9.2) |
| Loans to Infrastructure Ontario | 0.2 | 0.0 | 0.2 | 0.3 |
| Other Net Loans/Investments | 0.7 | (0.3) | 0.3 | 1.2 |
| Debt Maturities/Redemptions | 27.5 | (0.1) | 27.4 | 26.6 |
| Total Funding Requirement | 42.5 | (0.8) | 41.7 | 49.7 |
| Decrease/(Increase) in Short-Term Borrowing | (1.2) | (1.8) | (3.0) | (2.0) |
| Increase/(Decrease) in Cash and Cash Equivalents2 | (5.3) | (1.5) | (6.8) | – |
| Pre-borrowing in 2019–20 | – | 4.1 | 4.1 | (4.1) |
| Total Long-Term Public Borrowing | 36.0 | 0.0 | 36.0 | 43.6 |
[1] Interim represents the March 2020 Economic and Fiscal Update projections for the 2019–20 fiscal year.
[2] Excludes 2019–20 pre-borrowing.
Note: Numbers may not add due to rounding.
Source: Ontario Financing Authority.
The government will seek approval from the Legislature for borrowing authority to meet the Province’s requirements.
Approximately 71 per cent of 2019–20 borrowing was completed in Canadian dollars, largely through 28 syndicated issues and two Green Bond issues. This is in line with the Province’s target range for Canadian dollar borrowing to be approximately 70 to 80 per cent of total borrowing for the fiscal year. The Province will maintain this target range for the 2020–21 fiscal year, but adjust, if necessary, recognizing the current volatility in financial markets.
Ontario remains, after the Government of Canada, the second most significant issuer in the Canadian dollar bond market and provides liquidity to investors even in volatile markets. The Province will also continue to regularly borrow in currencies other than the Canadian dollar to diversify its investor base. This helps reduce Ontario’s overall borrowing costs and ensures the government will continue to have access to capital if domestic market conditions become more challenging.
Green Bond Program
Green Bonds remain a core component of Ontario’s borrowing program and are an important tool to help finance public transit initiatives, extreme weather-resistant infrastructure, and energy efficiency and conservation projects. Ontario’s Green Bond proceeds fund project categories that support seven of the United Nations Sustainable Development Goals.
For the first time, the Province has issued two Green Bonds in the same fiscal year. On February 14, 2020, the Province issued its seventh Green Bond for $500 million. Nine projects were selected to receive funding from this Green Bond, including the Port Lands Flood Protection Project, which is the first project to receive Green Bond funding in the Climate Adaptation and Resilience category of Ontario’s Green Bond Framework. The Province issued its sixth Green Bond for $750 million on November 27, 2019, which provided funding to the Eglinton Crosstown LRT and GO Transit expansion.
Ontario is currently the largest issuer of Canadian dollar Green Bonds with seven issues totalling $5.25 billion of which $4.75 billion is currently outstanding. The Province plans to continue to be an active issuer of Green Bonds in 2020–21, both in Canadian dollars and, subject to market conditions, in another currency.
Cost of Debt
Ontario is forecast to pay $13.2 billion in interest costs in 2020–21. Interest on debt (IOD) is the Province’s fourth largest expense after health care, education and social services.
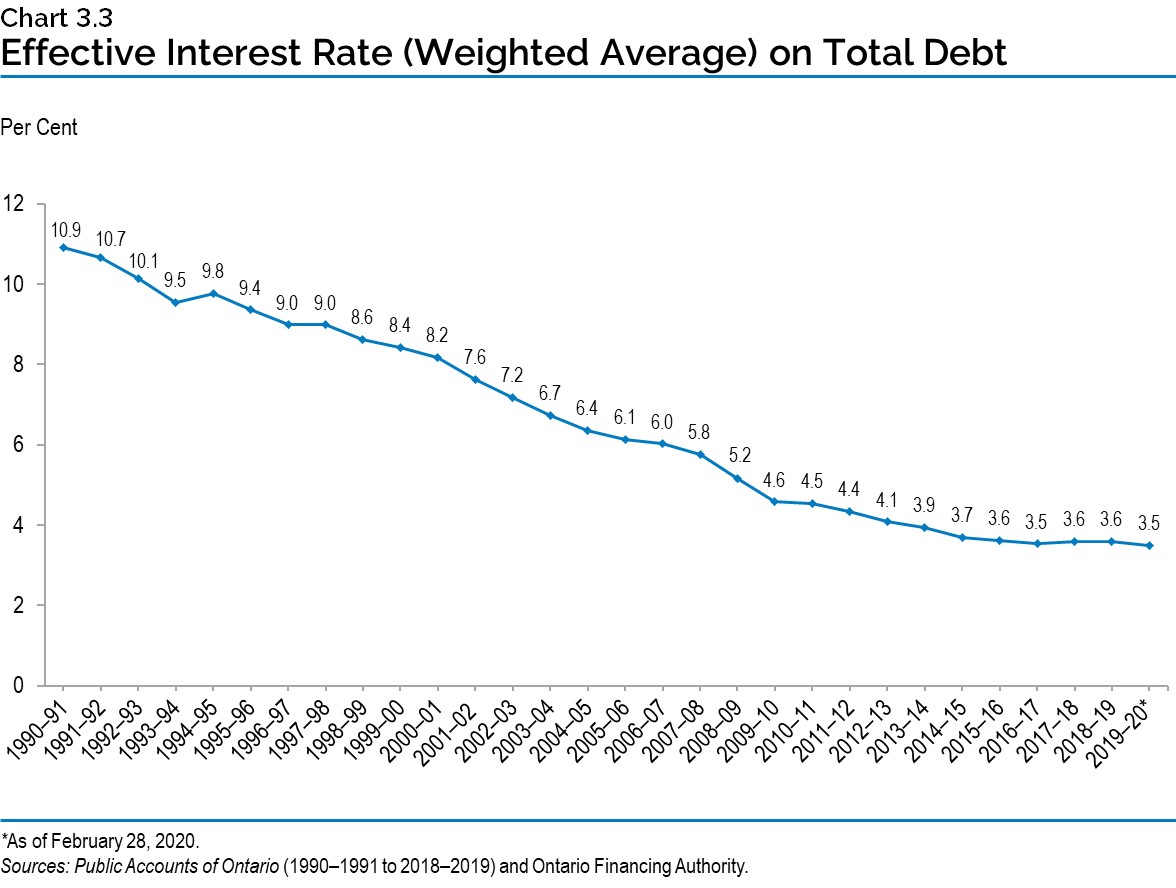
The three-decade decline in interest rates has meant IOD has not risen as quickly as the Province’s debt, even over the decade since the 2008 financial crisis, despite the Province’s debt load more than doubling since 2008–09. Chart 3.3 shows the declining effective interest rate the Province is paying on its total debt portfolio.
The interest rates the Province must pay on new or refinanced debt issued remain near historic lows. Chart 3.4 shows historic borrowing rates on debt issued and the prudent forecast used to estimate the future cost of borrowing or IOD expense.
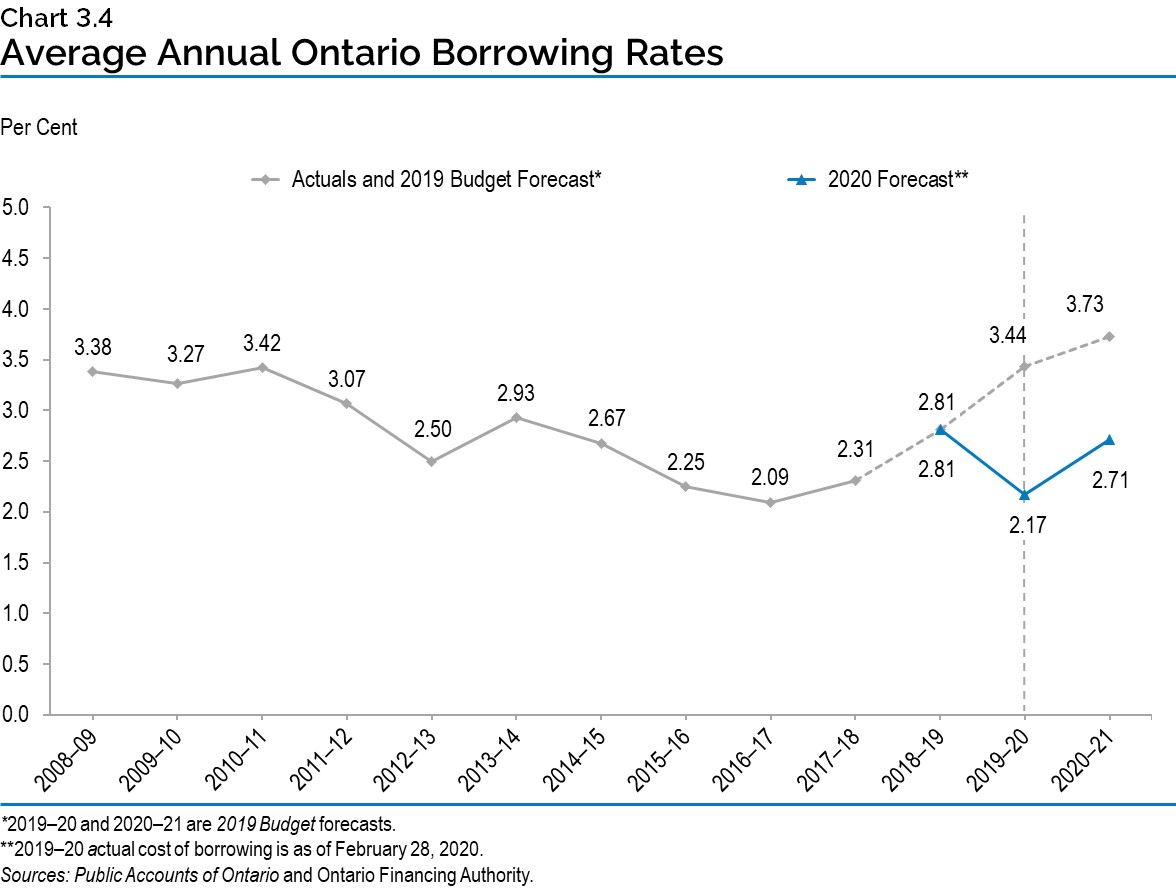
The Province’s average cost of borrowing in 2020–21 is forecast to be 2.71 per cent. This represents a prudent forecast, which the Province considers to be advisable in light of current financial market volatility. Both the U.S. Federal Reserve and the Bank of Canada cut interest rates in March. A one percentage point change in interest rates, either up or down, from the current forecast would have a corresponding change in the Province’s interest costs by over $400 million in the first full year.
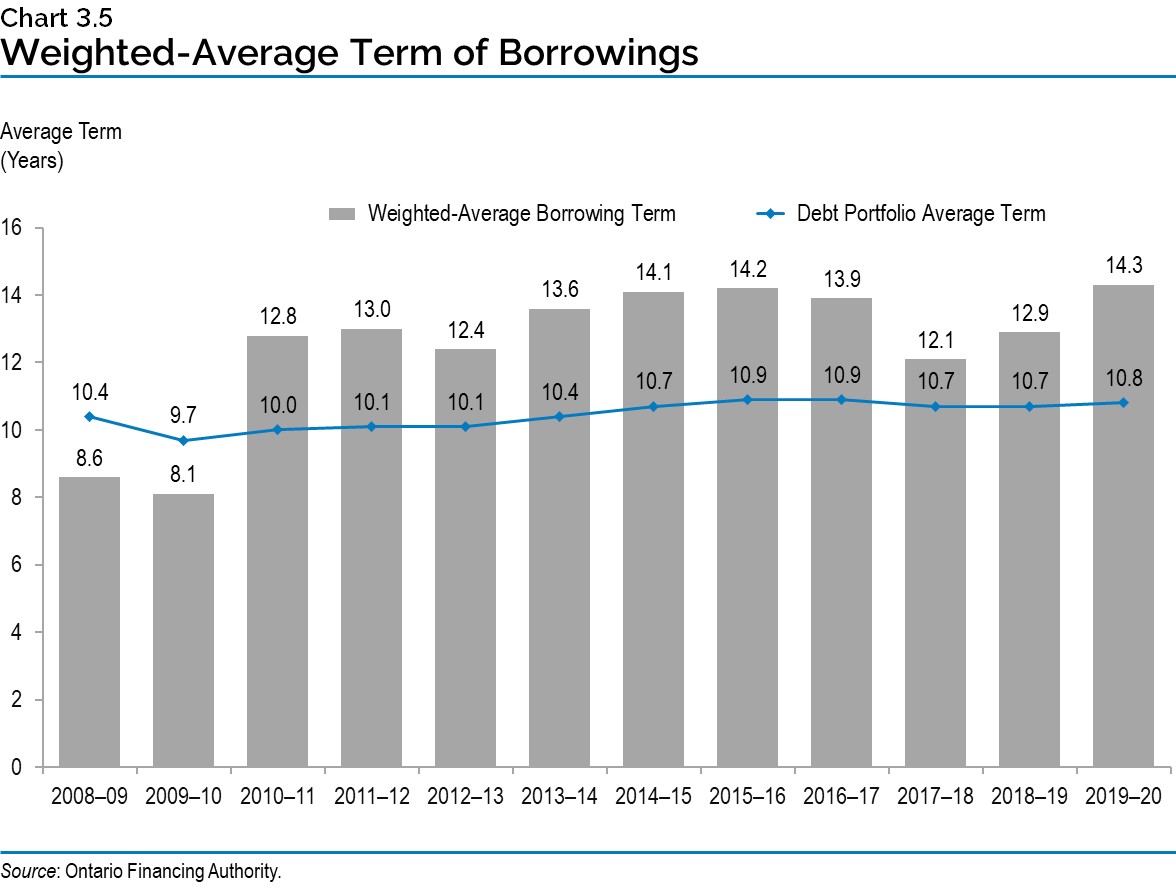
The Province has also protected the IOD forecast from the impact of possible increases in interest rates over the coming years by extending the term of its debt. Going back to the beginning of 2010–11, to lock in low rates and lower refinancing risks, Ontario has issued $91.1 billion of bonds 30 years or longer, or approximately one-quarter of total debt, including $10.9 billion in 2019–20.
As a result, the average term of Ontario’s debt portfolio has been extended, from 9.7 years in 2009–10 to 10.8 years in 2019–20. The Province monitors interest rates daily. With low interest rates the current plan remains to extend the term of the Province’s debt, subject to investor demand.
Ensuring Adequate Liquidity Levels
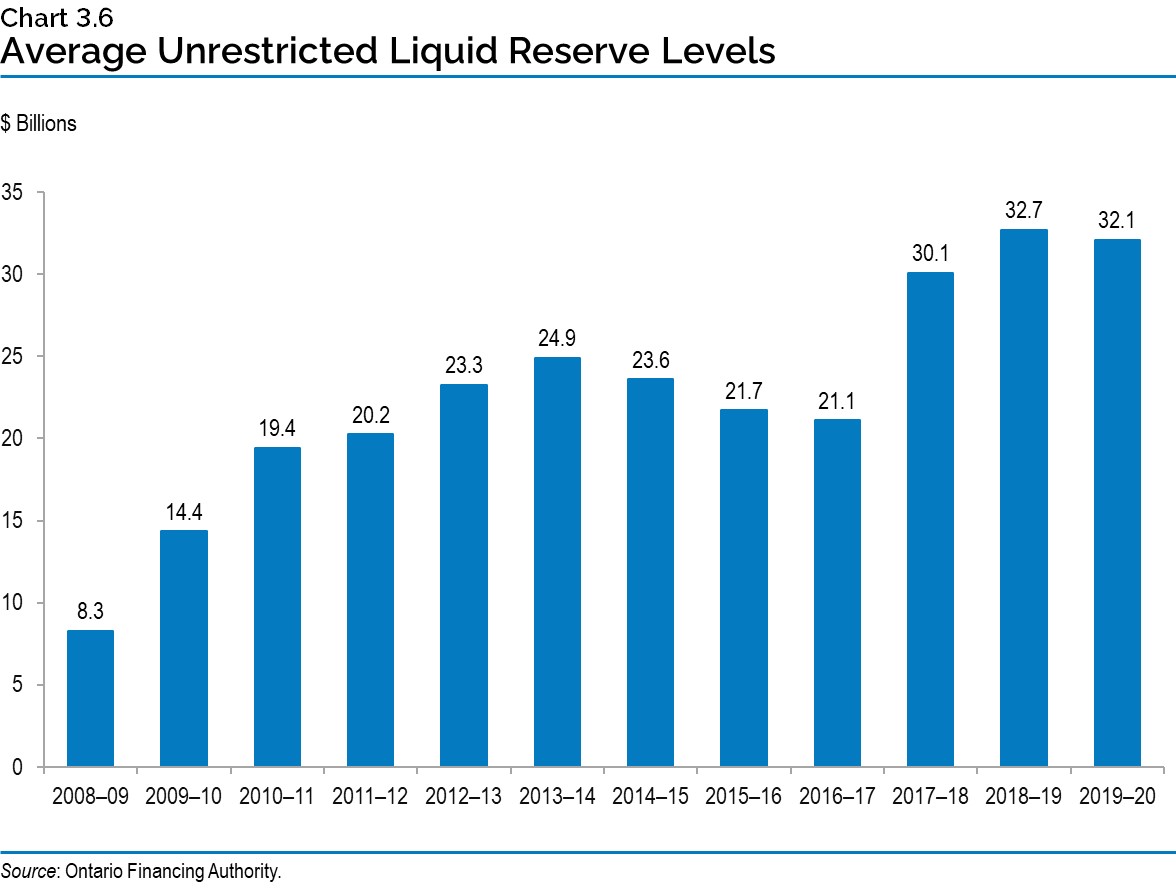
Coming out of the 2008 financial crisis, the Province responded to investor demand by creating large, liquid 10- and 30-year benchmark domestic bond issues beginning in 2009–10. This lowered Ontario’s borrowing costs while enhancing the Province’s access to capital. However, as a result of these large bond issues, the Province now has large cash outflows on single days, rather than having maturities and interest payments spread more evenly throughout the year. In anticipation of the need for cash reserves to meet these requirements for large outflows on a single day, the Province has built larger cash reserves, as noted in Chart 3.6.
The government balances the objective of minimizing the cost of holding liquid reserves against the need to always have enough cash on hand to pay its bills, refinance maturing debt and pay interest. Ontario has prefunded significantly for the upcoming fiscal year. The Province has large liquid reserve levels to withstand periods of financial market volatility, such as currently being experienced.
Consolidated Financial Tables
| Debt1 | 2015–16 | 2016–17 | 2017–18 | Actual 2018–19 |
Interim2 2019–20 |
Plan 2020–21 |
|---|---|---|---|---|---|---|
| Publicly Held Debt — Bonds3 | 293,935 | 299,356 | 315,247 | 334,940 | 343,847 | 361,497 |
| Publicly Held Debt — Treasury Bills | 13,921 | 16,120 | 17,528 | 17,546 | 19,927 | 21,927 |
| Publicly Held Debt — U.S. Commercial Paper4 | 6,987 | 5,369 | 3,865 | 3,863 | 4,482 | 4,482 |
| Publicly Held Debt — Infrastructure Ontario (IO)5 | 300 | 300 | 300 | 300 | 300 | 300 |
| Publicly Held Debt — Other | 301 | 296 | 287 | 292 | 256 | 244 |
| Total Publicly Held Debt | 315,444 | 321,441 | 337,227 | 356,941 | 368,812 | 388,450 |
| Non-Public Debt | 11,969 | 11,661 | 11,433 | 11,039 | 10,005 | 9,306 |
| Total Debt | 327,413 | 333,102 | 348,660 | 367,980 | 378,817 | 397,756 |
| Less: Holdings of Ontario bonds and treasury bills | (7,663) | (8,832) | (11,775) | (13,716) | (7,621) | (85) |
| Revised Total Debt | 319,750 | 324,270 | 336,885 | 354,264 | 371,196 | 397,671 |
| Cash and Temporary Investments Excluding Broader Public Sector (BPS)6 | (18,102) | (14,590) | (19,571) | (26,250) | (26,805) | (30,241) |
| Total Debt Net of Cash and Temporary Investments | 301,648 | 309,680 | 317,314 | 328,014 | 344,391 | 367,430 |
| Other Net (Assets)/Liabilities7 | (10,415) | (9,991) | (6,791) | (3,422) | (1,530) | (159) |
| BPS Net Debt | 15,124 | 14,388 | 13,311 | 13,904 | 12,299 | 11,904 |
| Net Debt | 306,357 | 314,077 | 323,834 | 338,496 | 355,160 | 379,175 |
| Non-Financial Assets8 | (103,343) | (108,138) | (114,811) | (121,854) | (129,534) | (135,539) |
| Accumulated Deficit | 203,014 | 205,939 | 209,023 | 216,642 | 225,626 | 243,636 |
[1] Includes debt issued by the Province and all Government Organizations.
[2] Interim represents the March 2020 Economic and Fiscal Update projections for the 2019–20 fiscal year.
[3], [4] All balances are expressed in Canadian dollars. The balances above reflect the effect of related derivative contracts.
[5] IO’s interim 2019–20 debt is composed of Infrastructure Renewal Bonds ($300 million). IO's debt is not guaranteed by the Province.
[6] Cash amount excludes any holdings in Ontario bonds and T-bills.
[7] Other Net (Assets)/Liabilities include accounts receivable, loans receivable, advances and investments in Government Business Enterprises (GBEs) offset by accounts payable, accrued liabilities, deferred revenue and capital contributions, pensions and other employee future benefits, and other liabilities.
[8] Non-financial assets include the tangible capital assets of the Province and broader public sector.
Source: Ontario Ministry of Finance.
Chart Descriptions
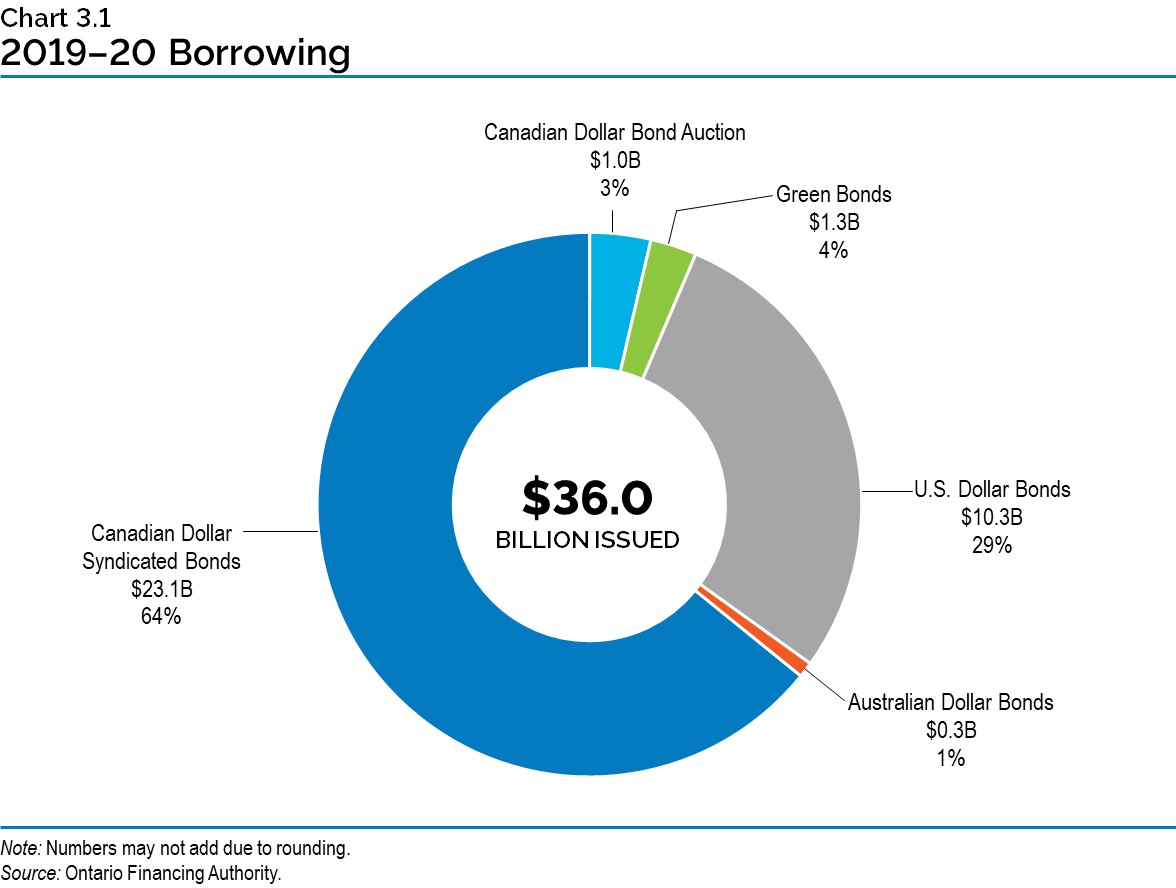
Chart 3.1: 2019–20 Borrowing
$36.0 billion of long-term public borrowing has been completed for fiscal year 2019–20. This consisted of $23.1 billion (64 per cent) of Canadian dollar syndicated bonds, $1.0 billion of a Canadian dollar bond auction (3 per cent), $1.3 billion of Green Bonds (4 per cent), $10.3 billion (29 per cent) of U.S. dollar bonds, and $0.3 billion (1 per cent) of Australian dollar bonds.
Note: Numbers may not add due to rounding.
Source: Ontario Financing Authority.
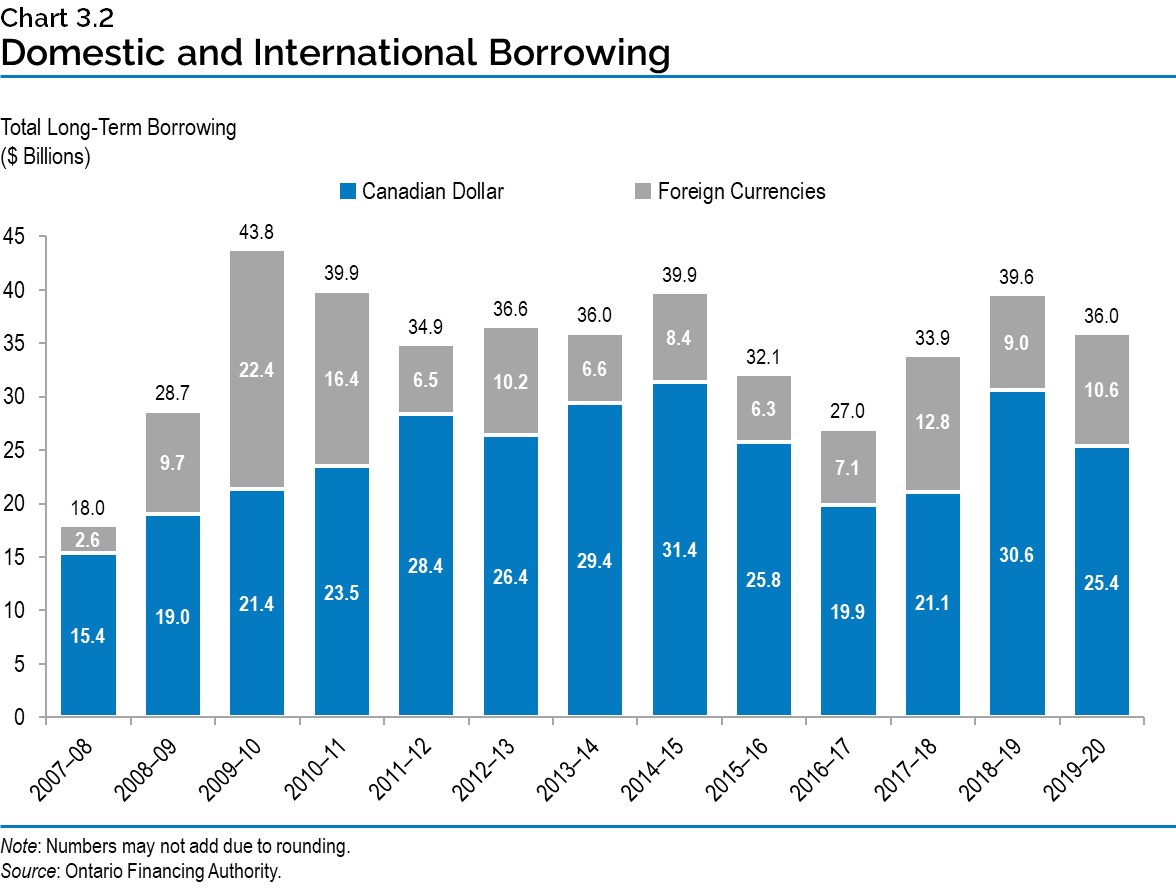
Chart 3.2: Domestic and International Borrowing
The Province’s total long-term borrowing in 2019–20 is forecast to be $36.0 billion — $25.4 billion was borrowed in the Canadian dollar market and $10.6 billion was borrowed in foreign currencies.
| Year | Canadian Dollar ($ Billions) |
Foreign Currencies ($ Billions) |
Total ($ Billions) |
|---|---|---|---|
| 2007–08 | 15.4 | 2.6 | 18.0 |
| 2008–09 | 19.0 | 9.7 | 28.7 |
| 2009–10 | 21.4 | 22.4 | 43.8 |
| 2010–11 | 23.5 | 16.4 | 39.9 |
| 2011–12 | 28.4 | 6.5 | 34.9 |
| 2012–13 | 26.4 | 10.2 | 36.6 |
| 2013–14 | 29.4 | 6.6 | 36.0 |
| 2014–15 | 31.4 | 8.4 | 39.9 |
| 2015–16 | 25.8 | 6.3 | 32.1 |
| 2016–17 | 19.9 | 7.1 | 27.0 |
| 2017–18 | 21.1 | 12.8 | 33.9 |
| 2018–19 | 30.6 | 9.0 | 39.6 |
| 2019–20 | 25.4 | 10.6 | 36.0 |
Note: Numbers may not add due to rounding.
Source: Ontario Financing Authority.
Chart 3.3: Effective Interest Rate (Weighted-Average) on Total Debt
As of February 28, 2020, the effective interest rate (calculated as a weighted average) for 2019–20 is forecast to be 3.5 per cent on the province’s total debt.
| Year | Effective Interest Rate (%) |
|---|---|
| 1990–91 | 10.9 |
| 1991–92 | 10.7 |
| 1992–93 | 10.1 |
| 1993–94 | 9.5 |
| 1994–95 | 9.8 |
| 1995–96 | 9.4 |
| 1996–97 | 9.0 |
| 1997–98 | 9.0 |
| 1998–99 | 8.6 |
| 1999–00 | 8.4 |
| 2000–01 | 8.2 |
| 2001–02 | 7.6 |
| 2002–03 | 7.2 |
| 2003–04 | 6.7 |
| 2004–05 | 6.4 |
| 2005–06 | 6.1 |
| 2006–07 | 6.0 |
| 2007–08 | 5.8 |
| 2008–09 | 5.2 |
| 2009–10 | 4.6 |
| 2010–11 | 4.5 |
| 2011–12 | 4.4 |
| 2012–13 | 4.1 |
| 2013–14 | 3.9 |
| 2014–15 | 3.7 |
| 2015–16 | 3.6 |
| 2016–17 | 3.5 |
| 2017–18 | 3.6 |
| 2018–19 | 3.6 |
| 2019–20 | 3.5 |
Sources: Public Accounts of Ontario (1990–1991 to 2018–2019) and Ontario Financing Authority.
Chart 3.4: Average Annual Ontario Borrowing Rates
The actual year-to-date cost of borrowing is 2.17 per cent, as of February 28, 2020.
| Year | Actuals and 2019 Budget Forecast* (%) |
Actual year-to-date cost of borrowing 2019–20 |
2020 Forecast (%) |
|---|---|---|---|
| 2008–09 | 3.38 | ||
| 2009–10 | 3.27 | – | – |
| 2010–11 | 3.42 | – | – |
| 2011–12 | 3.07 | – | – |
| 2012–13 | 2.50 | – | – |
| 2013–14 | 2.93 | – | – |
| 2014–15 | 2.67 | – | – |
| 2015–16 | 2.25 | – | – |
| 2016–17 | 2.09 | – | – |
| 2017–18 | 2.31 | – | – |
| 2018–19 | 2.81 | – | – |
| 2019–20 | 3.44 | 2.17 | – |
| 2020–21 | 3.73 | – | 2.71 |
* 2019–20 and 2020–21 are 2019 Budget forecasts.
Note: 2019–20 actual cost of borrowing is as of February 28, 2020.
Sources: Public Accounts of Ontario (1990–1991 to 2018–2019) and Ontario Financing Authority.
Chart 3.5: Weighted-Average Term of Borrowings
The average term of Ontario’s debt portfolio has been extended from 9.7 years in 2009–10 to 10.8 years as at March 31, 2020. The weighted-average borrowing term for 2019–20 was 14.3 years.
| Year | 2008–09 | 2009–10 | 2010–11 | 2011–12 | 2012–13 | 2013–14 | 2014–15 | 2015–16 | 2016–17 | 2017–18 | 2018–19 | 2019–20 |
|---|---|---|---|---|---|---|---|---|---|---|---|---|
| Weighted-Average Borrowing Term (Years) | 8.6 | 8.1 | 12.8 | 13.0 | 12.4 | 13.6 | 14.1 | 14.2 | 13.9 | 12.1 | 12.9 | 14.3 |
| Debt Portfolio Average Term (Years) | 10.4 | 9.7 | 10.0 | 10.1 | 10.1 | 10.4 | 10.7 | 10.9 | 10.9 | 10.7 | 10.7 | 10.8 |
Source: Ontario Financing Authority.
Chart 3.6: Average Unrestricted Liquid Reserve Levels
Average unrestricted liquid reserve levels in 2019–20 are forecasted to be $32.1 billion as of March 31, 2020.
| Year | Average Unrestricted Liquid Reserve Levels ($ billions) |
|---|---|
| 2008–09 | 8.2 |
| 2009–10 | 14.4 |
| 2010–11 | 19.4 |
| 2011–12 | 20.2 |
| 2012–13 | 23.3 |
| 2013–14 | 24.9 |
| 2014–15 | 23.6 |
| 2015–16 | 21.7 |
| 2016–17 | 21.1 |
| 2017–18 | 30.1 |
| 2018–19 | 32.7 |
| 2019–20 | 32.1 |
Source: Ontario Financing Authority.