Introduction
Thanks in part to the government’s unprecedented measures to protect jobs and the economy, Ontario has made significant progress towards recovering from the COVID-19 pandemic. Ontario’s real gross domestic product (GDP) increased 4.3 per cent in 2021, and employment rose by 344,800 net jobs in 2021 or 4.9 per cent, the strongest annual pace of job growth on record.1
Ontario’s real GDP is projected to increase by 3.7 per cent in 2022, 3.1 per cent in 2023, and then growth is expected to moderate to 2.0 per cent in 2024 and 1.9 per cent in 2025. For the purposes of prudent fiscal planning, these projections are slightly below the average of private-sector forecasts.
| 2020 | 2021 | 2022p | 2023p | 2024p | 2025p | |
|---|---|---|---|---|---|---|
| Real GDP Growth | (5.1) | 4.3 | 3.7 | 3.1 | 2.0 | 1.9 |
| Nominal GDP Growth | (2.8) | 12.0 | 6.7 | 5.1 | 4.2 | 4.1 |
| Employment Growth | (4.8) | 4.9 | 3.9 | 2.0 | 1.7 | 1.2 |
| CPI Inflation | 0.7 | 3.5 | 4.7 | 2.5 | 2.1 | 2.1 |
Table 2.1 footnotes:
p = Ontario Ministry of Finance planning projection based on external sources.
Sources: Statistics Canada and Ontario Ministry of Finance.
Recent Economic Performance
Economies across the world were impacted by the COVID-19 pandemic, with many posting significant real GDP declines in 2020. This has been followed by a robust rebound, with most G7 economies now approaching, or exceeding, pre-pandemic levels of real GDP.
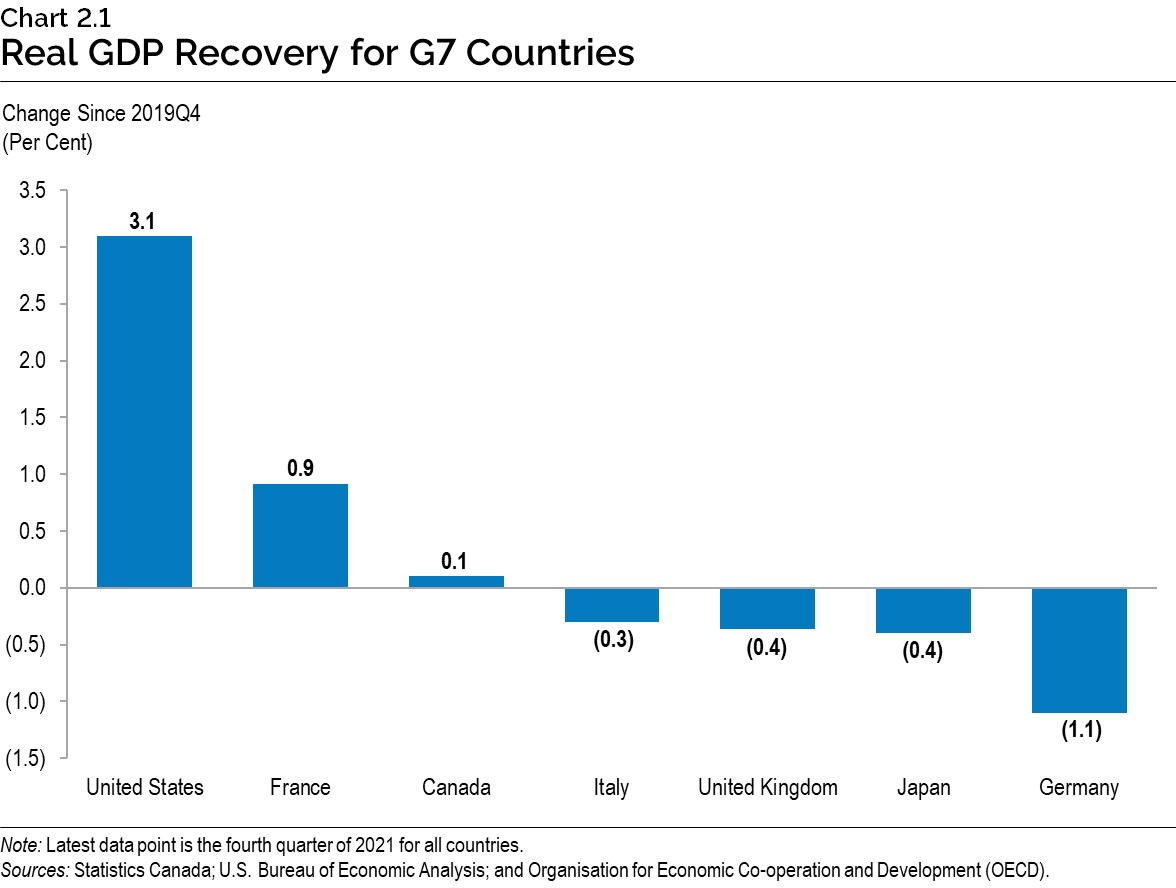
Canada’s real GDP rebounded by 4.6 per cent in 2021, following a 5.2 per cent decline in 2020. Ontario’s real GDP increased 4.3 per cent in 2021, following a 5.1 per cent decline in 2020. As of the fourth quarter of 2021, both Ontario’s and Canada’s real GDP were 0.1 per cent above their pre-pandemic levels. Ontario’s nominal GDP grew by a very strong 12.0 per cent in 2021, surpassing the $1 trillion mark for the first time in the fourth quarter of 2021.
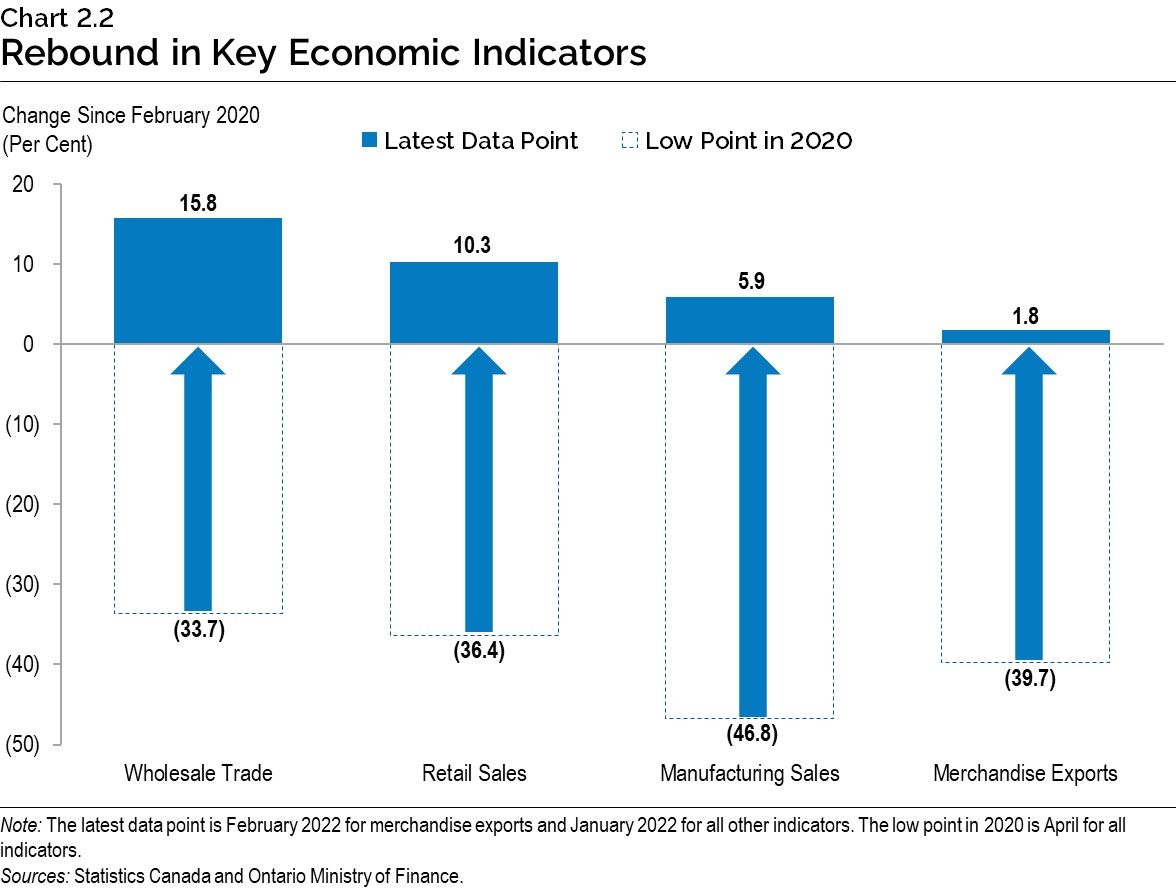
Many other Ontario economic indicators have also rebounded significantly from their pandemic lows, including wholesale trade, retail sales, manufacturing sales and merchandise exports.
Ontario Labour Market
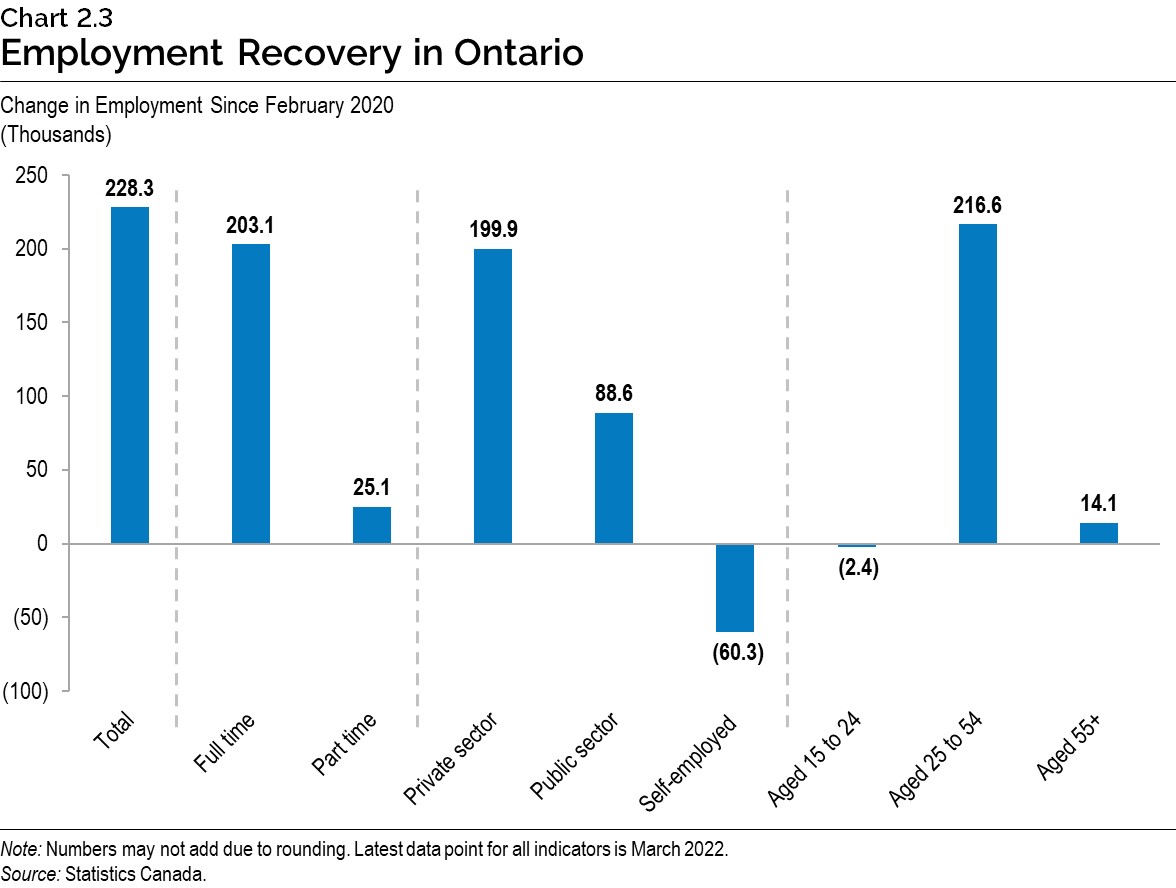
The COVID-19 pandemic had a significant impact on employment in the province. After declining by 355,300 in 2020, employment in Ontario rose by 344,800 in 2021, with the majority of the gains in full-time positions and in the private sector. As of March 2022, employment has recovered to 228,300 above the pre-pandemic level.
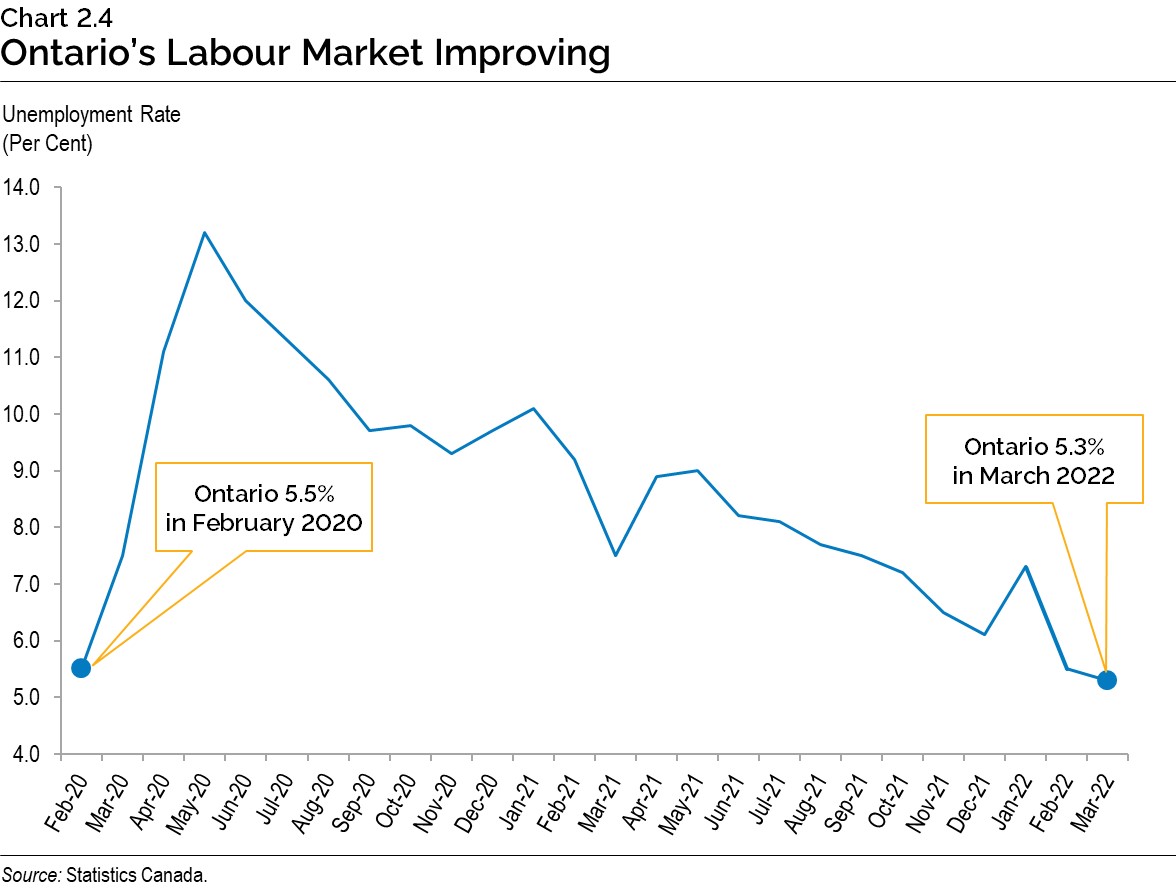
After reaching a pandemic high of 13.2 per cent in May 2020, the Ontario unemployment rate declined to 5.3 per cent in March 2022, lower than the pre-pandemic February 2020 rate of 5.5 per cent.
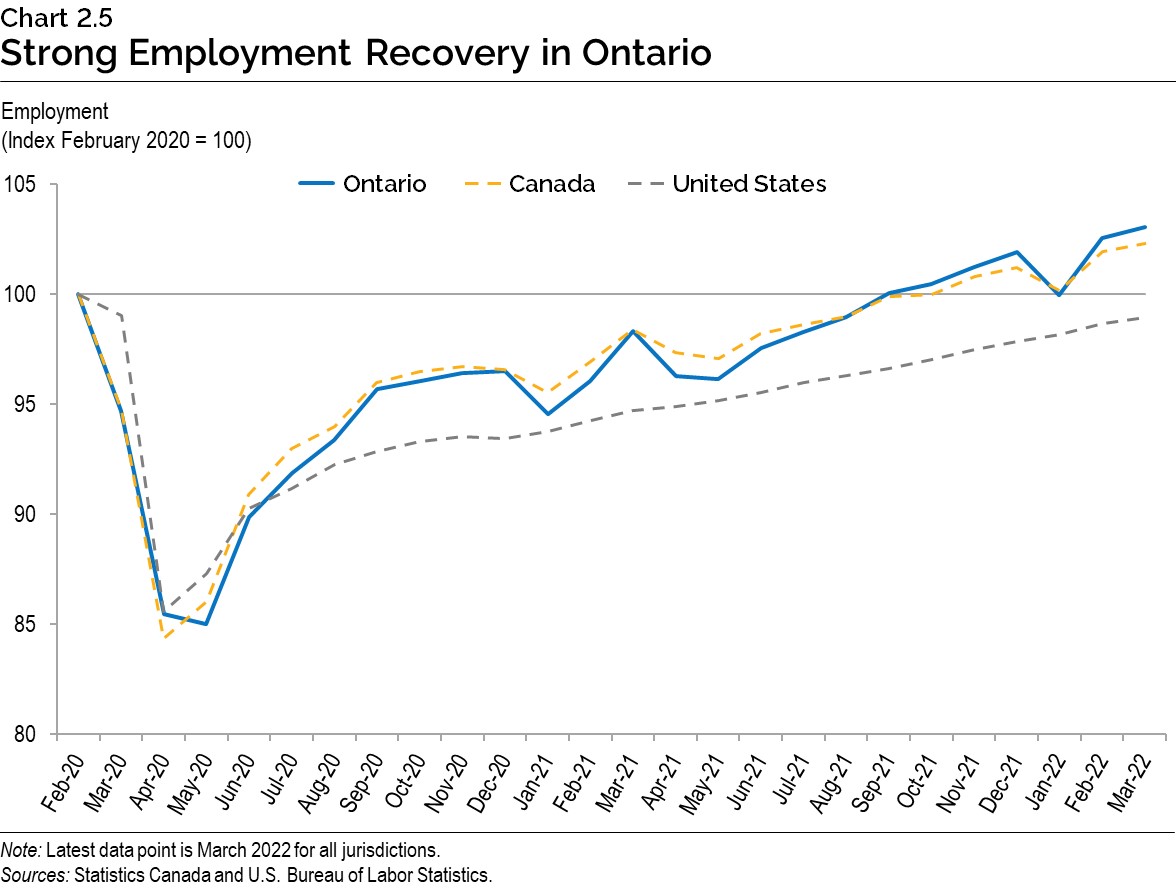
As of March 2022, employment in Ontario and Canada was 3.0 per cent and 2.3 per cent above the pre-pandemic February 2020 level, respectively. Employment in the United States remained 1.0 per cent below its pre-pandemic level.
Economic Outlook
The Ontario Ministry of Finance consults with private-sector economists and tracks their forecasts to inform the government’s economic planning assumptions.
Private-sector forecasters, on average, are projecting Ontario’s real GDP to grow by 4.1 per cent in 2022, 3.2 per cent in 2023, 2.1 per cent in 2024, and 2.0 per cent in 2025. The Ontario Ministry of Finance’s real GDP projections are set below the average of private-sector forecasts in each year for prudent planning purposes. Three external economic experts reviewed the Ontario Ministry of Finance’s economic assumptions and found them to be reasonable.2
| 2022 | 2023 | 2024 | 2025 | |
|---|---|---|---|---|
| Quantitative Economic Decisions, Inc. (February) | 4.2 | 2.8 | 2.6 | 2.3 |
| Stokes Economics (February) | 4.3 | 2.9 | 2.1 | 2.0 |
| Desjardins Group (February) | 3.9 | 3.0 | 2.0 | 1.7 |
| The Conference Board of Canada (February) | 3.8 | 3.4 | 1.3 | 1.5 |
| National Bank of Canada (February) | 3.9 | 2.6 | – | – |
| University of Toronto (February) | 4.8 | 3.8 | 2.8 | 2.5 |
| Central 1 Credit Union (February) | 3.4 | 3.6 | 2.2 | – |
| Laurentian Bank Securities (March) | 4.8 | 3.4 | – | – |
| BMO Capital Markets (March) | 4.1 | 3.7 | – | – |
| Royal Bank of Canada (March) | 4.2 | 2.8 | – | – |
| Scotiabank (March) | 3.9 | 3.1 | – | – |
| CIBC Capital Markets (March) | 3.9 | 2.8 | – | – |
| TD Bank Group (March) | 4.0 | 3.1 | 1.7 | 1.7 |
| Private-Sector Survey Average | 4.1 | 3.2 | 2.1 | 2.0 |
| Ontario’s Planning Assumption | 3.7 | 3.1 | 2.0 | 1.9 |
Table 2.2 footnotes:
Sources: Ontario Ministry of Finance Survey of Forecasters (March 8, 2022) and Ontario Ministry of Finance.
On average, private-sector forecasters are projecting that Ontario’s nominal GDP will grow by 7.3 per cent in 2022, 5.2 per cent in 2023, 4.3 per cent in 2024, and 4.2 per cent in 2025. The Ontario Ministry of Finance’s nominal GDP projections are set below the average of private-sector forecasts in each year for prudent planning purposes. For 2022, the planning assumption is 0.6 percentage points below the private-sector average to reflect the continued elevated degree of uncertainty around GDP inflation.
| 2022 | 2023 | 2024 | 2025 | |
|---|---|---|---|---|
| Quantitative Economic Decisions, Inc. (February) | 7.0 | 5.5 | 5.2 | 4.9 |
| Stokes Economics (February) | 8.1 | 5.5 | 4.3 | 4.3 |
| Desjardins Group (February) | 6.4 | 4.7 | – | – |
| The Conference Board of Canada (February) | 5.9 | 4.4 | 3.2 | 3.4 |
| National Bank of Canada (February) | 6.3 | 3.0 | – | – |
| University of Toronto (February) | 7.7 | 6.0 | 5.0 | 4.6 |
| Central 1 Credit Union (February) | 6.2 | 5.8 | 4.2 | – |
| Laurentian Bank Securities (March) | 8.5 | 5.3 | – | – |
| BMO Capital Markets (March) | 7.6 | 6.4 | – | – |
| Royal Bank of Canada (March) | 7.3 | 4.9 | – | – |
| Scotiabank (March) | 7.6 | 6.0 | – | – |
| CIBC Capital Markets (March) | 8.4 | 4.3 | – | – |
| TD Bank Group (March) | 7.6 | 5.3 | 3.7 | 3.6 |
| Private-Sector Survey Average | 7.3 | 5.2 | 4.3 | 4.2 |
| Ontario’s Planning Assumption | 6.7 | 5.1 | 4.2 | 4.1 |
Table 2.3 footnotes:
Sources: Ontario Ministry of Finance Survey of Forecasters (March 8, 2022) and Ontario Ministry of Finance.
Global Economic Environment
The global economic outlook remains resilient despite impacts on business activity due to the Omicron variant of COVID-19, as well as Russia’s invasion of Ukraine, both of which have exacerbated supply chain disruptions. In addition, inflation continues to be elevated in many countries. The International Monetary Fund (IMF) estimates that global real GDP rose by 5.9 per cent in 2021 and projects global real GDP growth of 4.4 per cent in 2022 and 3.8 per cent in 2023.
U.S. real GDP increased by 5.7 per cent in 2021 and is projected to increase by 3.7 per cent in 2022 and 2.6 per cent in 2023. Euro area real GDP rose 5.2 per cent in 2021 and is projected to rise 3.9 per cent in 2022 and 2.5 per cent in 2023. China’s real GDP is estimated to have risen 8.1 per cent in 2021 and is forecast to rise 4.8 per cent in 2022 and 5.2 per cent in 2023.
| 2020 | 2021 | 2022p | 2023p | 2024p | 2025p | |
|---|---|---|---|---|---|---|
| World Real GDP Growth (Per Cent) | (3.1) | 5.9e | 4.4 | 3.8 | 3.4 | 3.3 |
| U.S. Real GDP Growth (Per Cent) | (3.4) | 5.7 | 3.7 | 2.6 | 2.1 | 2.0 |
| West Texas Intermediate (WTI) Crude Oil ($US per Barrel) | 39 | 68 | 82 | 75 | 67 | 68 |
| Canadian Dollar (Cents US) | 74.6 | 79.8 | 79.5 | 79.5 | 79.2 | 80.0 |
| Three-Month Treasury Bill Rate1 (Per Cent) | 0.4 | 0.1 | 0.9 | 1.7 | 2.0 | 2.1 |
| 10-Year Government Bond Rate2 (Per Cent) | 0.7 | 1.4 | 2.0 | 2.5 | 2.8 | 2.9 |
Table 2.4 footnotes:
e = International Monetary Fund estimate.
p = Ontario Ministry of Finance planning projection based on external sources.
[1], [2] Government of Canada interest rates.
Sources: International Monetary Fund World Economic Outlook (January 2022 and October 2021); U.S. Bureau of Economic Analysis; U.S. Energy Information Administration; Bank of Canada; Blue Chip Economic Indicators (February 2022 and October 2021); and Ontario Ministry of Finance Survey of Forecasters (March 8, 2022).
Financial Markets and Other External Factors
Elevated consumer price inflation has prompted key central banks, including the U.S. Federal Reserve and the European Central Bank, to begin withdrawing some accommodative monetary policies introduced to support the economic recovery, including low policy interest rates and asset purchase programs. Several central banks have begun raising policy rates, putting upward pressure on government bond rates.
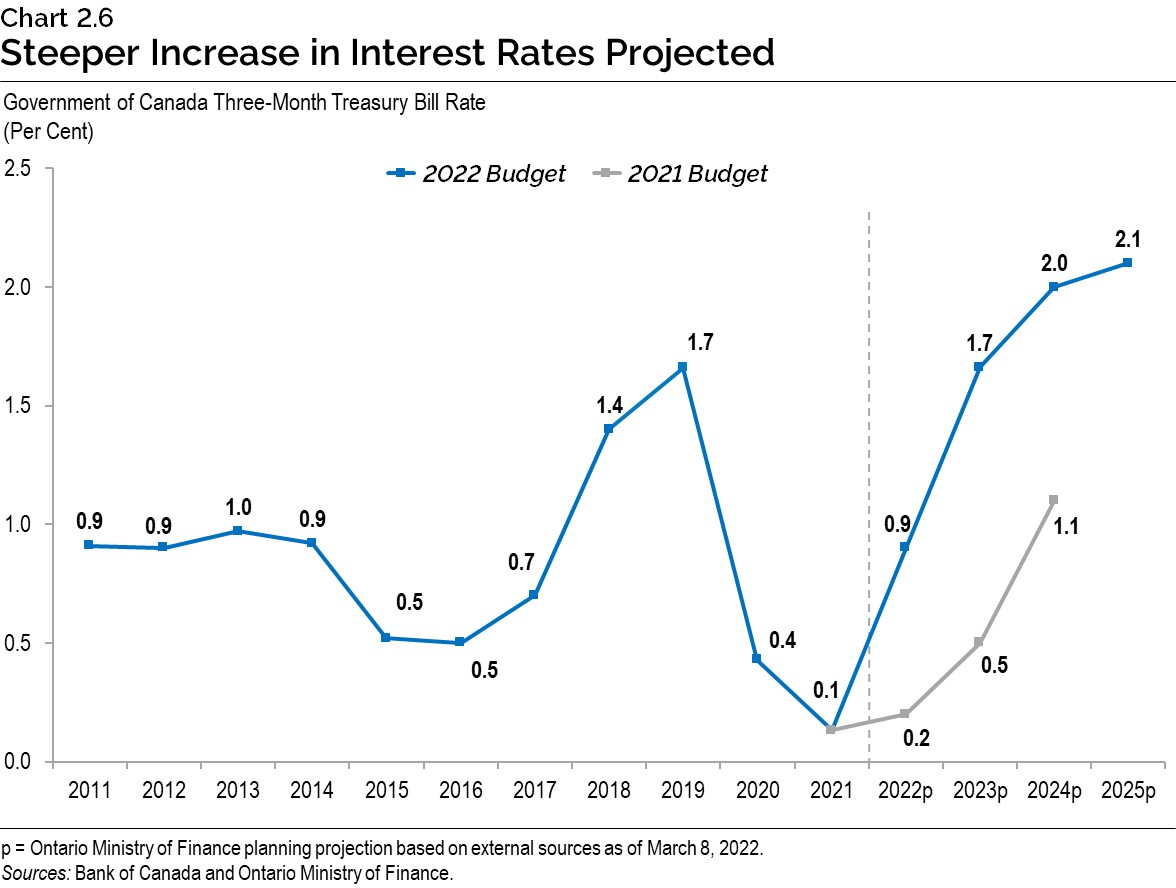
The Bank of Canada raised its overnight rate in March 2022 and has signaled it will further raise policy interest rates in the coming months. The Bank of Canada ended its quantitative easing program at the end of October 2021. The Government of Canada three-month treasury bill rate is expected to rise from 0.1 per cent in 2021 to 0.9 per cent in 2022, before increasing to 2.1 per cent in 2025. Similarly, the Government of Canada 10-year bond rate is projected to increase from 1.4 per cent in 2021 to 2.0 per cent in 2022 and then rise to 2.9 per cent in 2025.
West Texas Intermediate (WTI) oil prices are expected to rise from US$68 per barrel in 2021 to US$82 per barrel in 2022. However, an expected pickup in global oil production should moderate oil prices over the forecast period. By 2025, the WTI oil price is projected to be US$68 per barrel.
The Canadian dollar was 79.8 cents US in 2021 and is expected to remain close to 80 cents US over the forecast period.
Details of Ontario’s Economic Outlook
The Ontario Ministry of Finance projects real GDP to rise by 3.7 per cent in 2022, 3.1 per cent in 2023, 2.0 per cent in 2024 and 1.9 per cent in 2025.
| 2020 | 2021 | 2022p | 2023p | 2024p | 2025p | |
|---|---|---|---|---|---|---|
| Real Gross Domestic Product | (5.1) | 4.3 | 3.7 | 3.1 | 2.0 | 1.9 |
| Nominal Gross Domestic Product | (2.8) | 12.0 | 6.7 | 5.1 | 4.2 | 4.1 |
| Compensation of Employees | (0.3) | 9.2 | 5.6 | 4.6 | 4.6 | 4.1 |
| Net Operating Surplus — Corporations | 10.2 | 24.6 | 4.6 | 5.8 | 1.6 | 4.2 |
| Nominal Household Consumption | (7.4) | 7.1 | 8.8 | 6.3 | 4.7 | 4.6 |
| Other Economic Indicators — Employment | (4.8) | 4.9 | 3.9 | 2.0 | 1.7 | 1.2 |
| Other Economic Indicators — Job Creation (000s) | (355) | 345 | 287 | 153 | 133 | 95.3 |
| Other Economic Indicators — Unemployment Rate (Per Cent) | 9.6 | 8.0 | 6.1 | 5.7 | 5.6 | 5.5 |
| Other Economic Indicators — Consumer Price Index | 0.7 | 3.5 | 4.7 | 2.5 | 2.1 | 2.1 |
| Other Economic Indicators — Housing Starts (000s) | 81.3 | 99.6 | 86.9 | 84.0 | 87.3 | 87.8 |
| Other Economic Indicators — Home Resales | 8.8 | 18.6 | (11.3) | 1.5 | 1.2 | 1.2 |
| Other Economic Indicators — Home Resale Prices | 16.0 | 23.6 | 9.3 | 2.6 | 4.0 | 4.0 |
| Key External Variables — U.S. Real Gross Domestic Product | (3.4) | 5.7 | 3.7 | 2.6 | 2.1 | 2.0 |
| Key External Variables — WTI Crude Oil ($US per Barrel) | 39 | 68 | 82 | 75 | 67 | 68 |
| Key External Variables — Canadian Dollar (Cents US) | 74.6 | 79.8 | 79.5 | 79.5 | 79.2 | 80.0 |
| Key External Variables — Three-Month Treasury Bill Rate (Per Cent)1 | 0.4 | 0.1 | 0.9 | 1.7 | 2.0 | 2.1 |
| Key External Variables — 10-Year Government Bond Rate (Per Cent)2 | 0.7 | 1.4 | 2.0 | 2.5 | 2.8 | 2.9 |
Table 2.5 footnotes:
p = Ontario Ministry of Finance planning projection based on external sources as of March 8, 2022.
[1], [2] Government of Canada interest rates.
Sources: Statistics Canada; Canada Mortgage and Housing Corporation; Canadian Real Estate Association; Bank of Canada; United States Bureau of Economic Analysis; Blue Chip Economic Indicators (February 2022 and October 2021); U.S. Energy Information Administration; and Ontario Ministry of Finance.
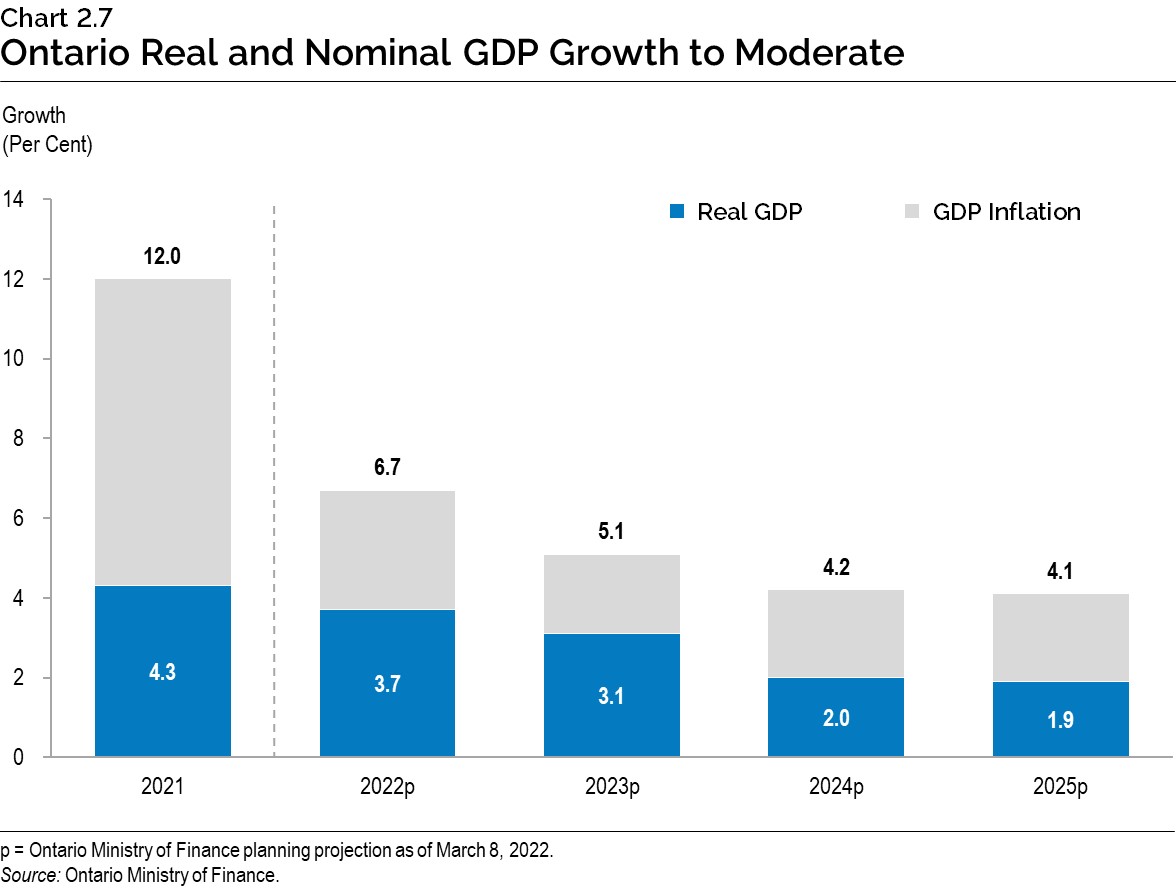
The Ontario Ministry of Finance estimates that Ontario nominal GDP increased by 12.0 per cent in 2021, the fastest pace of nominal GDP growth since 1984. This largely reflects elevated GDP inflation due to strong economy-wide price increases amid supply constraints and strong demand.
Nominal GDP is projected to grow by 6.7 per cent in 2022 and 5.1 per cent in 2023 before moderating to 4.2 per cent in 2024 and 4.1 per cent in 2025.
Employment, Household Incomes and Spending
Employment quickly rebounded from a decline at the beginning of 2022 and is projected to grow strongly by 3.9 per cent for the year. Continued employment gains over the outlook period are projected to lower the unemployment rate from 8.0 per cent in 2021 to 6.1 per cent in 2022 and then 5.5 per cent by 2025.
Strong employment and wage gains support a projected 5.6 per cent increase in compensation of employees in 2022. Increased disposable income over the COVID-19 pandemic, in part due to government supports as well as decreased discretionary spending, have resulted in higher savings by many households. These savings, along with growing incomes and increased spending opportunities, are projected to contribute to robust nominal household spending growth of 8.8 per cent in 2022. Household spending is expected to remain strong over the projection period.
Housing
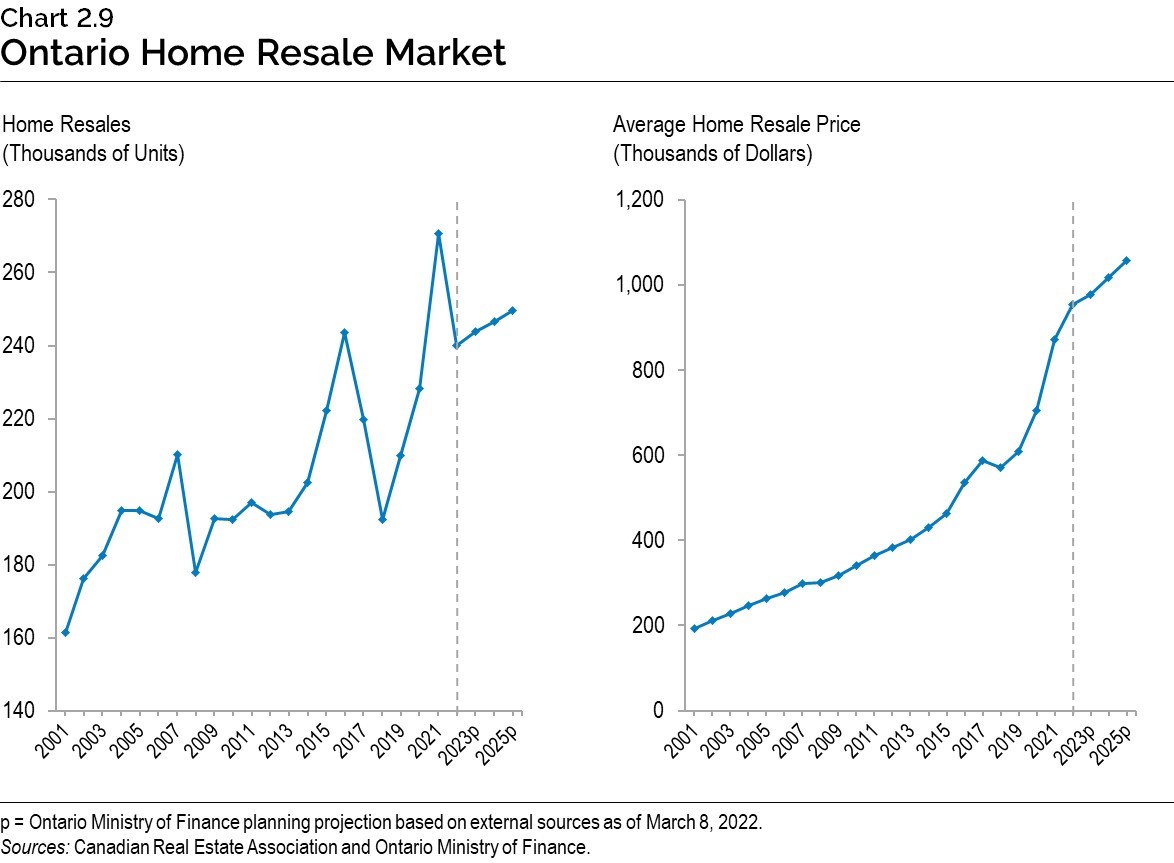
After declining during the early months of the COVID-19 pandemic, Ontario home resales surpassed their February 2020 pre-pandemic level by July 2020 and subsequently peaked in March 2021. Although activity has since moderated, in February 2022, home resales were 23.6 per cent higher than their February 2020 level. Home resale prices have also increased strongly — by February 2022, the average home resale price in Ontario was 53.8 per cent higher than the February 2020 pre-pandemic level.
Housing market activity is expected to moderate from elevated levels in 2021. Home resales are expected to decline 11.3 per cent in 2022 as interest rates rise and housing market activity returns to growth more consistent with fundamental drivers of housing demand, such as population growth. Strong momentum late in 2021 and early 2022 is projected to result in a 9.3 per cent increase in home resale prices in 2022, before price growth moderates closer to historical rates over the 2023 to 2025 period. For details on the government’s plan to make it easier to buy a home over the long term, see Chapter 1, Section D: Keeping Costs Down.
Risks to the Outlook
The evolution of the COVID-19 pandemic remains an ongoing source of uncertainty, and the potential emergence of new variants of the virus remains a key risk for the Ontario economy. As well, the invasion of Ukraine by Russia is a significant additional source of uncertainty. Heightened inflation and supply chain disruptions continue to pose ongoing risks to the economic outlook.
In response to elevated consumer price inflation, central banks have begun to withdraw extraordinary monetary policy stimulus introduced during the pandemic. The Bank of Canada and the U.S. Federal Reserve expect to continue raising policy interest rates through 2022. Although current high rates of inflation are expected to moderate as the effects of the pandemic and supply chain disruptions recede and monetary policy normalizes, higher-than-expected inflation could prompt a stronger response from central banks.
Supply chains around the world continue to be disrupted due to pandemic-related restrictions as well as sharp shifts in consumer preferences, such as higher spending on goods relative to services. Although these disruptions are expected to ease, persistent shipping delays and difficulties in sourcing components, such as semiconductors, could further impact production.
Table 2.6 displays current estimates of the impact of sustained changes in key external factors on Ontario’s real GDP, assuming other external factors are unchanged. The relatively wide range of estimated impacts reflects the uncertainty regarding how the economy could respond to these changes in external conditions.
| Change in Real GDP Growth First Year |
Change in Real GDP Growth Second Year |
|
|---|---|---|
| Canadian Dollar Appreciates by Five Cents US | (0.1) to (0.7) | (0.2) to (0.8) |
| Crude Oil Prices Increase by $10 US per Barrel | (0.1) to (0.3) | (0.1) to (0.3) |
| U.S. Real GDP Growth Increases by One Percentage Point | +0.2 to +0.6 | +0.3 to +0.7 |
| Canadian Interest Rates Increase by One Percentage Point | (0.1) to (0.5) | (0.2) to (0.6) |
Table 2.6 footnotes:
Source: Ontario Ministry of Finance.
Revisions to the Outlook Since the 2021 Budget
The outlook over the 2022 to 2024 period has been revised compared to the projections in the 2021 Budget. Key changes since the 2021 Budget include:
- Higher nominal GDP growth over the forecast period;
- Stronger growth in nominal household consumption over the forecast period;
- Higher Consumer Price Index (CPI) inflation between 2022 and 2024;
- Stronger growth in compensation of employees in 2022;
- Slower growth in net operating surplus of corporations in 2022 but stronger in 2023; and
- Lower unemployment rate over the forecast period.
| 2021 — 2021 Budget |
2021 — 2022 Budget |
2022p — 2021 Budget |
2022p — 2022 Budget |
2023p — 2021 Budget |
2023p — 2022 Budget |
2024p — 2021 Budget |
2024p — 2022 Budget |
|
|---|---|---|---|---|---|---|---|---|
| Real Gross Domestic Product | 4.0 | 4.3 | 4.3 | 3.7 | 2.5 | 3.1 | 2.0 | 2.0 |
| Nominal Gross Domestic Product | 6.2 | 12.0 | 6.4 | 6.7 | 4.5 | 5.1 | 4.0 | 4.2 |
| Compensation of Employees | 4.2 | 9.2 | 5.0 | 5.6 | 4.8 | 4.6 | 4.1 | 4.6 |
| Net Operating Surplus — Corporations | 8.0 | 24.6 | 7.4 | 4.6 | 4.4 | 5.8 | 4.2 | 1.6 |
| Nominal Household Consumption | 5.9 | 7.1 | 7.2 | 8.8 | 4.9 | 6.3 | 4.2 | 4.7 |
| Other Economic Indicators — Employment | 4.2 | 4.9 | 3.0 | 3.9 | 2.2 | 2.0 | 1.6 | 1.7 |
| Other Economic Indicators — Job Creation (000s) | 298 | 345 | 222 | 287 | 168 | 153 | 124 | 133 |
| Other Economic Indicators — Unemployment Rate (Per Cent) | 8.2 | 8.0 | 6.9 | 6.1 | 6.5 | 5.7 | 6.3 | 5.6 |
| Other Economic Indicators — Consumer Price Index | 1.7 | 3.5 | 2.0 | 4.7 | 2.0 | 2.5 | 2.0 | 2.1 |
| Other Economic Indicators — Housing Starts (000s) | 80.2 | 99.6 | 79.3 | 86.9 | 80.2 | 84.0 | 81.2 | 87.3 |
| Other Economic Indicators — Home Resales | 5.5 | 18.6 | (6.7) | (11.3) | 1.3 | 1.5 | 0.8 | 1.2 |
| Other Economic Indicators — Home Resale Prices | 7.5 | 23.6 | 0.0 | 9.3 | 0.5 | 2.6 | 2.0 | 4.0 |
| Key External Variables — U.S. Real Gross Domestic Product | 4.9 | 5.7 | 3.8 | 3.7 | 2.3 | 2.6 | 2.1 | 2.1 |
| Key External Variables — WTI Crude Oil ($US per Barrel) | 47 | 68 | 52 | 82 | 56 | 75 | 57 | 67 |
| Key External Variables — Canadian Dollar (Cents US) | 78.5 | 79.8 | 78.5 | 79.5 | 79.2 | 79.5 | 80.2 | 79.2 |
| Key External Variables — Three-Month Treasury Bill Rate (Per Cent)1 | 0.2 | 0.1 | 0.2 | 0.9 | 0.5 | 1.7 | 1.1 | 2.0 |
| Key External Variables — 10-Year Government Bond Rate (Per Cent)2 | 1.0 | 1.4 | 1.4 | 2.0 | 1.8 | 2.5 | 2.4 | 2.8 |
Table 2.7 footnotes:
p = Ontario Ministry of Finance planning projection based on external sources as of March 8, 2022.
[1], [2] Government of Canada interest rates.
Sources: Statistics Canada; Canada Mortgage and Housing Corporation; Canadian Real Estate Association; Bank of Canada; United States Bureau of Economic Analysis; Blue Chip Economic Indicators (February 2021/2022 and October 2020/2021); U.S. Energy Information Administration; and Ontario Ministry of Finance.
Economic Outlook Scenarios
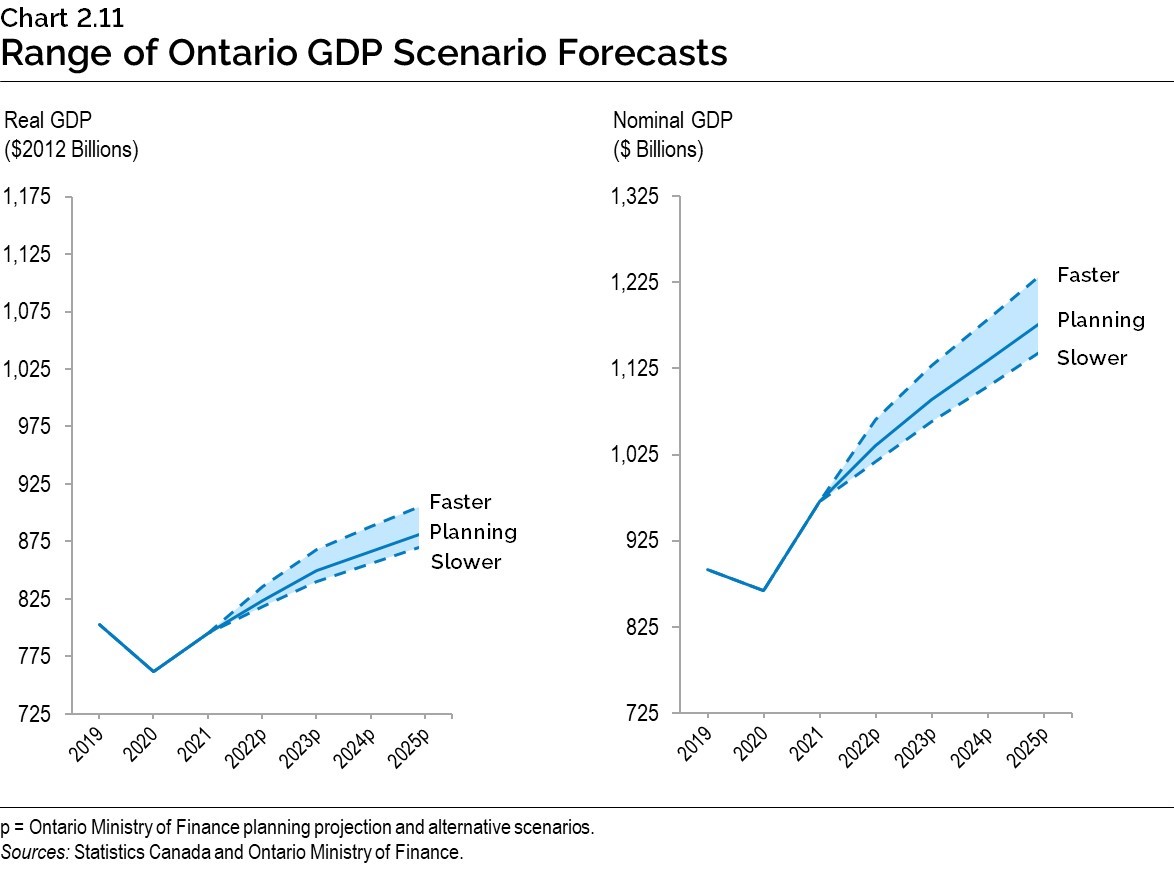
To provide more transparency about the province’s economic outlook amid the elevated degree of economic uncertainty, the Ontario Ministry of Finance has developed Faster Growth and Slower Growth scenarios that the economy could take over the next few years. These alternative scenarios should not be considered the best case or the worst case, but reasonable possible outcomes in this period of uncertainty.
| 2022p | 2023p | 2024p | 2025p | |
|---|---|---|---|---|
| Faster Growth Scenario | 5.2 | 3.8 | 2.3 | 2.2 |
| Planning Projection | 3.7 | 3.1 | 2.0 | 1.9 |
| Slower Growth Scenario | 3.0 | 2.6 | 1.9 | 1.8 |
Table 2.8 footnotes:
p = Ontario Ministry of Finance planning projection and alternative scenarios.
Source: Ontario Ministry of Finance.
| 2022p | 2023p | 2024p | 2025p | |
|---|---|---|---|---|
| Faster Growth Scenario | 9.8 | 5.9 | 4.7 | 4.6 |
| Planning Projection | 6.7 | 5.1 | 4.2 | 4.1 |
| Slower Growth Scenario | 4.8 | 4.5 | 3.9 | 3.8 |
Table 2.9 footnotes:
p = Ontario Ministry of Finance planning projection and alternative scenarios.
Source: Ontario Ministry of Finance.
By 2025, the level of real GDP in the Faster Growth scenario is 2.7 per cent higher than in the Planning Projection, while in the Slower Growth scenario, the level of real GDP is 1.4 per cent lower. The nominal GDP scenarios show a wider range of outcomes over the next several years compared to the real GDP scenarios due to heightened near-term uncertainty around GDP inflation. By 2025, the level of nominal GDP in the Faster Growth scenario is 4.7 per cent higher than in the Planning Projection, while in the Slower Growth scenario, the level of nominal GDP is 2.9 per cent lower.
Transparent Reporting on the Economy
The Ontario Economic Accounts provide a comprehensive overall assessment of the performance of Ontario’s economy. Private-sector economists use this to assess the current state of the province’s economy and as a basis for updating their forecasts. The Ontario Economic Accounts inform the government’s economic and revenue forecasts, providing a key foundation for Ontario’s fiscal plan.
The Fiscal Sustainability, Transparency and Accountability Act, 2019 states that the quarterly Ontario Economic Accounts shall be released within 45 days after the Statistics Canada release of the National Income and Expenditure Accounts.
In compliance with the legislation, the quarterly Ontario Economic Accounts will be released according to the schedule outlined in Table 2.10.
| Reference Period | Expected Statistics Canada Release of National Income and Expenditure Accounts | Corresponding Deadline for Release of Ontario Economic Accounts |
|---|---|---|
| First Quarter (January-March) 2022 |
May 31, 2022 | July 15, 2022 |
| Second Quarter (April-June) 2022 |
August 31, 2022 | October 14, 2022 |
| Third Quarter (July-September) 2022 |
November 29, 2022 | January 13, 2023 |
| Fourth Quarter (October-December) 2022 |
February 28, 2023 | April 14, 2023 |
Table 2.10 footnotes:
Sources: Statistics Canada and Ontario Ministry of Finance.
Footnotes
[1] Statistics Canada Labour Force Survey employment data starts in 1976 for Ontario.
[2] The three experts are from the Policy and Economic Analysis Program at the University of Toronto; Quantitative Economic Decisions, Inc.; and Stokes Economic Consulting, Inc.
Chart Descriptions
Chart 2.1: Real GDP Recovery for G7 Countries
This bar chart illustrates the per cent change in real gross domestic product (GDP) between the fourth quarter of 2019 and the latest data point by G7 countries. The changes from the fourth quarter of 2019 are as follows: U.S. real GDP was 3.1 per cent higher in the fourth quarter of 2021; France’s real GDP was 0.9 per cent higher in the fourth quarter of 2021; Canada’s real GDP was 0.1 per cent higher in the fourth quarter of 2021; Italy’s real GDP was 0.3 per cent lower in the fourth quarter of 2021; the United Kingdom’s real GDP was 0.4 per cent lower in the fourth quarter of 2021; Japan’s real GDP was 0.4 per cent lower in the fourth quarter of 2021; Germany’s real GDP was 1.1 per cent lower in the fourth quarter of 2021.
Note: Latest data point is the fourth quarter of 2021 for all countries.
Sources: Statistics Canada; U.S. Bureau of Economic Analysis; and Organisation for Economic Co-operation and Development (OECD).
Chart 2.2: Rebound in Key Economic Indicators
This chart illustrates the per cent change in key economic indicators between February 2020 and the latest data point as solid bars and between February 2020 and the 2020 low as dashed bars. Changes from February 2020 are as follows: Wholesale trade was 33.7 per cent lower in April 2020 and 15.8 per cent higher in January 2022; Retail sales were 36.4 per cent lower in April 2020 and 10.3 per cent higher in January 2022; Manufacturing sales were 46.8 per cent lower in April 2020 and 5.9 per cent higher in January 2022; Merchandise Exports were 39.7 per cent lower in April 2020 and 1.8 per cent higher in February 2022.
Note: The latest data point is February 2022 for merchandise exports and January 2022 for all other indicators. The low point in 2020 is April for all indicators.
Sources: Statistics Canada and Ontario Ministry of Finance.
Chart 2.3: Employment Recovery in Ontario
This bar chart illustrates employment gains between February 2020 and the latest data point by sector. Changes since February 2020 are as follows: Total employment was 228,300 higher in March 2022; Full-time employment was 203,100 higher in March 2022; Part-time employment was 25,100 higher in March 2022; Private-sector employment was 199,900 higher in March 2022; Public-sector employment was 88,600 higher in March 2022; Self-employment was 60,300 lower in March 2022; Employment of persons aged 15 to 24 was 2,400 lower in March 2022; Employment of persons aged 25 to 54 was 216,600 higher in March 2022; and employment of persons aged 55 and older was 14,100 higher in March 2022.
Note: Latest data point for all indicators is March 2022.
Source: Statistics Canada.
Chart 2.4: Ontario’s Labour Market Improving
The chart shows Ontario’s monthly unemployment rate as the blue line from February 2020 to March 2022. The unemployment rate increased to 13.2 per cent in May 2020. As of March 2022, the unemployment rate was 5.3 per cent, 0.2 percentage points lower than the rate recorded in February 2020.
Source: Statistics Canada.
Chart 2.5: Strong Employment Recovery in Ontario
The chart shows employment for Ontario as the solid blue line, Canada as the dashed teal line and the United States as the dashed gray line as an index of the February 2020 employment level for each respective jurisdiction, from February 2020 to March 2022. Ontario’s employment index reached a low of 85.0 in May 2020 while Canada and the U.S. employment indexes reached their lows in April 2020, of 84.3 and 85.6, respectively. As of March 2022, the Ontario and Canadian employment indexes were higher than the February 2020 level, at 103.0 and 102.3, respectively. The employment index in the United States was 99.0 in March 2022.
Note: Latest data point is March 2022 for all jurisdictions.
Sources: Statistics Canada and U.S. Bureau of Labor Statistics.
Chart 2.6: Steeper Increase in Interest Rates Projected
The line chart shows the Government of Canada three-month Treasury Bill rate from 2011 to 2021 and the Ministry of Finance planning projection for 2022 to 2025. The rate was at 0.5 per cent in both 2015 and 2016 before reaching 1.7 per cent in 2019. The rate declined to 0.4 per cent in 2020 and 0.1 per cent in 2021.
The chart shows current projections of 0.9 per cent in 2022, 1.7 per cent in 2023, 2.0 per cent in 2024, and 2.1 per cent in 2025. This compares to 2021 Budget projections of 0.2 per cent in 2022, 0.5 per cent in 2023, and 1.1 per cent in 2024.
Sources: Bank of Canada and Ontario Ministry of Finance.
Chart 2.7: Ontario Real and Nominal GDP Growth to Moderate
The chart shows a stacked bar chart of real and nominal GDP for 2021 and Ontario Ministry of Finance planning projections for 2022 to 2025. In 2021, real GDP growth was 4.3 per cent and nominal GDP growth was 12.0 per cent. Real GDP is projected to grow 3.7 per cent in 2022, 3.1 per cent in 2023, 2.0 per cent in 2024 and 1.9 per cent in 2025. Nominal GDP is forecast to grow 6.7 per cent in 2022, 5.1 per cent in 2023, 4.2 per cent in 2024 and 4.1 per cent in 2025.
Source: Ontario Ministry of Finance.
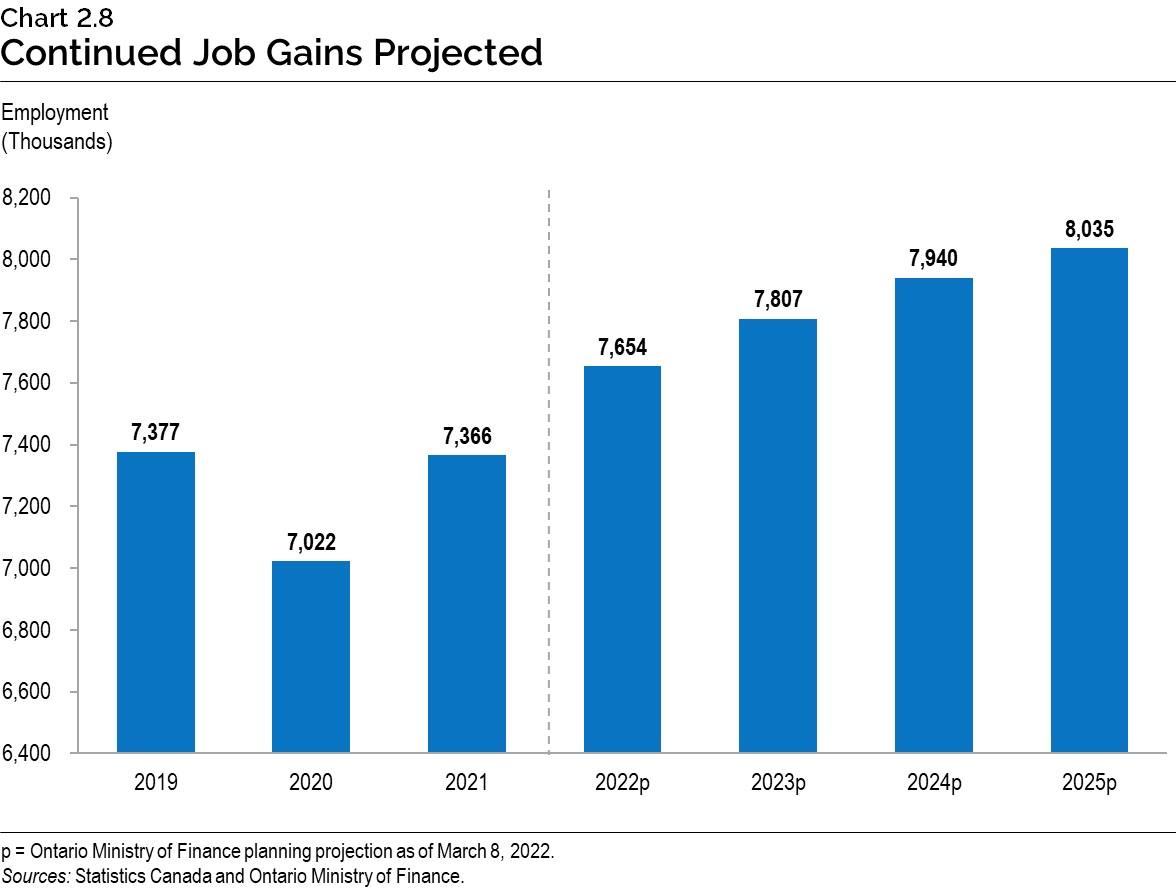
Chart 2.8: Continued Job Gains Projected
This bar chart shows Ontario’s average annual employment from 2019 to 2021 and projections from 2022 to 2025. Ontario’s average annual employment was 7.377 million in 2019 and then decreased to 7.022 million in 2020. Employment rose to 7.366 million in 2021. Employment in Ontario is projected to be 7.654 million in 2022, 7.807 million in 2023, 7.940 million in 2024, and 8.035 million in 2025.
Sources: Statistics Canada and Ontario Ministry of Finance.
Chart 2.9: Ontario Home Resale Market
The left side panel has a line chart showing Ontario home resales in thousands of units from 2001 to 2021, as well as the Ontario Ministry of Finance planning projection for 2022 through 2025. Ontario home resales rose from 161,364 in 2001 to 210,080 in 2007 before declining to 177,770 in 2008. Resales then rose to 243,612 in 2016 before declining to 192,457 by 2018. Resales then rose to 270,734 in 2021. Resales are projected to be 240,143 in 2022 and rise steadily, reaching 249,632 by 2025.
The right-hand side panel has a line chart showing Ontario average home resale prices in thousands of dollars from 2001 to 2021, as well as the Ontario Ministry of Finance planning projection for 2022 through 2025. Average home resale prices rose from $193,883 in 2001 to $586,662 in 2017. Average home resale prices then declined to $571,825 in 2018 before rising to $871,840 by 2021. Average home resale prices are projected to rise to $952,902 in 2022 and continue rising, reaching $1,057,459 by 2025.
Sources: Canadian Real Estate Association and Ontario Ministry of Finance.
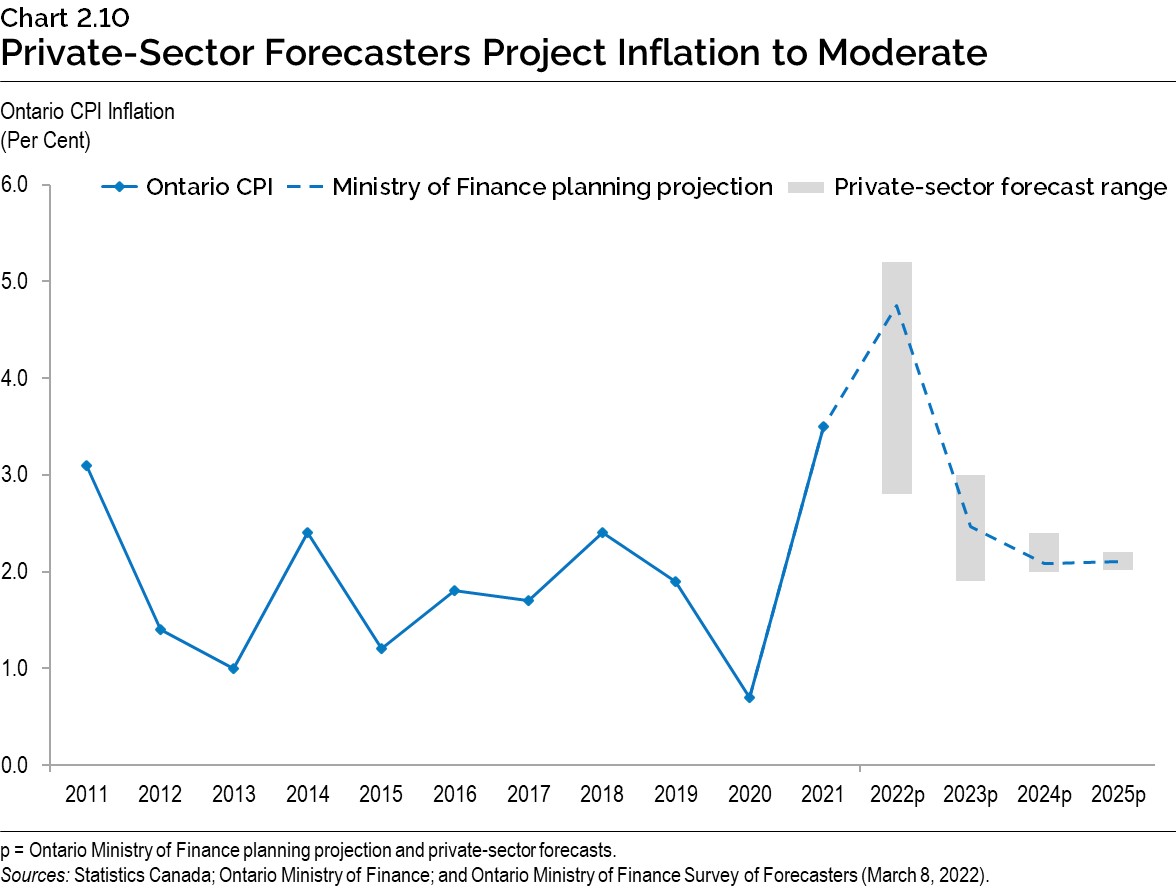
Chart 2.10: Private-Sector Forecasters Project Inflation to Moderate
The line chart shows Ontario Consumer Price Index (CPI) inflation in per cent from 2011 to 2021, as well as projected Ontario CPI inflation for 2022 through 2025. Ontario CPI inflation averaged 1.9 per cent between 2011 and 2019. CPI inflation was 0.7 per cent in 2020 and 3.5 per cent in 2021. Ontario CPI inflation is projected to be 4.7 per cent in 2022, 2.5 per cent in 2023 and 2.1 per cent in both 2024 and 2025.
Bars on the chart show the range of private-sector forecasts for Ontario CPI inflation for 2022 through 2025. Private-sector forecasts range from 2.8 per cent to 5.2 per cent in 2022, 1.9 per cent to 3.0 per cent in 2023, 2.0 per cent to 2.4 per cent in 2024, and 2.0 per cent to 2.2 per cent in 2025.
Sources: Statistics Canada; Ontario Ministry of Finance; and Ontario Ministry of Finance Survey of Forecasters (March 8, 2022).
Chart 2.11: Range of Ontario GDP Scenario Forecasts
The left-hand side panel has a line chart showing Ontario real GDP in billions of 2012 dollars for 2019 to 2021, as well as the Ontario Ministry of Finance planning projection. Separate lines show the levels of real GDP in the Faster Growth and the Slower Growth scenarios. Ontario real GDP was $803 billion in 2019, $762 billion in 2020 and $795 billion in 2021. In the Planning Projection, Ontario real GDP is projected to rise from $824 billion in 2022 to $883 billion in 2025. In the Faster Growth Scenario, Ontario real GDP is projected to rise from $836 billion in 2022 to $907 billion in 2025. In the Slower Growth Scenario, Ontario real GDP is projected to rise from $819 billion in 2022 to $871 billion in 2025.
The right-hand side panel has a line chart showing Ontario nominal GDP in billions of dollars for 2019 to 2021, as well as the Ontario Ministry of Finance planning projection. Separate lines show the levels of nominal GDP in the Faster Growth and the Slower Growth scenarios. Ontario nominal GDP was $892 billion in 2019, $867 billion in 2020 and $971 billion in 2021. In the planning projection, Ontario nominal GDP is projected to rise from $1,036 billion in 2022 to $1,180 billion in 2025. In the Faster Growth scenario, Ontario nominal GDP is projected to rise from $1,066 billion in 2022 to $1,236 billion in 2025. In the Slower Growth Scenario, Ontario nominal GDP is projected to rise from $1,017 billion in 2022 to $1,146 billion in 2025.
Sources: Statistics Canada and Ontario Ministry of Finance.