Introduction
Ontario’s borrowing program is primarily used to fund deficits, refinance maturing debt, and make investments in capital assets, while minimizing interest costs.
Ontario has completed long-term borrowing for 2024–25 of $49.5 billion. This is $11.3 billion higher than anticipated in the 2024 Budget or $12.0 billion higher than the 2024 Ontario Economic Outlook and Fiscal Review. The increase in borrowing was a decision to take advantage of market access. The 2024–25 borrowing program was completed with a blended aggregate yield below four per cent, with maturities ranging from five to 30 years. The improved deficit position in 2024–25 has allowed Ontario to increase cash reserves, enhance liquidity and provide funding flexibility for future years. This prudent approach positioned Ontario better for the 2025–26, 2026–27 and 2027–28 long-term public borrowing forecasts, which are $42.8 billion, $41.1 billion and $33.0 billion.
As outlined in the 2024 Ontario Economic Outlook and Fiscal Review, Ontario is updating the presentation of interest costs to improve transparency in financial reporting. Interest costs and interest revenue will now be presented separately — this change is fiscally neutral. Further, “Interest on Debt” is being renamed “Interest and Other Debt Servicing Charges” (IOD) to more accurately reflect the expenses incurred to deliver an effective, cost-efficient borrowing program.
As a result of the change in reporting of IOD, two of Ontario’s debt sustainability measures will be renamed. “Interest on Debt-to-Revenue” is now “Net Interest-to-Operating Revenue,” and “Net Debt-to-Revenue” is now “Net Debt-to-Operating Revenue.” To enable meaningful comparisons with prior fiscal years, the calculation will remain unchanged, which will ensure comparators remain the same.
Changes to Debt Burden Reduction Strategy Ratios
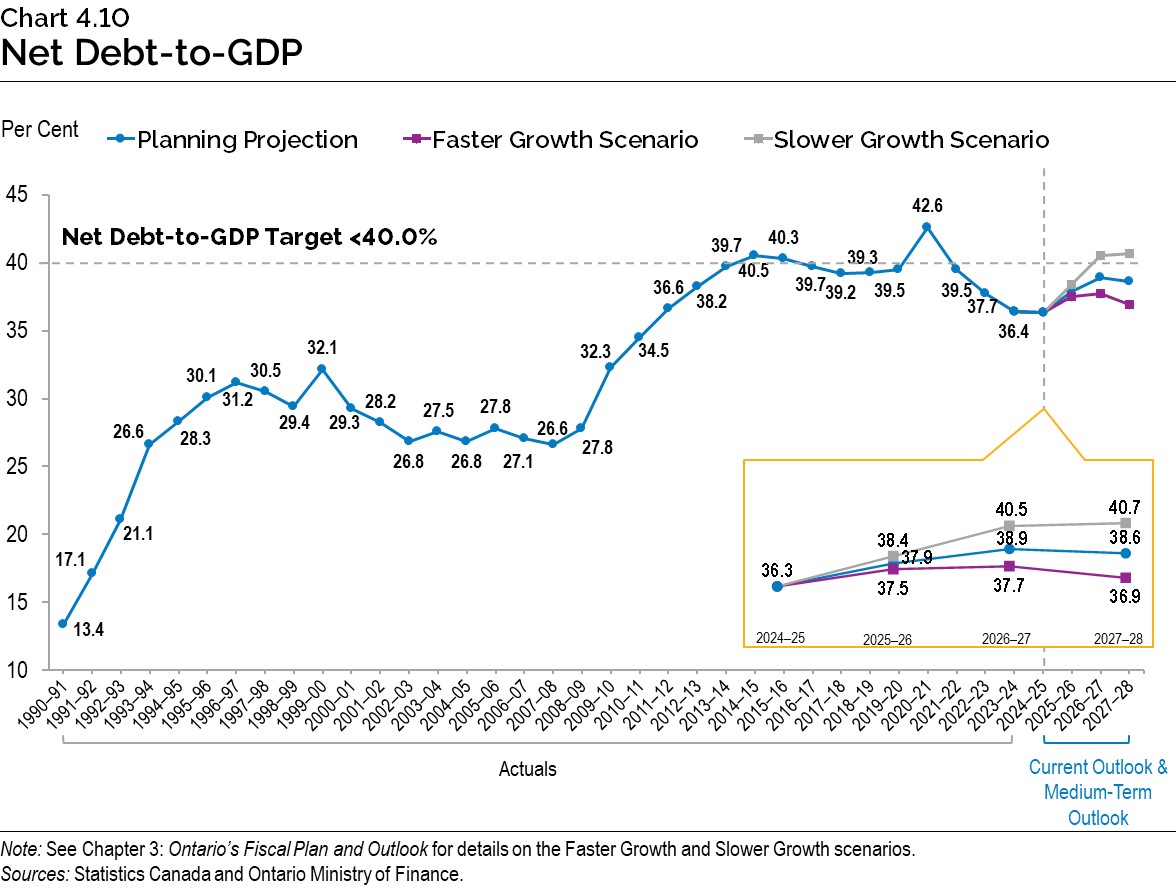
The net debt-to-GDP ratio is now forecast to be 36.3 per cent in 2024–25, 37.9 per cent in 2025–26, 38.9 per cent in 2026–27 and 38.6 per cent in 2027–28. Ontario’s net debt-to-GDP ratio fell to a 13‑year low last year, and Ontario’s plan keeps this ratio close to the lowest level since 2013–14 over the medium-term outlook.
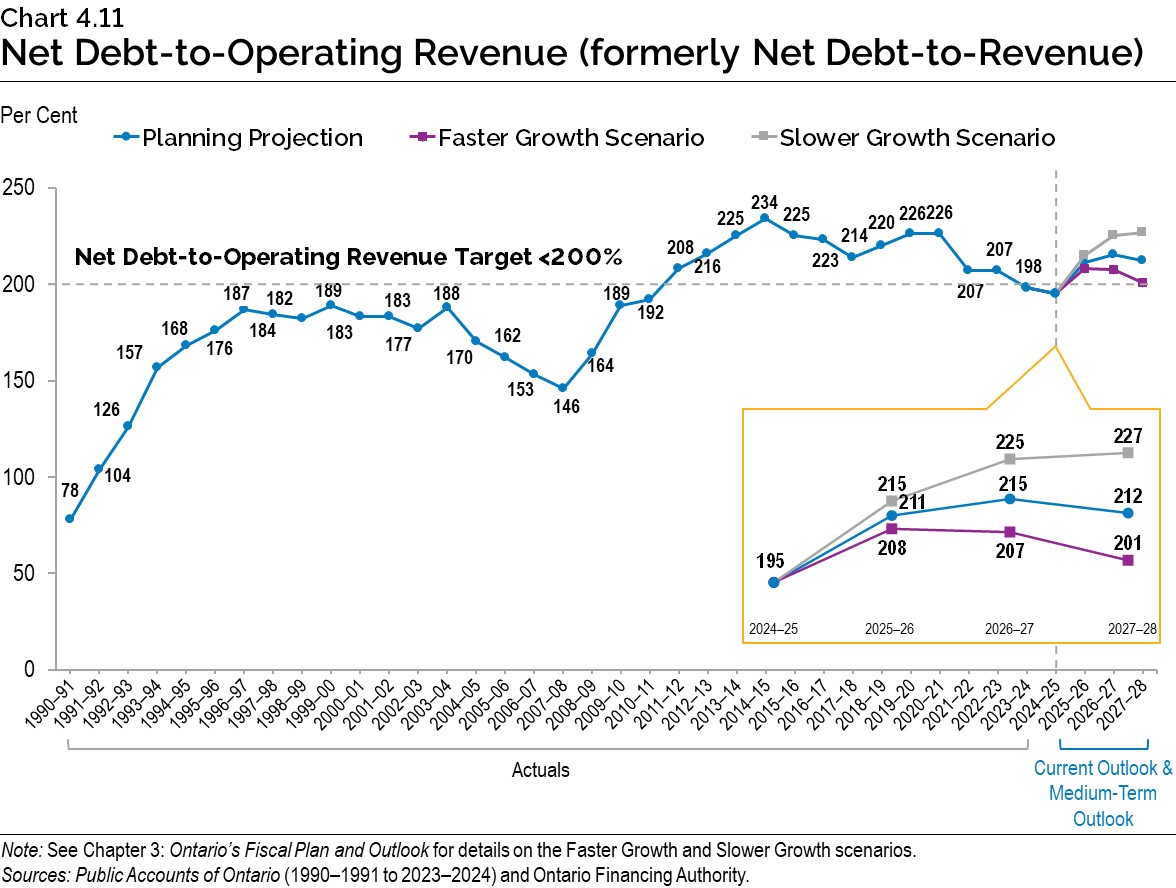
The net debt-to-operating revenue (formerly net debt-to-revenue) is forecast to be 195 per cent in 2024–25, 211 per cent in 2025–26, 215 per cent in 2026–27 and 212 per cent in 2027–28. The 195 per cent for 2024–25 would be the lowest level since 2010–11. Ontario has demonstrated its ability to bring this ratio below its 200 per cent target and achieved this consecutively in 2023–24 and 2024–25. While the current economic environment will temporarily raise the level of this ratio, the government remains committed to and has proven it has the capability to re-attain this target.
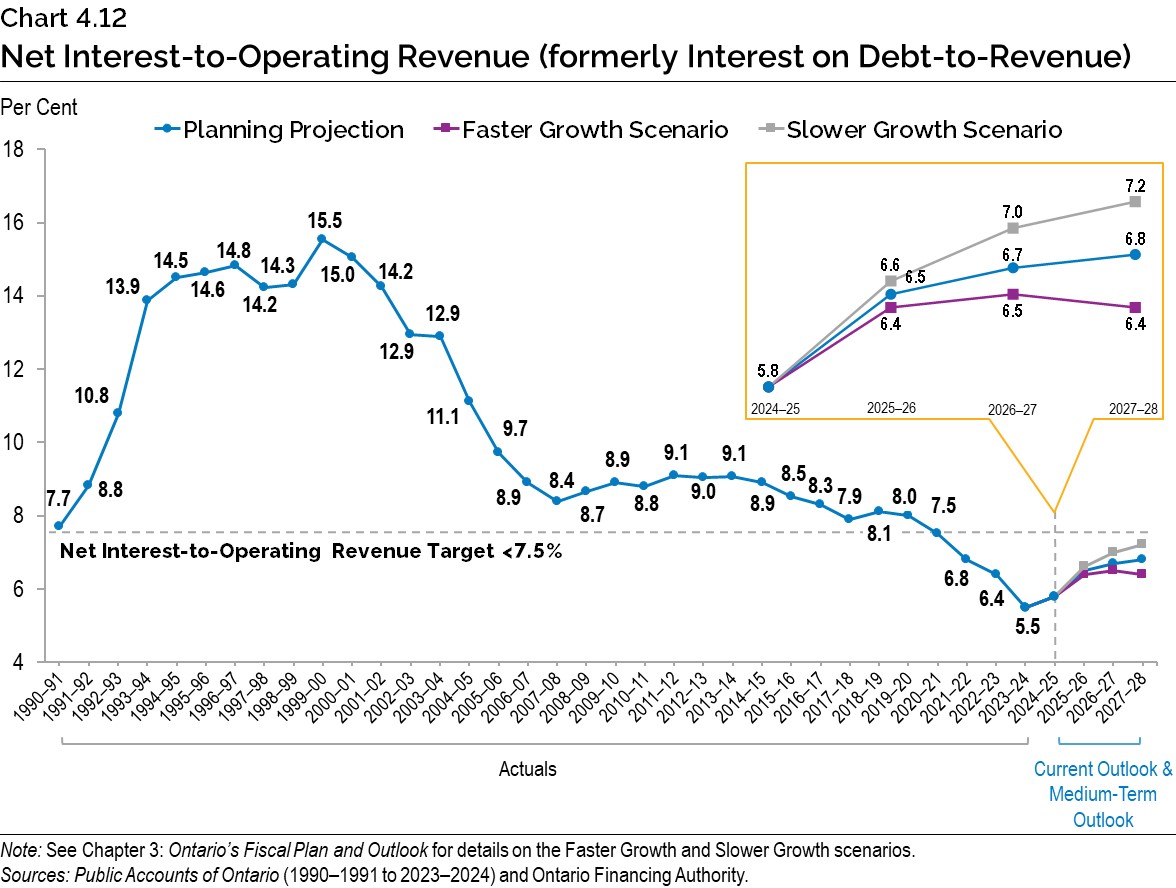
Ontario is forecast to pay $15.2 billion in interest costs in 2024–25, $16.2 billion in 2025–26, $17.0 billion in 2026–27, and $17.8 billion in 2027–28. The net interest-to-operating revenue (formerly interest on debt-to-revenue) is forecast to be 5.8 per cent in 2024–25, 6.5 per cent in 2025–26, 6.7 per cent in 2026–27, and 6.8 per cent in 2027–28. Even with the forecasted increases to interest costs, this ratio remains close to the lowest levels it has been at since the 1980s.
Borrowing Program
Ontario’s borrowing program is primarily used to fund deficits, refinance maturing debt, and make investments in capital assets. Ontario will continue to finance most of its borrowing program in the long-term public markets in Canada and internationally.
| Item | 2024–25: 2024 Budget | 2024–25: Change from 2024 Budget | 2024–25: Interim1 2024–25 |
Medium-Term Outlook 2025–26 |
Medium-Term Outlook 2026–27 |
Medium-Term Outlook 2027–28 |
|---|---|---|---|---|---|---|
| Deficit/(Surplus) | 9.8 | (3.8) | 6.0 | 14.6 | 7.8 | (0.2) |
| Provincial Investment in Capital Assets | 17.7 | (0.5) | 17.2 | 23.1 | 23.7 | 20.1 |
| Amortization of Capital Assets2 | (8.4) | (0.2) | (8.6) | (9.1) | (9.3) | (10.1) |
| Non-Cash and Cash Timing Adjustments | (2.6) | 6.2 | 3.6 | (3.1) | (3.4) | (4.3) |
| Net Loans and Investments | (0.3) | 0.8 | 0.5 | 1.2 | (0.1) | – |
| Debt Maturities and Redemptions | 28.0 | – | 28.0 | 33.1 | 26.9 | 27.5 |
| Total Funding Requirement | 44.2 | 2.5 | 46.7 | 59.8 | 45.6 | 33.0 |
| Decrease/(Increase) in Short-Term Borrowing | (5.0) | – | (5.0) | (5.0) | (2.5) | – |
| Increase/(Decrease) in Year-End Cash and Cash Equivalents3 | (1.0) | 8.8 | 7.8 | (12.0) | (2.0) | – |
| Total Long-Term Borrowing | 38.2 | 11.3 | 49.5 | 42.8 | 41.1 | 33.0 |
Table 4.1 footnotes:
[1] Interim represents the 2025 Budget projection for the 2024–25 fiscal year.
[2] Starting in the 2025 Budget, Amortization of Capital Assets will be reflected in a separate line in this table to reflect the increasing impact of the capital plan on the borrowing program.
[3] Starting in 2024–25, pre-borrowing will be reflected as part of the increase in year-end cash and cash equivalents.
Note: Numbers may not add due to rounding.
Source: Ontario Financing Authority.
Ontario has completed long-term borrowing for 2024–25 of $49.5 billion. This is $11.3 billion higher than anticipated in the 2024 Budget or $12.0 billion higher than the 2024 Ontario Economic Outlook and Fiscal Review. The increase in borrowing was a decision to take advantage of market access. The 2024–25 borrowing program was completed with a blended aggregate yield below four per cent, with maturities ranging from five to 30 years. The improved deficit position in 2024–25 has allowed Ontario to increase cash reserves, enhance liquidity and provide funding flexibility for future years. The 2025–26, 2026–27 and 2027–28 long-term public borrowing forecasts are $42.8 billion, $41.1 billion and $33.0 billion.
Year-end cash and cash equivalents are forecast to decrease by $12.0 billion in 2025–26 and $2.0 billion in 2026–27.
Ontario plans to increase short-term borrowing by $5.0 billion in 2025–26. This positions Ontario to respond to recent changes in market demand for short-term Ontario debt. It will also maintain the proportion of short-term debt as a percentage of total debt outstanding within the target range of five to seven per cent, as it has been over the past 10 years.
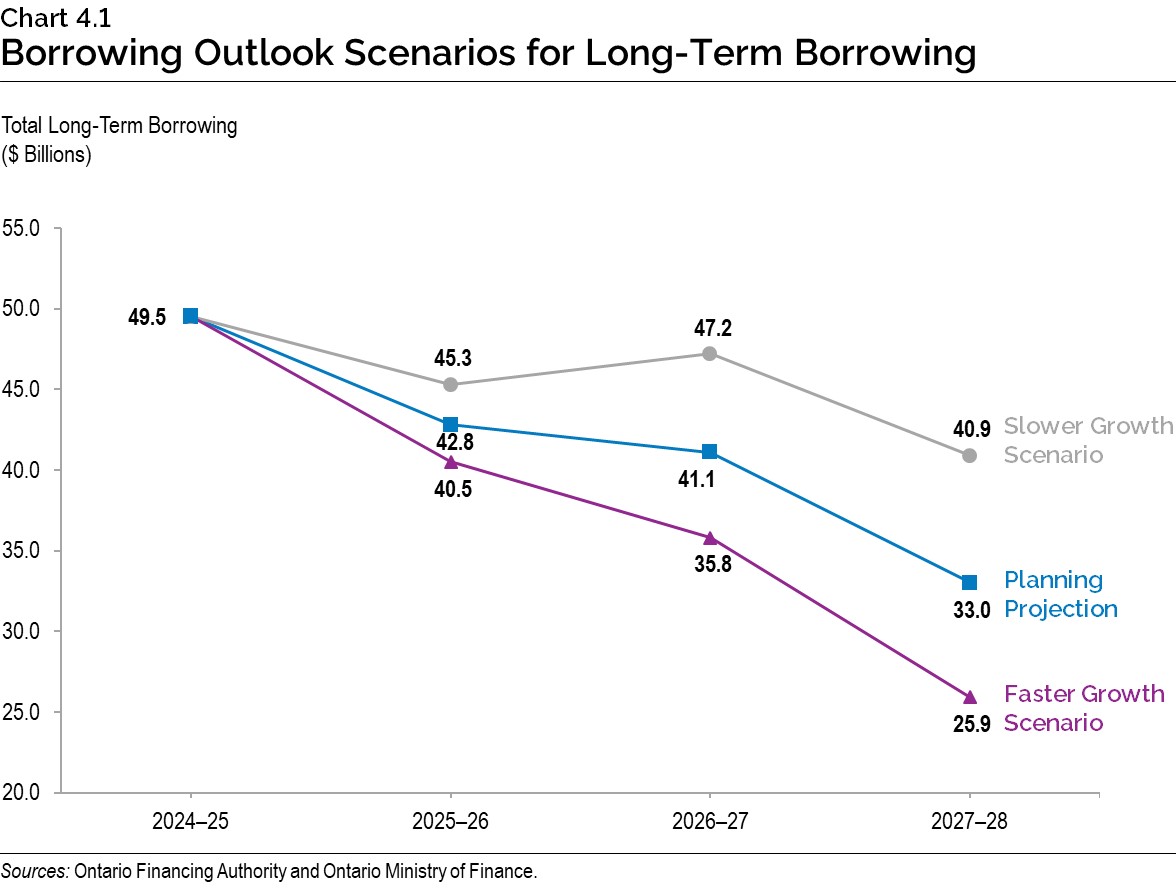
In the event that alternative economic scenarios materialize, Ontario’s borrowing requirements in the next three years would also change see Chapter 3: Ontario’s Fiscal Plan and Outlook for more details, and a description of the resulting alternative medium-term outlook scenarios). Under the Faster Growth scenario, long-term borrowing would decrease by a total of $14.7 billion over the three-year outlook period, while under the Slower Growth scenario, long‑term borrowing would increase by $16.5 billion over the same period.
Approximately 79 per cent of 2024–25 long-term borrowing was completed in Canadian dollars, through 36 syndicated issues, one floating rate note and three Green Bonds. This percentage was within Ontario’s target range for domestic borrowing of 75 to 90 per cent for the 2024–25 fiscal year. Based on the combined experience of the last five fiscal years, Ontario’s target range for domestic borrowing will be adjusted to 70 to 85 per cent for 2025–26. This range will continue to be adjusted, if necessary, in response to evolving investor demand in the Canadian dollar and foreign currency debt markets.
Foreign currency borrowing helps reduce Ontario’s overall borrowing costs by continuing to diversify Ontario’s investor base. This diversification ensures Ontario will continue to have access to capital, even if domestic market conditions become challenging. Approximately $10.5 billion, or 21 per cent of this year’s long-term borrowing, was completed in foreign currencies, primarily in U.S. dollars and Australian dollars.
Sustainable Bond Framework
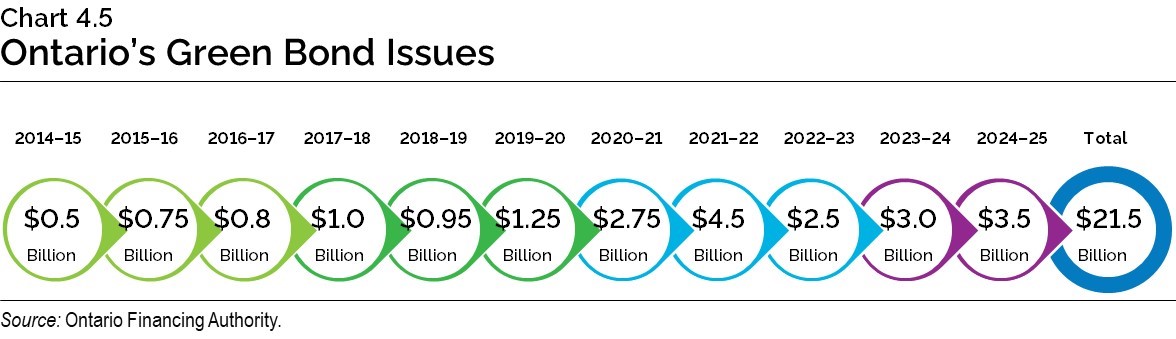
The Green Bond Program, as part of the Sustainable Bond Framework, has been a core component of Ontario’s borrowing program since 2014. It is an important tool to help finance public transit initiatives, extreme weather-resistant infrastructure, as well as energy efficiency and conservation projects. Ontario remains the largest and most frequent issuer of Canadian dollar Green Bonds, with 18 issues totalling $21.5 billion since 2014–15 and $16.75 billion outstanding.
On January 30, 2025, Ontario issued a $1.25 billion Green Bond. This was the third Green Bond issued in 2024–25, eighteenth Green Bond overall, and Ontario’s fourth Green Bond issued under the Ontario Sustainable Bond Framework. Five projects were selected to receive funding from the most recent Green Bond:
- GO Transit Expansion;
- Hazel McCallion Light Rail Transit;
- Ontario Line Subway;
- Scarborough Subway Extension; and
- Electric Vehicle (EV) ChargeON.
This Green Bond marked the first time Ontario has issued more than two Green Bonds in a fiscal year. Most notably, the $1.0 billion Green Bond that was issued on October 2, 2024 was the first ever 30-year Green Bond by a province. This provides additional maturity flexibility in the domestic Green Bond market. Ontario plans to continue its leadership in the Canadian dollar Green Bond market and, subject to market conditions, will issue multiple Green Bonds each fiscal year, including in 2025–26.
Cost of Debt
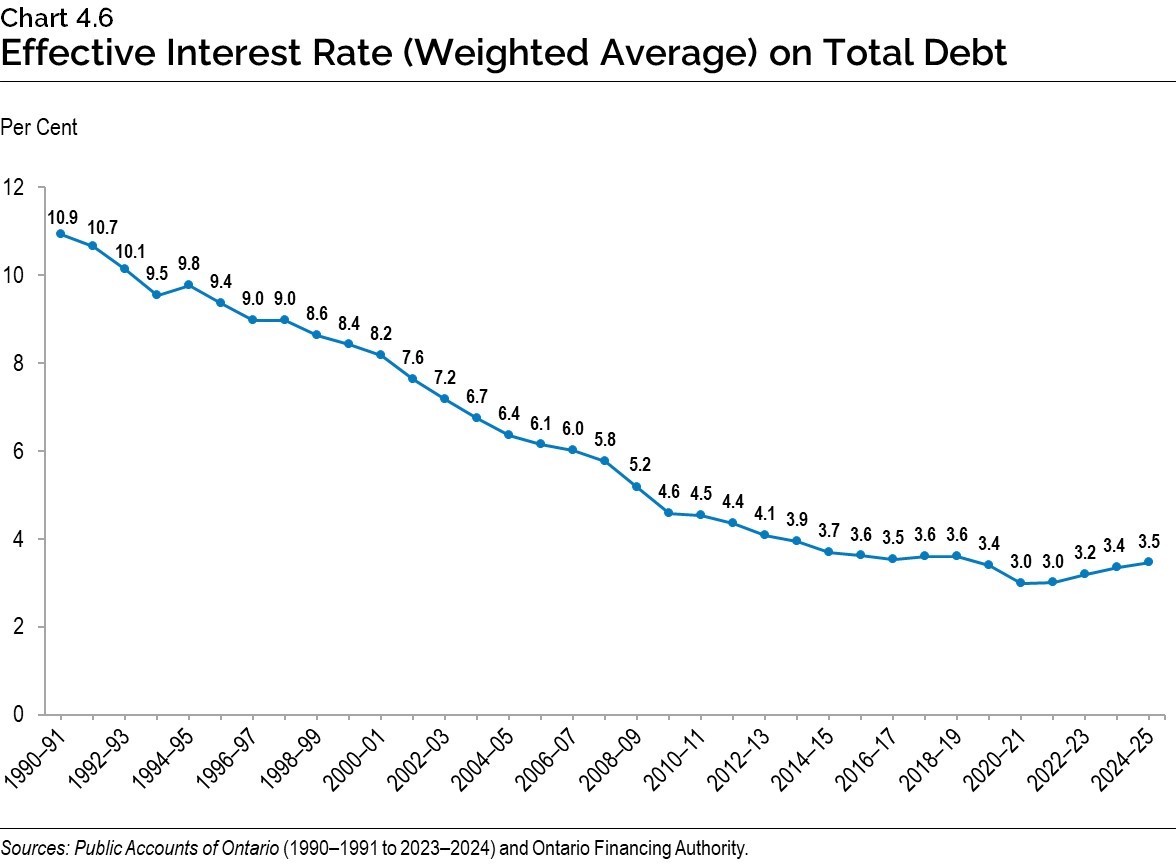
Globally, central banks including the Bank of Canada and the U.S. Federal Reserve have lowered overnight interest rates. However, longer-term interest rates, which affect the majority of Ontario’s borrowing, have remained relatively stable over the past three years. Ontario actively manages financial market risks and adapts interest rate risk management strategies to minimize the impact of changing market conditions on Ontario’s IOD costs. Adaptive interest rate risk management will be especially important in 2025–26, given the potential policy response by central banks and the global economic uncertainty surrounding tariffs. Chart 4.6 shows Ontario’s decision to lock in long-term rates and extend the term of its debt, since the Global Financial Crisis in 2007–08 has left the interest rate on the total debt portfolio lower in historical terms, in spite of rising broader market interest rates.
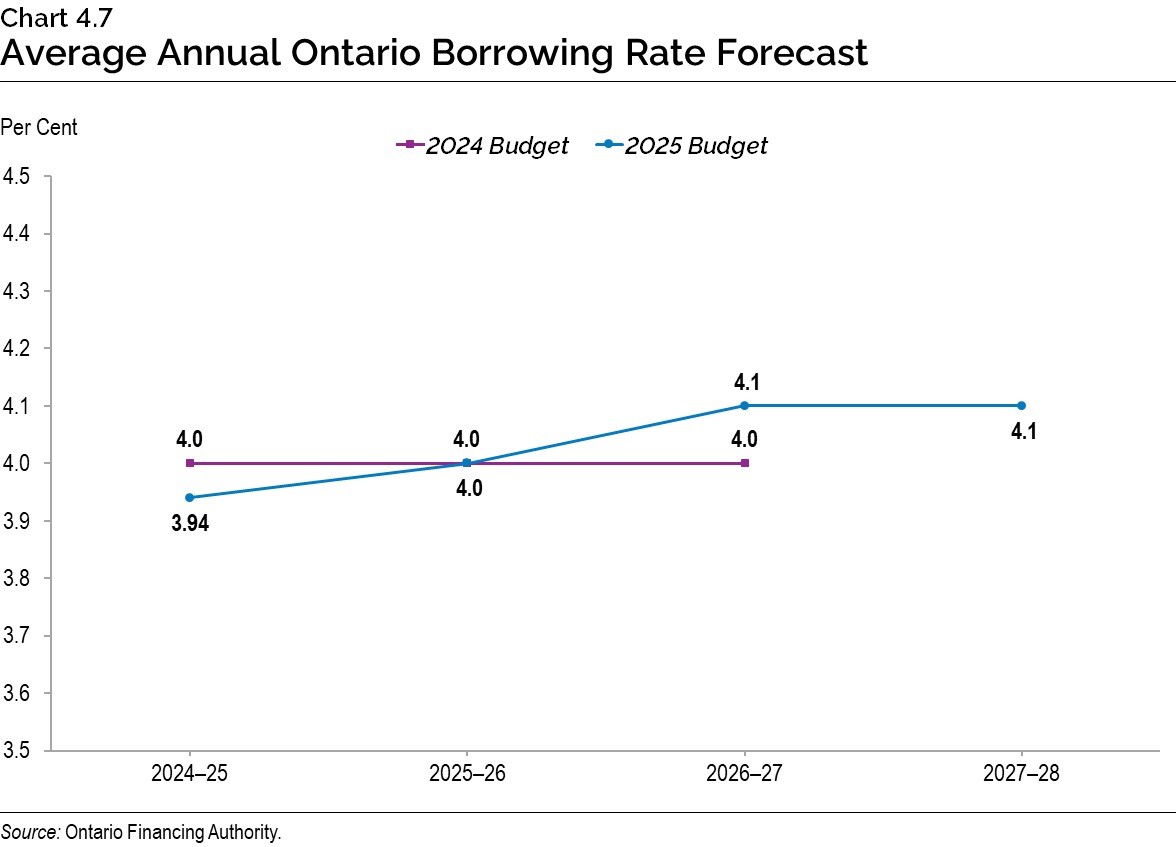
Ontario’s borrowing costs for 2024–25 are now estimated to be 3.94 per cent, six basis points lower than forecasted in the 2024 Budget, as shown in Chart 4.7. As forecasted in the 2024 Budget, borrowing costs in 2025–26 are expected to remain the same, while borrowing costs in 2026–27 and 2027–28 are projected to be slightly higher. A one percentage point change in interest rates, either up or down from the current interest rate forecast, is estimated to have a corresponding change in Ontario’s borrowing costs of approximately $0.8 billion in the first full year.
As outlined in the 2024 Ontario Economic Outlook and Fiscal Review, Ontario is now reporting interest and investment income separately as a revenue item. As a result of this change, IOD will be presented higher as it will be on a gross basis with interest and investment income no longer netted against it. This presentation change is fiscally neutral. IOD remains Ontario’s fourth largest expense after health care, education, and social services.
| Item | 2024–25 | 2025–26 | 2026–27 | 2027–28 |
|---|---|---|---|---|
| Gross IOD — 2025 Budget | 15.2 | 16.2 | 17.0 | 17.8 |
| Gross IOD — 2024 Budget | 16.5 | 16.7 | 17.0 | – |
| Net IOD — 2025 Budget | 12.7 | 14.2 | 15.2 | 16.0 |
| Net IOD — 2024 Budget | 13.9 | 14.7 | 15.2 | – |
Table 4.2 footnotes:
Source: Ontario Financing Authority.
Term of Debt
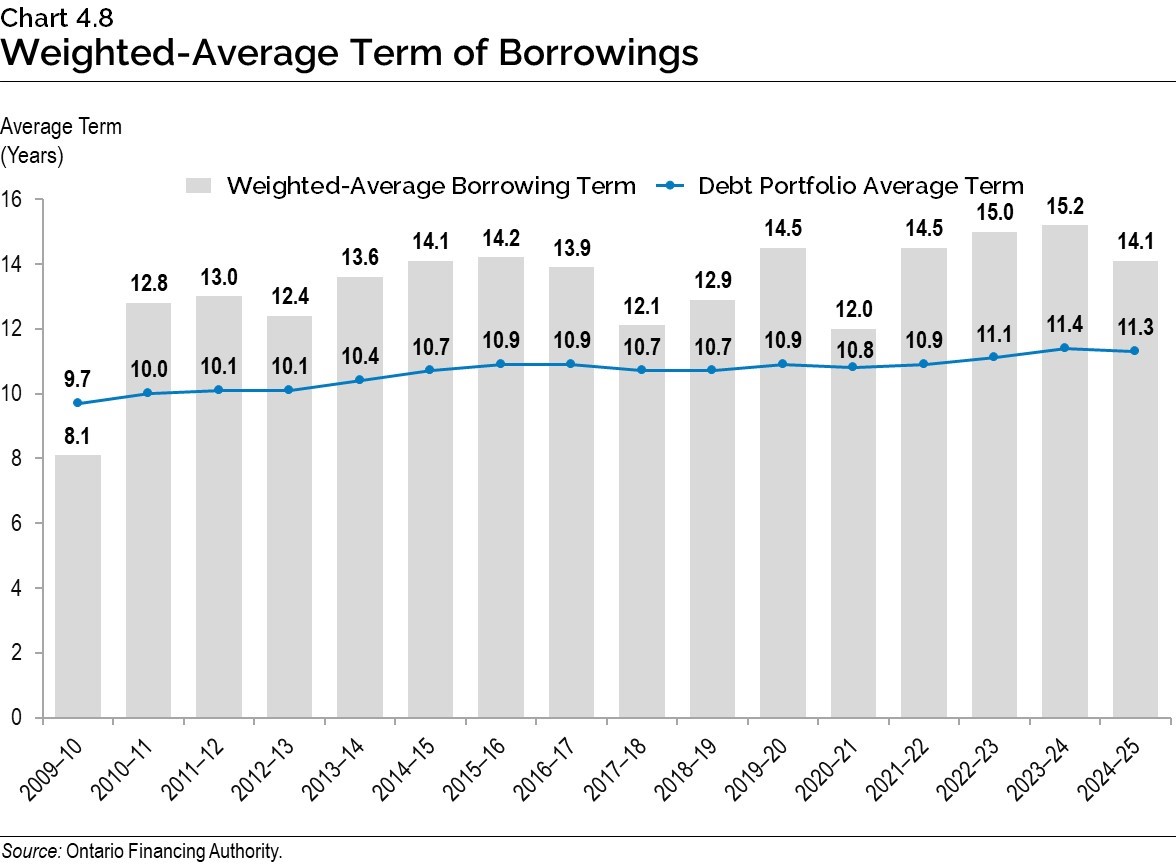
Ontario has continued to extend the term of its debt when investor demand allowed, to reduce future refinancing risk. This also protects the IOD forecast in the long term against future interest rate increases. Ontario has issued $149.7 billion of bonds, or almost one‑third of total debt outstanding, with maturities of 30 years or longer since 2010–11. This includes $12.7 billion in 2024–25.
The success Ontario has had in extending the term of its debt from the time of the Global Financial Crisis has created flexibility for managing its large borrowing program and debt portfolio. Due to the extension of the term of debt, the impact on IOD in the short term and medium term has been lessened. Ontario will continue to monitor the market and adjust the debt term strategy in response to further changes to interest rates and the yield curve.
Ensuring Adequate Liquidity Levels
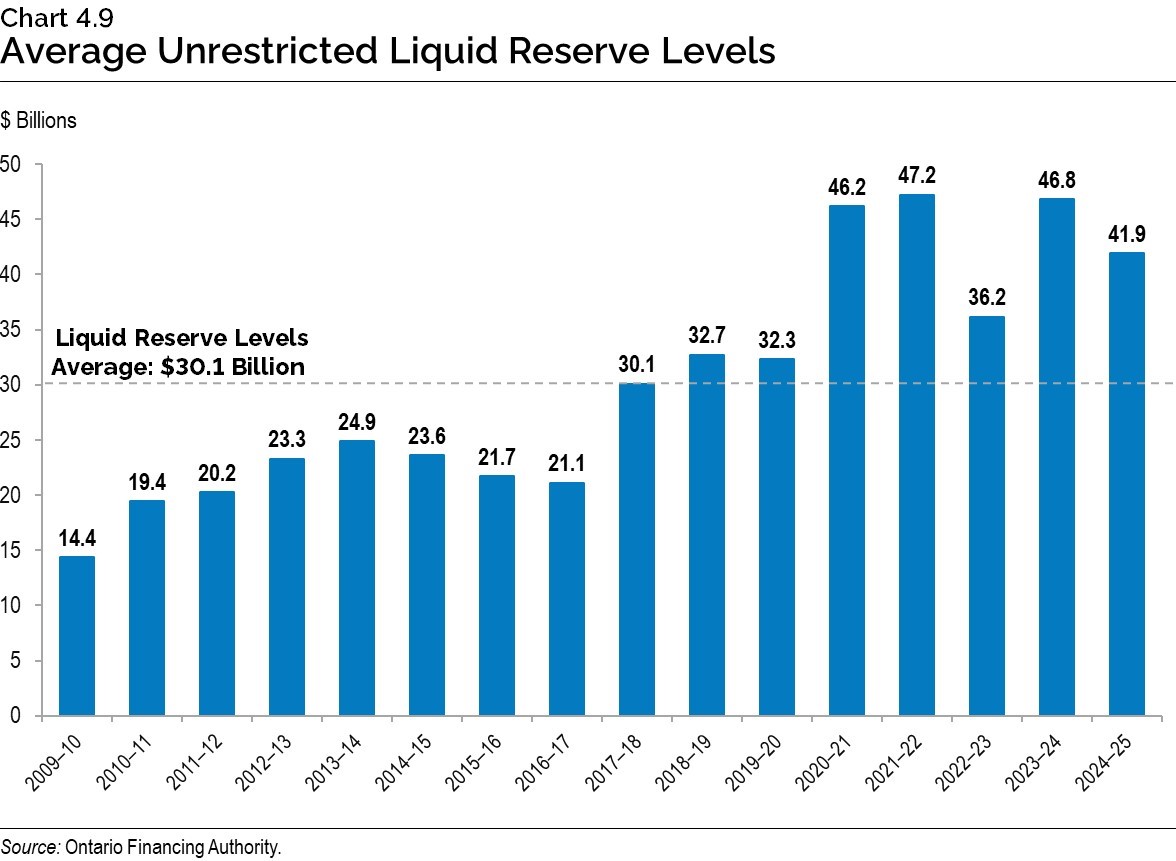
Ontario aims to maintain an optimal level of cash reserves that balances potential holding costs with the need to have adequate funds to meet its financial obligations in a timely manner, as well as to be able to respond promptly during economic downturns or financial challenges. Prior to 2025–26, short-term interest rates were higher than long-term rates, which meant that holding liquid reserves reduced IOD as short-term investments earned more income than Ontario’s cost of borrowing long-term debt. Although short-term and long-term rates have normalized, Ontario intends to maintain recent liquid reserve levels due to the ongoing market and economic volatility.
As shown in Chart 4.9, Ontario’s cash reserves averaged $41.9 billion in 2024–25.
Debt Burden Reduction Strategy
The government remains committed to reducing the debt burden and putting Ontario’s finances on a sustainable path. As a result, Ontario has maintained the targets set in the 2023 Budget and continues to make progress towards achieving them over the medium-term outlook. In addition, Ontario’s path to balance by 2027–28 will further support progress towards its Debt Burden Reduction Strategy.
Ontario is improving transparency in financial reporting by making three key changes to its presentation of interest costs and interest revenue, which results in an impact on the terminology in the Debt Burden Reduction Strategy and its corresponding ratios:
- As outlined in the 2024 Ontario Economic Outlook and Fiscal Review, to ensure compliance with Public Sector Accounting Standards, interest costs and interest revenue will now be presented separately, rather than being netted against each other. This change is fiscally neutral.
- This change results in the renaming of two debt sustainability measures. “Interest on Debt-to-Revenue” is now “Net Interest-to-Operating Revenue,” and “Net Debt-to-Revenue” is now “Net Debt-to-Operating Revenue.” To enable meaningful comparisons with prior fiscal years, the calculation will remain unchanged, which will ensure comparators remain the same. The updated terminology better explains the calculation of the ratio.
- “Interest on Debt” is being renamed “Interest and Other Debt Servicing Charges” (IOD). This change allows the line item to more accurately reflect the expenses incurred to deliver on the borrowing program.
| Item | Targets | 2024 Budget 2024–25 Forecast |
2025 Budget 2024–25 Forecast |
2024 Budget 2025–26 Forecast |
2025 Budget 2025–26 Forecast |
|---|---|---|---|---|---|
| Net Debt-to-GDP | <40.0 | 39.2 | 36.3 | 39.5 | 37.9 |
| Net Debt-to-Operating Revenue | <200 | 214 | 195 | 211 | 211 |
| Net Interest-to-Operating Revenue | <7.5 | 6.8 | 5.8 | 6.8 | 6.5 |
Table 4.3 footnotes:
Source: Ontario Financing Authority.
Ontario’s net debt-to-GDP measures the relationship between the government’s obligations and its ability to meet them, indicating the burden of government debt as a share of the economy. The ratio is projected to be 36.3 per cent in 2024–25, 37.9 per cent in 2025–26, 38.9 per cent in 2026–27, and 38.6 per cent in 2027–28. The increase in this ratio over the medium-term outlook, while remaining below target, is primarily due to higher than projected deficits and investments in infrastructure.
Over the medium-term outlook, the net debt‑to‑GDP ratio is forecast to stay below the target of 40.0 per cent, demonstrating that Ontario continues to make positive progress towards reducing the debt burden, while remaining committed to the target originally set in the 2023 Budget. Ontario’s plan keeps this ratio close to the lowest level since 2013–14, over the medium-term outlook.
Ontario’s net debt-to-operating revenue is an indicator of how many years it would take to eliminate the debt if the Ontario government were to spend all its annual revenue on debt repayment. This ratio is projected to be 195 per cent in 2024–25, 211 per cent in 2025–26 and 215 per cent in 2026–27. In comparison to the 2024 Budget, the forecast for this ratio decreases by 18 percentage points in 2024–25, and remains the same in 2025–26, before increasing by six percentage points in 2026–27. The ratio is forecast to be 212 per cent in 2027–28.
These trends indicate that although the net debt-to-operating revenue ratio increases in the medium term, it remains relatively consistent with the 2024 Budget forecast.
Ontario’s target for the net debt-to-operating revenue ratio remains to be below 200 per cent. Based on the growth trend in net debt and revenue beyond the medium-term outlook, this ratio is expected to meet the target of 200 per cent by 2031–32, or as early as 2028–29 should the Faster Growth scenario materialize.
Ontario’s net interest-to-operating revenue ratio represents how much Ontario needs to spend on interest for every revenue dollar received. The ratio is projected to be 5.8 per cent in 2024–25, 6.5 per cent in 2025–26, and 6.7 per cent in 2026–27. In comparison to the 2024 Budget, the ratio decreased by 1.0 and 0.3 percentage points for 2024–25 and 2025–26 while remaining the same in 2026–27. The ratio is forecast to be 6.8 per cent in 2027–28.
Ontario continues to show positive progress on the net interest-to-operating revenue ratio and is forecasting to meet the target and stay below 7.5 per cent over the medium-term outlook. This ratio remains close to the lowest levels it has been at since the 1980s.
A lower net interest-to-operating revenue ratio frees up resources for other priorities.
Consolidated Financial Tables
| Debt2 | 2020–21 | 2021–22 | 2022–23 | Actual 2023–24 | Interim1 2024–25 | Plan 2025–26 |
|---|---|---|---|---|---|---|
| Publicly Held Debt — Bonds3 | 381,492 | 399,628 | 403,398 | 417,308 | 440,319 | 450,637 |
| Publicly Held Debt — Treasury Bills | 24,097 | 22,301 | 22,276 | 22,536 | 22,303 | 27,303 |
| Publicly Held Debt — U.S. Commercial Paper4 | – | 1,735 | 460 | – | 5,233 | 5,233 |
| Publicly Held Debt — Infrastructure Ontario (IO)5 | 300 | 300 | 300 | 300 | 300 | 300 |
| Publicly Held Debt — Other | 250 | 231 | 217 | 202 | 186 | 169 |
| Total Publicly Held Debt | 406,139 | 424,195 | 426,651 | 440,346 | 468,341 | 483,642 |
| Non-Public Debt | 9,318 | 8,766 | 8,678 | 7,956 | 6,780 | 6,164 |
| Gross Debt | 415,457 | 432,961 | 435,329 | 448,302 | 475,121 | 489,806 |
| Less: Holdings of own Ontario Bonds and Treasury Bills6 | (11,122) | (7,098) | (10,154) | (6,125) | (12,549) | – |
| Less: Unamortized Discounts, Premiums and Commissions7 | – | – | (3,376) | (4,544) | (4,361) | – |
| Total Debt | 404,335 | 425,863 | 421,799 | 437,633 | 458,211 | 489,806 |
| Other Net Financial (Assets)/Liabilities8 | (44,396) | (54,729) | (38,554) | (48,080) | (51,538) | (51,900) |
| Broader Public Sector Net Debt | 12,562 | 11,708 | 16,561 | 18,416 | 21,447 | 22,847 |
| Net Debt | 372,501 | 382,842 | 399,806 | 407,969 | 428,120 | 460,753 |
| Non-Financial Assets9 | (134,270) | (144,682) | (153,799) | (163,660) | (177,815) | (195,839) |
| Accumulated Deficit | 238,231 | 238,160 | 246,007 | 244,309 | 250,305 | 264,914 |
Table 4.4 footnotes:
[1] Interim represents the 2025 Budget projection for the 2024–25 fiscal year.
[2] Includes debt issued by Ontario and all government organizations, including the Ontario Electricity Financial Corporation (OEFC).
[3], [4] All balances are expressed in Canadian dollars. The balances above reflect the effect of related derivative contracts.
[5] IO debt is composed of Infrastructure Renewal Bonds. IO debt is not guaranteed by Ontario.
[6] Ontario holds its own debt mainly to reduce the cash flow required to service large maturities, typically in June. For 2025–26, there are currently no significant holdings for maturities.
[7] Effective April 1, 2022, Ontario adopted the new Public Sector Accounting Standards (PSAS) on Financial Instruments on a prospective basis. Unamortized discounts and premiums are now amortized on an effective interest basis. These amounts are not forecasted for 2025–26.
[8] Other Net Financial (Assets)/Liabilities include cash and temporary investments, accounts receivable, loans receivable, advances and investments in Government Business Enterprises (GBEs) offset by accounts payable, accrued liabilities, deferred revenue and capital contributions, pensions and other employee future benefits, and other liabilities.
[9] Non-financial assets include the tangible capital assets of Ontario, including the broader public sector.
Sources: Ontario Financing Authority and Ontario Ministry of Finance.
| Item | 2025–26 | 2026–27 | 2027–28 |
|---|---|---|---|
| Total Debt | 489,806 | 506,879 | 512,510 |
| Other Net Financial (Assets)/Liabilities | (51,900) | (42,657) | (35,938) |
| Broader Public Sector Net Debt | 22,847 | 22,810 | 25,166 |
| Net Debt | 460,753 | 487,032 | 501,738 |
| Non-Financial Assets | (195,839) | (214,338) | (229,269) |
| Accumulated Deficit | 264,914 | 272,694 | 272,469 |
Table 4.5 footnotes:
Note: Numbers may not add due to rounding.
Sources: Ontario Financing Authority and Ontario Ministry of Finance.
Chart Descriptions
Chart 4.1: Borrowing Outlook Scenarios for Long-Term Borrowing
| Year | 2024–25 | 2025–26 | 2026–27 | 2027–28 |
|---|---|---|---|---|
| Planning Projection | 49.5 | 42.8 | 41.1 | 33.0 |
| Slower Growth Scenario | 49.5 | 45.3 | 47.2 | 40.9 |
| Faster Growth Scenario | 49.5 | 40.5 | 35.8 | 25.9 |
Sources: Ontario Financing Authority and Ontario Ministry of Finance.
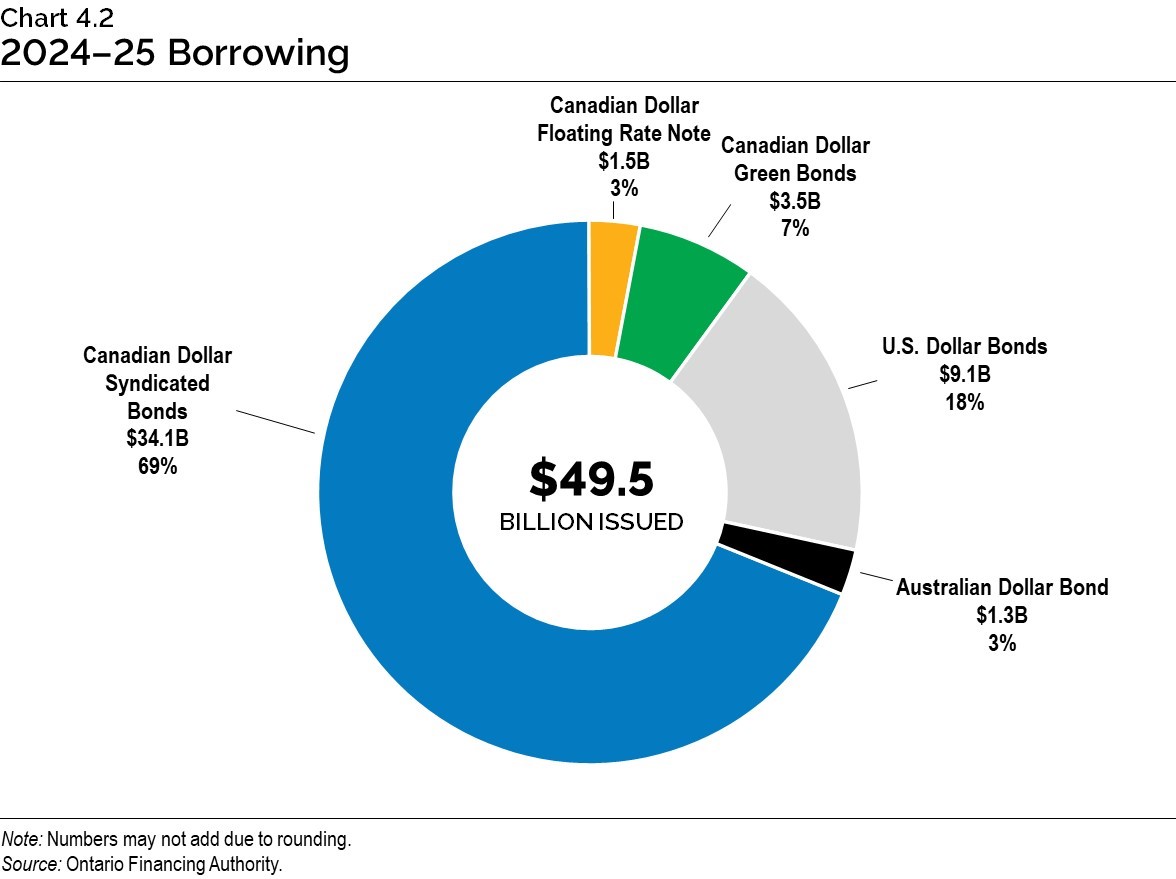
Chart 4.2: 2024–25 Borrowing
Long-term public borrowing of $49.5 billion has been completed for fiscal year 2024–25. This consisted of $34.1 billion (69 per cent) of Canadian dollar syndicated bonds, $3.5 billion (7 per cent) Canadian dollar Green Bonds, $1.5 billion (3 per cent) of Canadian Dollar Floating Rate Note, $1.3 billion (3 per cent) of Australian dollar bond, and $9.1 billion (18 per cent) of U.S. dollar bonds.
Note: Numbers may not add due to rounding.
Source: Ontario Financing Authority.
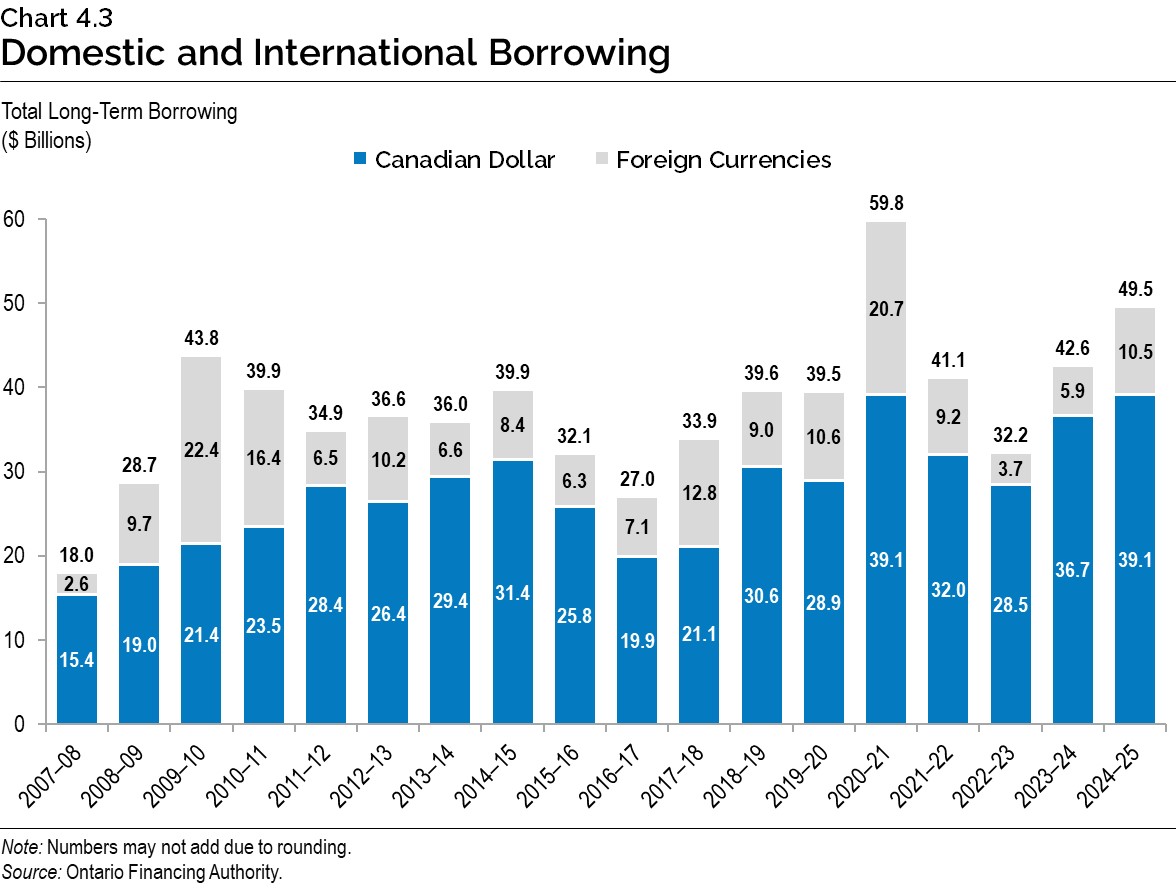
Chart 4.3: Domestic and International Borrowing
Ontario’s total long-term borrowing completed in 2024–25 is $49.5 billion — $39.1 billion was borrowed in the Canadian dollar market and $10.5 billion was borrowed in foreign currencies.
| Year | Canadian Dollar ($ Billions) | Foreign Currencies ($ Billions) | Total ($ Billions) |
|---|---|---|---|
| 2007–08 | 15.4 | 2.6 | 18.0 |
| 2008–09 | 19.0 | 9.7 | 28.7 |
| 2009–10 | 21.4 | 22.4 | 43.8 |
| 2010–11 | 23.5 | 16.4 | 39.9 |
| 2011–12 | 28.4 | 6.5 | 34.9 |
| 2012–13 | 26.4 | 10.2 | 36.6 |
| 2013–14 | 29.4 | 6.6 | 36.0 |
| 2014–15 | 31.4 | 8.4 | 39.9 |
| 2015–16 | 25.8 | 6.3 | 32.1 |
| 2016–17 | 19.9 | 7.1 | 27.0 |
| 2017–18 | 21.1 | 12.8 | 33.9 |
| 2018–19 | 30.6 | 9.0 | 39.6 |
| 2019–20 | 28.9 | 10.6 | 39.5 |
| 2020–21 | 39.1 | 20.7 | 59.8 |
| 2021–22 | 32.0 | 9.2 | 41.1 |
| 2022–23 | 28.5 | 3.7 | 32.2 |
| 2023–24 | 36.7 | 5.9 | 42.6 |
| 2024–25 | 39.1 | 10.5 | 49.5 |
Note: Numbers may not add due to rounding.
Source: Ontario Financing Authority.
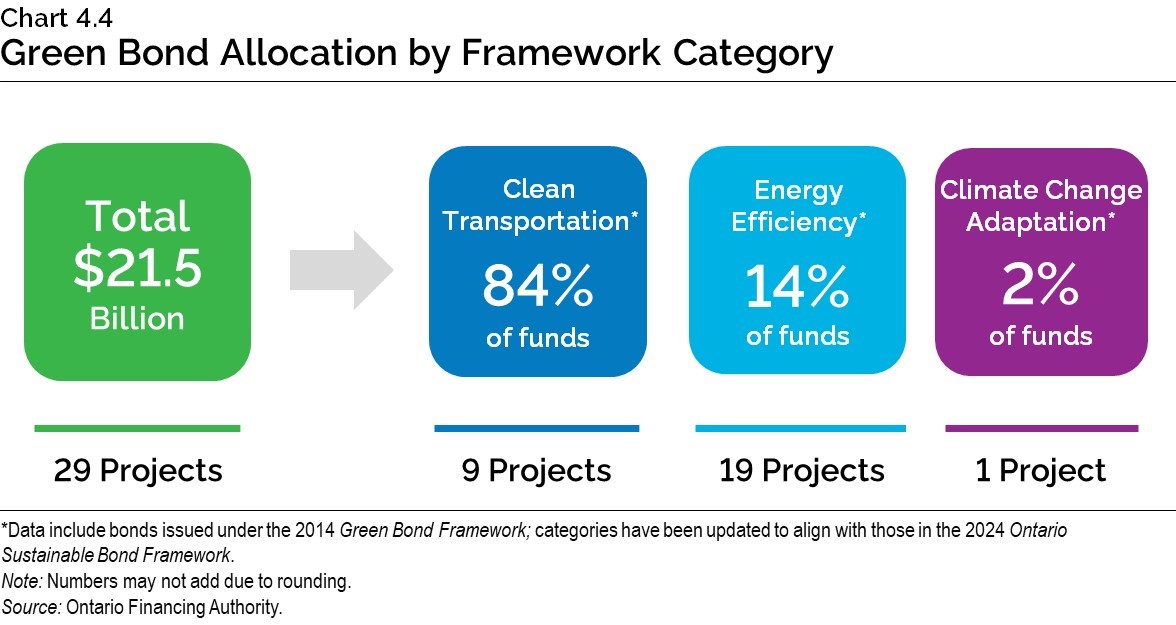
Chart 4.4: Green Bond Allocation by Framework Category
A total of $21.5 billion in Green Bond funding has or will provide funding for 29 projects. Nine of those projects are under the Clean Transportation framework category and have received 84 per cent of the funding. Nineteen projects are under the Energy Efficiency category and have received 14 per cent of the funding. One project is under the Climate Change Adaptation category and has received 2 per cent of the funding.
Note: Numbers may not add due to rounding.
Source: Ontario Financing Authority.
Chart 4.5: Ontario’s Green Bond Issues
Since 2014, Ontario has issued Green Bonds totalling $21.5 billion.
| Year | 2014–15 | 2015–16 | 2016–17 | 2017–18 | 2018–19 | 2019–20 | 2020–21 | 2021–22 | 2022–23 | 2023–24 | 2024–25 |
|---|---|---|---|---|---|---|---|---|---|---|---|
| Green Bond Issues ($) | $0.5 billion | $0.75 billion | $0.8 billion | $1.0 billion | $0.95 billion | $1.25 billion |
$2.75 billion | $4.5 billion | $2.5 billion | $3.0 billion | $3.5 billion |
Source: Ontario Financing Authority.
Chart 4.6: Effective Interest Rate (Weighted Average) on Total Debt
The effective interest rate (calculated as a weighted average) for 2024–25 is 3.5 per cent on Ontario’s total debt.
| Year | Effective Interest Rate (%) |
|---|---|
| 1990–91 | 10.9 |
| 1991–92 | 10.7 |
| 1992–93 | 10.1 |
| 1993–94 | 9.5 |
| 1994–95 | 9.8 |
| 1995–96 | 9.4 |
| 1996–97 | 9.0 |
| 1997–98 | 9.0 |
| 1998–99 | 8.6 |
| 1999–00 | 8.4 |
| 2000–01 | 8.2 |
| 2001–02 | 7.6 |
| 2002–03 | 7.2 |
| 2003–04 | 6.7 |
| 2004–05 | 6.4 |
| 2005–06 | 6.1 |
| 2006–07 | 6.0 |
| 2007–08 | 5.8 |
| 2008–09 | 5.2 |
| 2009–10 | 4.6 |
| 2010–11 | 4.5 |
| 2011–12 | 4.4 |
| 2012–13 | 4.1 |
| 2013–14 | 3.9 |
| 2014–15 | 3.7 |
| 2015–16 | 3.6 |
| 2016–17 | 3.5 |
| 2017–18 | 3.6 |
| 2018–19 | 3.6 |
| 2019–20 | 3.4 |
| 2020–21 | 3.0 |
| 2021–22 | 3.0 |
| 2022–23 | 3.2 |
| 2023–24 | 3.4 |
| 2024–25 | 3.5 |
Sources: Public Accounts of Ontario (1990–1991 to 2023–2024) and Ontario Financing Authority.
Chart 4.7: Average Annual Ontario Borrowing Rate Forecast
| Year | 2025 Budget (%) | 2024 Budget (%) |
|---|---|---|
| 2024–25 | 3.94 | 4.0 |
| 2025–26 | 4.0 | 4.0 |
| 2026–27 | 4.1 | 4.0 |
| 2027–28 | 4.1 | – |
Source: Ontario Financing Authority.
Chart 4.8: Weighted-Average Term of Borrowings
The average term of Ontario’s debt portfolio has been extended from 9.7 years in 2009–10 to 11.3 years in 2024–25. The weighted-average borrowing term for 2024–25 was 14.1 years.
| Year | Weighted-Average Borrowing Term (Years) | Debt Portfolio Average Term (Years) |
|---|---|---|
| 2009–10 | 8.1 | 9.7 |
| 2010–11 | 12.8 | 10 |
| 2011–12 | 13 | 10.1 |
| 2012–13 | 12.4 | 10.1 |
| 2013–14 | 13.6 | 10.4 |
| 2014–15 | 14.1 | 10.7 |
| 2015–16 | 14.2 | 10.9 |
| 2016–17 | 13.9 | 10.9 |
| 2017–18 | 12.1 | 10.7 |
| 2018–19 | 12.9 | 10.7 |
| 2019–20 | 14.5 | 10.9 |
| 2020–21 | 12 | 10.8 |
| 2021–22 | 14.5 | 10.9 |
| 2022–23 | 15 | 11.1 |
| 2023–24 | 15.2 | 11.4 |
| 2024–25 | 14.1 | 11.3 |
Source: Ontario Financing Authority.
Chart 4.9: Average Unrestricted Liquid Reserve Levels
Average unrestricted liquid reserves averaged $41.9 billion in 2024–25.
| Year | Average Unrestricted Liquid Reserve Levels ($ billions) |
|---|---|
| 2009–10 | 14.4 |
| 2010–11 | 19.4 |
| 2011–12 | 20.2 |
| 2012–13 | 23.3 |
| 2013–14 | 24.9 |
| 2014–15 | 23.6 |
| 2015–16 | 21.7 |
| 2016–17 | 21.1 |
| 2017–18 | 30.1 |
| 2018–19 | 32.7 |
| 2019–20 | 32.3 |
| 2020–21 | 46.2 |
| 2021–22 | 47.2 |
| 2022–23 | 36.2 |
| 2023–24 | 46.8 |
| 2024–25 | 41.9 |
Source: Ontario Financing Authority.
Chart 4.10: Net Debt-to-GDP
Ontario’s net debt-to-GDP ratio is forecast at 36.3 per cent in 2024–25.
| Year | Planning Projection (%) | Faster Growth Scenario (%) | Slower Growth Scenario (%) |
|---|---|---|---|
| 1990–91 | 13.4 | – | – |
| 1991–92 | 17.1 | – | – |
| 1992–93 | 21.1 | – | – |
| 1993–94 | 26.6 | – | – |
| 1994–95 | 28.3 | – | – |
| 1995–96 | 30.1 | – | – |
| 1996–97 | 31.2 | – | – |
| 1997–98 | 30.5 | – | – |
| 1998–99 | 29.4 | – | – |
| 1999–00 | 32.1 | – | – |
| 2000–01 | 29.3 | – | – |
| 2001–02 | 28.2 | – | – |
| 2002–03 | 26.8 | – | – |
| 2003–04 | 27.5 | – | – |
| 2004–05 | 26.8 | – | – |
| 2005–06 | 27.8 | – | – |
| 2006–07 | 27.1 | – | – |
| 2007–08 | 26.6 | – | – |
| 2008–09 | 27.8 | – | – |
| 2009–10 | 32.3 | – | – |
| 2010–11 | 34.5 | – | – |
| 2011–12 | 36.6 | – | – |
| 2012–13 | 38.2 | – | – |
| 2013–14 | 39.7 | – | – |
| 2014–15 | 40.5 | – | – |
| 2015–16 | 40.3 | – | – |
| 2016–17 | 39.7 | – | – |
| 2017–18 | 39.2 | – | – |
| 2018–19 | 39.3 | – | – |
| 2019–20 | 39.5 | – | – |
| 2020–21 | 42.6 | – | – |
| 2021–22 | 39.5 | – | – |
| 2022–23 | 37.7 | – | – |
| 2023–24 | 36.4 | – | – |
| 2024–25 | 36.3 | – | – |
| 2025–26 | 37.9 | 37.5 | 38.4 |
| 2026–27 | 38.9 | 37.7 | 40.5 |
| 2027–28 | 38.6 | 36.9 | 40.7 |
Note: See Chapter 3: Ontario’s Fiscal Plan and Outlook for details on the Faster Growth and Slower Growth scenarios.
Sources: Statistics Canada and Ontario Ministry of Finance.
Chart 4.11: Net Debt-to-Operating Revenue (formerly Net Debt-to-Revenue)
Ontario’s net debt-to-operating revenue ratio is forecast to be 195 per cent in 2024–25.
| Year | Planning Projection (%) | Faster Growth Scenario (%) | Slower Growth Scenario (%) |
|---|---|---|---|
| 1990–91 | 78 | – | – |
| 1991–92 | 104 | – | – |
| 1992–93 | 126 | – | – |
| 1993–94 | 157 | – | – |
| 1994–95 | 168 | – | – |
| 1995–96 | 176 | – | – |
| 1996–97 | 187 | – | – |
| 1997–98 | 184 | – | – |
| 1998–99 | 182 | – | – |
| 1999–00 | 189 | – | – |
| 2000–01 | 183 | – | – |
| 2001–02 | 183 | – | – |
| 2002–03 | 177 | – | – |
| 2003–04 | 188 | – | – |
| 2004–05 | 170 | – | – |
| 2005–06 | 162 | – | – |
| 2006–07 | 153 | – | – |
| 2007–08 | 146 | – | – |
| 2008–09 | 164 | – | – |
| 2009–10 | 189 | – | – |
| 2010–11 | 192 | – | – |
| 2011–12 | 208 | – | – |
| 2012–13 | 216 | – | – |
| 2013–14 | 225 | – | – |
| 2014–15 | 234 | – | – |
| 2015–16 | 225 | – | – |
| 2016–17 | 223 | – | – |
| 2017–18 | 214 | – | – |
| 2018–19 | 220 | – | – |
| 2019–20 | 226 | – | – |
| 2020–21 | 226 | – | – |
| 2021–22 | 207 | – | – |
| 2022–23 | 207 | – | – |
| 2023–24 | 198 | – | – |
| 2024–25 | 195 | – | – |
| 2025–26 | 211 | 208 | 215 |
| 2026–27 | 215 | 207 | 225 |
| 2027–28 | 212 | 201 | 227 |
Note: See Chapter 3: Ontario’s Fiscal Plan and Outlook for details on the Faster Growth and Slower Growth scenarios.
Sources: Public Accounts of Ontario (1990–1991 to 2023–2024) and Ontario Financing Authority.
Chart 4.12: Net Interest-to-Operating Revenue (formerly Interest on
Debt-to-Revenue)
Ontario’s net interest-to-operating revenue ratio is forecast to be 5.8 per cent in 2024–25.
| Year | Planning Projection (%) | Faster Growth Scenario (%) | Slower Growth Scenario (%) |
|---|---|---|---|
| 1990–91 | 7.7 | – | – |
| 1991–92 | 8.8 | – | – |
| 1992–93 | 10.8 | – | – |
| 1993–94 | 13.9 | – | – |
| 1994–95 | 14.5 | – | – |
| 1995–96 | 14.6 | – | – |
| 1996–97 | 14.8 | – | – |
| 1997–98 | 14.2 | – | – |
| 1998–99 | 14.3 | – | – |
| 1999–00 | 15.5 | – | – |
| 2000–01 | 15.0 | – | – |
| 2001–02 | 14.2 | – | – |
| 2002–03 | 12.9 | – | – |
| 2003–04 | 12.9 | – | – |
| 2004–05 | 11.1 | – | – |
| 2005–06 | 9.7 | – | – |
| 2006–07 | 8.9 | – | – |
| 2007–08 | 8.4 | – | – |
| 2008–09 | 8.7 | – | – |
| 2009–10 | 8.9 | – | – |
| 2010–11 | 8.8 | – | – |
| 2011–12 | 9.1 | – | – |
| 2012–13 | 9.0 | – | – |
| 2013–14 | 9.1 | – | – |
| 2014–15 | 8.9 | – | – |
| 2015–16 | 8.5 | – | – |
| 2016–17 | 8.3 | – | – |
| 2017–18 | 7.9 | – | – |
| 2018–19 | 8.1 | – | – |
| 2019–20 | 8.0 | – | – |
| 2020–21 | 7.5 | – | – |
| 2021–22 | 6.8 | – | – |
| 2022–23 | 6.4 | – | – |
| 2023–24 | 5.5 | – | – |
| 2024–25 | 5.8 | – | – |
| 2025–26 | 6.5 | 6.4 | 6.6 |
| 2026–27 | 6.7 | 6.5 | 7.0 |
| 2027–28 | 6.8 | 6.4 | 7.2 |
Note: See Chapter 3: Ontario’s Fiscal Plan and Outlook for details on the Faster Growth and Slower Growth scenarios.
Sources: Public Accounts of Ontario (1990–1991 to 2023–2024) and Ontario Financing Authority.