Introduction
Although Ontario’s economy has proved resilient throughout the COVID-19 pandemic, with worldwide supply chain disruptions, a global surge in inflation, decades high population growth, and the fastest rise in interest rates in recent Canadian history, it now faces one of its greatest challenges. The tariffs imposed by the United States are a significant risk to Ontario’s economy and are already impacting people and businesses on both sides of the border.
Against this backdrop, this government is taking bold and decisive action to invest in the people of Ontario.
While these factors are expected to drive a fiscal deterioration relative to the outlook in the 2024 Ontario Economic Outlook and Fiscal Review, the 2025 Budget plan remains prudent and responsible. Despite deficits of $14.6 billion in 2025–26 and $7.8 billion in 2026–27, Ontario retains a path to balance by 2027–28. Key debt metrics remain some of the best seen in this province in over a decade and the government is well-positioned to protect workers and businesses. This year’s plan incorporates levels of prudence only previously seen during the 2008–09 Global Financial Crisis and COVID-19 pandemic. This leaves room to respond quickly and effectively should U.S. trade aggression escalate.
| Item | Actual 2023–24 |
Interim2 2024–25 |
Medium-Term Outlook 2025–26 |
Medium-Term Outlook 2026–27 |
Medium-Term Outlook 2027–28 |
|---|---|---|---|---|---|
| Revenue | 209.0 | 221.6 | 219.9 | 227.9 | 237.9 |
| Expense — Programs | 195.2 | 212.4 | 216.3 | 216.7 | 217.9 |
| Expense — Interest and Other Debt Servicing Charges | 14.5 | 15.2 | 16.2 | 17.0 | 17.8 |
| Total Expense | 209.7 | 227.6 | 232.5 | 233.7 | 235.7 |
| Surplus/(Deficit) Before Reserve | (0.6) | (6.0) | (12.6) | (5.8) | 2.2 |
| Reserve | – | - | 2.0 | 2.0 | 2.0 |
| Surplus/(Deficit) | (0.6) | (6.0) | (14.6) | (7.8) | 0.2 |
| Net Debt as a Per Cent of GDP | 36.4% | 36.3% | 37.9% | 38.9% | 38.6% |
| Net Debt as a Per Cent of Operating Revenue | 198.1% | 195.4% | 211.4% | 215.4% | 212.4% |
| Net Interest as a Per Cent of Operating Revenue | 5.5% | 5.8% | 6.5% | 6.7% | 6.8% |
Table 3.1 footnotes:
[1] Beginning in the 2025 Budget, the Total Revenue, Interest and Other Debt Servicing Charges (IOD), and Total Expense figures for all years have been restated to report interest and investment income as part of revenue and separate from IOD. These changes are fiscally neutral.
[2] Interim represents the 2025 Budget projection for the 2024–25 fiscal year.
Note: Numbers may not add due to rounding.
Sources: Ontario Treasury Board Secretariat and Ontario Ministry of Finance.
2024–25 Interim Fiscal Performance
Ontario’s 2024–25 deficit is projected to be $6.0 billion — $3.8 billion lower than the outlook published in the 2024 Budget.
Total revenues in 2024–25 are projected to be $221.6 billion — $13.4 billion higher than forecast in the 2024 Budget, mainly reflecting increases in taxation revenue, other non-tax revenue and net income from Government Business Enterprises.
Program expense is projected to be $212.4 billion, $11.8 billion higher than the 2024 Budget forecast, primarily due to investments in health care, education and other critical services.
Ontario is forecast to pay $15.2 billion in interest and other debt servicing charges in 2024–25, lower than the forecast in the 2024 Budget, mainly due to lower than projected borrowing costs. At 36.3 per cent, the net debt‐to‐GDP ratio in 2024–25 is forecast to be 2.9 percentage points lower than in the 2024 Budget, primarily due to much stronger real and nominal GDP growth in 2024 and a lower than forecast deficit.
The 2024 Budget also included a $1.0 billion reserve in 2024–25 to protect the fiscal plan against unforeseen adverse changes in Ontario’s revenue and expense forecasts. The reserve was not required at fiscal year-end and has been drawn down to zero at interim, reducing the deficit further.
| Item | 2024 Budget |
Interim2 2024–25 |
In-Year Change |
|---|---|---|---|
| Revenue | 208.2 | 221.6 | 13.4 |
| Expense — Programs | 200.6 | 212.4 | 11.8 |
| Expense — Interest and Other Debt Servicing Charges | 16.5 | 15.2 | (1.2) |
| Total Expense | 217.0 | 227.6 | 10.6 |
| Surplus/(Deficit) Before Reserve | (8.8) | (6.0) | 2.8 |
| Reserve | 1.0 | – | (1.0) |
| Surplus/(Deficit) | (9.8) | (6.0) | 3.8 |
Table 3.2 footnotes:
[1] Beginning in the 2025 Budget, the Total Revenue, Interest and Other Debt Servicing Charges (IOD), and Total Expense figures for all years have been restated to report investment income as part of revenue and separate from IOD. These changes are fiscally neutral.
[2] Interim represents the 2025 Budget projection for the 2024–25 fiscal year.
Note: Numbers may not add due to rounding.
Sources: Ontario Treasury Board Secretariat and Ontario Ministry of Finance.
Revenue Update
The 2024–25 total revenue outlook is $13.4 billion higher than projected in the 2024 Budget. Since the release of the 2024 Ontario Economic Outlook and Fiscal Review, total revenue is projected to increase by $6.4 billion, mainly due to higher Other Non-Tax Revenue, Taxation Revenue and net income from Government Business Enterprises.
| Item | Interim1,2 2024–25 |
|---|---|
| 2024 Budget Total Revenue | 208,241 |
| Revenue Changes in the 2024–25 First Quarter Finances | – |
| Revenue Changes in the 2024 Ontario Economic Outlook and Fiscal Review | 6,942 |
| Revenue Changes Since the 2024 Ontario Economic Outlook and Fiscal Review — Personal Income Tax | 1,538 |
| Revenue Changes Since the 2024 Ontario Economic Outlook and Fiscal Review — Ontario Health Premium | 91 |
| Revenue Changes Since the 2024 Ontario Economic Outlook and Fiscal Review — Corporations Tax | 67 |
| Revenue Changes Since the 2024 Ontario Economic Outlook and Fiscal Review — Sales Tax | (558) |
| Revenue Changes Since the 2024 Ontario Economic Outlook and Fiscal Review — All Other Taxation | 39 |
| Revenue Changes Since the 2024 Ontario Economic Outlook and Fiscal Review — Total Taxation Revenue | 1,178 |
| Revenue Changes Since the 2024 Ontario Economic Outlook and Fiscal Review — Government of Canada Transfers | 57 |
| Revenue Changes Since the 2024 Ontario Economic Outlook and Fiscal Review — Government Business Enterprises | 732 |
| Revenue Changes Since the 2024 Ontario Economic Outlook and Fiscal Review — Other Non-Tax Revenue | 4,452 |
| Total Revenue Changes Since the 2024 Ontario Economic Outlook and Fiscal Review | 6,419 |
| Total Revenue Changes Since the 2024 Budget | 13,361 |
| 2025 Budget Total Revenue Outlook | 221,602 |
Table 3.3 footnotes:
[1] Beginning in the 2025 Budget, the Total Revenue, Interest and Other Debt Servicing Charges (IOD), and Total Expense figures for all years, including the projections in the 2024 Budget and the 2024 Ontario Economic Outlook and Fiscal Review, have been restated to report interest and investment income as part of revenue and separate from IOD. These changes are fiscally neutral.
[2] Interim represents the 2025 Budget projection for the 2024–25 fiscal year.
Note: Numbers may not add due to rounding.
Source: Ontario Ministry of Finance.
The forecast for Total Taxation Revenue has increased by $1,178 million compared to the 2024 Ontario Economic Outlook and Fiscal Review. Key changes in the taxation revenue outlook include:
- Personal Income Tax revenue projections increased by $1,538 million, mostly reflecting higher than expected economic growth in 2024 as well as higher than expected revenues from the processing of 2023 and prior years’ tax returns by the Canada Revenue Agency (CRA). Personal Income Tax revenue is moderated by the federal decision to not move forward with capital gains inclusion rate increases first announced in their federal Budget 2024;
- Ontario Health Premium revenue projections increased by $91 million, mostly reflecting higher than expected compensation of employee growth in 2024 and higher than expected revenues from the processing of 2023 and prior years’ tax returns by the CRA;
- Corporations Tax revenue projections increased by $67 million, mainly reflecting higher than anticipated corporate profit growth in 2024, moderated by weaker 2023 and prior year tax returns from the CRA. Corporations tax revenue is further moderated by the federal decision to not move forward with capital gains inclusion rate increases first announced in their federal Budget 2024;
- Sales Tax revenue projections decreased by $558 million, mainly due to the impact of the federal Harmonized Sales Tax (HST) holiday and lower 2025 official federal entitlement estimates, partially offset by higher-than-expected official 2023 and prior years’ federal HST entitlements; and
- Projections for All Other Taxation combined increased by $39 million, mainly due to higher revenues from Land Transfer Tax and the Employer Health Tax that were partly offset by lower Electricity Payments in Lieu of Taxes, Tobacco Tax and Fuel Tax.
Government of Canada Transfers projections increased by $57 million, mainly due to higher Canada Health Transfer and Canada Social Transfer.
Net income from Government Business Enterprises projections increased by $732 million, mainly due to a higher net income from Ontario Power Generation (OPG), primarily reflecting a large nuclear funds consolidation adjustment.
Other Non-Tax Revenue projections increased by $4,452 million, mainly reflecting the amount the province will receive for smoking-related health care costs under a court approved settlement between tobacco companies and their creditors, including provincial and territorial governments. The increase also reflects higher third-party revenue from college and school board sectors.
Expense Update
Since the release of the 2024 Budget, the government has made targeted investments throughout the fiscal year to continue to make progress on its plan to build Ontario, while also investing in critical public services. The 2024–25 total expense outlook is $227.6 billion, $10.6 billion higher than the 2024 Budget.
Since the release of the most recent update as part of the 2024 Ontario Economic Outlook and Fiscal Review, the total program expense projection has increased by $6.8 billion, primarily due to higher than forecasted ministry spending, partially offset by the Contingency Fund.
| Item | Interim1,2 2024–25 |
|---|---|
| 2024 Budget Total Expense | 217,047 |
| Total Expense Changes in the 2024–25 First Quarter Finances | – |
| Total Expense Changes in the 2024 Ontario Economic Outlook and Fiscal Review | 3,773 |
| Program Expense Changes Since the 2024 Ontario Economic Outlook and Fiscal Review — Health Sector | 3,358 |
| Program Expense Changes Since the 2024 Ontario Economic Outlook and Fiscal Review — Education Sector3 | 732 |
| Program Expense Changes Since the 2024 Ontario Economic Outlook and Fiscal Review — Postsecondary Education Sector | 2,050 |
| Program Expense Changes Since the 2024 Ontario Economic Outlook and Fiscal Review — Children, Community and Social Services Sector | 649 |
| Program Expense Changes Since the 2024 Ontario Economic Outlook and Fiscal Review — Justice Sector | 360 |
| Program Expense Changes Since the 2024 Ontario Economic Outlook and Fiscal Review — Other Programs | (2,986) |
| Total Base Program Expense Changes Since the 2024 Ontario Economic Outlook and Fiscal Review | 4,163 |
| Significant Exceptional Expenses | 2,664 |
| Total Program Expense Changes Since the 2024 Ontario Economic Outlook and Fiscal Review | 6,827 |
| Interest and Other Debt Servicing Charges Change Since the 2024 Ontario Economic Outlook and Fiscal Review | (49) |
| Total Expense Changes Since the 2024 Ontario Economic Outlook and Fiscal Review | 6,778 |
| Total Expense Changes Since the 2024 Budget | 10,551 |
| 2025 Budget Total Expense Outlook | 227,598 |
Table 3.4 footnotes:
[1] Beginning in the 2025 Budget, the Total Revenue, Interest and Other Debt Servicing Charges (IOD), and Total Expense figures for all years, including the projections in the 2024 Budget and the 2024 Ontario Economic Outlook and Fiscal Review, have been restated to report interest and investment income as part of revenue and separate from IOD. These changes are fiscally neutral.
[2] Interim represents the 2025 Budget projection for the 2024–25 fiscal year.
[3] Excludes Teachers’ Pension Plan. Teachers’ Pension Plan expense is included in Other Programs.
Note: Numbers may not add due to rounding.
Sources: Ontario Treasury Board Secretariat and Ontario Ministry of Finance.
The following program expense changes are projected since the release of the 2024 Ontario Economic Outlook and Fiscal Review:
- Health sector expense is projected to be $3,358 million higher, primarily to address pressures related to compensation costs for the delivery of health care and to address growing demand for other health services, such as utilization-driven programs like the Ontario Health Insurance Plan (OHIP) and Ontario Public Drug Programs (OPDP).
- Education sector expense is projected to be $732 million higher, mainly due to compensation costs related to labour agreements and higher than forecasted school board spending.
- Postsecondary Education sector expense is projected to be $2,050 million higher, mainly due to higher-than-forecasted spending in the college sector, offset by third-party revenues, as well as higher-than-expected uptake for student financial assistance.
- Children, Community and Social Services sector expense is projected to be $649 million higher, primarily because of higher-than-expected demand for Ontario Works, due to an increase in the number of asylum seekers arriving in Ontario.
- Justice sector expense is projected to be $360 million higher, mainly due to investments in the First Nations and Inuit Policing Program and essential service delivery in corrections, coroner and forensic pathology services.
- Other Programs expense is projected to be a net $2,986 million lower, primarily due to:
- Drawdowns of the Contingency Fund to offset increases in other sectors; as well as
- Lower-than-projected spending across various ministries, including for demand-driven programs.
The total program expense also reflects projected increases in 2024–25 for other significant exceptional expenses of $2,664 million, representing health-related retroactive compensation payments and legal settlement costs, including those associated with ongoing land and other claims by Indigenous communities. These expenses are broken out to provide greater transparency.
Interest and Other Debt Servicing Charges expense is projected to be $49 million lower due to a lower interim deficit, and lower than forecast interest rates.
Prudence in 2024–25
The Contingency Fund is maintained to help mitigate expense risks that may adversely affect Ontario’s fiscal performance. For the remainder of 2024–25, the Contingency Fund had a remaining balance of $100 million, which was made available to offset additional expenses that may materialize before the end of the fiscal year.
The 2024 Budget included a reserve of $1.0 billion in 2024–25, which was not required and has been drawn down to zero at interim.
Medium-Term Fiscal Plan
The government is projecting deficits of $14.6 billion in 2025–26, $7.8 billion in 2026–27, and a surplus of $0.2 billion in 2027–28. This outlook reflects both the weaker economic and revenue outlook associated with U.S. tariffs as well as economic response measures. It also reflects continuing investments in health care, education, and other key public services.
Medium-Term Revenue Outlook
Although total revenue is projected to increase from $209.0 billion in 2023–24 to $237.9 billion in 2027–28 — an average annual growth rate of 3.3 per cent — projections over the medium term are lower compared to the 2024 Ontario Economic Outlook and Fiscal Review. The revenue outlook reflects the Ontario Ministry of Finance’s outlook for economic growth, which is set slightly below the average of private-sector forecast. The average private-sector forecast has been downgraded significantly since October 2024, primarily because Ontario’s economy is expected to be hit particularly hard by U.S. tariffs.
| Item | Actual 2023–24 |
Interim2 2024–25 | Medium-Term Outlook 2025–26 |
Medium-Term Outlook 2026–27 |
Medium-Term Outlook 2027–28 |
|---|---|---|---|---|---|
| Revenue — Personal Income Tax | 50.8 | 56.3 | 57.8 | 61.3 | 65.2 |
| Revenue — Sales Tax | 39.9 | 39.4 | 40.1 | 41.6 | 43.6 |
| Revenue — Corporations Tax | 23.1 | 27.9 | 26.0 | 27.7 | 29.4 |
| Revenue — Ontario Health Premium | 5.0 | 5.2 | 5.4 | 5.6 | 5.8 |
| Revenue — Education Property Tax | 5.8 | 5.8 | 5.9 | 5.9 | 5.9 |
| Revenue — All Other Taxes | 17.3 | 18.1 | 18.6 | 19.2 | 19.8 |
| Total Taxation Revenue | 141.9 | 152.8 | 153.7 | 161.3 | 169.8 |
| Government of Canada | 34.3 | 36.4 | 38.8 | 39.3 | 39.8 |
| Income from Government Business Enterprises | 7.4 | 7.4 | 6.3 | 6.9 | 7.7 |
| Other Non-Tax Revenue | 25.4 | 25.0 | 21.0 | 20.3 | 20.6 |
| Total Revenue | 209.0 | 221.6 | 219.9 | 227.9 | 237.9 |
Table 3.5 footnotes:
[1] Beginning in the 2025 Budget, the Total Revenue, Interest and Other Debt Servicing Charges (IOD), and Total Expense figures for all years have been restated to report interest and investment income as part of revenue and separate from IOD. These changes are fiscally neutral.
[2] Interim represents the 2025 Budget projection for the 2024–25 fiscal year.
Note: Numbers may not add due to rounding.
Source: Ontario Ministry of Finance.
The primary driver of the forecast for Personal Income Tax (PIT) revenues is the outlook for growth in compensation of employees. Personal Income Tax revenue is projected to grow at an average annual rate of 6.5 per cent between 2023–24 and 2027–28.
The forecast for Sales Tax revenue is driven by the projection for household consumption spending. Average growth in Sales Tax revenue is 2.2 per cent between 2023–24 and 2027–28.
The forecast for Corporations Tax revenue is driven by the projections of corporate profitability. Corporations Tax revenue is projected to grow at an average annual rate of 6.2 per cent between 2023–24 and 2027–28.
The primary driver of the forecast for Ontario Health Premium revenue is the outlook for growth in compensation of employees. Ontario Health Premium revenue is projected to grow at an average annual rate of 3.6 per cent between 2023–24 and 2027–28.
Education Property Tax revenue is based primarily on the outlook for growth in the property assessment base resulting from new construction activities.
Revenues from All Other Taxes are projected to increase at an average annual rate of 3.5 per cent between 2023–24 and 2027–28. This includes revenues from the Employer Health Tax; Land Transfer Tax; Beer, Wine and Spirits Taxes; and volume-based taxes such as the Gasoline Tax, Fuel Tax and Tobacco Tax.
The forecast for Government of Canada Transfers is largely based on existing federal–provincial funding agreements and formulas. Federal transfers are projected to increase at an average annual rate of 3.8 per cent between 2023–24 and 2027–28.
The outlook for Income from Government Business Enterprises (GBEs) is based on Ontario Ministry of Finance estimates of net income for Hydro One Ltd. (Hydro One) and projections provided by Ontario Power Generation (OPG), the Ontario Cannabis Store (OCS), the Liquor Control Board of Ontario (LCBO), the Ontario Lottery and Gaming Corporation (OLG) and iGaming Ontario (iGO). The net incomes of GBEs are projected to increase at an average annual rate of 1.0 per cent from 2023–24 to 2027–28.
The forecast for Other Non-Tax Revenue is based on projections provided by government ministries and consolidated agencies. The outlook for Other Non-Tax Revenue is projected to decline at an average annual rate of 5.1 per cent from 2023–24 to 2027–28, mainly reflecting declining interest and investment revenues as well as third‐party revenues from the college sector.
Risks to the Revenue Outlook
There are a variety of risks to the economic planning assumptions underlying the revenue forecast, as outlined in Chapter 2: Economic Performance and Outlook. Table 3.6 highlights some key risks and sensitivities to the 2025–26 revenue forecast that could arise from unexpected changes in economic conditions. These are only estimates; actual results can vary. The risks identified are based on factors that are considered to have the most material impact on the largest revenue sources.
| Economic Factors | Revenue Sources | 2025–26 Sensitivities |
|---|---|---|
| Nominal GDP | Total Taxation Revenue | $1,160 million revenue change for each percentage point change in nominal GDP growth. This can vary significantly, depending on the composition and source of changes in GDP growth. |
| Compensation of Employees | Personal Income Tax; Ontario Health Premium; and Employer Health Tax | $750 million revenue change for each percentage point change in growth in compensation of employees. |
| Household Consumption Expenditures | Sales Tax | $301 million revenue change for each percentage point change in growth of household consumption expenditures. |
| Net Operating Surplus of Corporations | Corporations Tax | $233 million revenue change for each percentage point change in growth in net operating surplus of corporations. |
| Housing Resales and Resale Prices | Land Transfer Tax | $37 million revenue change for each percentage point change in growth of either housing resales or resale prices. |
| Ontario Population Share | Canada Health Transfer | $55 million revenue change for each one-tenth of a percentage point change in Ontario’s population share. |
| Ontario Population Share | Canada Social Transfer | $17 million revenue change for each one-tenth of a percentage point change in Ontario’s population share. |
Table 3.6 footnotes:
Source: Ontario Ministry of Finance.
Medium-Term Expense Outlook
The government is committed to protecting Ontario’s economy and its workers and to strengthening communities through investments in critical public services, including health care, education, infrastructure, and economic development. The total expense outlook is projected to grow from $209.7 billion in 2023–24 to $235.7 billion in 2027–28.
The government continues to invest in programs that serve the people of Ontario. Ontario’s program expense outlook is projected to grow from $195.2 billion in 2023–24 to $217.9 billion in 2027–28, for an average annual growth rate of 2.8 per cent.
| Item | Actual 2023–24 |
Interim2 2024–25 |
Medium-Term Outlook 2025–26 |
Medium-Term Outlook 2026–27 |
Medium-Term Outlook 2027–28 |
|---|---|---|---|---|---|
| Base Programs — Health Sector | 85.2 | 89.3 | 91.1 | 92.4 | 93.6 |
| Base Programs — Education Sector3 | 37.1 | 38.4 | 41.0 | 41.1 | 41.3 |
| Base Programs — Postsecondary Education Sector | 13.3 | 14.2 | 13.0 | 13.1 | 12.8 |
| Base Programs — Children, Community and Social Services Sector | 19.3 | 20.6 | 20.4 | 20.4 | 20.4 |
| Base Programs — Justice Sector | 6.0 | 6.5 | 6.7 | 6.5 | 6.4 |
| Base Programs — Other Programs | 34.4 | 40.6 | 44.1 | 43.1 | 43.3 |
| Total Base Programs | 195.2 | 209.7 | 216.3 | 216.7 | 217.9 |
| Significant Exceptional Expenses | – | 2.7 | – | – | – |
| Total Programs | 195.2 | 212.4 | 216.3 | 216.7 | 217.9 |
| Interest and Other Debt Servicing Charges | 14.5 | 15.2 | 16.2 | 17.0 | 17.8 |
| Total Expense | 209.7 | 227.6 | 232.5 | 233.7 | 235.7 |
Table 3.7 footnotes:
[1] Beginning in the 2025 Budget, the Total Revenue, Interest and Other Debt Servicing Charges (IOD), and Total Expense figures for all years have been restated to report interest and investment income as part of revenue and separate from IOD. These changes are fiscally neutral.
[2] Interim represents the 2025 Budget projection for the 2024–25 fiscal year.
[3] Excludes Teachers’ Pension Plan. Teachers’ Pension Plan expense is included in Other Programs.
Note: Numbers may not add due to rounding.
Sources: Ontario Treasury Board Secretariat and Ontario Ministry of Finance.
Highlights of the changes to the program expense outlook over the medium term include the following:
- Health sector expense is projected to increase from $85.2 billion in 2023–24 to $93.6 billion in 2027–28. The growth is primarily due to investments to:
- Address the growing demands in the health sector, including funding for hospitals and cancer treatment services to respond to Ontario’s aging and growing population;
- Increase access to primary care through investments to support the Primary Care Action Plan;
- Stabilize and address increased utilization of home and community care services;
- Support mental health and addictions services, including supports for the launch of Homelessness and Addiction Recovery Treatment Hubs; and
- Continue support for direct hours of care through staffing and training and education, as well as improve quality of care in the long‐term care sector.
- Education sector expense is projected to increase from $37.1 billion in 2023–24 to $41.3 billion in 2027–28. Key investments include:
- Supporting student achievement through programs that build foundational skills in reading, writing and math, to better prepare students for the in-demand jobs and opportunities of the future;
- Continuing investments in special education to help the most vulnerable students navigate the school system and beyond, as well as provide in-class supports;
- Providing child care supports to help ensure access for all families and enhance the quality of early learning and child care program delivery; and
- Addressing increased enrolment across the province and supporting commitments consistent with labour agreements.
- Postsecondary Education sector expense is projected to decrease from $13.3 billion in 2023–24 to $12.8 billion in 2027–28. This reflects:
- Lower forecasted college sector spending, primarily in direct response to reduced third-party revenue from the federal policy to cap international student study permit applications, as well as the ending of time-limited investments; and
- New investments that support postsecondary institutions and improve labour market alignment to produce job-ready graduates for employers in priority sectors, such as health human resources, education and skilled trades, as well as to support research and innovation to help drive economic growth.
- Children, Community and Social Services sector expense is projected to increase from $19.3 billion in 2023–24 to $20.4 billion in 2027–28. This is mainly due to:
- Annual inflation adjustments to core allowances for the Ontario Disability Support Program and the maximum monthly amount for the Assistance for Children with Severe Disabilities Program; and
- Funding to address increasing operational costs for community organizations that support vulnerable populations, including children needing supports, people with developmental disabilities, and people who have experienced gender‐based violence and human trafficking.
- Justice sector expense is projected to increase from $6.0 billion in 2023–24 to $6.4 billion in 2027–28. The growth in the sector is mainly due to investments in the Ontario Provincial Police, such as enhanced border security and improved technology, investments to expand and build new correctional institutions, as well as compensation costs for frontline public safety personnel.
- Other Programs expense is projected to increase from $34.4 billion in 2023–24 to $43.3 billion in 2027–28. Key changes include:
- Helping to build municipal housing-enabling infrastructure projects through the Housing-Enabling Water Systems Fund and Municipal Housing Infrastructure Program;
- Funding to support employment and training, including the Skills Development Fund Training and Capital Streams;
- Providing supports to Supply Ontario to leverage provincial purchasing power and enable a whole-of-government approach when purchasing goods and services;
- Providing support for critical services to Ontario municipalities, including small, Northern and rural municipalities, as well as those with a limited property tax base;
- Support for local alcohol producers and retailers, as well as bars and restaurants; and
- Maintaining the Contingency Fund to help address emerging needs and risks to reflect a cautious approach to planning due to economic uncertainty.
The total expense outlook includes Interest and Other Debt Servicing Charges expense, which is projected to increase from $14.5 billion in 2023–24 to $17.8 billion in 2027–28.
Prudence Built into the Medium-Term Outlook
In keeping with sound fiscal planning practices, Ontario’s revenue outlook is based on prudent economic planning projections, as discussed in Chapter 2: Economic Performance and Outlook. Three external economic experts reviewed the Ontario Ministry of Finance’s economic assumptions and found them to be reasonable.1
With the ongoing challenges the province faces due to economic uncertainty, the government maintains a responsible and flexible fiscal plan to respond to these impacts as necessary.
In addition, the Contingency Fund is maintained to help mitigate expense risks that may adversely affect Ontario’s fiscal performance. The Contingency Fund in 2025–26 is set at $3.0 billion and increases further through the remainder of the medium‐term outlook, reflecting the government’s prudent and responsible fiscal planning.
Ontario incorporates prudence in the form of a reserve to protect the fiscal outlook against unforeseen adverse changes in Ontario’s revenue and expense, including those resulting from changes in Ontario’s economic performance.
The reserve has been set at $2.0 billion in 2025–26, $2.0 billion in 2026–27 and $2.0 billion in 2027–28. This reflects Ontario’s commitment to maintaining a prudent and flexible fiscal plan.
Risks to the Expense Outlook
Table 3.8 provides a summary of key expense risks and sensitivities that could result from unexpected changes in economic conditions and program demands. A change in these factors could affect total expense and the public sector, causing variances in the overall fiscal forecast. These sensitivities illustrate possible effects on the government’s key programs and can vary, depending on the nature and composition of potential risks.
| Program/Sector | 2025–26 Assumption | 2025–26 Sensitivities |
|---|---|---|
| Hospital | Annual growth up to 4 per cent. | One per cent change in hospital costs: approximately $275 million. |
| Home Care | Approximately 45 million hours of personal support services. | One per cent change in hours of personal support services: approximately $23 million. |
| Home Care | Approximately 11 million nursing and therapy visits and 2 million nursing shifts. | One per cent change in all nursing and therapy visits: approximately $14 million. |
| Elementary and Secondary Schools | Approximately 2.078 million average daily pupil enrolment. |
One per cent enrolment change: approximately $192 million. |
| Ontario Works | 307,405 average annual caseload. | One per cent caseload change: approximately $36 million. |
| Ontario Disability Support Program | 383,115 average annual caseload. | One per cent caseload change: approximately $67 million. |
| Interest and Other Debt Servicing Charges | Average cost of borrowing in 2025–26 is forecast to be 4.0 per cent. | In the first full year, the impact of a 100 basis-point change in borrowing rates: approximately $780 million. |
Table 3.8 footnotes:
Sources: Ontario Treasury Board Secretariat and Ontario Ministry of Finance.
Leadership in the Federation and Standing Up for the People of Ontario
It has never been more important that Canada and Ontario demonstrate stability, strength and unity. With Premier Ford as Chair of the Council of the Federation and Minister Bethlenfalvy as Chair of the Provincial-Territorial Finance Ministers’ table, Ontario has continued collaborative efforts with provinces, territories and the federal government to respond to the threats of tariffs being imposed by the United States and discuss how to build a stronger Canadian economy.
In light of ongoing economic uncertainty and the impact of U.S. tariffs, Ontario is continuing to work with other provinces and territories and the federal government to protect Canadians and to strengthen Ontario’s and Canada’s economy for long-term growth. This includes prioritizing the development and maintenance of Canada’s infrastructure, which is central to long-term economic growth and prosperity. With the first Investing in Canada Infrastructure Program having been fully allocated more than two years ago, Ontario continues to join all provinces and territories to call on the federal government for a new, long-term, predictable infrastructure program with sufficient funds to support the unique needs of each jurisdiction, without complex and onerous conditions. This would provide flexibility for provinces and territories to support their local and diverse priorities and more quickly fund critical projects in a way that complements long-term capital planning and investments already being made by jurisdictions.
The federal government responded to Ontario’s calls for tax relief to encourage construction of more purpose-built rental housing. Ontario is calling on the federal government to introduce further measures to improve housing affordability. Ontario is ready to partner with the federal government on potential further tax relief related to new housing. In addition, to meet urgent housing investment needs, the province is calling on the federal government once again to ease conditions on the Canada Housing Infrastructure Fund and utilize provincial programs to accelerate getting homes built.
Ontario is taking action to secure the resources it needs to drive economic growth, boost productivity, and make the province’s economy the most competitive in the G7. As Ontario continues to secure its position as a global leader of responsibly sourced critical minerals, it is important that the federal government match funding commitments to enable the development of the Ring of Fire and generate considerable economic benefit to Indigenous and Northern communities. In addition, Ontario continues to call on the federal government to work collaboratively with provinces and territories to develop a streamlined “one project, one assessment” approach to reduce duplicative requirements and get critical projects built faster.
Effective federal–provincial transfers are key to ensuring sustainable public services and building a stronger Ontario. Addressing recent reductions in labour market funding through the Labour Market Transfer Agreements to support skills training, and working with Ontario to address a funding shortfall for child care through the Canada-wide Early Learning and Child Care Agreements, are areas where the federal government can take immediate action. Ontario also looks forward to upcoming health agreement reviews to ensure sustainable federal support for health care in the years to come.
Transparency and Risks
The government continues to be transparent about the state of Ontario’s finances. This principle is reflected in the Fiscal Sustainability, Transparency and Accountability Act, 2019, which stipulates that Ontario’s fiscal policy should be clearly articulated, and information about it should be readily available to the public without charge.
To ensure a reasonable and prudent economic forecast, the government’s key economic planning projections are set below the average of private-sector forecasts in each year. For 2025 onwards, the planning assumptions are set 0.1 percentage point below the private‐sector average.
While the planning assumptions for economic growth are reasonable and prudent, the Ontario Ministry of Finance has also developed Faster Growth and Slower Growth scenarios to provide greater transparency around a broader range of possible outcomes, amid heightened economic uncertainty.
As a matter of transparent fiscal management, financial pressures are monitored throughout the fiscal year by the Ontario Treasury Board Secretariat, with the goal of ensuring that robust and prudent methodologies are used to develop forecasts. Other important risk management tools include closely tracking the pace of implementation of initiatives and proactively identifying emerging program and policy risks. Comprehensive analysis of known pressures informs the fiscal planning processes, including the development of plans to mitigate and manage fiscal pressures, as well as maintaining adequate contingencies as part of the medium-term fiscal projections in respect of the government’s flexible fiscal plan to respond to uncertainty and risks.
In addition to the key demand sensitivities and economic risks to the fiscal plan, there are risks stemming from the government’s contingent liabilities. Whether future events will result in actual liabilities for the province is beyond the direct control of the government. For example, losses could result from legal settlements or a call on loan or funding guarantees. While a Contingency Fund is included in the fiscal plan to help mitigate the expense risks, until there exists certainty around the likelihood and costs of these future events, these risks are not included in the province’s fiscal plan. Provisions for losses that are likely to occur and can be reasonably estimated are expensed and reported as liabilities in Ontario’s financial statements. Any significant contingent liabilities related to the 2024–25 fiscal year will be disclosed as part of the Public Accounts of Ontario 2024–2025, to be released no later than September 27, 2025.
Summary of Significant Accounting Policies
To fully comply with Public Sector Accounting Standards, interest and investment income will no longer be subtracted from Interest on Debt. Interest and investment income will now be reported separately as a revenue line item. The impact of this change is fiscally and economically neutral and represents an accounting reporting and presentation change. Further, Interest on Debt is being renamed Interest and Other Debt Servicing Charges (IOD) to more accurately reflect the expenses incurred to deliver an effective, cost-efficient borrowing program.
Details of Ontario’s Finances
| Item | Actual 2022–23 |
Actual 2023–24 |
Interim2 2024–25 |
Plan 2025–26 |
|---|---|---|---|---|
| Taxation Revenue — Personal Income Tax | 44,209 | 50,773 | 56,303 | 57,811 |
| Taxation Revenue — Sales Tax | 36,092 | 39,864 | 39,405 | 40,073 |
| Taxation Revenue — Corporations Tax | 27,791 | 23,140 | 27,945 | 25,980 |
| Taxation Revenue — Education Property Tax | 5,991 | 5,810 | 5,809 | 5,853 |
| Taxation Revenue — Employer Health Tax | 7,797 | 8,581 | 9,128 | 9,466 |
| Taxation Revenue — Ontario Health Premium | 4,445 | 5,008 | 5,226 | 5,366 |
| Taxation Revenue — Gasoline Tax | 2,103 | 1,620 | 1,704 | 1,664 |
| Taxation Revenue — Land Transfer Tax | 4,443 | 3,538 | 3,716 | 3,875 |
| Taxation Revenue — Tobacco Tax | 864 | 813 | 716 | 667 |
| Taxation Revenue — Fuel Tax | 571 | 517 | 531 | 522 |
| Taxation Revenue — Beer, Wine and Spirits Taxes | 600 | 593 | 562 | 388 |
| Taxation Revenue — Electricity Payments in Lieu of Taxes | 674 | 529 | 532 | 634 |
| Taxation Revenue — Ontario Portion of the Federal Cannabis Excise Duty | 310 | 346 | 365 | 376 |
| Taxation Revenue — Other Taxes | 627 | 728 | 894 | 1,027 |
| Taxation Revenue — Total | 136,518 | 141,860 | 152,837 | 153,702 |
| Government of Canada — Canada Health Transfer | 17,525 | 19,286 | 20,363 | 21,332 |
| Government of Canada — Canada Social Transfer | 6,178 | 6,407 | 6,611 | 6,794 |
| Government of Canada — Equalization | – | 421 | 576 | 546 |
| Government of Canada — Infrastructure Programs | 769 | 609 | 1,222 | 1,055 |
| Government of Canada — Labour Market Programs | 1,181 | 1,149 | 920 | 923 |
| Government of Canada — Social Housing Agreement | 263 | 218 | 173 | 133 |
| Government of Canada — Other Federal Payments | 4,817 | 5,621 | 6,007 | 7,554 |
| Government of Canada — Direct Transfers to Broader Public Sector Organizations | 531 | 625 | 497 | 509 |
| Government of Canada — Total | 31,264 | 34,336 | 36,369 | 38,846 |
| Income from Government Business Enterprises — Liquor Control Board of Ontario | 2,457 | 2,574 | 2,165 | 1,851 |
| Income from Government Business Enterprises — Ontario Power Generation Inc./Hydro One Ltd. | 850 | 2,065 | 2,390 | 1,599 |
| Income from Government Business Enterprises — Ontario Lottery and Gaming Corporation | 2,505 | 2,368 | 2,403 | 2,405 |
| Income from Government Business Enterprises — Ontario Cannabis Store | 234 | 244 | 244 | 215 |
| Income from Government Business Enterprises — iGaming Ontario | 87 | 176 | 225 | 247 |
| Income from Government Business Enterprises — Total | 6,133 | 7,427 | 7,426 | 6,317 |
| Other Non-Tax Revenue — Fees, Donations and Other Revenues from Hospitals, School Boards and Colleges | 11,495 | 13,071 | 12,612 | 10,852 |
| Other Non-Tax Revenue — Vehicle and Driver Registration Fees | 1,240 | 1,222 | 1,255 | 1,242 |
| Other Non-Tax Revenue — Miscellaneous Other Non-Tax Revenue3 | 2,146 | 3,344 | 3,941 | 1,710 |
| Other Non-Tax Revenue — Other Fees and Licences | 1,446 | 1,618 | 1,844 | 1,874 |
| Other Non-Tax Revenue — Sales and Rentals | 1,231 | 1,566 | 1,491 | 1,964 |
| Other Non-Tax Revenue — Reimbursements | 1,031 | 1,131 | 994 | 1,074 |
| Other Non-Tax Revenue — Royalties | 335 | 320 | 294 | 309 |
| Other Non-Tax Revenue — Power Supply Contract Recoveries | 48 | 41 | 40 | 44 |
| Other Non-Tax Revenue — Interest and Investment Income | 1,544 | 3,085 | 2,499 | 1,953 |
| Other Non-Tax Revenue — Total | 20,517 | 25,398 | 24,971 | 21,022 |
| Total Revenue | 194,431 | 209,021 | 221,602 | 219,887 |
Table 3.9 footnotes:
[1] Beginning in the 2025 Budget, the Total Revenue, Interest and Other Debt Servicing Charges (IOD), and Total Expense figures for all years have been restated to report interest and investment income as part of revenue and separate from IOD. These changes are fiscally neutral.
[2] Interim represents the 2025 Budget projection for the 2024–25 fiscal year.
[3] Revenue in 2024–25 reflects a non-recurring compensation amount the government will receive for smoking-related health care costs under a court approved settlement between tobacco companies and their creditors.
Note: Numbers may not add due to rounding.
Source: Ontario Ministry of Finance.
| Ministry Expense | Actual 2022–23 |
Actual 2023–24 |
Interim3 2024–25 |
Plan 2025–26 |
|---|---|---|---|---|
| Agriculture, Food and Agribusiness (Base) | 296 | 331 | 396 | 474.9 |
| Agriculture, Food and Agribusiness — Demand-Driven Risk Management and Time-Limited Programs | 502 | 601 | 498 | 575.3 |
| Agriculture, Food and Agribusiness — COVID-19 Time-Limited Funding4 | 30 | – | – | – |
| Agriculture, Food and Agribusiness (Total) | 828 | 932 | 894 | 1,050.1 |
| Attorney General (Base) | 1,807 | 2,085 | 2,265 | 2,274.4 |
| Attorney General — Statutory Appropriations — Crown Liability and Proceedings Act, 2019 | 79 | 27 | 604 | – |
| Attorney General — Bad Debt Expense | 30 | 22 | 21 | 5.3 |
| Attorney General — COVID-19 Time-Limited Funding5 | 31 | – | – | – |
| Attorney General (Total) | 1,947 | 2,134 | 2,889 | 2,279.7 |
| Board of Internal Economy (Base) | 392 | 299 | 356 | 352.2 |
| Board of Internal Economy — COVID-19 Time-Limited Funding6 | 0 | – | – | – |
| Board of Internal Economy (Total) | 392 | 299 | 356 | 352.2 |
| Children, Community and Social Services (Base) | 17,869 | 19,282 | 20,625 | 20,358.7 |
| Children, Community and Social Services — COVID-19 Time-Limited Funding7 | 48 | – | – | – |
| Children, Community and Social Services (Total) | 17,917 | 19,282 | 20,625 | 20,358.7 |
| Citizenship and Multiculturalism (Base) | 54 | 68 | 90 | 92.7 |
| Citizenship and Multiculturalism — Time-Limited Investments | – | 14 | – | – |
| Citizenship and Multiculturalism — COVID-19 Time-Limited Funding8 | 2 | – | – | – |
| Citizenship and Multiculturalism (Total) | 56 | 82 | 90 | 92.7 |
| Colleges, Universities, Research Excellence and Security (Base) | 10,729 | 11,936 | 12,353 | 11,462.7 |
| Colleges, Universities, Research Excellence and Security — Student Financial Assistance | 1,019 | 1,316 | 1,890 | 1,523.5 |
| Colleges, Universities, Research Excellence and Security — COVID-19 Time-Limited Funding9 | 32 | – | – | – |
| Colleges, Universities, Research Excellence and Security (Total) | 11,779 | 13,253 | 14,243 | 12,986.2 |
| Economic Development, Job Creation and Trade (Base) | 166 | 200 | 192 | 205.8 |
| Economic Development, Job Creation and Trade — Tax Credits for Business Investment and Research and Development10 | 299 | 537 | 567 | 691.6 |
| Economic Development, Job Creation and Trade — Tax Credits for Business Investment and Research and Development — Amounts Related to Prior Years | 22 | 18 | 42 | – |
| Economic Development, Job Creation and Trade — Time-Limited Investments | 540 | 513 | 1,090 | 1,508.0 |
| Economic Development, Job Creation and Trade — COVID-19 Time-Limited Funding11 | 46 | – | – | – |
| Economic Development, Job Creation and Trade (Total) | 1,072 | 1,268 | 1,891 | 2,405.4 |
| Education (Base) | 33,605 | 37,130 | 38,353 | 40,987.4 |
| Education — Teachers’ Pension Plan | 1,661 | 1,652 | 1,684 | 1,733.0 |
| Education — COVID-19 Time-Limited Funding12 | 918 | – | – | – |
| Education (Total) | 36,183 | 38,782 | 40,037 | 42,720.4 |
| Emergency Preparedness and Response (Total) | 21 | 52 | 70 | 66.2 |
| Energy and Mines (Base) | 379 | 532 | 651 | 661.5 |
| Energy and Mines — Electricity Cost Relief Programs | 5,844 | 5,996 | 6,401 | 6,463.0 |
| Energy and Mines — Accounting Adjustments for Contaminated Sites | 86 | 369 | 14 | – |
| Energy and Mines — High-Speed Internet | 196 | 93 | 435 | 1,734.4 |
| Energy and Mines — Time-Limited Investments | – | – | 21 | 84.1 |
| Energy and Mines — COVID-19 Time-Limited Funding13 | 2 | – | – | – |
| Energy and Mines (Total) | 6,506 | 6,991 | 7,522 | 8,943.0 |
| Environment, Conservation and Parks (Base) | 732 | 815 | 885 | 1,041.8 |
| Environment, Conservation and Parks — Accounting Adjustment for Contaminated Sites | – | 84 | 14 | – |
| Environment, Conservation and Parks — COVID-19 Time-Limited Funding14 | 17 | – | – | – |
| Environment, Conservation and Parks (Total) | 749 | 899 | 899 | 1,041.8 |
| Executive Offices (Base) | 59 | 69 | 75 | 79.4 |
| Executive Offices — COVID-19 Time-Limited Funding15 | 0 | – | – | – |
| Executive Offices (Total) | 59 | 69 | 75 | 79.4 |
| Finance (Base) | 800 | 903 | 1,193 | 1,163.3 |
| Finance — Investment Management Corporation of Ontario16 | 245 | 300 | 314 | 330.1 |
| Finance — Ontario Municipal Partnership Fund | 501 | 501 | 514 | 562.5 |
| Finance — Temporary and Other Local Assistance | 21 | 68 | 25 | 21.1 |
| Finance — Power Supply Contract Costs | 48 | 41 | 40 | 44.1 |
| Finance — Time-Limited Investments | 174 | 89 | 2,947 | 52.5 |
| Finance — COVID-19 Time-Limited Funding17 | 0 | – | – | – |
| Finance (Total) | 1,790 | 1,902 | 5,033 | 2,173.6 |
| Francophone Affairs (Base) | 7 | 8 | 9 | 8.7 |
| Francophone Affairs — Time-Limited Investments | 1 | – | 5 | 2.6 |
| Francophone Affairs (Total) | 8 | 8 | 14 | 11.3 |
| Health (Base)18 | 67,184 | 75,979 | 80,668 | 81,851.6 |
| Health — Adjustments for One-Time Extraordinary Costs19 | 1,324 | 1,241 | – | – |
| Health — Retroactive Compensation | – | – | 1,190 | – |
| Health (Total) | 68,508 | 77,220 | 81,858 | 81,851.6 |
| COVID-19 Health Response20 | 3,228 | – | – | – |
| Indigenous Affairs and First Nations Economic Reconciliation (Base) | 113 | 130 | 140 | 144.8 |
| Indigenous Affairs and First Nations Economic Reconciliation — One-Time Investments Including Settlements | 6,273 | 17 | 870 | – |
| Indigenous Affairs and First Nations Economic Reconciliation — COVID-19 Time-Limited Funding21 | 1 | – | – | – |
| Indigenous Affairs and First Nations Economic Reconciliation (Total) | 6,386 | 147 | 1,010 | 144.8 |
| Infrastructure (Base) | 326 | 430 | 646 | 747.0 |
| Infrastructure — Federal−Provincial Infrastructure Programs | 303 | 401 | 343 | 213.6 |
| Infrastructure — Waterfront Toronto Revitalization (Port Lands Flood Protection) | 25 | 25 | 30 | 32.5 |
| Infrastructure — Municipal Infrastructure Program Investments | 396 | 389 | 646 | 1,243.9 |
| Infrastructure — Realty | 1,195 | 1,298 | 1,450 | 1,437.6 |
| Infrastructure (Total) | 2,245 | 2,543 | 3,116 | 3,674.7 |
| Labour, Immigration, Training and Skills Development (Base) | 207 | 253 | 236 | 160.0 |
| Labour, Immigration, Training and Skills Development — Co-operative Education Tax Credit22 | 86 | 116 | 93 | 102.5 |
| Labour, Immigration, Training and Skills Development — Demand-Driven Employment and Training Programs | 1,308 | 1,322 | 1,494 | 1,840.2 |
| Labour, Immigration, Training and Skills Development — Time-Limited Investments | – | 13 | – | – |
| Labour, Immigration, Training and Skills Development — COVID-19 Time-Limited Funding23 | 310 | – | – | – |
| Labour, Immigration, Training and Skills Development (Total) | 1,911 | 1,703 | 1,822 | 2,102.7 |
| Long-Term Care (Total)24 | 6,423 | 7,964 | 8,668 | 9,279.3 |
| Municipal Affairs and Housing (Base) | 575 | 796 | 796 | 798.5 |
| Municipal Affairs and Housing — Time-Limited Investments | 404 | 789 | 1,180 | 830.7 |
| Municipal Affairs and Housing — Social Housing Agreement — Payments to Service Managers25 | 206 | 194 | 161 | 128.3 |
| Municipal Affairs and Housing — COVID-19 Time-Limited Funding26 | 390 | – | – | – |
| Municipal Affairs and Housing (Total) | 1,574 | 1,780 | 2,137 | 1,757.4 |
| Natural Resources (Base) | 587 | 666 | 801 | 740.4 |
| Natural Resources — Emergency Forest Firefighting | 95 | 203 | 177 | 135.0 |
| Natural Resources — Accounting Adjustments for Contaminated Sites | – | 210 | 25 | – |
| Natural Resources — COVID-19 Time-Limited Funding27 | 2 | – | – | – |
| Natural Resources (Total) | 684 | 1,079 | 1,003 | 875.4 |
| Northern Economic Development and Growth (Total) | 661 | 705 | 772 | 805.2 |
| Public and Business Service Delivery and Procurement (Base) | 1,521 | 1,525 | 1,688 | 1,712.3 |
| Public and Business Service Delivery and Procurement — Adjustments for One-Time Extraordinary Costs28 | 150 | 176 | – | – |
| Public and Business Service Delivery and Procurement — COVID-19 Time-Limited Funding29 | 154 | – | – | – |
| Public and Business Service Delivery and Procurement (Total) | 1,825 | 1,701 | 1,688 | 1,712.3 |
| Rural Affairs (Base) | 6 | 6 | 8 | 14.3 |
| Rural Affairs — Time-Limited Investments | – | – | – | 5.0 |
| Rural Affairs (Total) | 6 | 6 | 8 | 19.3 |
| Seniors and Accessibility (Base) | 63 | 63 | 68 | 76.8 |
| Seniors and Accessibility — Seniors Tax Credits | 164 | 108 | 96 | 104.3 |
| Seniors and Accessibility — COVID-19 Time-Limited Funding30 | 11 | – | – | – |
| Seniors and Accessibility (Total) | 238 | 171 | 165 | 181.1 |
| Solicitor General (Base) | 3,338 | 3,832 | 4,261 | 4,463.0 |
| Solicitor General — COVID-19 Time-Limited Funding31 | 96 | – | – | – |
| Solicitor General (Total) | 3,434 | 3,832 | 4,261 | 4,463.0 |
| Sport (Base) | 55 | 53 | 58 | 62.9 |
| Sport — Time-Limited Investments | – | – | 4 | 150.0 |
| Sport (Total) | 55 | 53 | 61 | 212.9 |
| Tourism, Culture and Gaming (Base) | 777 | 818 | 837 | 869.2 |
| Tourism, Culture and Gaming — Ontario Cultural Media Tax Credits | 833 | 841 | 985 | 1,028.4 |
| Tourism, Culture and Gaming — Ontario Cultural Media Tax Credits — Amounts Related to Prior Years | 51 | 89 | 35 | – |
| Tourism, Culture and Gaming — COVID-19 Time-Limited Funding32 | 200 | – | – | – |
| Tourism, Culture and Gaming (Total) | 1,861 | 1,747 | 1,857 | 1,897.6 |
| Transportation (Base) | 5,474 | 6,266 | 7,065 | 7,198.6 |
| Transportation — Federal−Provincial Infrastructure Programs | 477 | 418 | 520 | 629.9 |
| Transportation — Time-Limited Investments | – | 675 | – | – |
| Transportation — COVID-19 Time-Limited Funding33 | 609 | – | – | – |
| Transportation (Total) | 6,559 | 7,359 | 7,585 | 7,828.6 |
| Treasury Board Secretariat (Base) | 279 | 260 | 341 | 403.9 |
| Treasury Board Secretariat — Employee and Pensioner Benefits | 1,178 | 985 | 1,285 | 1,528.0 |
| Treasury Board Secretariat — Operating Contingency Fund | – | – | 100 | 2,825.0 |
| Treasury Board Secretariat — Capital Contingency Fund | – | – | – | 175.0 |
| Treasury Board Secretariat — COVID-19 Time-Limited Funding34 | 0 | – | – | – |
| Treasury Board Secretariat (Total) | 1,457 | 1,245 | 1,726 | 4,931.9 |
| Interest and Other Debt Servicing Charges35,36 | 13,935 | 14,461 | 15,224 | 16,198.1 |
| Total Expense37 | 200,299 | 209,668 | 227,598 | 232,496.6 |
Table 3.10 footnotes:
[1] Numbers reflect current ministry structure.
[2] Ministry expenses have been restated for reclassification and program transfer changes. These changes are fiscally neutral. The actual results are presented on a similar basis for consistency.
[3] Interim represents the 2025 Budget projection for the 2024–25 fiscal year.
[4], [5], [6], [7], [8], [9], [11], [12], [13], [14], [15], [17], [21], [23], [26], [27], [29], [30], [31], [32], [33], [34] COVID‐19 Time‐Limited Funding is no longer being reported separately, starting in 2023–24.
[10] Includes the estimated cost of tax credit claims for the Regional Opportunities Investment Tax Credit (ROITC), the Ontario Made Manufacturing Investment Tax Credit (OMMITC), the Ontario Innovation Tax Credit and the Ontario Business-Research Institute Tax Credit. The ROITC was temporarily enhanced until the end of 2023, which results in the cost of the credit decreasing from 2023–24 to 2024–25. The OMMITC was introduced in the 2023 Budget with costs commencing in 2023–24. An enhancement to the OMMITC is proposed in the 2025 Budget with costs starting in 2025–26. An expansion of the OMMITC is also proposed in the 2025 Budget with impacts reported separately as a revenue decrease.
[16] Based on the requirements of Public Sector Accounting Standards, the province consolidates the financial results of the Investment Management Corporation of Ontario.
[18] Includes accounting adjustments tied primarily to grants provided for infrastructure projects and other related investments.
[19], [28] Includes extraordinary costs related to personal protective equipment in 2022–23 and 2023–24.
[20] For presentation purposes in the 2025 Budget, Time-Limited COVID-19-related health response spending has been included separately for 2022–23, instead of within the Ontario Ministry of Health and Ontario Ministry of Long-Term Care.
[22] Amounts from 2022–23 to 2024–25 include tax credit amounts related to prior year adjustments.
[24] The Ontario Ministry of Long-Term Care total includes expenses incurred by Ontario Health and hospitals for funding for long-term care. These amounts will be consolidated in the total expense of the Ontario Ministry of Health, including $5.4 billion for Interim and $5.7 billion in 2025–26.
[25] The annual decline is mainly due to declining federal obligations, such as maturing mortgages, under the Social Housing Agreement.
[35] Interest and other debt servicing charges is net of interest capitalized during construction of tangible capital assets of $230 million in 2022–23, $321 million in 2023–24, $1,195 million in 2024–25, and $1,415 million in 2025–26.
[36], [37] Beginning in the 2025 Budget, the Total Revenue, Interest and Other Debt Servicing Charges (IOD), and Total Expense figures for all years have been restated to report interest and investment income as part of revenue and separate from IOD. These changes are fiscally neutral.
Note: Numbers may not add due to rounding.
Sources: Ontario Treasury Board Secretariat and Ontario Ministry of Finance.
| Sector | Total Infrastructure Expenditures Interim1,2 2024–25 |
2025–26 Plan Investment in Capital Assets3 |
2025–26 Plan Transfers and Other Infrastructure Expenditures4 |
2025–26 Plan Total Infrastructure Expenditures |
|---|---|---|---|---|
| Transportation — Transit | 10,100 | 9,671 | 1,079 | 10,749 |
| Transportation — Provincial Highways | 3,387 | 3,864 | 395 | 4,259 |
| Transportation — Other Transportation, Property and Planning | 233 | 177 | 145 | 321 |
| Health — Hospitals | 3,546 | 4,455 | 15 | 4,470 |
| Health — Other Health | 575 | 53 | 679 | 732 |
| Education | 3,865 | 3,957 | 260 | 4,216 |
| Postsecondary Education — Colleges and Other | 930 | 636 | 72 | 708 |
| Postsecondary Education — Universities | 136 | – | 185 | 185 |
| Social | 750 | 32 | 613 | 644 |
| Justice | 711 | 936 | 37 | 973 |
| Other Sectors5 | 3,624 | 3,323 | 4,455 | 7,778 |
| Total Infrastructure Expenditures | 27,856 | 27,103 | 7,934 | 35,037 |
| Less: Other Partner Funding6 | 3,451 | 1,690 | – | 1,690 |
| Total7 | 24,405 | 25,412 | 7,934 | 33,346 |
Table 3.11 footnotes:
[1] Interim represents the 2025 Budget projection for the 2024–25 fiscal year.
[2] Includes provincial investment in capital assets of $17.2 billion.
[3] Includes $1,415 million in interest capitalized during construction.
[4] Includes transfers to municipalities, universities, and non-consolidated agencies.
[5] Includes high-speed internet infrastructure, government administration, natural resources, and culture and tourism industries.
[6] Other Partner Funding refers to third-party investments primarily in hospitals, colleges and schools.
[7] Includes Federal–Municipal contributions to provincial infrastructure investments.
Note: Numbers may not add due to rounding.
Source: Ontario Treasury Board Secretariat.
| Item | 2016–17 | 2017–18 | 2018–19 | 2019–20 | 2020–21 | 2021–22 | 2022–23 | Actual 2023–24 |
Interim5 2024–25 |
Plan 2025–26 |
|---|---|---|---|---|---|---|---|---|---|---|
| Revenue | 141,260 | 151,291 | 154,751 | 157,141 | 165,737 | 185,847 | 194,431 | 209,021 | 221,602 | 219,887 |
| Expense — Programs | 131,442 | 142,464 | 148,747 | 152,265 | 168,964 | 170,520 | 186,364 | 195,207 | 212,374 | 216,298 |
| Expense — Interest and Other Debt Servicing Charges3 | 12,254 | 12,506 | 13,332 | 13,471 | 13,063 | 13,302 | 13,935 | 14,461 | 15,224 | 16,198 |
| Total Expense | 143,696 | 154,969 | 162,079 | 165,736 | 182,027 | 183,822 | 200,299 | 209,668 | 227,598 | 232,497 |
| Reserve | – | – | – | – | – | – | – | – | – | 2,000 |
| Surplus/(Deficit) | (2,435) | (3,679) | (7,328) | (8,595) | (16,290) | 2,025 | (5,868) | (647) | (5,996) | (14,609) |
| Net Debt | 314,077 | 323,068 | 337,623 | 352,382 | 372,501 | 382,842 | 399,806 | 407,969 | 428,120 | 460,753 |
| Accumulated Deficit | 205,939 | 208,257 | 215,770 | 224,814 | 238,231 | 238,160 | 246,007 | 244,309 | 250,305 | 264,914 |
| Gross Domestic Product (GDP) at Market Prices | 790,749 | 824,979 | 860,103 | 893,224 | 874,354 | 970,146 | 1,061,714 | 1,119,545 | 1,178,092 | 1,214,614 |
| Primary Household Income | 520,486 | 541,501 | 567,484 | 593,065 | 592,514 | 642,144 | 692,033 | 736,585 | 790,612 | 822,236 |
| Population (000s) — July4 | 13,877 | 14,078 | 14,327 | 14,574 | 14,762 | 14,842 | 15,141 | 15,623 | 16,124 | 16,348 |
| Net Debt per Capita (Dollars) | 22,634 | 22,948 | 23,566 | 24,180 | 25,234 | 25,794 | 26,405 | 26,113 | 26,552 | 28,183 |
| Household Income per Capita (Dollars) | 37,508 | 38,463 | 39,610 | 40,695 | 40,138 | 43,264 | 45,705 | 47,147 | 49,033 | 50,294 |
| Net Debt as a Per Cent of Operating Revenue | 223.2% | 214.4% | 219.5% | 225.6% | 225.8% | 206.8% | 207.3% | 198.1% | 195.4% | 211.4% |
| Net Interest as a Per Cent of Operating Revenue | 8.3% | 7.9% | 8.1% | 8.0% | 7.5% | 6.8% | 6.4% | 5.5% | 5.8% | 6.5% |
| Net Debt as a Per Cent of GDP | 39.7% | 39.2% | 39.3% | 39.5% | 42.6% | 39.5% | 37.7% | 36.4% | 36.3% | 37.9% |
| Accumulated Deficit as a Per Cent of GDP | 26.0% | 25.2% | 25.1% | 25.2% | 27.2% | 24.5% | 23.2% | 21.8% | 21.2% | 21.8% |
Table 3.12 footnotes:
[1] Amounts reflect a change in pension expense that was calculated based on recommendations of the Independent Financial Commission of Inquiry, as described in Note 19 to the Consolidated Financial Statements, in Public Accounts of Ontario 2017–2018. Amounts for net debt and accumulated deficit also reflect this change.
[2] Beginning in the 2025 Budget, the Total Revenue, Interest and Other Debt Servicing Charges (IOD), and Total Expense figures for all years have been restated to report interest and investment income as part of revenue and separate from IOD. These changes are fiscally neutral.
[3] Interest and Other Debt Servicing Charges is net of interest capitalized during construction of tangible capital assets of $230 million in 2022–23, $321 million in 2023–24, $1,195 million in 2024–25 and $1,415 million in 2025–26.
[4] Population figures are for July 1 of the fiscal year indicated (i.e., for 2024–25, the population on July 1, 2024, is shown).
[5] Interim represents the 2025 Budget projection for the 2024–25 fiscal year.
Note: Numbers may not add due to rounding.
Sources: Statistics Canada, Ontario Treasury Board Secretariat and Ontario Ministry of Finance.
Footnotes
[1] The three experts are from the Policy and Economic Analysis Program at the University of Toronto; Quantitative Economic Decisions, Inc. (QEDinc.); and Stokes Economics Consulting, Inc.
Chart Descriptions
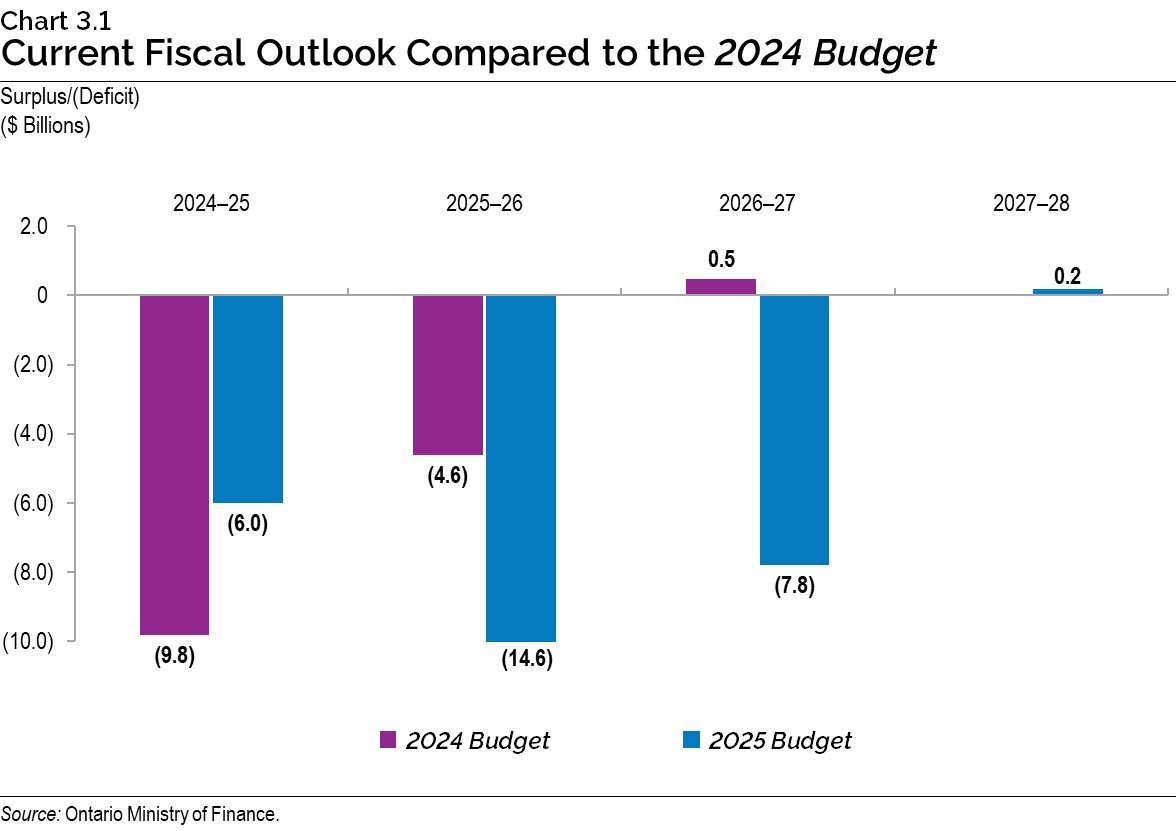
Chart 3.1: Current Fiscal Outlook Compared to the 2024 Budget
The bar chart illustrates the fiscal outlooks presented in the 2024 Budget compared to the current outlook in the 2025 Budget. The 2024 Budget projected deficits of $9.8 billion in 2024–25, $4.6 billion in 2025–26 and a surplus of $0.5 billion in 2026–27. With the release of the 2025 Budget, the deficit projections have been revised to deficits of $6.0 billion in 2024–25, $14.6 billion in 2025–26 and $7.8 billion in 2026–27, and a surplus of $0.2 billion in 2027–28.
Source: Ontario Ministry of Finance.
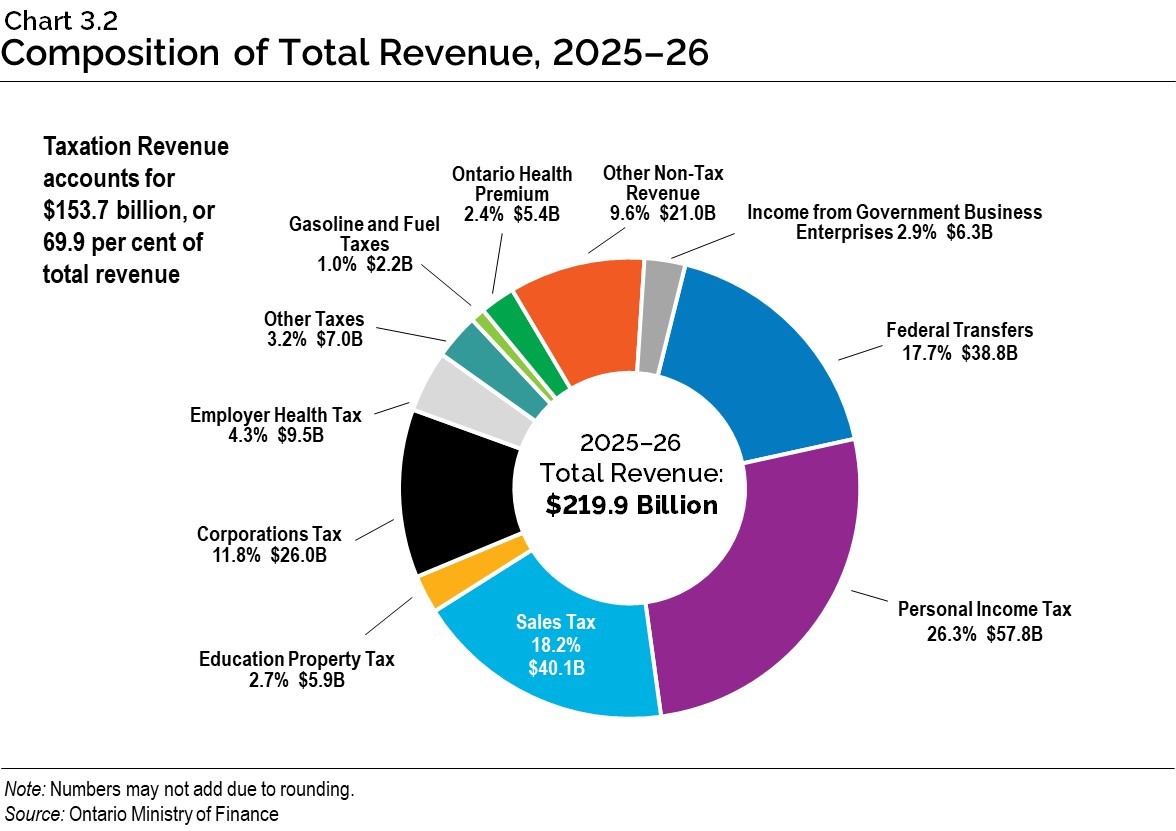
Chart 3.2: Composition of Total Revenue, 2025–26
The pie chart shows the composition of Ontario’s revenue in 2025–26, which is projected to be $219.9 billion. The largest taxation revenue source is Personal Income Tax revenue at $57.8 billion, accounting for 26.3 per cent of total revenue. This is followed by Sales Tax at $40.1 billion, or 18.2 per cent of total revenue; and Corporations Tax at $26.0 billion, or 11.8 per cent of total revenue. Other components of taxation revenue include Education Property Tax at $5.9 billion, or 2.7 per cent of total revenue; Employer Health Tax at $9.5 billion, or 4.3 per cent; Gasoline Tax and Fuel Tax at $2.2 billion, or 1.0 per cent; the Ontario Health Premium at $5.4 billion, or 2.4 per cent; and Other Taxes at $7.0 billion, or 3.2 per cent of total revenue.
Total taxation revenue accounts for $153.7 billion, or 69.9 per cent of total revenue.
The other major non-taxation sources of revenue are Federal Transfers of $38.8 billion, or 17.7 per cent of total revenue; Income from Government Business Enterprises at $6.3 billion, or 2.9 per cent of total revenue; and various Other Non-Tax Revenue at $21.0 billion, or 9.6 per cent of total revenue.
Note: Numbers may not add due to rounding.
Source: Ontario Ministry of Finance.
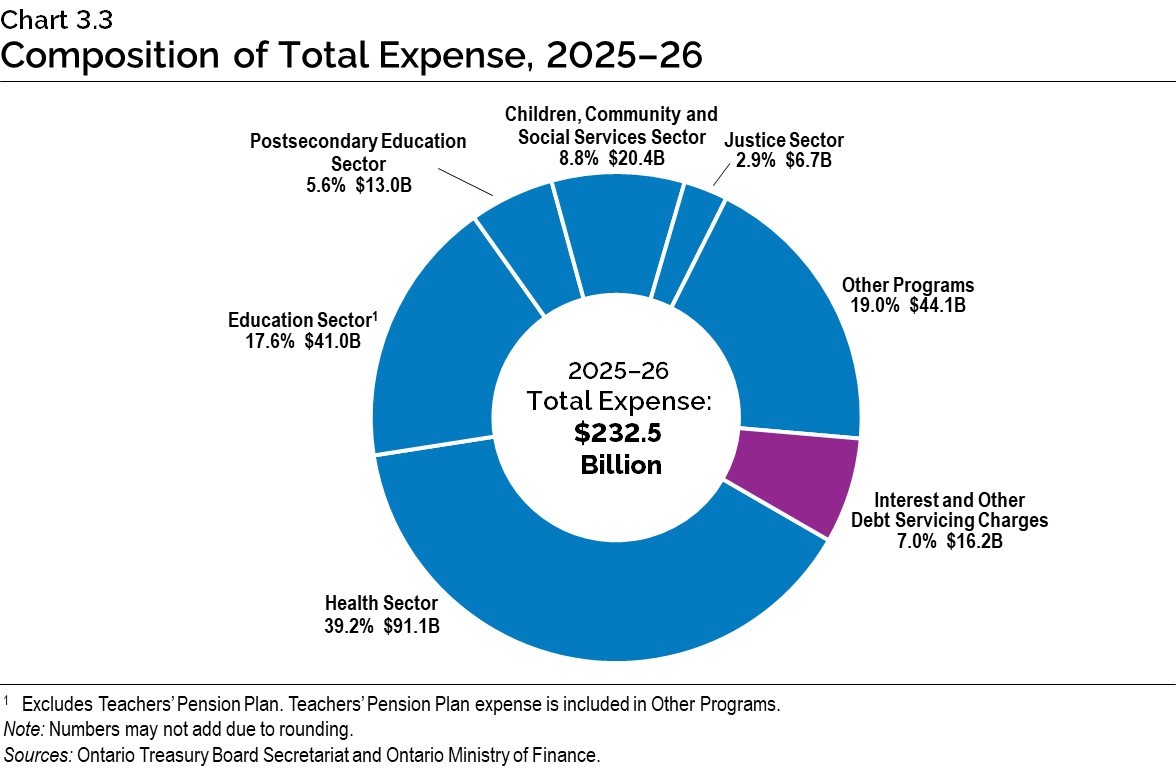
Chart 3.3: Composition of Total Expense, 2025–26
The pie chart shows the share of Ontario’s total expense and dollar amounts by sector in 2025–26.
Total expense in 2025–26 is projected to be $232.5 billion.
The largest expense is the Health Sector at $91.1 billion, accounting for 39.2 per cent of total expense.
The remaining sectors of total expense include the Education Sector1 at $41.0 billion or 17.6 per cent; the Postsecondary Education Sector at $13.0 billion or 5.6 per cent; the Children, Community and Social Services Sector at $20.4 billion or 8.8 per cent; the Justice Sector at $6.7 billion or 2.9 per cent; Other Programs at $44.1 billion or 19.0 per cent; and Interest and Other Debt Servicing Charges, included as part of Total Expense, is $16.2 billion or 7.0 per cent.
[1] Excludes Teachers’ Pension Plan. Teachers’ Pension Plan expense is included in Other Programs.
Note: Numbers may not add due to rounding.
Sources: Ontario Treasury Board Secretariat and Ontario Ministry of Finance.