Introduction
Ontario’s borrowing program is primarily used to fund deficits, refinance maturing debt, make investments in capital assets and support other loans and investments that advance key provincial priorities. Ontario has completed $58.6 billion in long-term borrowing in 2025–26. This is $15.8 billion higher than anticipated in the 2025 Budget and has allowed Ontario to pre-fund 2026–27 borrowing requirements and the $5 billion Protect Ontario Account, first announced in the 2025 Budget. The 2026–27 and 2027–28 long-term public borrowing forecasts are $47.2 billion and $43.1 billion, an increase of $6.1 billion and $10.1 billion from the 2025 Budget forecast, respectively. Long-term public borrowing for 2028–29 is forecast to be $42.7 billion.
Ontario remains committed to transparent, prudent and responsible borrowing and debt management. Beginning in 2026–27, changes to Public Sector Accounting Standards – Conceptual Framework for Financial Reporting in the Public Sector and Section PS 1202 Financial Statement Presentation (Conceptual Framework and Reporting Model), will affect how certain balance sheet measures are presented in the Public Accounts of Ontario. These changes do not affect Ontario’s fiscal plan, borrowing requirements or debt management strategy. Rather, they update the accounting presentation of key debt sustainability measures.
To ensure clarity and continuity for users of the 2026 Budget and other strategic fiscal documents, Ontario is updating the presentation and terminology of its measures, while maintaining strong connectivity to the Public Accounts. For comparability with previously published fiscal plan information and the forthcoming Public Accounts of Ontario 2025–2026, the 2025–26 Interim measure of Net Debt continues to be presented using the existing calculation. However, beginning in 2026–27, the 2026 Budget outlook reflects a revised calculation under PS 1202 that will be adopted in the Public Accounts of Ontario 2026–2027. Under this approach, Net Debt is equivalent to Net Financial Liabilities for the outlook.
As a result of the updated calculation applied to fiscal 2026–27 and beyond, the net debt-to-GDP ratio and net debt-to-revenue ratio will be marginally lower than previously reported. These differences reflect accounting and methodological updates only and do not represent a change in Ontario’s fiscal plan. Ontario’s Debt Burden Reduction Strategy targets remain unchanged and more information can be found in the relevant section below.
Borrowing Program
Ontario’s borrowing program is primarily used to fund deficits, refinance maturing debt, make investments in capital assets and support other loans and investments that advance key provincial priorities. Ontario will continue to finance most of its borrowing program in the long‑term public markets.
| Item | 2025–26 2025 Budget |
2025–26 Change from 2025 Budget |
2025–26 Interim 2025–26 |
Medium-Term Outlook 2026–27 |
Medium-Term Outlook 2027–28 |
Medium-Term Outlook 2028–29 |
|---|---|---|---|---|---|---|
| Deficit/(Surplus) | 14.6 | (2.3) | 12.3 | 13.8 | 6.1 | (0.6) |
| Provincial Investment in Capital Assets | 23.1 | 1.3 | 24.4 | 28.0 | 28.0 | 22.4 |
| Pre-funding for Protect Ontario Account | – | 5.0 | 5.0 | – | – | – |
| Amortization of Capital Assets | (9.1) | – | (9.1) | (10.2) | (10.5) | (11.4) |
| Non-Cash and Cash Timing Adjustments | (3.1) | 1.0 | (2.1) | (2.5) | (2.7) | (3.5) |
| Net Loans and Investments1 | 1.2 | 1.1 | 2.4 | 5.2 | 5.6 | 4.9 |
| Debt Maturities and Redemptions | 33.1 | – | 33.1 | 26.9 | 27.5 | 30.7 |
| Total Funding Requirement | 59.8 | 6.1 | 65.9 | 61.2 | 54.1 | 42.7 |
| Decrease/(Increase) in Short-Term Borrowing | (5.0) | (0.5) | (5.5) | (6.0) | (6.0) | – |
| Increase/(Decrease) in Year-End Cash and Cash Equivalents | (12.0) | 10.2 | (1.8) | (8.0) | (5.0) | – |
| Total Long-Term Borrowing | 42.8 | 15.8 | 58.6 | 47.2 | 43.1 | 42.7 |
Table 4.1 footnotes:
[1] The increase in Net Loans and Investments primarily reflects higher projected loan disbursements associated with Ontario Student Assistance Program (OSAP) policy changes effective in the 2026–27 academic year.
Note: Numbers may not add due to rounding.
Source: Ontario Financing Authority.
Ontario has completed long-term borrowing for 2025–26 of $58.6 billion. This is $15.8 billion higher than anticipated in the 2025 Budget and has allowed Ontario to pre-fund 2026–27 borrowing requirements and the $5 billion Protect Ontario Account, first announced in the 2025 Budget. The 2026–27, 2027–28 and 2028–29 long-term public borrowing forecasts are $47.2 billion, $43.1 billion and $42.7 billion.
Year-end cash and cash equivalents are forecasted to decrease by $8.0 billion in 2026–27 and $5.0 billion in 2027–28.
Ontario plans to increase short-term borrowing by $6.0 billion in 2026–27 and 2027–28. This positions Ontario to respond to recent changes in market demand for short-term Ontario debt. It will also maintain the proportion of short-term debt as a percentage of total debt outstanding within the target range of 5 to 7 per cent, as it has been over the past 10 years.
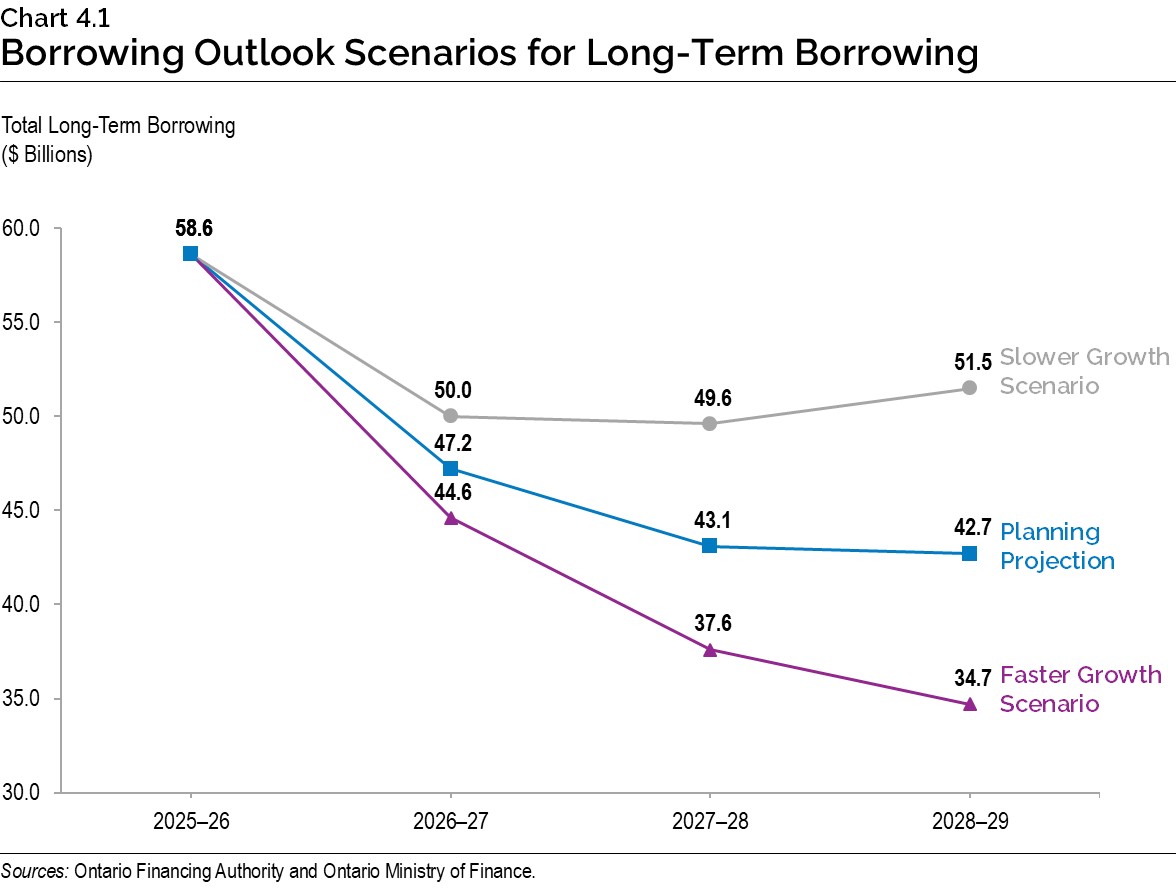
In the event that alternative economic scenarios materialize, Ontario’s borrowing requirements in the next three years would also change (see Chapter 3: Ontario’s Fiscal Plan and Outlook for more details, and a description of the resulting alternative medium-term outlook scenarios). Under the Faster Growth scenario, long-term borrowing would decrease by a total of $16.1 billion over the three-year outlook period, while under the Slower Growth scenario, long-term borrowing would increase by $18.1 billion over the same period.
Increased foreign demand and favourable international market conditions allowed for increased foreign issuance this year. Domestic Canadian borrowing represented 59 per cent of 2025–26 long‑term borrowing and was comprised of 35 syndicated issues, one floating rate note, two Green Bonds and one Green Bond floating rate note. This percentage was lower than Ontario’s guidance for domestic borrowing of 65 to 80 per cent for the 2025–26 fiscal year. Ontario’s new guidance for domestic borrowing will be adjusted to 60 to 80 per cent for 2026–27. This range will continue to be adjusted, if necessary, in response to evolving investor demand in the Canadian dollar and foreign currency markets.
The increase in foreign issuance allowed for further diversification of Ontario’s investor base while achieving cost-effective funding, ensuring reliable access to capital away from the domestic market. Foreign currency borrowing helps reduce Ontario’s overall borrowing costs. Responding to investor demand, Ontario issues foreign denominated public debt as well as privately placed transactions. Approximately $23.9 billion, or 41 per cent of this year’s long-term borrowing, was completed in foreign currencies, primarily in U.S. dollars, euros and Swiss francs. This year, for the first time, Ontario issued euro denominated 30-year bonds, raising $0.6 billion at lower costs than issuing in Canada after being hedged back to Canadian dollars. All proceeds from this fiscal year’s foreign issuances have been effectively hedged back to Canadian dollars, resulting in no foreign exchange risk to the province.
Sustainable Bond Framework
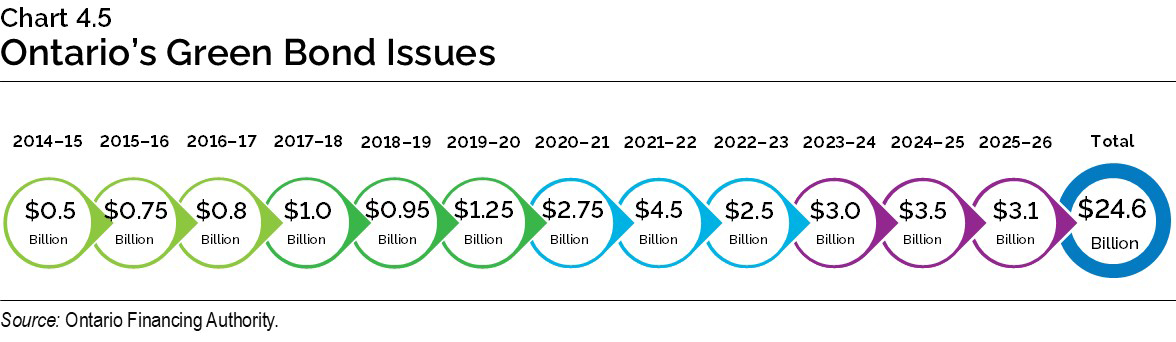
The Green Bond Program, as part of the Sustainable Bond Framework, has been a core component of Ontario’s borrowing program since 2014. It is an important tool to help finance public transit initiatives, extreme weather-resistant infrastructure, as well as energy efficiency and conservation projects. Ontario remains the largest and most frequent issuer of Canadian dollar Green Bonds, with 21 issues totalling $24.6 billion since 2014–15 and $19.85 billion outstanding. A total of 29 projects have or will receive funding from Ontario’s 21 Green Bond issues. This includes the recently opened Eglinton Crosstown Light Rail Transit (LRT), which received $3.7 billion in financing across 10 Green Bond issues.
On November 19, 2025, Ontario issued its first dual-tranche Green Bond, consisting of a $600 million Green Bond and a $1.5 billion Green Bond Floating Rate Note. Ontario has issued three Green Bonds in 2025–26, 21 Green Bond issues overall, and seven Green Bonds issued under the Ontario Sustainable Bond Framework. Four projects were selected to receive funding from the most recent Green Bond:
- GO Expansion;
- Hazel McCallion Line;
- Ontario Line Subway; and
- Scarborough Subway Extension.
Ontario plans to continue its leadership in the Canadian dollar Green Bond market and, subject to market conditions, will issue multiple Green Bonds each fiscal year.
Cost of Debt
The Bank of Canada cut the overnight policy rate four times in 2025 and entered 2026 with a neutral stance. As a result, short-term interest rates have declined significantly, while longer-term interest rates, which affect most of Ontario’s borrowing, have remained relatively stable.
In an environment where ongoing trade tension, geopolitical conflicts and rapid technological change are collectively reshaping the Canadian and global economies, the central bank actions and financial markets’ responses remain unpredictable. Ontario actively manages interest rate risks to minimize impacts on the Interest and Other Debt Servicing Charges (IOD) costs.
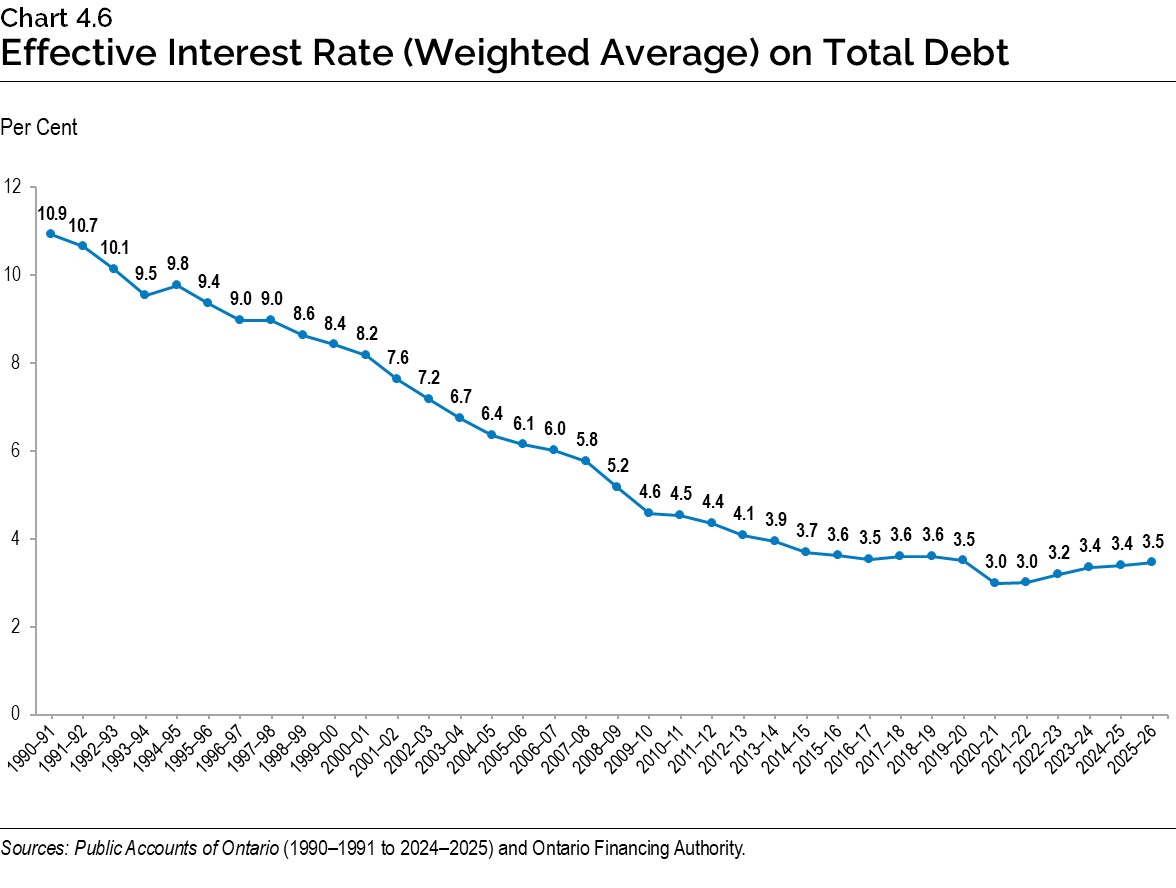
Chart 4.6 shows that Ontario’s decision to lock in long-term rates and extend the term of its debt has left the interest rate on the total debt portfolio lower, in historical terms, in spite of rising broader market interest rates over the past five years.
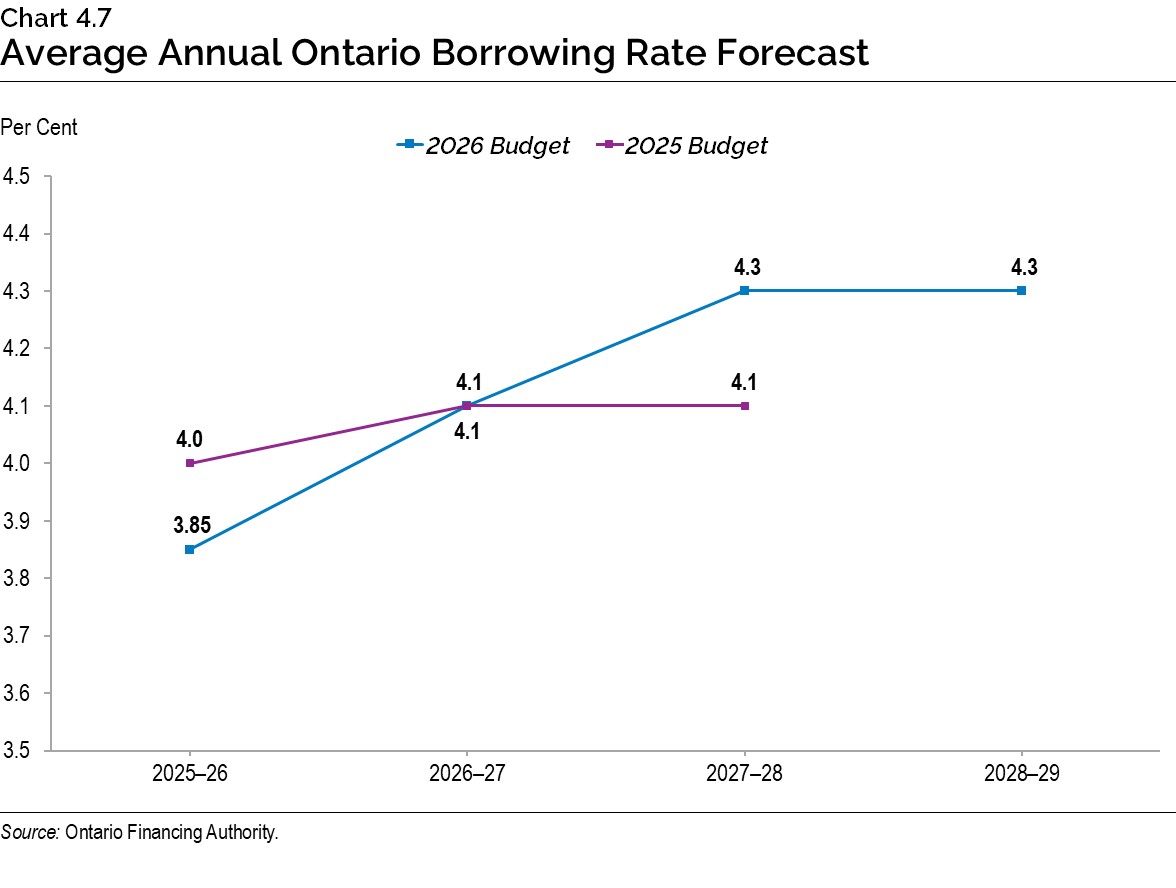
Ontario’s borrowing costs for 2025–26 are now estimated to be 3.85 per cent, 15 basis points lower than forecasted in the 2025 Budget, as shown in Chart 4.7. A one percentage point change in interest rates, either up or down from the current interest rate forecast, would result in a corresponding change in Ontario’s borrowing costs of approximately $0.9 billion in the first full year. IOD remains Ontario’s fourth largest expense after health care, education and social services.
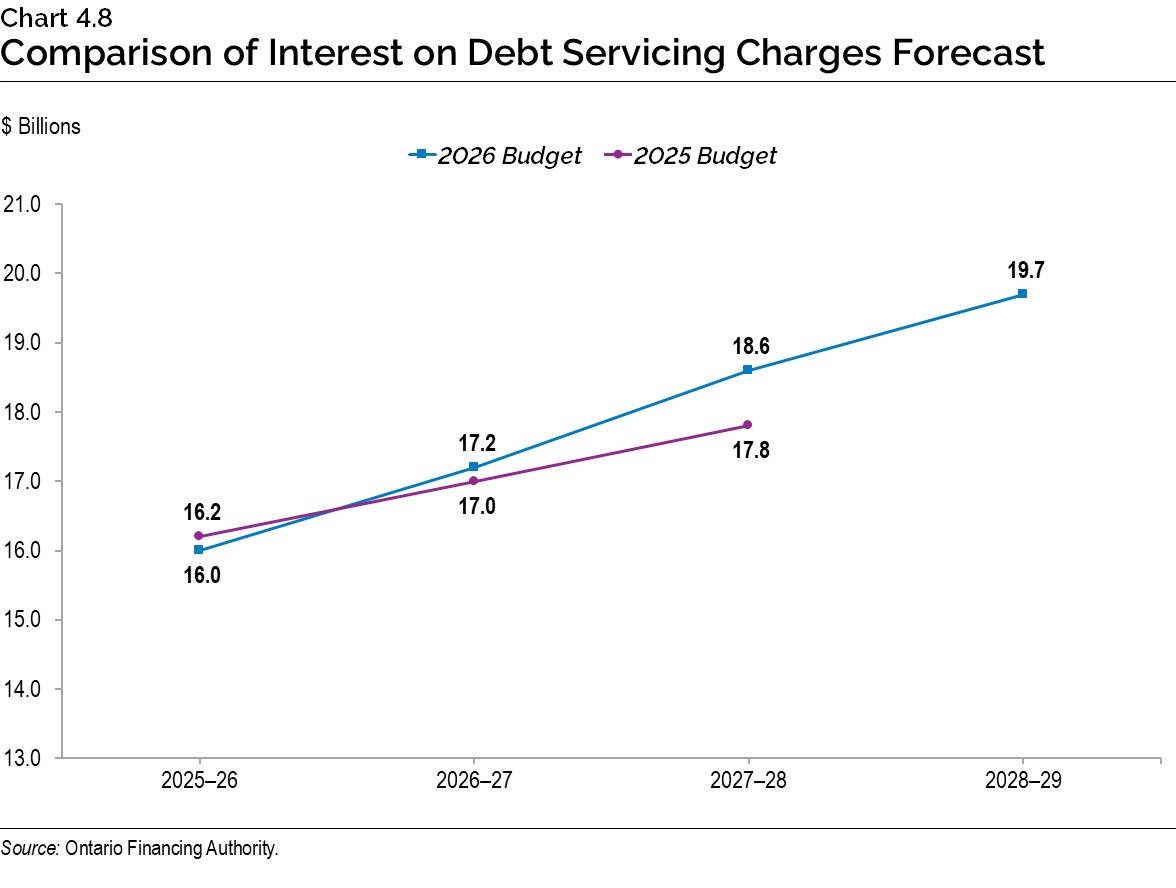
Ontario is forecast to pay $16.0 billion in interest costs in 2025–26, $0.2 billion lower than the 2025 Budget projection. Interest costs for 2026–27 and 2027–28 are estimated to be $17.2 billion and $18.6 billion, up from the 2025 Budget forecasts of $17.0 billion and $17.8 billion, respectively.
The forecast for interest costs has risen due to higher deficits, increased capital spending and an increase in Ontario’s loans and investment portfolio, with the latter primarily driven by a larger Ontario Student Assistance Program (OSAP).
Term of Debt
Ontario has continued to extend the term of its debt when investor demand allowed, to reduce future refinancing risk. This also protects the IOD forecast in the long term against future interest rate increases. Ontario has issued $160.8 billion of bonds, or almost one-third of total debt outstanding, with maturities of 30 years or longer since 2010–11. This includes $11.1 billion in 2025–26.
The success Ontario has had in extending the term of its debt has created flexibility for managing its large borrowing program and debt portfolio. Due to the extension of the term of debt, the impact on IOD in the short term and medium term has been lessened. Ontario will continue to monitor the market and adjust the debt term strategy in response to further changes to interest rates and the yield curve.
Ensuring Adequate Liquidity Levels
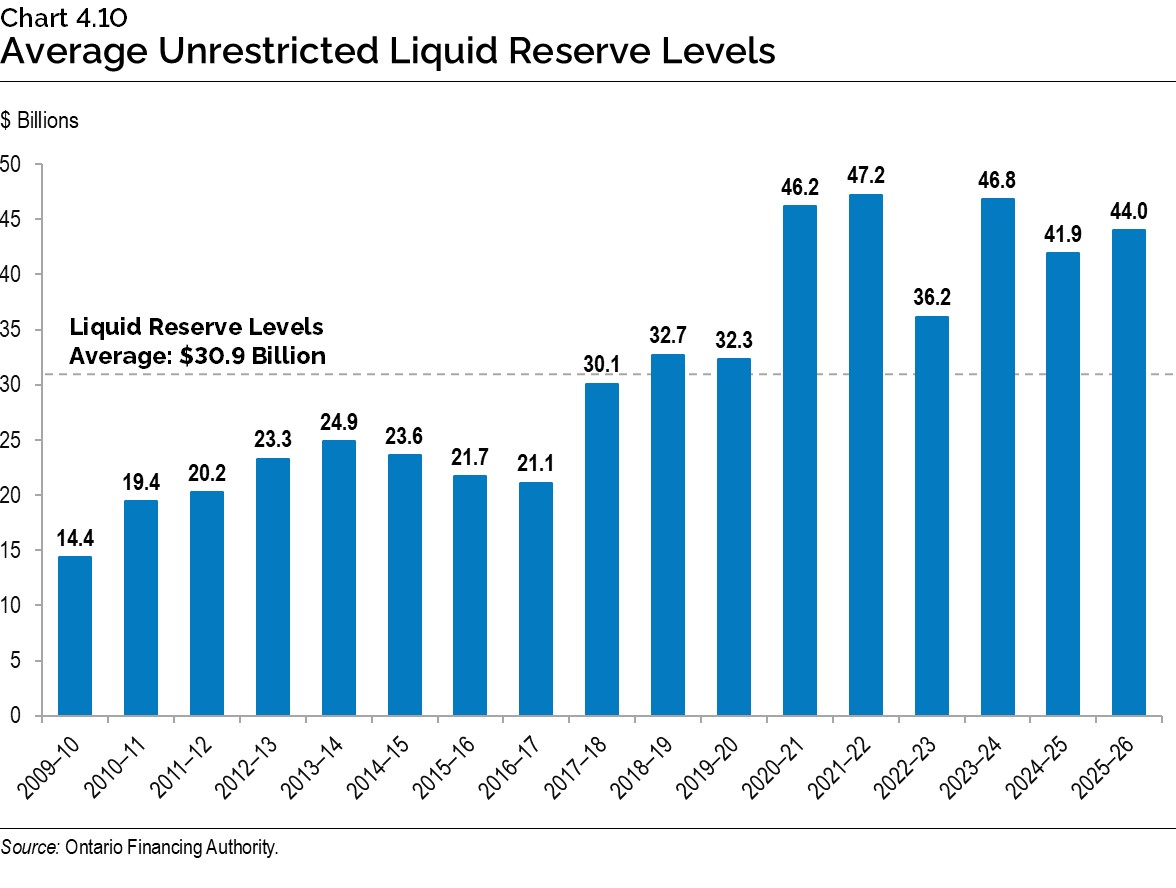
Ontario aims to maintain an optimal level of cash reserves that balance potential holding costs with the need to have adequate funds to meet its financial obligations in a timely manner, as well as to be able to respond promptly during economic downturns or financial challenges. Prior to 2025–26, short-term interest rates were higher than long-term rates, which meant that holding liquid reserves reduced IOD as short-term investments earned more income than Ontario’s cost of borrowing long-term debt. Although short-term and long-term rates have normalized, Ontario intends to maintain current liquid reserve levels due to ongoing market and economic volatility. Ontario will continue to actively manage liquid reserve investments, including creating a core liquidity portfolio of longer-term liquid investments, to help mitigate the cost of holding liquid reserves.
As shown in Chart 4.10, Ontario’s cash reserves averaged $44.0 billion in 2025–26.
Debt Burden Reduction Strategy
The Debt Burden Reduction Strategy set out below provides the government’s progress and associated metrics required under the Fiscal Sustainability, Transparency and Accountability Act, 2019.
The government remains committed to reducing the debt burden while ensuring that Ontario’s finances are sustainable. As a result, Ontario has maintained its targets and continues to make progress towards achieving them over the medium-term outlook. In addition, Ontario’s path to balance by 2028–29 will further support progress towards its Debt Burden Reduction Strategy.
Effective April 1, 2026, new Public Sector Accounting Standards – Conceptual Framework for Financial Reporting in the Public Sector and Section PS 1202 Financial Statement Presentation (Conceptual Framework and Reporting Model), require governments to present Net Financial Liabilities as the primary balance sheet indicator in the Public Accounts, replacing Net Debt. Net Financial Liabilities is calculated as Financial Assets less Financial Liabilities. Under the new standard, certain elements previously included in liabilities are excluded, reflecting updated accounting guidance.
For the purposes of fiscal planning, transparency and international comparability, Ontario will continue to use Net Debt in the 2026 Budget and other strategic fiscal documents. Net Debt remains a widely used indicator across jurisdictions in Canada and internationally and is an important benchmark for investors in Ontario bonds. To maintain comparability with previously published fiscal plan information and the forthcoming Public Accounts of Ontario 2025–2026, the 2025–26 Interim Net Debt measure will continue to be presented using the previous calculation. Beginning in 2026–27, Net Debt for the outlook years reflects the revised calculation that will be adopted in the 2026–2027 Public Accounts and is equivalent to Net Financial Liabilities. As a result, Net Debt figures will differ from previously reported figures even though the underlying fiscal position is unchanged.
To improve clarity, consistency and ease of communication, Ontario is updating the names of the debt burden ratios, as follows:
| Item | Targets | 2025–26 Forecast 2025 Budget |
2025–26 Forecast 2026 Budget |
2026–27 Forecast 2025 Budget |
2026–27 Forecast 2026 Budget |
|---|---|---|---|---|---|
| Net Debt-to-GDP1 | <40.0 | 37.9 | 36.8 | 38.9 | 37.7 |
| Net Debt-to-Revenue2 | <200 | 211 | 204 | 215 | 211 |
| Interest-to-Revenue | <7.5 | 6.5 | 6.3 | 6.7 | 6.7 |
Table 4.2 footnotes:
[1], [2] For 2026–27, Net Debt reflects financial assets less financial liabilities and is aligned with Net Financial Liabilities, as will be reported in the Public Accounts of Ontario 2026–2027.
Source: Ontario Financing Authority.
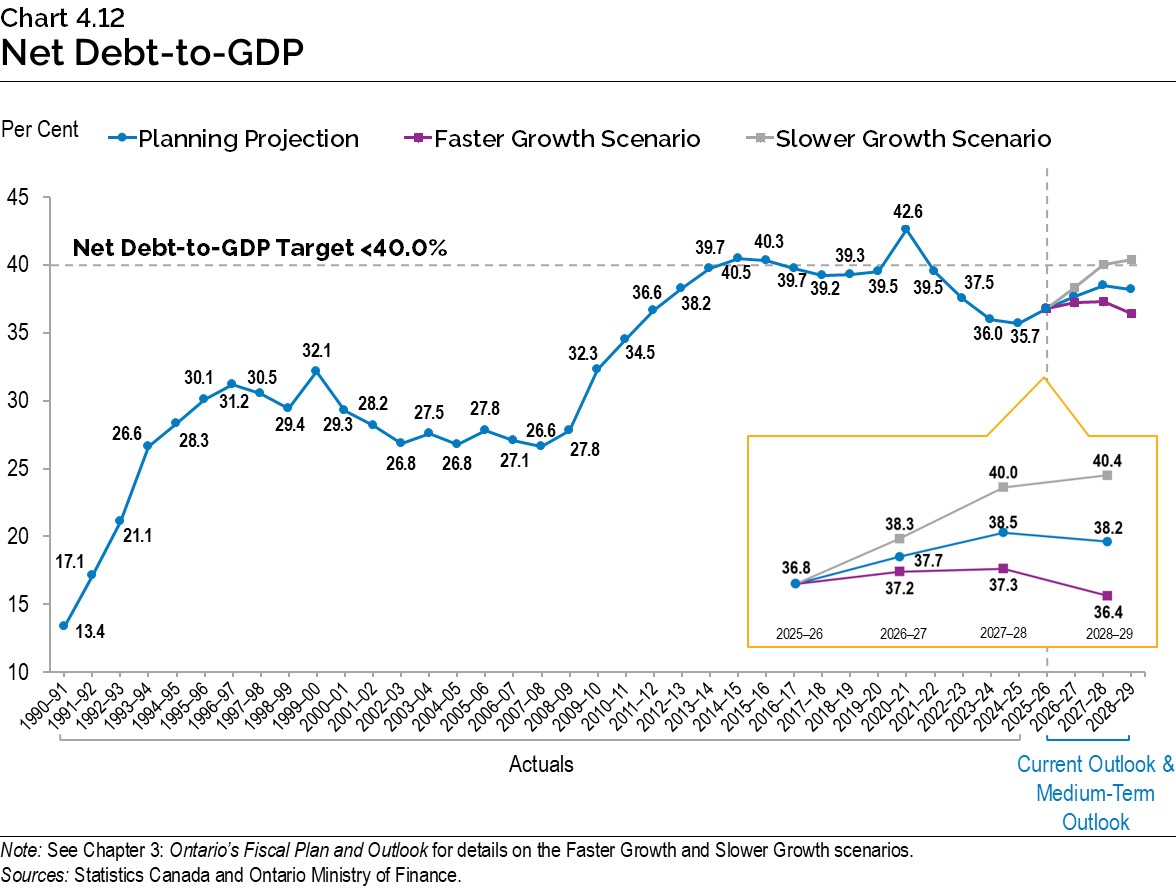
Ontario’s 2025–26 net debt‐to‐GDP ratio is now forecast to be 36.8 per cent, a decrease of 1.1 percentage points from the 37.9 per cent forecasted in the 2025 Budget, which is primarily due to a lower-than-projected deficit. The ratio is projected to be 37.7 per cent in 2026–27, 38.5 per cent in 2027–28, and 38.2 per cent in 2028–29. This represents a modest improvement from the forecast in the 2025 Budget, attributed to stronger GDP growth. Beginning in 2026–27, the net debt-to-GDP ratio reflects the revised net debt calculation under the new Public Sector Accounting Standard effective April 1, 2026. This methodological change results in the ratio being 0.8 per cent lower in each of the three outlook years compared to what would have been reported under the previous calculation.
Over the medium-term outlook, the net debt-to-GDP ratio is forecast to stay below the target of 40.0 per cent, demonstrating that Ontario continues to make positive progress towards reducing the debt burden.
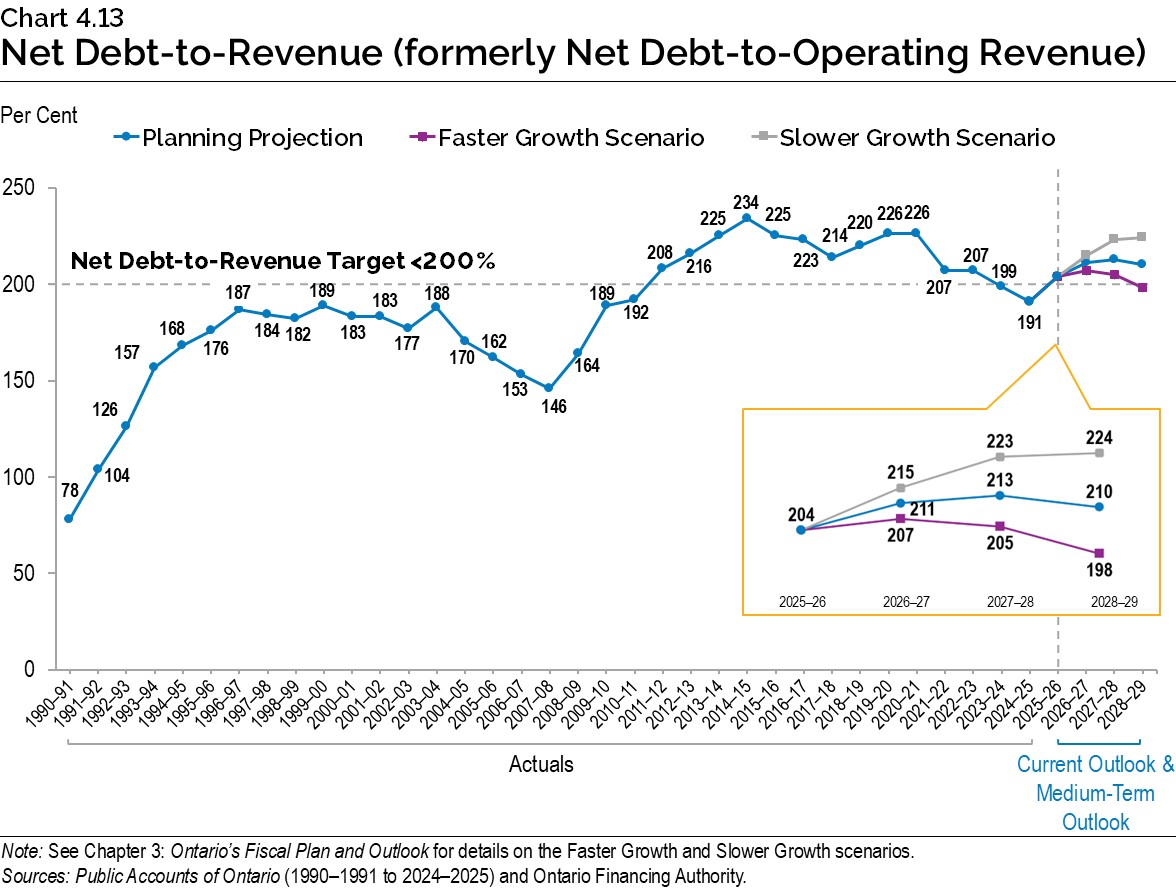
The net debt-to-revenue ratio is projected to be 204 per cent in 2025–26, 7 percentage points below the 211 per cent forecasted in the 2025 Budget. Over the medium-term outlook, this ratio is forecast to be 211 per cent in 2026–27, 213 per cent in 2027–28, and 210 per cent in 2028–29. The methodological change in the calculation of Net Debt beginning in 2026–27 results in the ratio being approximately 4 per cent lower in each of the three outlook years compared to what would have been reported under the previous calculation. Ontario’s target for the net debt-to-revenue ratio remains to be below 200 per cent. While the current economic environment will temporarily raise the level of this ratio, the government remains committed to and has proven it has the capability to reattain this target. Based on the growth trend in net debt and revenue beyond the medium-term outlook, this ratio is expected to meet the target of 200 per cent by 2032–33, or as early as 2028–29 should the Faster Growth scenario materialize.
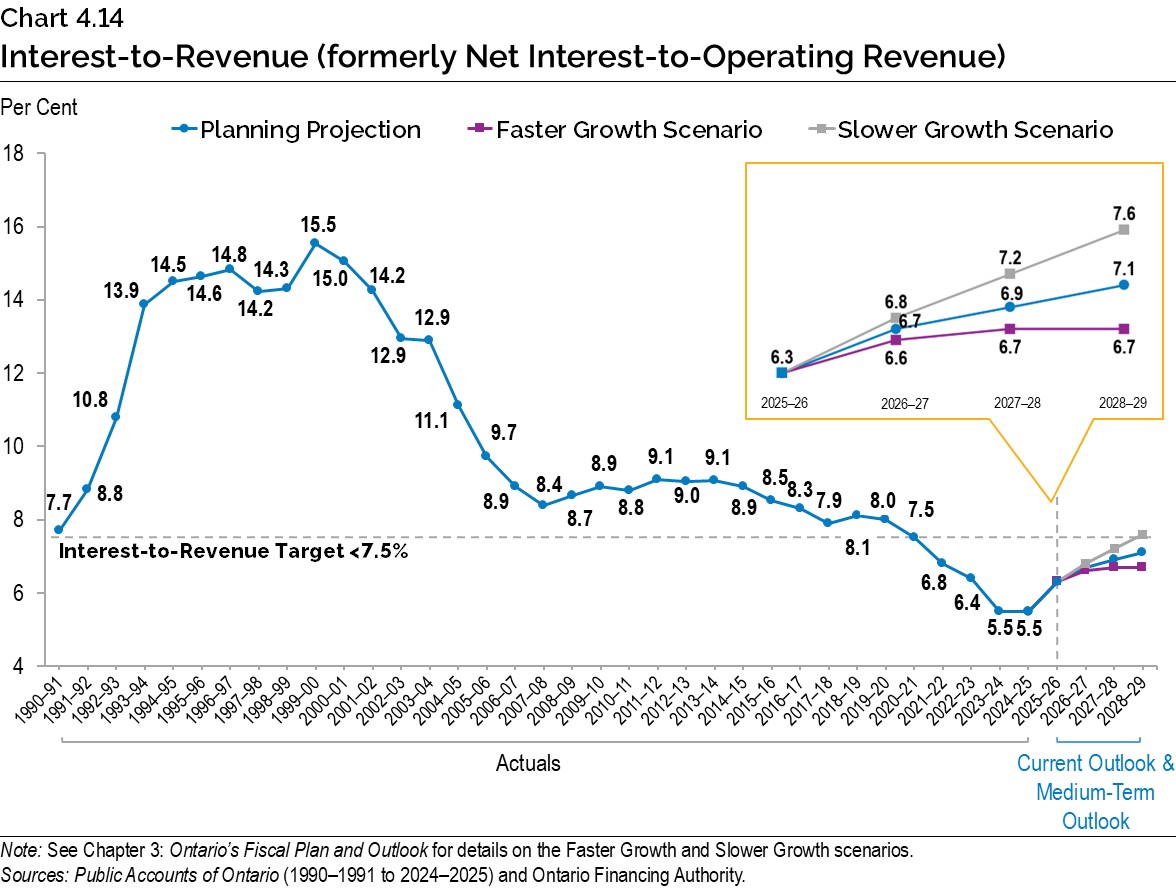
Ontario’s interest-to-revenue ratio is projected to be 6.3 per cent in 2025–26, 0.2 percentage points lower than the 6.5 per cent forecast in the 2025 Budget. Over the medium-term outlook, this ratio is forecast to be 6.7 per cent in 2026–27, 6.9 per cent in 2027–28 and 7.1 per cent in 2028–29. In comparison to the 2025 Budget, the ratio remains the same for 2026–27 and increases by 0.1 percentage points in 2027–28.
Ontario continues to show positive progress on the interest-to-revenue ratio and is forecasting that it will meet the target and stay below 7.5 per cent over the medium-term outlook. This ratio remains close to the lowest levels it has been at since the 1980s.
A lower interest-to-revenue ratio frees up financial resources for critical priorities.
Consolidated Financial Tables
| Debt2 | 2021–22 | 2022–23 | 2023–24 | Actual 2024–25 |
Interim1 2025–26 |
Plan 2026–27 |
|---|---|---|---|---|---|---|
| Publicly Held Debt — Bonds3 | 399,628 | 403,398 | 417,308 | 440,186 | 466,951 | 487,326 |
| Publicly Held Debt — Treasury Bills | 22,301 | 22,276 | 22,536 | 22,189 | 21,122 | 27,122 |
| Publicly Held Debt — U.S. Commercial Paper4 | 1,735 | 460 | – | 5,395 | 11,962 | 11,962 |
| Publicly Held Debt — Infrastructure Ontario (IO)5 | 300 | 300 | 300 | 300 | 300 | 300 |
| Publicly Held Debt — Other | 231 | 217 | 202 | 186 | 170 | 152 |
| Total Publicly Held Debt | 424,195 | 426,651 | 440,346 | 468,256 | 500,505 | 526,862 |
| Non-Public Debt | 8,766 | 8,678 | 7,956 | 6,782 | 6,165 | 6,123 |
| Gross Debt | 432,961 | 435,329 | 448,302 | 475,038 | 506,670 | 532,985 |
| Less: Holdings of own Ontario Bonds and Treasury Bills6 | (7,098) | (10,154) | (6,125) | (12,549) | (9,984) | – |
| Less: Unamortized Discounts, Premiums and Commissions7 | – | (3,376) | (4,544) | (4,361) | (4,564) | – |
| Total Debt | 425,863 | 421,799 | 437,633 | 458,128 | 492,122 | 532,985 |
| Other Net Financial (Assets)/Liabilities8 | (54,729) | (38,554) | (46,288) | (47,331) | (50,319) | (64,200) |
| Broader Public Sector Net Debt | 11,708 | 16,561 | 18,416 | 16,253 | 17,559 | 16,335 |
| Net Debt9 | 382,842 | 399,806 | 409,761 | 427,050 | 459,362 | 485,120 |
| Non-Financial Assets10 | (144,682) | (153,799) | (163,660) | (179,990) | (199,976) | (211,890) |
| Accumulated Deficit | 238,160 | 246,007 | 246,101 | 247,060 | 259,386 | 273,230 |
Table 4.3 footnotes:
[1] Interim represents the 2026 Budget projection for the 2025–26 fiscal year.
[2] Includes debt issued by Ontario and all government organizations, including the Ontario Electricity Financial Corporation (OEFC).
[3], [4] All balances are expressed in Canadian dollars. The balances above reflect the effect of related derivative contracts.
[5] IO debt is composed of Infrastructure Renewal Bonds. IO debt is not guaranteed by Ontario.
[6] Ontario holds its own debt mainly to reduce the cash flow required to service large maturities, typically in June. For 2026–27, there are currently no significant holdings for maturities.
[7] Effective April 1, 2022, Ontario adopted the new Public Sector Accounting Standards (PSAS) on Financial Instruments on a prospective basis. Unamortized discounts and premiums are now amortized on an effective interest basis. These amounts are not forecasted for 2026–27.
[8] Other Net Financial (Assets)/Liabilities include cash and temporary investments, accounts receivable, loans receivable, advances and investments in Government Business Enterprises (GBEs) offset by accounts payable, accrued liabilities, deferred revenue and capital contributions, pensions and other employee future benefits, and other liabilities.
[9] Effective April 1, 2026, Ontario adopted the new Public Sector Accounting Standards (PSAS) related to the Conceptual Framework and Reporting Model. For 2026–27 and future years, Net Debt reflects financial assets less financial liabilities and is aligned with Net Financial Liabilities, as will be reported in the Public Accounts of Ontario 2026–2027.
[10] Non-financial assets include the tangible capital assets of Ontario, including the broader public sector.
Sources: Ontario Financing Authority and Ontario Ministry of Finance.
| Item | 2026–27 | 2027–28 | 2028–29 |
|---|---|---|---|
| Total Debt | 532,985 | 554,566 | 566,432 |
| Other Net Financial (Assets)/Liabilities | (64,200) | (57,303) | (54,695) |
| Broader Public Sector Net Debt | 16,335 | 17,114 | 17,545 |
| Net Debt1 | 485,120 | 514,377 | 529,282 |
| Non-Financial Assets | (211,890) | (235,030) | (250,491) |
| Accumulated Deficit | 273,230 | 279,347 | 278,791 |
Table 4.4 footnotes:
[1] Effective April 1, 2026, Ontario adopted the new Public Sector Accounting Standards (PSAS) related to the Conceptual Framework and Reporting Model. For 2026–27 and future years, Net Debt reflects financial assets less financial liabilities and is aligned with Net Financial Liabilities, as will be reported in the Public Accounts of Ontario 2026–2027.
Note: Numbers may not add due to rounding.
Sources: Ontario Financing Authority and Ontario Ministry of Finance.
Chart Descriptions
Chart 4.1: Borrowing Outlook Scenarios for Long-Term Borrowing
| Year | 2025–26 | 2026–27 | 2027–28 | 2028–29 |
|---|---|---|---|---|
| Planning Projection | 58.6 | 47.2 | 43.1 | 42.7 |
| Slower Growth Scenario | 58.6 | 50.0 | 49.6 | 51.5 |
| Faster Growth Scenario | 58.6 | 44.6 | 37.6 | 34.7 |
Sources: Ontario Financing Authority and Ontario Ministry of Finance.
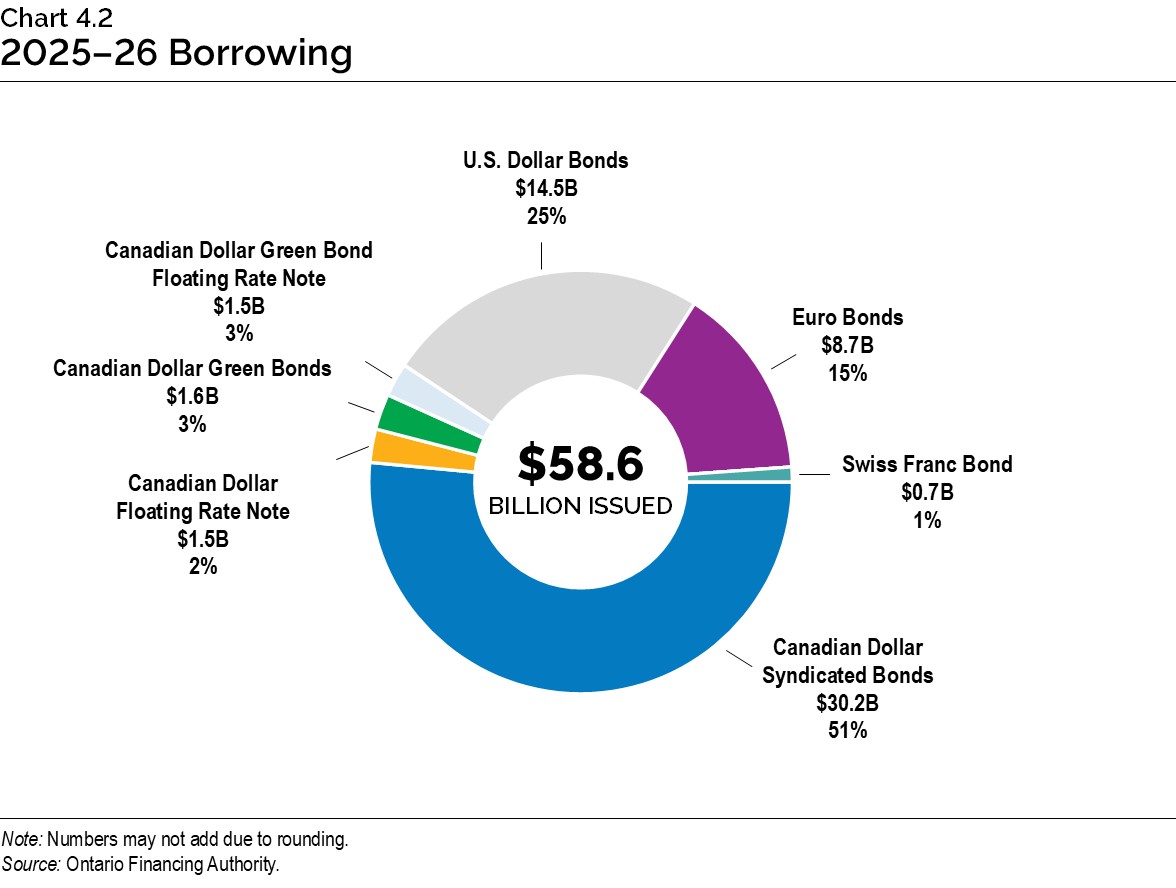
Chart 4.2: 2025–26 Borrowing
Long-term public borrowing of $58.6 billion has been completed for fiscal year 2025–26. This consisted of $30.2 billion (51 per cent) of Canadian dollar syndicated bonds, $1.6 billion (3 per cent) Canadian dollar Green Bonds, $1.5 billion (2 per cent) of Canadian Dollar Floating Rate Note, $1.5 billion (3 per cent) of Canadian Dollar Green Bond Floating Rate Note, $8.7 billion (15 per cent) of euro bonds, $0.7 billion (1 per cent) of Swiss franc bond, and $14.5 billion (25 per cent) of U.S. dollar bonds.
Note: Numbers may not add due to rounding.
Source: Ontario Financing Authority.
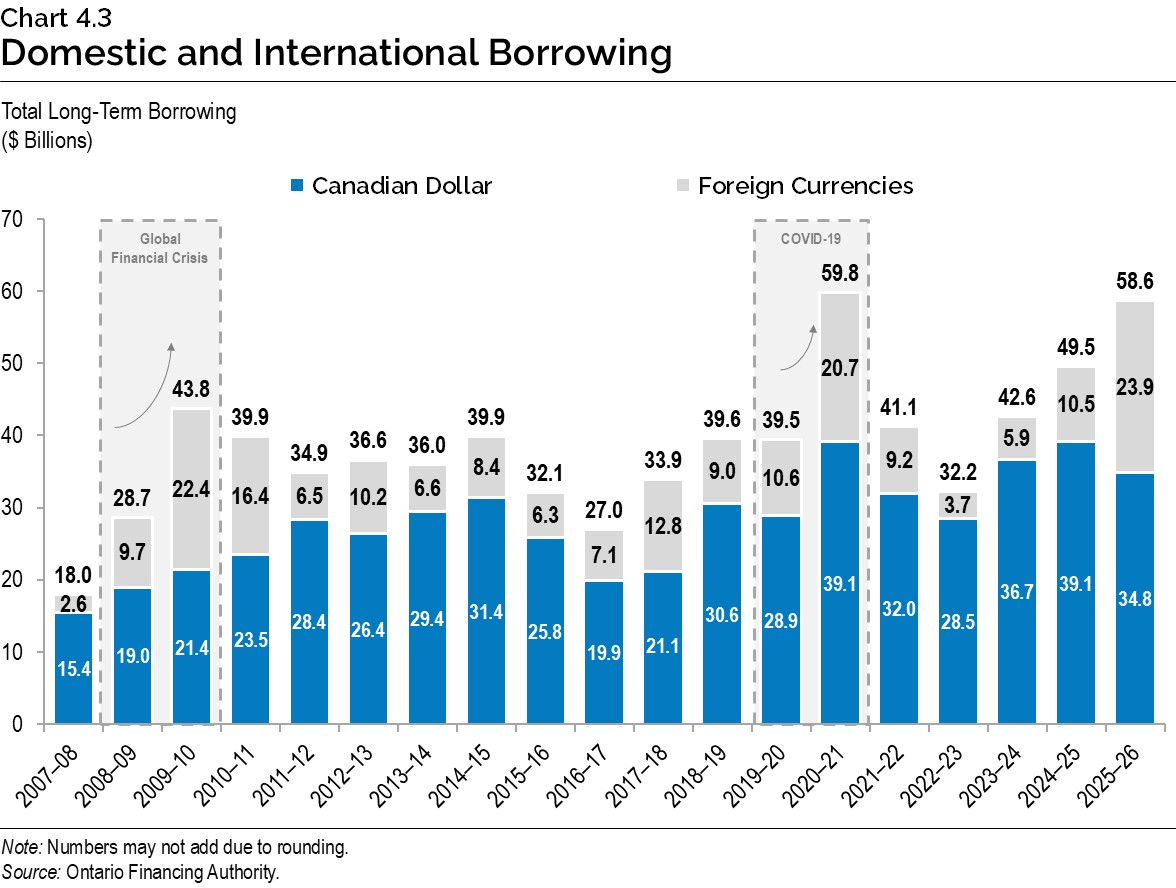
Chart 4.3: Domestic and International Borrowing
Ontario has completed long-term borrowing for 2025–26 of $58.6 billion — $34.8 billion was borrowed in the Canadian dollar market and $23.9 billion was borrowed in foreign currencies.
| Year | Canadian Dollar ($ Billions) |
Foreign Currencies ($ Billions) |
Total ($ Billions) |
|---|---|---|---|
| 2007–08 | 15.4 | 2.6 | 18.0 |
| 2008–09 | 19.0 | 9.7 | 28.7 |
| 2009–10 | 21.4 | 22.4 | 43.8 |
| 2010–11 | 23.5 | 16.4 | 39.9 |
| 2011–12 | 28.4 | 6.5 | 34.9 |
| 2012–13 | 26.4 | 10.2 | 36.6 |
| 2013–14 | 29.4 | 6.6 | 36.0 |
| 2014–15 | 31.4 | 8.4 | 39.9 |
| 2015–16 | 25.8 | 6.3 | 32.1 |
| 2016–17 | 19.9 | 7.1 | 27.0 |
| 2017–18 | 21.1 | 12.8 | 33.9 |
| 2018–19 | 30.6 | 9.0 | 39.6 |
| 2019–20 | 28.9 | 10.6 | 39.5 |
| 2020–21 | 39.1 | 20.7 | 59.8 |
| 2021–22 | 32.0 | 9.2 | 41.1 |
| 2022–23 | 28.5 | 3.7 | 32.2 |
| 2023–24 | 36.7 | 5.9 | 42.6 |
| 2024–25 | 39.1 | 10.5 | 49.5 |
| 2025–26 | 34.8 | 23.9 | 58.6 |
Note: Numbers may not add due to rounding.
Source: Ontario Financing Authority.
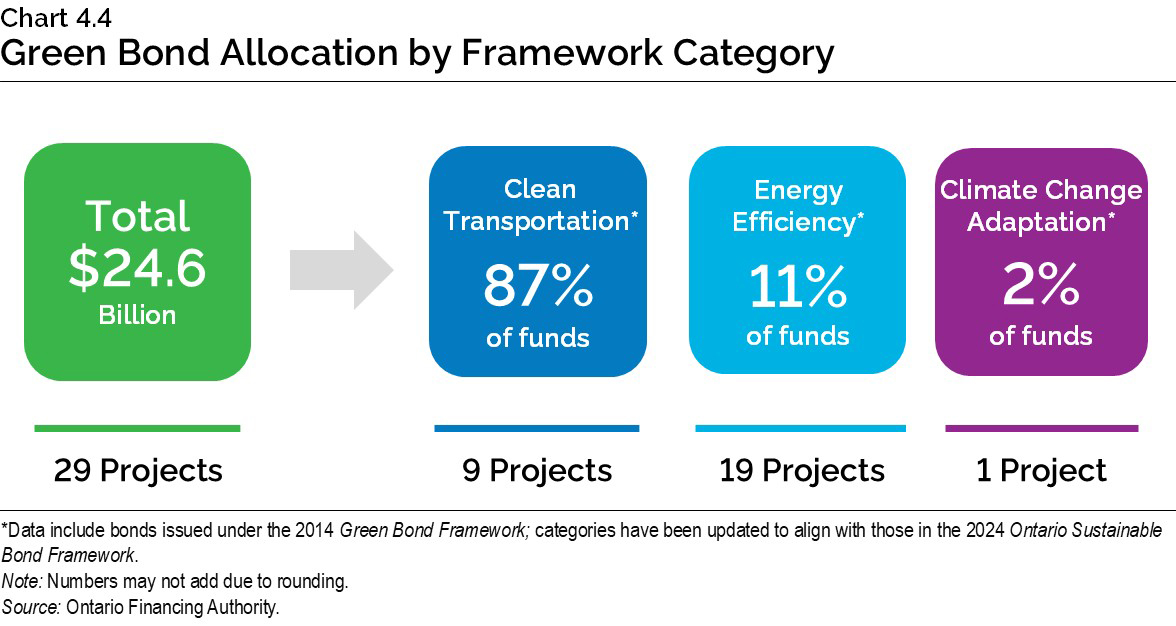
Chart 4.4: Green Bond Allocation by Framework Category
A total of $24.6 billion in Green Bond funding has or will provide funding for 29 projects. Nine of those projects are under the Clean Transportation framework category and have received 87 per cent of the funding. Nineteen projects are under the Energy Efficiency category and have received 11 per cent of the funding. One project is under the Climate Change Adaptation category and has received 2 per cent of the funding.
Note: Numbers may not add due to rounding.
Source: Ontario Financing Authority.
Chart 4.5: Ontario’s Green Bond Issues
Since 2014, Ontario has issued Green Bonds totalling $24.6 billion.
| Year | 2014–15 | 2015–16 | 2016–17 | 2017–18 | 2018–19 | 2019–20 | 2020–21 | 2021–22 | 2022–23 | 2023–24 | 2024–25 | 2025–26 |
|---|---|---|---|---|---|---|---|---|---|---|---|---|
| Green Bond Issues ($) | $0.5 billion | $0.75 billion | $0.8 billion | $1.0 billion | $0.95 billion | $1.25 billion | $2.75 billion | $4.5 billion | $2.5 billion | $3.0 billion | $3.5 billion | $3.1 billion |
Source: Ontario Financing Authority.
Chart 4.6: Effective Interest Rate (Weighted Average) on Total Debt
The effective interest rate (calculated as a weighted average) for 2025–26 is 3.5 per cent on Ontario’s total debt.
| Year | Effective Interest Rate (%) |
|---|---|
| 1990–91 | 10.9 |
| 1991–92 | 10.7 |
| 1992–93 | 10.1 |
| 1993–94 | 9.5 |
| 1994–95 | 9.8 |
| 1995–96 | 9.4 |
| 1996–97 | 9.0 |
| 1997–98 | 9.0 |
| 1998–99 | 8.6 |
| 1999–00 | 8.4 |
| 2000–01 | 8.2 |
| 2001–02 | 7.6 |
| 2002–03 | 7.2 |
| 2003–04 | 6.7 |
| 2004–05 | 6.4 |
| 2005–06 | 6.1 |
| 2006–07 | 6.0 |
| 2007–08 | 5.8 |
| 2008–09 | 5.2 |
| 2009–10 | 4.6 |
| 2010–11 | 4.5 |
| 2011–12 | 4.4 |
| 2012–13 | 4.1 |
| 2013–14 | 3.9 |
| 2014–15 | 3.7 |
| 2015–16 | 3.6 |
| 2016–17 | 3.5 |
| 2017–18 | 3.6 |
| 2018–19 | 3.6 |
| 2019–20 | 3.5 |
| 2020–21 | 3.0 |
| 2021–22 | 3.0 |
| 2022–23 | 3.2 |
| 2023–24 | 3.4 |
| 2024–25 | 3.4 |
| 2025–26 | 3.5 |
Sources: Public Accounts of Ontario (1990–1991 to 2024–2025) and Ontario Financing Authority.
Chart 4.7: Average Annual Ontario Borrowing Rate Forecast
| Year | 2026 Budget (%) |
2025 Budget (%) |
|---|---|---|
| 2025–26 | 3.85 | 4.0 |
| 2026–27 | 4.1 | 4.1 |
| 2027–28 | 4.3 | 4.1 |
| 2028–29 | 4.3 | – |
Source: Ontario Financing Authority.
Chart 4.8: Comparison of Interest on Debt Servicing Charges Forecast
| Year | 2026 Budget ($ Billions) |
2025 Budget ($ Billions) |
|---|---|---|
| 2025–26 | 16.0 | 16.2 |
| 2026–27 | 17.2 | 17.0 |
| 2027–28 | 18.6 | 17.8 |
| 2028–29 | 19.7 | – |
Source: Ontario Financing Authority.
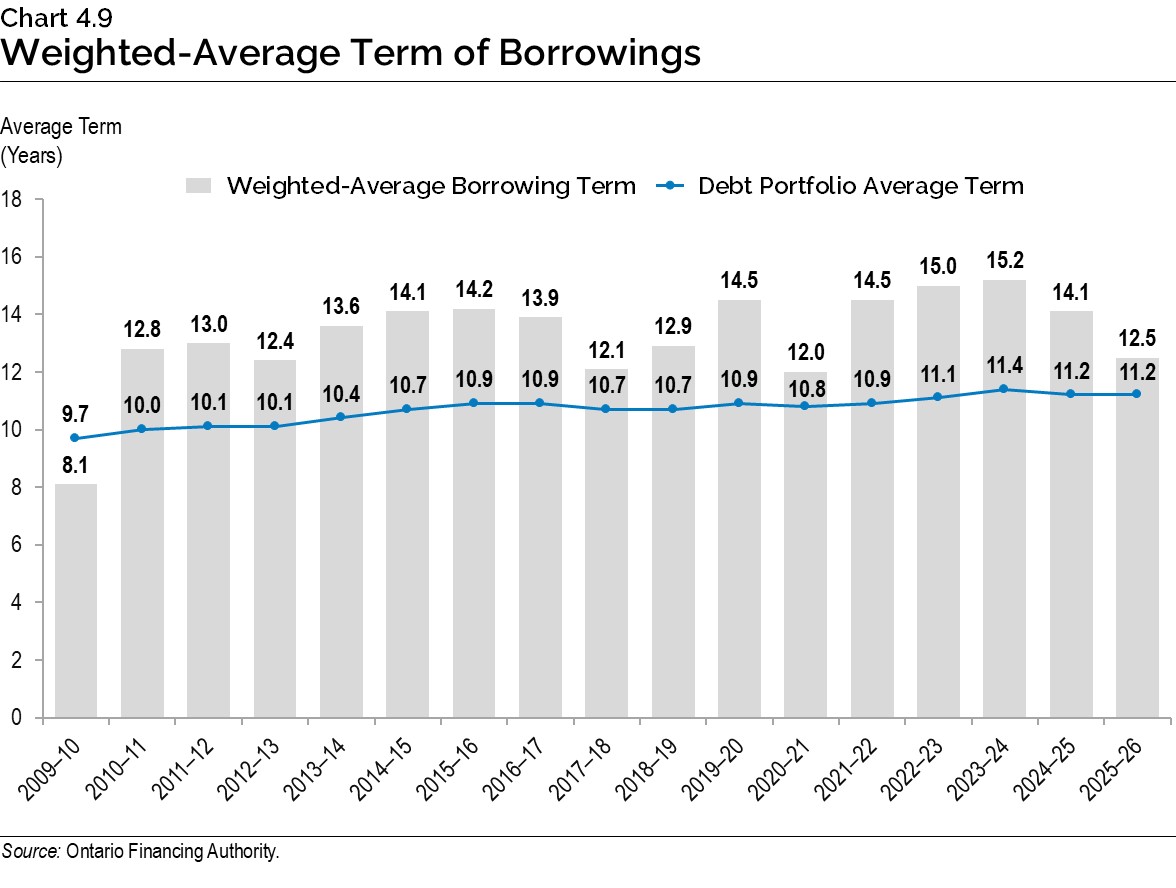
Chart 4.9: Weighted-Average Term of Borrowings
The average term of Ontario’s debt portfolio has been extended from 9.7 years in 2009–10 to 11.2 years in 2025–26. The weighted-average borrowing term for 2025–26 was 12.5 years.
| Year | Weighted-Average Borrowing Term (Years) |
Debt Portfolio Average Term (Years) |
|---|---|---|
| 2009–10 | 8.1 | 9.7 |
| 2010–11 | 12.8 | 10 |
| 2011–12 | 13 | 10.1 |
| 2012–13 | 12.4 | 10.1 |
| 2013–14 | 13.6 | 10.4 |
| 2014–15 | 14.1 | 10.7 |
| 2015–16 | 14.2 | 10.9 |
| 2016–17 | 13.9 | 10.9 |
| 2017–18 | 12.1 | 10.7 |
| 2018–19 | 12.9 | 10.7 |
| 2019–20 | 14.5 | 10.9 |
| 2020–21 | 12 | 10.8 |
| 2021–22 | 14.5 | 10.9 |
| 2022–23 | 15 | 11.1 |
| 2023–24 | 15.2 | 11.4 |
| 2024–25 | 14.1 | 11.2 |
| 2025–26 | 12.5 | 11.2 |
Source: Ontario Financing Authority.
Chart 4.10: Average Unrestricted Liquid Reserve Levels
Average unrestricted liquid reserves averaged $44.0 billion in 2025–26.
| Year | Average Unrestricted Liquid Reserve Levels ($ Billions) |
|---|---|
| 2009–10 | 14.4 |
| 2010–11 | 19.4 |
| 2011–12 | 20.2 |
| 2012–13 | 23.3 |
| 2013–14 | 24.9 |
| 2014–15 | 23.6 |
| 2015–16 | 21.7 |
| 2016–17 | 21.1 |
| 2017–18 | 30.1 |
| 2018–19 | 32.7 |
| 2019–20 | 32.3 |
| 2020–21 | 46.2 |
| 2021–22 | 47.2 |
| 2022–23 | 36.2 |
| 2023–24 | 46.8 |
| 2024–25 | 41.9 |
| 2025–26 | 44.0 |
Source: Ontario Financing Authority.
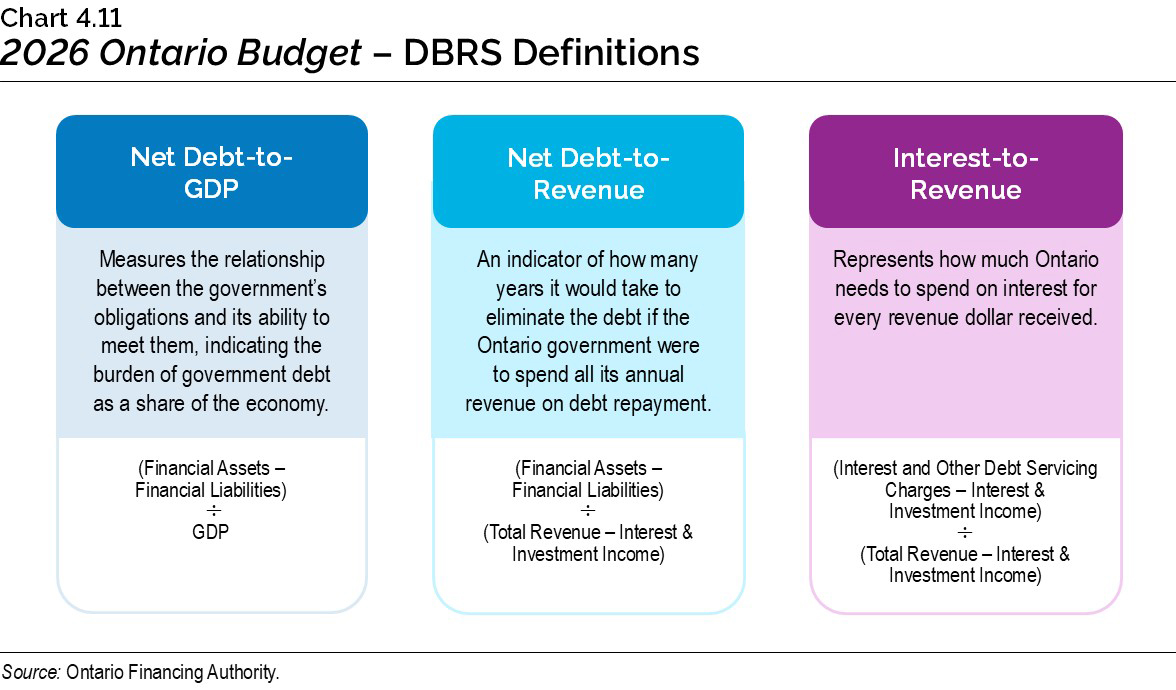
Chart 4.11: 2026 Ontario Budget – DBRS Definitions
This chart describes the three DBRS definitions and how they are calculated.
Net Debt-to-GDP measures the relationship between the government’s obligations and its ability to meet them, indicating the burden of government debt as a share of the economy. It is calculated by (Financial Assets − Financial Liabilities) ÷ GDP.
Net Debt-to-Revenue is an indicator of how many years it would take to eliminate the debt if the Ontario government were to spend all its annual revenue on debt repayment. It is calculated by (Financial Assets − Financial Liabilities) ÷ (Total Revenue − Interest & Investment Income).
Interest-to-Revenue represents how much Ontario needs to spend on interest for every revenue dollar received. It is calculated by (Interest and Other Debt Servicing Charges − Interest & Investment Income) ÷ (Total Revenue − Interest & Investment Income).
Source: Ontario Financing Authority.
Chart 4.12: Net Debt-to-GDP
Ontario’s net debt-to-GDP ratio is forecast at 36.8 per cent in 2025–26.
| Year | Planning Projection (%) |
Faster Growth Scenario (%) |
Slower Growth Scenario (%) |
|---|---|---|---|
| 1990–91 | 13.4 | – | – |
| 1991–92 | 17.1 | – | – |
| 1992–93 | 21.1 | – | – |
| 1993–94 | 26.6 | – | – |
| 1994–95 | 28.3 | – | – |
| 1995–96 | 30.1 | – | – |
| 1996–97 | 31.2 | – | – |
| 1997–98 | 30.5 | – | – |
| 1998–99 | 29.4 | – | – |
| 1999–00 | 32.1 | – | – |
| 2000–01 | 29.3 | – | – |
| 2001–02 | 28.2 | – | – |
| 2002–03 | 26.8 | – | – |
| 2003–04 | 27.5 | – | – |
| 2004–05 | 26.8 | – | – |
| 2005–06 | 27.8 | – | – |
| 2006–07 | 27.1 | – | – |
| 2007–08 | 26.6 | – | – |
| 2008–09 | 27.8 | – | – |
| 2009–10 | 32.3 | – | – |
| 2010–11 | 34.5 | – | – |
| 2011–12 | 36.6 | – | – |
| 2012–13 | 38.2 | – | – |
| 2013–14 | 39.7 | – | – |
| 2014–15 | 40.5 | – | – |
| 2015–16 | 40.3 | – | – |
| 2016–17 | 39.7 | – | – |
| 2017–18 | 39.2 | – | – |
| 2018–19 | 39.3 | – | – |
| 2019–20 | 39.5 | – | – |
| 2020–21 | 42.6 | – | – |
| 2021–22 | 39.5 | – | – |
| 2022–23 | 37.5 | – | – |
| 2023–24 | 36.0 | – | – |
| 2024–25 | 35.7 | – | – |
| 2025–26 | 36.8 | – | – |
| 2026–27 | 37.7 | 37.2 | 38.3 |
| 2027–28 | 38.5 | 37.3 | 40.0 |
| 2028–29 | 38.2 | 36.4 | 40.4 |
Note: See Chapter 3: Ontario’s Fiscal Plan and Outlook for details on the Faster Growth and Slower Growth scenarios.
Sources: Statistics Canada and Ontario Ministry of Finance.
Chart 4.13: Net Debt-to-Revenue (formerly Net Debt-to-Operating Revenue)
Ontario’s net debt-to-revenue ratio is forecast to be 204 per cent in 2025–26.
| Year | Planning Projection (%) |
Faster Growth Scenario (%) |
Slower Growth Scenario (%) |
|---|---|---|---|
| 1990–91 | 78 | – | – |
| 1991–92 | 104 | – | – |
| 1992–93 | 126 | – | – |
| 1993–94 | 157 | – | – |
| 1994–95 | 168 | – | – |
| 1995–96 | 176 | – | – |
| 1996–97 | 187 | – | – |
| 1997–98 | 184 | – | – |
| 1998–99 | 182 | – | – |
| 1999–00 | 189 | – | – |
| 2000–01 | 183 | – | – |
| 2001–02 | 183 | – | – |
| 2002–03 | 177 | – | – |
| 2003–04 | 188 | – | – |
| 2004–05 | 170 | – | – |
| 2005–06 | 162 | – | – |
| 2006–07 | 153 | – | – |
| 2007–08 | 146 | – | – |
| 2008–09 | 164 | – | – |
| 2009–10 | 189 | – | – |
| 2010–11 | 192 | – | – |
| 2011–12 | 208 | – | – |
| 2012–13 | 216 | – | – |
| 2013–14 | 225 | – | – |
| 2014–15 | 234 | – | – |
| 2015–16 | 225 | – | – |
| 2016–17 | 223 | – | – |
| 2017–18 | 214 | – | – |
| 2018–19 | 220 | – | – |
| 2019–20 | 226 | – | – |
| 2020–21 | 226 | – | – |
| 2021–22 | 207 | – | – |
| 2022–23 | 207 | – | – |
| 2023–24 | 199 | – | – |
| 2024–25 | 191 | – | – |
| 2025–26 | 204 | – | – |
| 2026–27 | 211 | 207 | 215 |
| 2027–28 | 213 | 205 | 223 |
| 2028–29 | 210 | 198 | 224 |
Note: See Chapter 3: Ontario’s Fiscal Plan and Outlook for details on the Faster Growth and Slower Growth scenarios.
Sources: Public Accounts of Ontario (1990–1991 to 2024–2025) and Ontario Financing Authority.
Chart 4.14: Interest-to-Revenue (formerly Net Interest-to-Operating Revenue)
Ontario’s interest-to-revenue ratio is forecast to be 6.3 per cent in 2025–26.
| Year | Planning Projection (%) |
Faster Growth Scenario (%) |
Slower Growth Scenario (%) |
|---|---|---|---|
| 1990–91 | 7.7 | – | – |
| 1991–92 | 8.8 | – | – |
| 1992–93 | 10.8 | – | – |
| 1993–94 | 13.9 | – | – |
| 1994–95 | 14.5 | – | – |
| 1995–96 | 14.6 | – | – |
| 1996–97 | 14.8 | – | – |
| 1997–98 | 14.2 | – | – |
| 1998–99 | 14.3 | – | – |
| 1999–00 | 15.5 | – | – |
| 2000–01 | 15.0 | – | – |
| 2001–02 | 14.2 | – | – |
| 2002–03 | 12.9 | – | – |
| 2003–04 | 12.9 | – | – |
| 2004–05 | 11.1 | – | – |
| 2005–06 | 9.7 | – | – |
| 2006–07 | 8.9 | – | – |
| 2007–08 | 8.4 | – | – |
| 2008–09 | 8.7 | – | – |
| 2009–10 | 8.9 | – | – |
| 2010–11 | 8.8 | – | – |
| 2011–12 | 9.1 | – | – |
| 2012–13 | 9.0 | – | – |
| 2013–14 | 9.1 | – | – |
| 2014–15 | 8.9 | – | – |
| 2015–16 | 8.5 | – | – |
| 2016–17 | 8.3 | – | – |
| 2017–18 | 7.9 | – | – |
| 2018–19 | 8.1 | – | – |
| 2019–20 | 8.0 | – | – |
| 2020–21 | 7.5 | – | – |
| 2021–22 | 6.8 | – | – |
| 2022–23 | 6.4 | – | – |
| 2023–24 | 5.5 | – | – |
| 2024–25 | 5.5 | – | – |
| 2025–26 | 6.3 | – | – |
| 2026–27 | 6.7 | 6.6 | 6.8 |
| 2027–28 | 6.9 | 6.7 | 7.2 |
| 2028–29 | 7.1 | 6.7 | 7.6 |
Note: See Chapter 3: Ontario’s Fiscal Plan and Outlook for details on the Faster Growth and Slower Growth scenarios.
Sources: Public Accounts of Ontario (1990–1991 to 2024–2025) and Ontario Financing Authority.