Introduction
Ontario, like other jurisdictions around the world, continues to navigate significant economic challenges amid a heightened climate of uncertainty. The global environment is rapidly evolving, driving shifts across the economy.
In this context, it is more important than ever for the government to make prudent, well‑considered decisions that support ongoing investments in key public services, job creation and the province’s long-term prosperity, while preserving the fiscal flexibility needed to respond to changing conditions.
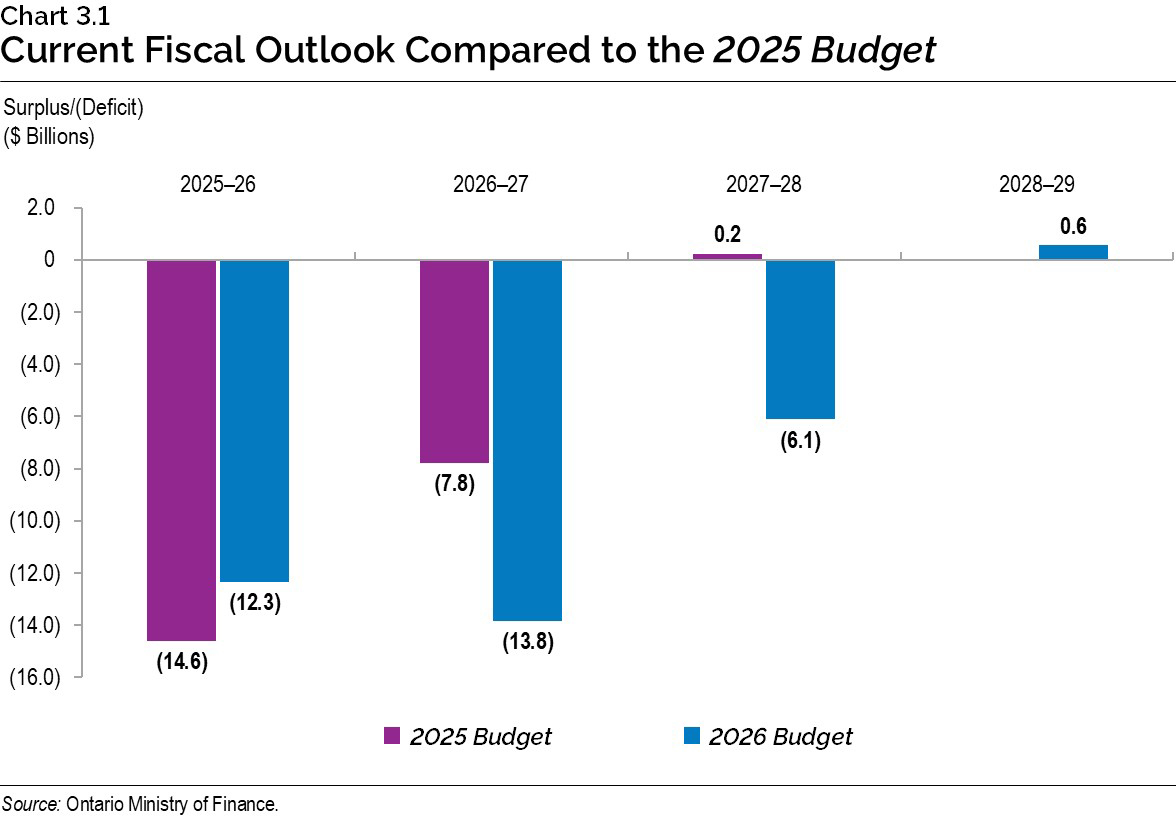
Although economic and fiscal pressures are expected to weigh on the fiscal outlook relative to the projections presented in the 2025 Budget, the 2026 Budget plan remains prudent and fiscally responsible. In 2025–26, Ontario is projecting a deficit of $12.3 billion. Over the medium term, the government is projecting deficits of $13.8 billion in 2026–27 and $6.1 billion in 2027–28 before planning for a surplus of $0.6 billion in 2028–29.
| Item | Actual 2024–25 |
Interim 2025–26 |
Medium-Term Outlook 2026–27 |
Medium-Term Outlook 2027–28 |
Medium-Term Outlook 2028–29 |
|---|---|---|---|---|---|
| Revenue | 226.2 | 226.6 | 231.9 | 243.4 | 254.1 |
| Expense — Programs | 212.1 | 222.4 | 227.0 | 229.0 | 231.3 |
| Expense — Interest and Other Debt Servicing Charges | 15.1 | 16.0 | 17.2 | 18.6 | 19.7 |
| Total Expense | 227.3 | 238.4 | 244.2 | 247.5 | 251.1 |
| Surplus/(Deficit) Before Reserve | (1.1) | (11.8) | (12.3) | (4.1) | 3.1 |
| Reserve | – | 0.5 | 1.5 | 2.0 | 2.5 |
| Surplus/(Deficit) | (1.1) | (12.3) | (13.8) | (6.1) | 0.6 |
| Net Debt as a Per Cent of GDP1 | 35.7% | 36.8% | 37.7% | 38.5% | 38.2% |
| Net Debt as a Per Cent of Revenue2 | 191.2% | 204.4% | 210.9% | 212.9% | 209.8% |
| Interest as a Per Cent of Revenue | 5.5% | 6.3% | 6.7% | 6.9% | 7.1% |
Table 3.1 footnotes:
[1], [2] For 2026–27 and future years, Net Debt reflects financial assets less financial liabilities and is aligned with Net Financial Liabilities, as will be reported in the Public Accounts of Ontario 2026–2027. See the Debt Burden Reduction Strategy in Chapter 4: Borrowing and Debt Management for additional details on the calculations supporting the ratios.
Note: Numbers may not add due to rounding.
Sources: Ontario Treasury Board Secretariat and Ontario Ministry of Finance.
2025–26 Interim Fiscal Performance
Ontario’s 2025–26 deficit is projected to be $12.3 billion, which is an improvement of $2.3 billion compared to the outlook published in the 2025 Budget.
Total revenues in 2025–26 are projected to be $226.6 billion, which is $6.7 billion higher than forecast in the 2025 Budget, mainly reflecting increases in taxation revenue, net income from Government Business Enterprises and other non‑tax revenue.
Program expense is projected to be $222.4 billion, $6.1 billion higher than the 2025 Budget forecast, primarily due to investments in health, postsecondary education, social services and justice.
Ontario is forecast to pay $16.0 billion in Interest and Other Debt Servicing Charges in 2025–26, lower than the $16.2 billion forecast in the 2025 Budget. At 36.8 per cent, the net debt-to-GDP ratio in 2025–26 is forecast to be 1.1 percentage points lower than in the 2025 Budget.
The 2025 Budget also included a $2.0 billion reserve in 2025–26 to protect the fiscal plan against unforeseen adverse changes in Ontario’s revenue and expense forecasts. The reserve has been drawn down to $0.5 billion at interim, which could be used to address any unforeseen events that could arise before year-end.
| Item | 2025 Budget |
Interim 2025–26 |
In-Year Change |
|---|---|---|---|
| Revenue | 219.9 | 226.6 | 6.7 |
| Expense — Programs | 216.3 | 222.4 | 6.1 |
| Expense — Interest and Other Debt Servicing Charges | 16.2 | 16.0 | (0.2) |
| Total Expense | 232.5 | 238.4 | 5.9 |
| Surplus/(Deficit) Before Reserve | (12.6) | (11.8) | 0.8 |
| Reserve | 2.0 | 0.5 | (1.5) |
| Surplus/(Deficit) | (14.6) | (12.3) | 2.3 |
Table 3.2 footnotes:
Note: Numbers may not add due to rounding.
Sources: Ontario Treasury Board Secretariat and Ontario Ministry of Finance.
Revenue Update
The 2025–26 total revenue outlook is $6.7 billion higher than projected in the 2025 Budget. Since the release of the 2025 Ontario Economic Outlook and Fiscal Review, total revenue is projected to increase by $3.5 billion, mainly due to increases in taxation revenue and net income from Government Business Enterprises.
| Item | Interim |
|---|---|
| 2025 Budget Total Revenue1 | 219,887 |
| Revenue Changes in the 2025–26 First Quarter Finances | – |
| Revenue Changes in the 2025 Ontario Economic Outlook and Fiscal Review | 3,219 |
| Revenue Changes in the 2025–26 Third Quarter Finances | 577 |
| Revenue Changes Since the 2025–26 Third Quarter Finances — Personal Income Tax | 2,632 |
| Revenue Changes Since the 2025–26 Third Quarter Finances — Corporations Tax | 637 |
| Revenue Changes Since the 2025–26 Third Quarter Finances — Sales Tax | (894) |
| Revenue Changes Since the 2025–26 Third Quarter Finances — All Other Taxation | 12 |
| Revenue Changes Since the 2025–26 Third Quarter Finances — Total Taxation Revenue | 2,387 |
| Revenue Changes Since the 2025–26 Third Quarter Finances — Government of Canada Transfers | (11) |
| Revenue Changes Since the 2025–26 Third Quarter Finances — Government Business Enterprises | 413 |
| Revenue Changes Since the 2025–26 Third Quarter Finances — Other Non-Tax Revenue | 138 |
| Total Revenue Changes Since the 2025–26 Third Quarter Finances | 2,926 |
| Total Revenue Changes Since the 2025 Budget | 6,721 |
| 2026 Budget Total Revenue Outlook | 226,609 |
Table 3.3 footnotes:
[1] Beginning in the 2025 Budget, the Total Revenue, Interest and Other Debt Servicing Charges (IOD), and Total Expense figures for all years have been restated to report interest and investment income as part of revenue and separate from IOD. These changes are fiscally neutral.
Note: Numbers may not add due to rounding.
Source: Ontario Ministry of Finance.
The forecast for Total Taxation Revenue has increased by $2.4 billion compared to the 2025–26 Third Quarter Finances. Key changes in the taxation revenue outlook include:
- Personal Income Tax revenue projections increased by $2.6 billion, mainly due to stronger‑than‑expected economic growth in 2025, including robust equity market performance supporting stronger-than-anticipated growth in capital gains and dividend income;
- Corporations Tax revenue projections increased by $0.6 billion, mainly due to higher‑than‑anticipated corporate profit growth in 2025 and the processing of 2024 and prior year tax returns;
- Sales Tax revenue projections decreased by $0.9 billion, mainly reflecting lower official federal entitlement estimates for 2025 and prior years; and
- Projections for revenue from All Other Taxation combined increased by $12 million, mainly due to higher Land Transfer Tax and Employer Health Tax, partially offset by lower Ontario Health Premium revenue.
Government of Canada Transfers projections decreased by $11 million, mainly due to a reprofiling of funding from 2025–26 to 2026–27 under the Canada-wide Early Learning and Child Care Agreement and the Investing in Canada Infrastructure Program. This decrease is partially offset by higher direct transfers to Broader Public Sector organizations.
Net Income from Government Business Enterprises projections increased by $413 million, driven mainly by a higher net income forecast for Ontario Power Generation, reflecting stronger projected Ontario Nuclear Funds’ realized gains. This increase is partially offset by lower revenue from the Ontario Lottery and Gaming Corporation and the Liquor Control Board of Ontario.
Other Non-Tax Revenue projections increased by $138 million, mainly reflecting higher miscellaneous other non-tax revenue reported by ministries and consolidated government organizations. This is partially offset by lower net third-party revenue from the broader public sector, sales and rentals and interest and investment income.
Expense Update
Since the release of the 2025 Budget, the government has made additional investments to support critical public services. The 2025–26 total expense outlook is $238.4 billion, $5.9 billion higher than the 2025 Budget. Since the release of the most recent update as part of the 2025–26 Third Quarter Finances, the total program expense projection has increased by $2.5 billion, primarily due to higher-than-forecasted ministry spending in health, social services and justice, partially offset by the Contingency Fund.
| Item | Interim |
|---|---|
| 2025 Budget Total Expense1 | 232,497 |
| Total Expense Changes in the 2025–26 First Quarter Finances | – |
| Total Expense Changes in the 2025 Ontario Economic Outlook and Fiscal Review | 2,130 |
| Total Expense Changes in the 2025–26 Third Quarter Finances | 1,480 |
| Program Expense Changes Since the 2025–26 Third Quarter Finances — Health Sector | 5,658 |
| Program Expense Changes Since the 2025–26 Third Quarter Finances — Education Sector2 | (462) |
| Program Expense Changes Since the 2025–26 Third Quarter Finances — Postsecondary Education Sector | (385) |
| Program Expense Changes Since the 2025–26 Third Quarter Finances — Children, Community and Social Services Sector | 1,100 |
| Program Expense Changes Since the 2025–26 Third Quarter Finances — Justice Sector | 582 |
| Program Expense Changes Since the 2025–26 Third Quarter Finances — Other Programs | (4,036) |
| Total Program Expense Changes Since the 2025–26 Third Quarter Finances | 2,458 |
| Interest and Other Debt Servicing Charges Change Since the 2025–26 Third Quarter Finances | (130) |
| Total Expense Changes Since the 2025–26 Third Quarter Finances | 2,328 |
| Total Expense Changes Since the 2025 Budget | 5,938 |
| 2026 Budget Total Expense Outlook | 238,434 |
Table 3.4 footnotes:
[1] Beginning in the 2025 Budget, the Total Revenue, Interest and Other Debt Servicing Charges (IOD), and Total Expense figures for all years have been restated to report interest and investment income as part of revenue and separate from IOD. These changes are fiscally neutral.
[2] Excludes Teachers’ Pension Plan. Teachers’ Pension Plan expense is included in Other Programs.
Note: Numbers may not add due to rounding.
Sources: Ontario Treasury Board Secretariat and Ontario Ministry of Finance.
The following program expense changes are projected since the release of the 2025–26 Third Quarter Finances:
- Health sector expense is projected to be $5,658 million higher, primarily to address pressures related to the delivery of health care and to address growing demand for other health services, such as utilization-driven programs like the Ontario Health Insurance Plan and Ontario Public Drug Programs.
- Education sector expense is projected to be $462 million lower, mainly due to lower‑than‑projected student enrolment and school board expenditures.
- Postsecondary Education sector expense is projected to be $385 million lower, mainly due to lower-than-forecasted spending in the college sector.
- Children, Community and Social Services sector expense is projected to be $1,100 million higher, mostly due to demand for social assistance programs.
- Justice sector expense is projected to be $582 million higher, mainly due to obligations under the Crown Liability and Proceedings Act, 2019 and investments in essential service delivery, including the Ontario Provincial Police, courts, corrections, forensic sciences, coroner and forensic pathology services.
- Other Programs expense is projected to be a net $4,036 million lower, primarily due to lower‑than‑projected spending across various ministry infrastructure programs, including the Community Sport and Recreation Infrastructure Fund, Transit-Oriented Communities program, high-speed internet access, as well as the drawdown of the Contingency Fund to offset increases in other sectors.
Interest and Other Debt Servicing Charges expense is projected to be $130 million lower due to an efficient debt management strategy.
Prudence in 2025–26
The Contingency Fund is maintained to help mitigate expense risks that may adversely affect Ontario’s fiscal performance. For the remainder of 2025–26, the Contingency Fund had a remaining balance of $100 million, which was made available to offset additional expenses that may materialize before the end of the fiscal year.
The 2025 Budget included a reserve of $2.0 billion in 2025–26, which has been drawn down to $0.5 billion at interim to address any unforeseen events that could arise before year-end.
Medium-Term Fiscal Plan
The government is projecting deficits of $13.8 billion in 2026–27, $6.1 billion in 2027–28, and a surplus of $0.6 billion in 2028–29.
Medium-Term Revenue Outlook
Total revenue is projected to increase from $226.2 billion in 2024–25 to $254.1 billion in 2028–29, representing an average annual growth rate of 3.0 per cent. Projections over the medium term are higher compared to the 2025 Ontario Economic Outlook and Fiscal Review.
| Item | Actual 2024–25 |
Interim 2025–26 |
Medium-Term Outlook 2026–27 |
Medium-Term Outlook 2027–28 |
Medium-Term Outlook 2028–29 |
|---|---|---|---|---|---|
| Revenue — Personal Income Tax | 55.7 | 61.9 | 65.1 | 69.5 | 74.1 |
| Revenue — Sales Tax | 39.4 | 39.2 | 39.9 | 43.2 | 45.1 |
| Revenue — Corporations Tax | 27.8 | 27.6 | 28.6 | 30.6 | 32.5 |
| Revenue — Ontario Health Premium | 5.2 | 5.2 | 5.5 | 5.7 | 5.9 |
| Revenue — Education Property Tax | 5.9 | 5.9 | 6.0 | 6.0 | 6.1 |
| Revenue — All Other Taxes | 17.6 | 18.0 | 18.5 | 19.1 | 20.1 |
| Total Taxation Revenue | 151.5 | 158.0 | 163.6 | 174.1 | 183.8 |
| Government of Canada Transfers | 36.6 | 39.1 | 39.8 | 40.1 | 40.4 |
| Income from Government Business Enterprises | 7.5 | 7.3 | 6.5 | 6.8 | 7.3 |
| Other Non-Tax Revenue | 30.5 | 22.2 | 21.9 | 22.4 | 22.6 |
| Total Revenue | 226.2 | 226.6 | 231.9 | 243.4 | 254.1 |
Table 3.5 footnotes:
Note: Numbers may not add due to rounding.
Source: Ontario Ministry of Finance.
The forecast for Personal Income Tax revenues is driven by the economic outlook including compensation of employees. Personal Income Tax revenue is projected to grow at an average annual rate of 7.4 per cent between 2024–25 and 2028–29.
The forecast for Sales Tax revenue is driven by the projection for household consumption spending. Average growth in Sales Tax revenue is projected to be 3.5 per cent between 2024–25 and 2028–29.
The forecast for Corporations Tax revenue is driven by the projections of corporate profitability. Corporations Tax revenue is projected to grow at an average annual rate of 4.0 per cent between 2024–25 and 2028–29.
The primary driver of the forecast for Ontario Health Premium revenue is the outlook for growth in compensation of employees. Ontario Health Premium revenue is projected to grow at an average annual rate of 3.3 per cent between 2024–25 and 2028–29.
Education Property Tax revenue is based primarily on the outlook for growth in the property assessment base resulting from new construction activities.
Revenues from All Other Taxes are projected to increase at an average annual rate of 3.4 per cent between 2024–25 and 2028–29. This includes revenues from the Employer Health Tax; Land Transfer Tax; Beer, Wine and Spirits Taxes; and volume-based taxes such as the Gasoline Tax, Fuel Tax and Tobacco Tax.
The forecast for Government of Canada Transfers is largely based on existing federal–provincial funding agreements and formulas. Federal transfers are projected to increase at an average annual rate of 2.5 per cent between 2024–25 and 2028–29.
The outlook for Income from Government Business Enterprises (GBEs) is based on Ontario Ministry of Finance estimates of net income for Hydro One Ltd. (Hydro One) and projections provided by Ontario Power Generation (OPG), the Ontario Cannabis Store (OCS), the Liquor Control Board of Ontario (LCBO), the Ontario Lottery and Gaming Corporation (OLG) and iGaming Ontario (iGO). The net incomes of GBEs are projected to decrease at an average annual rate of 0.5 per cent from 2024–25 to 2028–29.
The forecast for Other Non-Tax Revenue is based on projections provided by government ministries and consolidated agencies. The outlook for Other Non-Tax Revenue is expected to decline at an average annual rate of 7.3 per cent between 2024–25 and 2028–29, mainly due to one-time revenue recorded in 2024–25 related to the court-approved settlement between tobacco companies and their creditors for smoking-related health care costs. The decline also reflects lower third-party revenues reported by the colleges sector, as well as lower revenue from interest and investment income.
Risks to the Revenue Outlook
There are a variety of risks to the economic planning assumptions underlying the revenue forecast, as outlined in Chapter 2: Economic Performance and Outlook. Table 3.6 highlights some key risks and sensitivities to the 2026–27 revenue forecast that could arise from unexpected changes in economic conditions. These are only estimates; actual results can vary. The risks identified are based on factors that are considered to have the most material impact on the largest revenue sources.
| Economic Factors | Revenue Sources | 2026–27 Sensitivities |
|---|---|---|
| Nominal GDP | Total Taxation Revenue | $1,250 million revenue change for each percentage point change in nominal GDP growth. This can vary significantly, depending on the composition and source of changes in GDP growth. |
| Compensation of Employees | Personal Income Tax; Ontario Health Premium; and Employer Health Tax | $786 million revenue change for each percentage point change in growth in compensation of employees. |
| Household Consumption Expenditures | Sales Tax | $310 million revenue change for each percentage point change in growth of household consumption expenditures. |
| Net Operating Surplus of Corporations | Corporations Tax | $263 million revenue change for each percentage point change in growth in net operating surplus of corporations. |
| Housing Resales and Resale Prices | Land Transfer Tax | $34 million revenue change for each percentage point change in growth of either housing resales or resale prices. |
| Ontario Population Share | Canada Health Transfer | $57 million revenue change for each one-tenth of a percentage point change in Ontario’s population share. |
| Ontario Population Share | Canada Social Transfer | $18 million revenue change for each one-tenth of a percentage point change in Ontario’s population share. |
Table 3.6 footnotes:
Source: Ontario Ministry of Finance.
Medium-Term Expense Outlook
The government is safeguarding Ontario’s economy and strengthening essential public services while maintaining fiscal responsibility. The province’s plan keeps program spending growth below that of revenue and includes contingency measures over the medium term to address unexpected challenges. The total expense outlook is projected to grow from $227.3 billion in 2024–25 to $251.1 billion in 2028–29.
Ontario’s program expense outlook is projected to grow from $212.1 billion in 2024–25 to $231.3 billion in 2028–29, for an average annual growth rate of 2.2 per cent.
| Item | Actual 2024–25 |
Interim 2025–26 |
Medium-Term Outlook 2026–27 |
Medium-Term Outlook 2027–28 |
Medium-Term Outlook 2028–29 |
|---|---|---|---|---|---|
| Programs — Health Sector | 91.3 | 97.8 | 101.2 | 103.5 | 106.7 |
| Programs — Education Sector1 | 38.3 | 40.5 | 40.8 | 41.2 | 41.5 |
| Programs — Postsecondary Education Sector | 14.2 | 14.0 | 14.0 | 12.8 | 12.7 |
| Programs — Children, Community and Social Services Sector | 20.5 | 21.5 | 21.4 | 21.6 | 21.7 |
| Programs — Justice Sector | 7.2 | 7.3 | 7.3 | 7.3 | 7.4 |
| Programs — Other Programs | 40.6 | 41.2 | 42.4 | 42.5 | 41.3 |
| Total Programs | 212.1 | 222.4 | 227.0 | 229.0 | 231.3 |
| Interest and Other Debt Servicing Charges | 15.1 | 16.0 | 17.2 | 18.6 | 19.7 |
| Total Expense | 227.3 | 238.4 | 244.2 | 247.5 | 251.1 |
Table 3.7 footnotes:
[1] Excludes Teachers’ Pension Plan. Teachers’ Pension Plan expense is included in Other Programs.
Note: Numbers may not add due to rounding.
Sources: Ontario Treasury Board Secretariat and Ontario Ministry of Finance.
Highlights of the changes to the program expense outlook over the medium term include the following:
- Health sector expense is projected to increase from $91.3 billion in 2024–25 to $106.7 billion in 2028–29. The growth is primarily due to investments to:
- Address the growing demands in the health sector, including utilization-driven programs like the Ontario Health Insurance Plan, investments to support home and community care services, funding for hospitals, cancer treatment services and other health care services to respond to Ontario’s aging population; and
- Maintain support for direct hours of care through staffing, as well as improve quality of care in the long-term care sector.
- Education sector expense is projected to increase from $38.3 billion in 2024–25 to $41.5 billion in 2028–29. Key investments include:
- Improving student achievement by strengthening foundational skills in reading, writing and mathematics so that all students get the skills and knowledge they need to be successful;
- Providing classrooms with resources and supplies so educators and students have access to high‑quality materials that help students reach their full potential; and
- Continuing to support access to child care for all families while strengthening early learning services and child care programs.
- Postsecondary Education sector expense is projected to decrease from $14.2 billion in 2024–25 to $12.7 billion in 2028–29. This reflects:
- Lower forecasted college sector spending, primarily in direct response to reduced third-party revenue from the federal policy to cap international student study permit applications; and
- Increased investments to support the Postsecondary Education sector’s long-term success and sustainability, as well as research and innovation to help drive economic growth.
- Children, Community and Social Services sector expense is projected to increase from $20.5 billion in 2024–25 to $21.7 billion in 2028–29. This is mainly due to:
- Annual inflation adjustments to core allowances for the Ontario Disability Support Program and the maximum monthly amount for the Assistance for Children with Severe Disabilities Program;
- Enhanced funding to expand access to core clinical services through the Ontario Autism Program in response to growing demand; and
- New investments to help community organizations manage rising operational costs, including agencies supporting individuals with special needs, developmental disabilities and survivors of gender‑based violence or human trafficking.
- Justice sector expense is projected to increase from $7.2 billion in 2024–25 to $7.4 billion in 2028–29. Investments in the sector support enhanced border security, the expansion and construction of new correctional institutions, public safety modernization initiatives and essential service delivery including First Nations policing, the Ontario Provincial Police, courts, corrections, animal welfare services, coroner and forensic pathology services.
- Other Programs expense is projected to increase from $40.6 billion in 2024–25 to $41.3 billion in 2028–29. Key changes include:
- Supporting industrial land development and investments in the critical minerals sector;
- Helping municipalities build housing-enabling infrastructure through the Municipal Housing Infrastructure Program; and
- Maintaining the Contingency Fund to help address emerging needs and risks to reflect a cautious approach to planning due to economic uncertainty.
The total expense outlook includes Interest and Other Debt Servicing Charges expense, which is projected to increase from $16.0 billion in 2025–26 to $19.7 billion in 2028–29.
Prudence Built into the Medium-Term Outlook
In keeping with sound fiscal planning practices, Ontario’s revenue outlook is based on prudent economic planning projections, as discussed in Chapter 2: Economic Performance and Outlook. Three external economic experts reviewed the Ontario Ministry of Finance’s economic assumptions and found them to be reasonable.1
With the ongoing challenges the province has faced due to U.S. tariff uncertainty, the government maintains a responsible and flexible fiscal plan to respond to these impacts as necessary.
In addition, the Contingency Fund is maintained to help mitigate expense risks that may adversely affect Ontario’s fiscal performance. The Contingency Fund in 2026–27 is set at $1.5 billion and increases further through the remainder of the medium‐term outlook, reflecting the government’s prudent and responsible fiscal planning.
Ontario incorporates prudence in the form of a reserve to protect the fiscal outlook against unforeseen adverse changes in Ontario’s revenue and expense, including those resulting from changes in Ontario’s economic performance.
The reserve has been set at $1.5 billion in 2026–27, $2.0 billion in 2027–28 and $2.5 billion in 2028–29. This reflects Ontario’s commitment to maintaining a prudent and flexible fiscal plan.
Risks to the Expense Outlook
Table 3.8 provides a summary of key expense risks and sensitivities that could result from unexpected changes in economic conditions and program demands. A change in these factors could affect total expense and the public sector, causing variances in the overall fiscal forecast. These sensitivities illustrate possible effects on the government’s key programs and can vary, depending on the nature and composition of potential risks.
| Program/Sector | 2026–27 Assumption | 2026–27 Sensitivities |
|---|---|---|
| Hospital | Annual growth up to 4 per cent. | One per cent change in hospital costs: approximately $280 million. |
| Home Care | Approximately 53 million hours of personal support services. | One per cent change in hours of personal support services: approximately $26 million. |
| Home Care | Approximately 12 million nursing and therapy visits and 2.5 million nursing shifts. | One per cent change in all nursing and therapy visits: approximately $16 million. |
| Elementary and Secondary Schools | Approximately 2.055 million average daily pupil enrolment. |
One per cent enrolment change: approximately $190 million. |
| Ontario Works | 305,452 average annual caseload. | One per cent caseload change: approximately $35 million. |
| Ontario Disability Support Program | 385,545 average annual caseload. | One per cent caseload change: approximately $69 million. |
| Interest and Other Debt Servicing Charges | Average cost of borrowing in 2026–27 is forecast to be 4.1 per cent. | In the first full year, the impact of a 100 basis-point change in borrowing rates: approximately $870 million. |
Table 3.8 footnotes:
Sources: Ontario Treasury Board Secretariat and Ontario Ministry of Finance.
Transparency and Risks
The government continues to be transparent about the state of Ontario’s finances. This principle is reflected in the Fiscal Sustainability, Transparency and Accountability Act, 2019, which stipulates that Ontario’s fiscal policy should be clearly articulated, and information about it should be readily available to the public without charge.
To ensure a reasonable and prudent economic forecast, the government’s key economic planning projections are set below the average of private-sector forecasts in each year. For 2026 onwards, the planning assumptions are set 0.1 percentage point below the private‐sector average.
While the planning assumptions for economic growth are reasonable and prudent, the Ontario Ministry of Finance has also developed Faster Growth and Slower Growth scenarios to provide greater transparency around a broader range of possible outcomes, amid heightened economic uncertainty.
As a matter of transparent fiscal management, financial pressures are monitored throughout the fiscal year by the Ontario Treasury Board Secretariat, with the goal of ensuring that robust and prudent methodologies are used to develop forecasts. Other important risk management tools include closely tracking the pace of implementation of initiatives and proactively identifying emerging program and policy risks. Comprehensive analysis of known pressures informs the government’s flexible fiscal planning processes, including the development of plans to mitigate and manage fiscal pressures and maintain adequate contingencies as part of medium-term fiscal projections to respond to uncertainty and risks.
In addition to the key demand sensitivities and economic risks to the fiscal plan, there are risks stemming from the government’s contingent liabilities. Whether future events will result in actual liabilities for the province is beyond the direct control of the government. For example, losses could result from legal settlements or a call on loan or funding guarantees. While a Contingency Fund is included in the fiscal plan to help mitigate the expense risks, these risks are not included in the province’s fiscal plan until there is certainty about the likelihood and costs of these future events. Provisions for losses that are likely to occur and can be reasonably estimated are expensed and reported as liabilities in Ontario’s financial statements. Any significant contingent liabilities related to the 2025–26 fiscal year will be disclosed as part of the Public Accounts of Ontario 2025–2026, to be released no later than September 27, 2026.
New Accounting Standards
The Public Sector Accounting Board (PSAB) has issued new standards for government financial reporting, Conceptual Framework for Financial Reporting in the Public Sector and Section PS 1202 Financial Statement Presentation (Conceptual Framework and Reporting Model), which will impact the Public Accounts of Ontario 2026–2027. Where reasonably determinable, the government has included the estimated presentation impact from the PSAB standards in this 2026 Budget.
Conceptual Framework and Reporting Model
The Conceptual Framework is a set of interrelated concepts underlying accounting and financial reporting standards and provides a foundation for formulating consistent financial reporting standards. The Reporting Model is based on the concepts in the Conceptual Framework and sets out the requirements for presentation of information in the financial statements.
The Reporting Model introduces changes to the presentation of information in the province’s financial statements. One key change is that the name, calculation and presentation of the current net debt indicator in the Consolidated Financial Statements will now be referred to as “net financial liabilities.” Net financial liabilities will exclude non-financial liabilities and externally restricted endowments held in perpetuity.
This change reflects a shift in presentation and reporting and is fiscally and economically neutral.
Details of Ontario’s Finances
| Item | Actual 2023–24 |
Actual 2024–25 |
Interim 2025–26 |
Plan 2026–27 |
|---|---|---|---|---|
| Taxation Revenue — Personal Income Tax | 50,773 | 55,701 | 61,900 | 65,108 |
| Taxation Revenue — Sales Tax | 39,864 | 39,363 | 39,201 | 39,871 |
| Taxation Revenue — Corporations Tax | 23,094 | 27,757 | 27,638 | 28,618 |
| Taxation Revenue — Education Property Tax | 5,810 | 5,887 | 5,937 | 5,981 |
| Taxation Revenue — Employer Health Tax | 8,581 | 9,061 | 9,507 | 9,812 |
| Taxation Revenue — Ontario Health Premium | 5,008 | 5,221 | 5,234 | 5,518 |
| Taxation Revenue — Gasoline Tax | 1,620 | 1,719 | 1,728 | 1,737 |
| Taxation Revenue — Land Transfer Tax | 3,538 | 3,736 | 3,444 | 3,785 |
| Taxation Revenue — Tobacco Tax | 813 | 693 | 715 | 602 |
| Taxation Revenue — Fuel Tax | 517 | 514 | 535 | 540 |
| Taxation Revenue — Beer, Wine and Spirits Taxes | 593 | 530 | 443 | 262 |
| Taxation Revenue — Electricity Payments in Lieu of Taxes2 | 529 | 54 | 529 | 350 |
| Taxation Revenue — Ontario Portion of the Federal Cannabis Excise Duty | 346 | 390 | 396 | 405 |
| Taxation Revenue — Other Taxes | 728 | 891 | 750 | 1,043 |
| Taxation Revenue — Total | 141,814 | 151,517 | 157,958 | 163,633 |
| Government of Canada Transfers — Canada Health Transfer | 19,286 | 20,363 | 21,393 | 22,406 |
| Government of Canada Transfers — Canada Social Transfer | 6,407 | 6,611 | 6,813 | 7,000 |
| Government of Canada Transfers — Equalization | 421 | 576 | 546 | 406 |
| Government of Canada Transfers — Infrastructure Programs | 609 | 1,124 | 929 | 1,104 |
| Government of Canada Transfers — Labour Market Programs | 1,149 | 921 | 955 | 1,064 |
| Government of Canada Transfers — Social Housing Agreement | 218 | 173 | 133 | 98 |
| Government of Canada Transfers — Other Federal Payments | 5,621 | 6,174 | 7,624 | 7,070 |
| Government of Canada Transfers — Direct Transfers to Broader Public Sector Organizations | 625 | 691 | 670 | 684 |
| Government of Canada Transfers — Total | 34,336 | 36,633 | 39,064 | 39,831 |
| Income from Government Business Enterprises — Liquor Control Board of Ontario | 2,574 | 2,171 | 1,793 | 1,896 |
| Income from Government Business Enterprises — Ontario Power Generation Inc./Hydro One Ltd. | 2,065 | 2,581 | 2,704 | 1,818 |
| Income from Government Business Enterprises — Ontario Lottery and Gaming Corporation | 2,368 | 2,247 | 2,344 | 2,219 |
| Income from Government Business Enterprises — Ontario Cannabis Store | 244 | 247 | 237 | 236 |
| Income from Government Business Enterprises — iGaming Ontario | 176 | 219 | 262 | 294 |
| Income from Government Business Enterprises — Total | 7,427 | 7,465 | 7,341 | 6,462 |
| Other Non-Tax Revenue — Fees, Donations and Other Revenues from Hospitals, School Boards and Colleges | 13,071 | 14,710 | 11,640 | 11,066 |
| Other Non-Tax Revenue — Vehicle and Driver Registration Fees | 1,222 | 1,232 | 1,196 | 1,251 |
| Other Non-Tax Revenue — Miscellaneous Other Non-Tax Revenue3 | 3,344 | 6,916 | 2,644 | 2,124 |
| Other Non-Tax Revenue — Other Fees and Licences | 1,618 | 1,862 | 1,816 | 2,010 |
| Other Non-Tax Revenue — Sales and Rentals | 1,566 | 1,630 | 1,711 | 2,069 |
| Other Non-Tax Revenue — Reimbursements | 1,131 | 1,073 | 1,020 | 1,278 |
| Other Non-Tax Revenue — Royalties | 320 | 297 | 301 | 311 |
| Other Non-Tax Revenue — Power Supply Contract Recoveries | 41 | 40 | 43 | 42 |
| Other Non-Tax Revenue — Interest and Investment Income | 3,085 | 2,786 | 1,875 | 1,779 |
| Other Non-Tax Revenue — Total | 25,398 | 30,546 | 22,246 | 21,930 |
| Total Revenue | 208,975 | 226,161 | 226,609 | 231,856 |
Table 3.9 footnotes:
[1] Actual results for 2023–24 are restated to present an accounting policy change implemented in the Public Accounts of Ontario 2024–2025 regarding the calculation of accrued Corporations Tax Revenue.
[2] The 2024–25 figure is net of a $343 million adjustment, reflecting the cumulative impact of the Ontario Electricity Financial Corporation’s change in reporting Electricity Payments-In-Lieu of Taxes revenue for past years prior to 2024–25, moving from the previous instalment-based method to a tax assessment-based approach.
[3] Revenue in 2024–25 reflects the accounting for Ontario’s compensation for smoking-related health care costs under a court-approved settlement between tobacco companies and their creditors.
Note: Numbers may not add due to rounding.
Source: Ontario Ministry of Finance.
| Ministry Expense | Actual 2023–24 |
Actual 2024–25 |
Interim 2025–26 |
Plan 2026–27 |
|---|---|---|---|---|
| Agriculture, Food and Agribusiness (Base) | 331 | 330 | 340 | 320.9 |
| Agriculture, Food and Agribusiness — Demand-Driven Risk Management and Time-Limited Programs | 601 | 569 | 784 | 710.3 |
| Agriculture, Food and Agribusiness (Total) | 932 | 899 | 1,124 | 1,031.2 |
| Attorney General (Base) | 2,086 | 2,274 | 2,426 | 2,428.8 |
| Attorney General — Statutory Appropriations — Crown Liability and Proceedings Act, 2019 | 27 | 602 | 109 | – |
| Attorney General — Bad Debt Expense | 22 | 18 | 18 | 5.3 |
| Attorney General (Total) | 2,135 | 2,894 | 2,553 | 2,434.1 |
| Board of Internal Economy (Total) | 299 | 486 | 399 | 399.2 |
| Children, Community and Social Services (Total) | 19,282 | 20,549 | 21,459 | 21,425.5 |
| Citizenship and Multiculturalism (Base) | 68 | 86 | 95 | 83.0 |
| Citizenship and Multiculturalism — Time-Limited Investments | 14 | – | – | – |
| Citizenship and Multiculturalism (Total) | 82 | 86 | 95 | 83.0 |
| Colleges, Universities, Research Excellence and Security (Base) | 11,934 | 12,285 | 11,111 | 11,512.4 |
| Colleges, Universities, Research Excellence and Security — Student Financial Assistance | 1,316 | 1,883 | 2,919 | 2,448.4 |
| Colleges, Universities, Research Excellence and Security (Total) | 13,251 | 14,167 | 14,030 | 13,960.8 |
| Economic Development, Job Creation and Trade (Base) | 200 | 244 | 214 | 210.5 |
| Economic Development, Job Creation and Trade — Tax Credits for Business Investment and Research and Development2 | 537 | 567 | 703 | 758.3 |
| Economic Development, Job Creation and Trade — Tax Credits for Business Investment and Research and Development — Amounts Related to Prior Years | 18 | 42 | 82 | – |
| Economic Development, Job Creation and Trade — Time-Limited Investments | 513 | 873 | 959 | 950.3 |
| Economic Development, Job Creation and Trade (Total) | 1,268 | 1,726 | 1,959 | 1,919.1 |
| Education (Base) | 37,132 | 38,348 | 40,526 | 40,762.1 |
| Education — Teachers’ Pension Plan | 1,652 | 1,684 | 2,171 | 1,787.0 |
| Education (Total) | 38,784 | 40,032 | 42,697 | 42,549.1 |
| Emergency Preparedness and Response (Base) | 40 | 47 | 65 | 69.9 |
| Emergency Preparedness and Response — First Nations Emergency Evacuations on behalf of Indigenous Services Canada | 11 | 0 | 227 | – |
| Emergency Preparedness and Response (Total) | 52 | 47 | 292 | 69.9 |
| Energy and Mines (Base) | 527 | 540 | 666 | 701.1 |
| Energy and Mines — Electricity Cost Relief Programs | 5,996 | 6,385 | 6,931 | 6,913.1 |
| Energy and Mines — Accounting Adjustments for Contaminated Sites | 369 | 24 | 62 | – |
| Energy and Mines — High-Speed Internet | 110 | 491 | 362 | 351.1 |
| Energy and Mines — Time-Limited Investments | – | 114 | 73 | 89.8 |
| Energy and Mines (Total) | 7,003 | 7,554 | 8,094 | 8,055.0 |
| Environment, Conservation and Parks (Base) | 815 | 853 | 1,089 | 1,191.2 |
| Environment, Conservation and Parks — Accounting Adjustment for Contaminated Sites | 84 | 9 | – | – |
| Environment, Conservation and Parks (Total) | 899 | 862 | 1,089 | 1,191.2 |
| Executive Offices (Total) | 69 | 74 | 82 | 82.6 |
| Finance (Base) | 903 | 1,150 | 1,216 | 1,072.1 |
| Finance — Investment Management Corporation of Ontario | 300 | 307 | 320 | 321.7 |
| Finance — Ontario Municipal Partnership Fund | 501 | 514 | 563 | 600.0 |
| Finance — Temporary and Other Local Assistance | 68 | 21 | 17 | 17.7 |
| Finance — Power Supply Contract Costs | 41 | 40 | 43 | 42.5 |
| Finance — Time-Limited Investments | 89 | 2,947 | 11 | – |
| Finance (Total) | 1,902 | 4,979 | 2,169 | 2,053.9 |
| Francophone Affairs (Base) | 8 | 8 | 9 | 8.9 |
| Francophone Affairs — Time-Limited Investments | – | 5 | 6 | 4.4 |
| Francophone Affairs (Total) | 8 | 13 | 15 | 13.3 |
| Health (Base) | 76,064 | 81,711 | 89,025 | 91,800.0 |
| Health — Adjustments for One-Time Extraordinary Costs3 | 1,241 | – | – | – |
| Health — Retroactive Compensation | – | 1,241 | – | – |
| Health (Total) | 77,304 | 82,952 | 89,025 | 91,800.0 |
| Indigenous Affairs and First Nations Economic Reconciliation (Base) | 133 | 124 | 167 | 179.0 |
| Indigenous Affairs and First Nations Economic Reconciliation — One-Time Investments Including Settlements | 17 | 846 | 13 | – |
| Indigenous Affairs and First Nations Economic Reconciliation (Total) | 150 | 970 | 180 | 179.0 |
| Infrastructure (Base) | 339 | 347 | 499 | 821.0 |
| Infrastructure — Federal−Provincial Infrastructure Programs | 401 | 368 | 176 | 121.6 |
| Infrastructure — Waterfront Toronto Revitalization (Port Lands Flood Protection) | 25 | 30 | 33 | 35.0 |
| Infrastructure — Municipal Infrastructure Program Investments | 389 | 639 | 1,169 | 600.0 |
| Infrastructure — Realty | 1,298 | 1,379 | 1,412 | 1,655.2 |
| Infrastructure (Total) | 2,451 | 2,762 | 3,289 | 3,232.7 |
| Labour, Immigration, Training and Skills Development (Base) | 253 | 267 | 289 | 242.0 |
| Labour, Immigration, Training and Skills Development — Co-operative Education Tax Credit4 | 116 | 93 | 88 | 98.1 |
| Labour, Immigration, Training and Skills Development — Demand-Driven Employment and Training Programs | 1,322 | 1,461 | 1,342 | 1,631.1 |
| Labour, Immigration, Training and Skills Development — Time-Limited Investments | 13 | – | – | – |
| Labour, Immigration, Training and Skills Development (Total) | 1,703 | 1,820 | 1,719 | 1,971.2 |
| Long-Term Care (Total)5 | 7,878 | 8,398 | 8,798 | 9,354.0 |
| Municipal Affairs and Housing (Base) | 796 | 781 | 792 | 803.1 |
| Municipal Affairs and Housing — Time-Limited Investments | 983 | 1,307 | 1,348 | 991.3 |
| Municipal Affairs and Housing (Total) | 1,780 | 2,088 | 2,139 | 1,794.3 |
| Natural Resources (Base) | 666 | 795 | 795 | 739.5 |
| Natural Resources — Emergency Forest Firefighting | 203 | 171 | 271 | 150.0 |
| Natural Resources — Accounting Adjustments for Contaminated Sites | 210 | 44 | – | – |
| Natural Resources (Total) | 1,079 | 1,010 | 1,065 | 889.5 |
| Northern Economic Development and Growth (Total) | 705 | 762 | 839 | 927.9 |
| Public and Business Service Delivery and Procurement (Base) | 1,526 | 1,675 | 1,742 | 1,522.1 |
| Public and Business Service Delivery and Procurement — Adjustments for One-Time Extraordinary Costs6 | 176 | – | – | – |
| Public and Business Service Delivery and Procurement (Total) | 1,702 | 1,675 | 1,742 | 1,522.1 |
| Rural Affairs (Total) | 6 | 7 | 12 | 19.3 |
| Seniors and Accessibility (Base) | 63 | 67 | 77 | 77.9 |
| Seniors and Accessibility — Time-Limited Investments | – | – | 10 | – |
| Seniors and Accessibility — Seniors Tax Credit | 108 | 96 | 86 | 100.2 |
| Seniors and Accessibility (Total) | 171 | 163 | 173 | 178.1 |
| Solicitor General (Total) | 3,832 | 4,261 | 4,782 | 4,832.3 |
| Sport (Base) | 53 | 57 | 64 | 63.9 |
| Sport — Time-Limited Investments | – | 4 | 101 | 221.2 |
| Sport (Total) | 53 | 60 | 165 | 285.1 |
| Tourism, Culture and Gaming (Base) | 895 | 908 | 1,028 | 1,201.8 |
| Tourism, Culture and Gaming — Ontario Cultural Media Tax Credits | 841 | 985 | 1,019 | 1,046.2 |
| Tourism, Culture and Gaming — Ontario Cultural Media Tax Credits — Amounts Related to Prior Years | 89 | 35 | 22 | – |
| Tourism, Culture and Gaming (Total) | 1,824 | 1,928 | 2,070 | 2,247.9 |
| Transportation (Base) | 6,266 | 6,928 | 7,955 | 8,073.1 |
| Transportation — Federal−Provincial Infrastructure Programs | 418 | 364 | 430 | 556.3 |
| Transportation — Time-Limited Investments | 675 | – | – | – |
| Transportation (Total) | 7,359 | 7,292 | 8,385 | 8,629.4 |
| Treasury Board Secretariat (Base) | 260 | 306 | 394 | 411.0 |
| Treasury Board Secretariat — Employee and Pensioner Benefits | 985 | 1,307 | 1,451 | 1,921.0 |
| Treasury Board Secretariat — Operating Contingency Fund | – | – | 100 | 1,350.0 |
| Treasury Board Secretariat — Capital Contingency Fund | – | – | – | 150.0 |
| Treasury Board Secretariat (Total) | 1,245 | 1,612 | 1,944 | 3,832.0 |
| Interest and Other Debt Servicing Charges7 | 14,461 | 15,122 | 16,047 | 17,237.2 |
| Total Expense | 209,668 | 227,251 | 238,434 | 244,200.0 |
Table 3.10 footnotes:
[1] Ministry expenses have been restated for reclassification and program transfer changes. These changes are fiscally neutral. The actual results are presented on a similar basis for consistency.
[2] Includes the estimated cost of tax credit claims for the Regional Opportunities Investment Tax Credit (ROITC), the Ontario Innovation Tax Credit, the Ontario Business-Research Institute Tax Credit and the Ontario Made Manufacturing Investment Tax Credit (OMMITC). Amounts in 2026–27 for the ROITC include the proposed wind down of the credit for expenditures incurred after 2026. The OMMITC costs starting in 2025–26 include the OMMITC enhancement but not the OMMITC expansion, the impacts of which are reported separately as a revenue decrease.
[3], [6] Includes extraordinary costs related to personal protective equipment in 2023–24.
[4] Amounts from 2023–24 to 2025–26 include tax credit amounts related to prior year adjustments.
[5] The Ontario Ministry of Long-Term Care total includes expenses incurred by Ontario Health and hospitals for funding for long-term care. These amounts will be consolidated in the total expense of the Ontario Ministry of Health, including $7.7 billion in 2025–26 Interim and $8.0 billion in 2026–27.
[7] Interest and Other Debt Servicing Charges is net of interest capitalized during construction of tangible capital assets of $978 million in 2023–24, $1,221 million in 2024–25, $1,309 million in 2025–26 and $1,261 in 2026–27.
Note: Numbers may not add due to rounding.
Sources: Ontario Treasury Board Secretariat and Ontario Ministry of Finance.
| Sector | Total Infrastructure Expenditures Interim1 2025–26 |
2026–27 Plan Investment in Capital Assets2 |
2026–27 Plan Transfers and Other Infrastructure Expenditures3 |
2026–27 Plan Total Infrastructure Expenditures |
|---|---|---|---|---|
| Transportation — Transit | 12,714 | 12,796 | 993 | 13,789 |
| Transportation — Provincial Highways | 4,128 | 5,001 | 390 | 5,391 |
| Transportation — Other Transportation, Property and Planning | 225 | 139 | 123 | 261 |
| Health — Hospitals | 4,458 | 5,579 | 22 | 5,602 |
| Health — Other Health | 645 | 183 | 1,229 | 1,413 |
| Education | 4,213 | 4,134 | 77 | 4,211 |
| Postsecondary Education — Colleges and Other | 831 | 670 | 32 | 701 |
| Postsecondary Education — Universities | 213 | – | 202 | 202 |
| Social | 601 | 40 | 543 | 583 |
| Justice | 629 | 1,006 | 96 | 1,102 |
| Other Sectors4 | 6,041 | 3,035 | 2,351 | 5,386 |
| Total Infrastructure Expenditures | 34,695 | 32,583 | 6,058 | 38,641 |
| Less: Other Partner Funding5 | 2,416 | 1,897 | – | 1,897 |
| Total6 | 32,279 | 30,686 | 6,058 | 36,744 |
Table 3.11 footnotes:
[1] Includes provincial investment in capital assets of $24.4 billion.
[2] Includes $1,261 million in interest capitalized during construction.
[3] Includes transfers to municipalities, universities, and non-consolidated agencies.
[4] Includes high-speed internet infrastructure, government administration, natural resources, and culture and tourism industries.
[5] Other Partner Funding refers to third-party investments primarily in hospitals, colleges and schools.
[6] Includes Federal–Municipal contributions to provincial infrastructure investments.
Note: Numbers may not add due to rounding.
Source: Ontario Treasury Board Secretariat.
| Item | 2017–18 | 2018–19 | 2019–20 | 2020–21 | 2021–22 | 2022–23 | 2023–24 | Actual 2024–25 |
Interim 2025–26 |
Plan 2026–27 |
|---|---|---|---|---|---|---|---|---|---|---|
| Revenue | 151,291 | 154,751 | 157,141 | 165,737 | 185,847 | 194,431 | 208,975 | 226,161 | 226,609 | 231,856 |
| Expense — Programs | 142,464 | 148,747 | 152,265 | 168,964 | 170,520 | 186,364 | 195,207 | 212,129 | 222,387 | 226,963 |
| Expense — Interest and Other Debt Servicing Charges3 | 12,506 | 13,332 | 13,471 | 13,063 | 13,302 | 13,935 | 14,461 | 15,122 | 16,047 | 17,237 |
| Total Expense | 154,969 | 162,079 | 165,736 | 182,027 | 183,822 | 200,299 | 209,668 | 227,251 | 238,434 | 244,200 |
| Reserve | – | – | – | – | – | – | – | – | 500 | 1,500 |
| Surplus/(Deficit) | (3,679) | (7,328) | (8,595) | (16,290) | 2,025 | (5,868) | (693) | (1,090) | (12,326) | (13,844) |
| Net Debt4 | 323,068 | 337,623 | 352,382 | 372,501 | 382,842 | 399,806 | 409,761 | 427,050 | 459,362 | 485,120 |
| Accumulated Deficit | 208,257 | 215,770 | 224,814 | 238,231 | 238,160 | 246,007 | 246,101 | 247,060 | 259,386 | 273,230 |
| Gross Domestic Product (GDP) at Market Prices | 824,979 | 860,103 | 893,224 | 874,354 | 970,146 | 1,065,260 | 1,138,592 | 1,197,020 | 1,246,922 | 1,286,664 |
| Primary Household Income | 541,501 | 567,484 | 593,065 | 592,514 | 642,144 | 689,842 | 740,660 | 797,253 | 831,850 | 862,616 |
| Population (000s) — July5 | 14,078 | 14,327 | 14,574 | 14,762 | 14,842 | 15,156 | 15,632 | 16,145 | 16,258 | 16,232 |
| Net Debt per Capita6 (Dollars) | 22,948 | 23,566 | 24,180 | 25,234 | 25,794 | 26,380 | 26,212 | 26,451 | 28,254 | 29,887 |
| Household Income per Capita (Dollars) | 38,463 | 39,610 | 40,695 | 40,138 | 43,264 | 45,517 | 47,380 | 49,381 | 51,165 | 53,143 |
| Net Debt as a Per Cent of Revenue7 | 214.4% | 219.5% | 225.6% | 225.8% | 206.8% | 207.3% | 199.0% | 191.2% | 204.4% | 210.9% |
| Interest as a Per Cent of Revenue | 7.9% | 8.1% | 8.0% | 7.5% | 6.8% | 6.4% | 5.5% | 5.5% | 6.3% | 6.7% |
| Net Debt as a Per Cent of GDP8 | 39.2% | 39.3% | 39.5% | 42.6% | 39.5% | 37.5% | 36.0% | 35.7% | 36.8% | 37.7% |
| Accumulated Deficit as a Per Cent of GDP | 25.2% | 25.1% | 25.2% | 27.2% | 24.5% | 23.1% | 21.6% | 20.6% | 20.8% | 21.2% |
Table 3.12 footnotes:
[1] Amounts reflect a change in pension expense that was calculated based on recommendations of the Independent Financial Commission of Inquiry, as described in Note 19 to the Consolidated Financial Statements, in Public Accounts of Ontario 2017–2018. Amounts for net debt and accumulated deficit also reflect this change.
[2] Beginning in the 2025 Budget, the Total Revenue, Interest and Other Debt Servicing Charges (IOD), and Total Expense figures for all years have been restated to report interest and investment income as part of revenue and separate from IOD. These changes are fiscally neutral.
[3] Interest and Other Debt Servicing Charges is net of interest capitalized during construction of tangible capital assets of $694 million in 2022–23, $978 million in 2023–24, $1,221 million in 2024–25, $1,309 million in 2025–26, and $1,261 million in 2026–27.
[4], [6], [7], [8] For 2026–27 and future years, Net Debt reflects financial assets less financial liabilities and is aligned with Net Financial Liabilities, as will be reported in the Public Accounts of Ontario 2026–2027. A one-year restatement will be provided in the Public Accounts of Ontario 2026–2027.
[5] Population figures are for July 1 of the fiscal year indicated (i.e., for 2025–26, the population on July 1, 2025, is shown).
Note: Numbers may not add due to rounding.
Sources: Statistics Canada, Ontario Treasury Board Secretariat and Ontario Ministry of Finance.
Chart Descriptions
Chart 3.1: Current Fiscal Outlook Compared to the 2025 Budget
The bar chart illustrates the fiscal outlook presented in the 2025 Budget compared to the current outlook in the 2026 Budget. The 2025 Budget projected deficits of $14.6 billion in 2025–26, $7.8 billion in 2026–27 and a surplus of $0.2 billion in 2027–28. With the release of the 2026 Budget, the projections have been revised to deficits of $12.3 billion in 2025–26, $13.8 billion in 2026–27, $6.1 billion in 2027–28, and a surplus of $0.6 billion in 2028–29.
Source: Ontario Ministry of Finance.
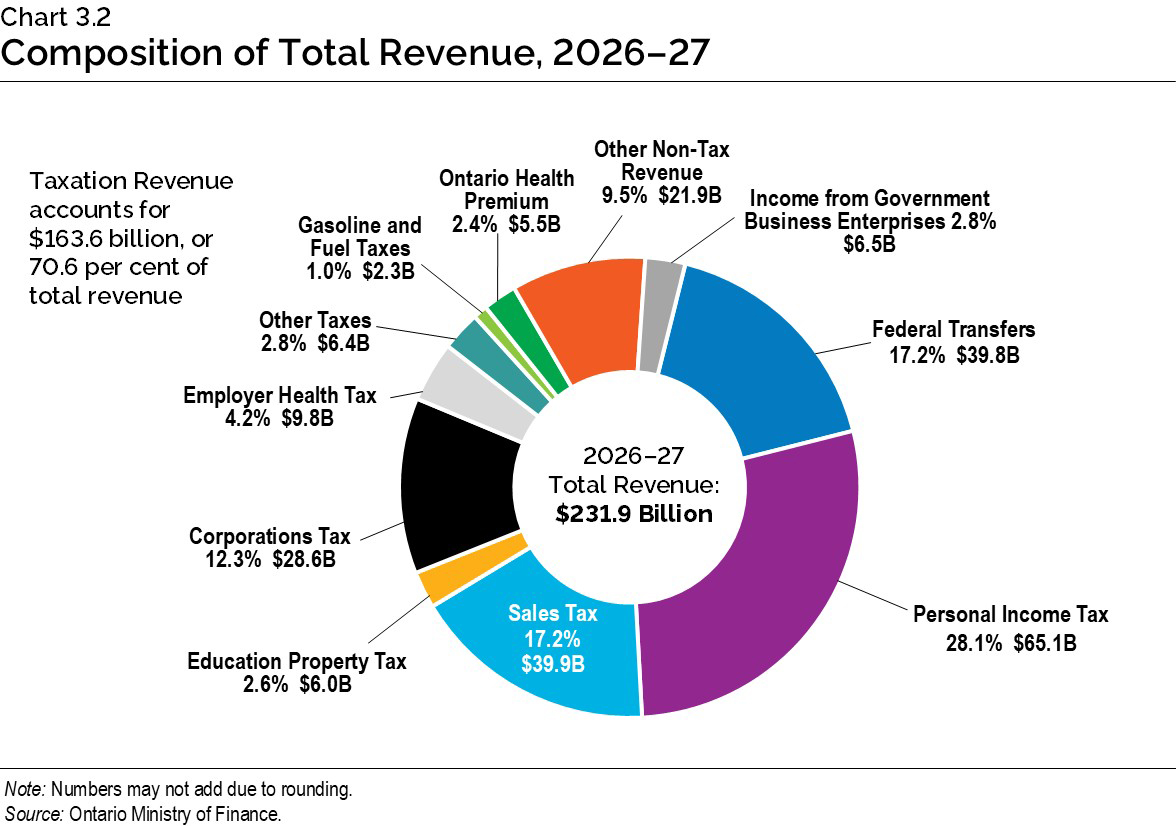
Chart 3.2: Composition of Total Revenue, 2026–27
The pie chart shows the composition of Ontario’s revenue in 2026–27, which is projected to be $231.9 billion. The largest taxation revenue source is Personal Income Tax revenue at $65.1 billion, accounting for 28.1 per cent of total revenue. This is followed by Sales Tax at $39.9 billion, or 17.2 per cent of total revenue; and Corporations Tax at $28.6 billion, or 12.3 per cent of total revenue. Other components of taxation revenue include Education Property Tax at $6.0 billion, or 2.6 per cent of total revenue; Employer Health Tax at $9.8 billion, or 4.2 per cent; Gasoline Tax and Fuel Tax at $2.3 billion, or 1.0 per cent; the Ontario Health Premium at $5.5 billion, or 2.4 per cent; and Other Taxes at $6.4 billion, or 2.8 per cent of total revenue.
Total taxation revenue accounts for $163.6 billion, or 70.6 per cent of total revenue.
The other major non-taxation sources of revenue are Federal Transfers of $39.8 billion, or 17.2 per cent of total revenue; Income from Government Business Enterprises at $6.5 billion, or 2.8 per cent of total revenue; and various Other Non-Tax Revenue at $21.9 billion, or 9.5 per cent of total revenue.
Note: Numbers may not add due to rounding.
Source: Ontario Ministry of Finance.
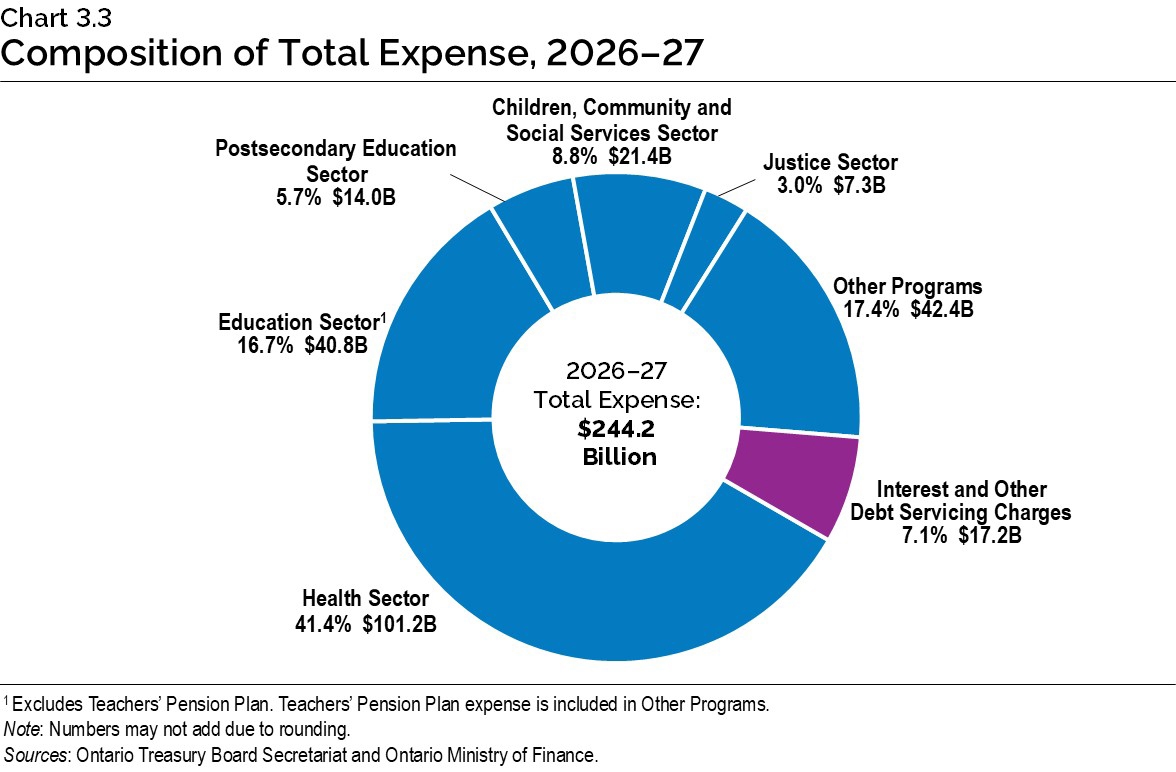
Chart 3.3: Composition of Total Expense, 2026–27
The pie chart shows the share of Ontario’s total expense and dollar amounts by sector in 2026–27. Total expense in 2026–27 is projected to be $244.2 billion.
The largest expense is the Health Sector at $101.2 billion, accounting for 41.4 per cent of total expense.
The remaining sectors of total expense include the Education Sector (Excludes Teachers’ Pension Plan. Teachers’ Pension Plan expense is included in Other Programs) at $40.8 billion or 16.7 per cent; the Postsecondary Education Sector at $14.0 billion or 5.7 per cent; the Children, Community and Social Services Sector at $21.4 billion or 8.8 per cent; the Justice Sector at $7.3 billion or 3.0 per cent; Other Programs at $42.4 billion or 17.4 per cent; and Interest and Other Debt Servicing Charges, included as part of Total Expense, at $17.2 billion or 7.1 per cent.
Note: Numbers may not add due to rounding.
Sources: Ontario Treasury Board Secretariat and Ontario Ministry of Finance.
Footnotes
[1] The three experts are from the Policy and Economic Analysis Program at the University of Toronto; Quantitative Economic Decisions, Inc. (QEDinc.); and Stokes Economics Consulting, Inc.