Introduction
Ontario’s borrowing program is primarily used to fund deficits, refinance maturing debt, make investments in capital assets and support other loans and investments that advance key provincial priorities.
As of October 8, 2026, Ontario has completed $36.3 billion of long-term borrowing in 2026–27. The 2026–27 Borrowing Program is now forecast to be $51.1 billion, an increase of $3.9 billion from the 2026 Budget forecast, primarily due to the increase in the deficit. The province continued to respond to volatile market conditions and leveraged strong investor demand to remain well ahead of an even-paced borrowing program.
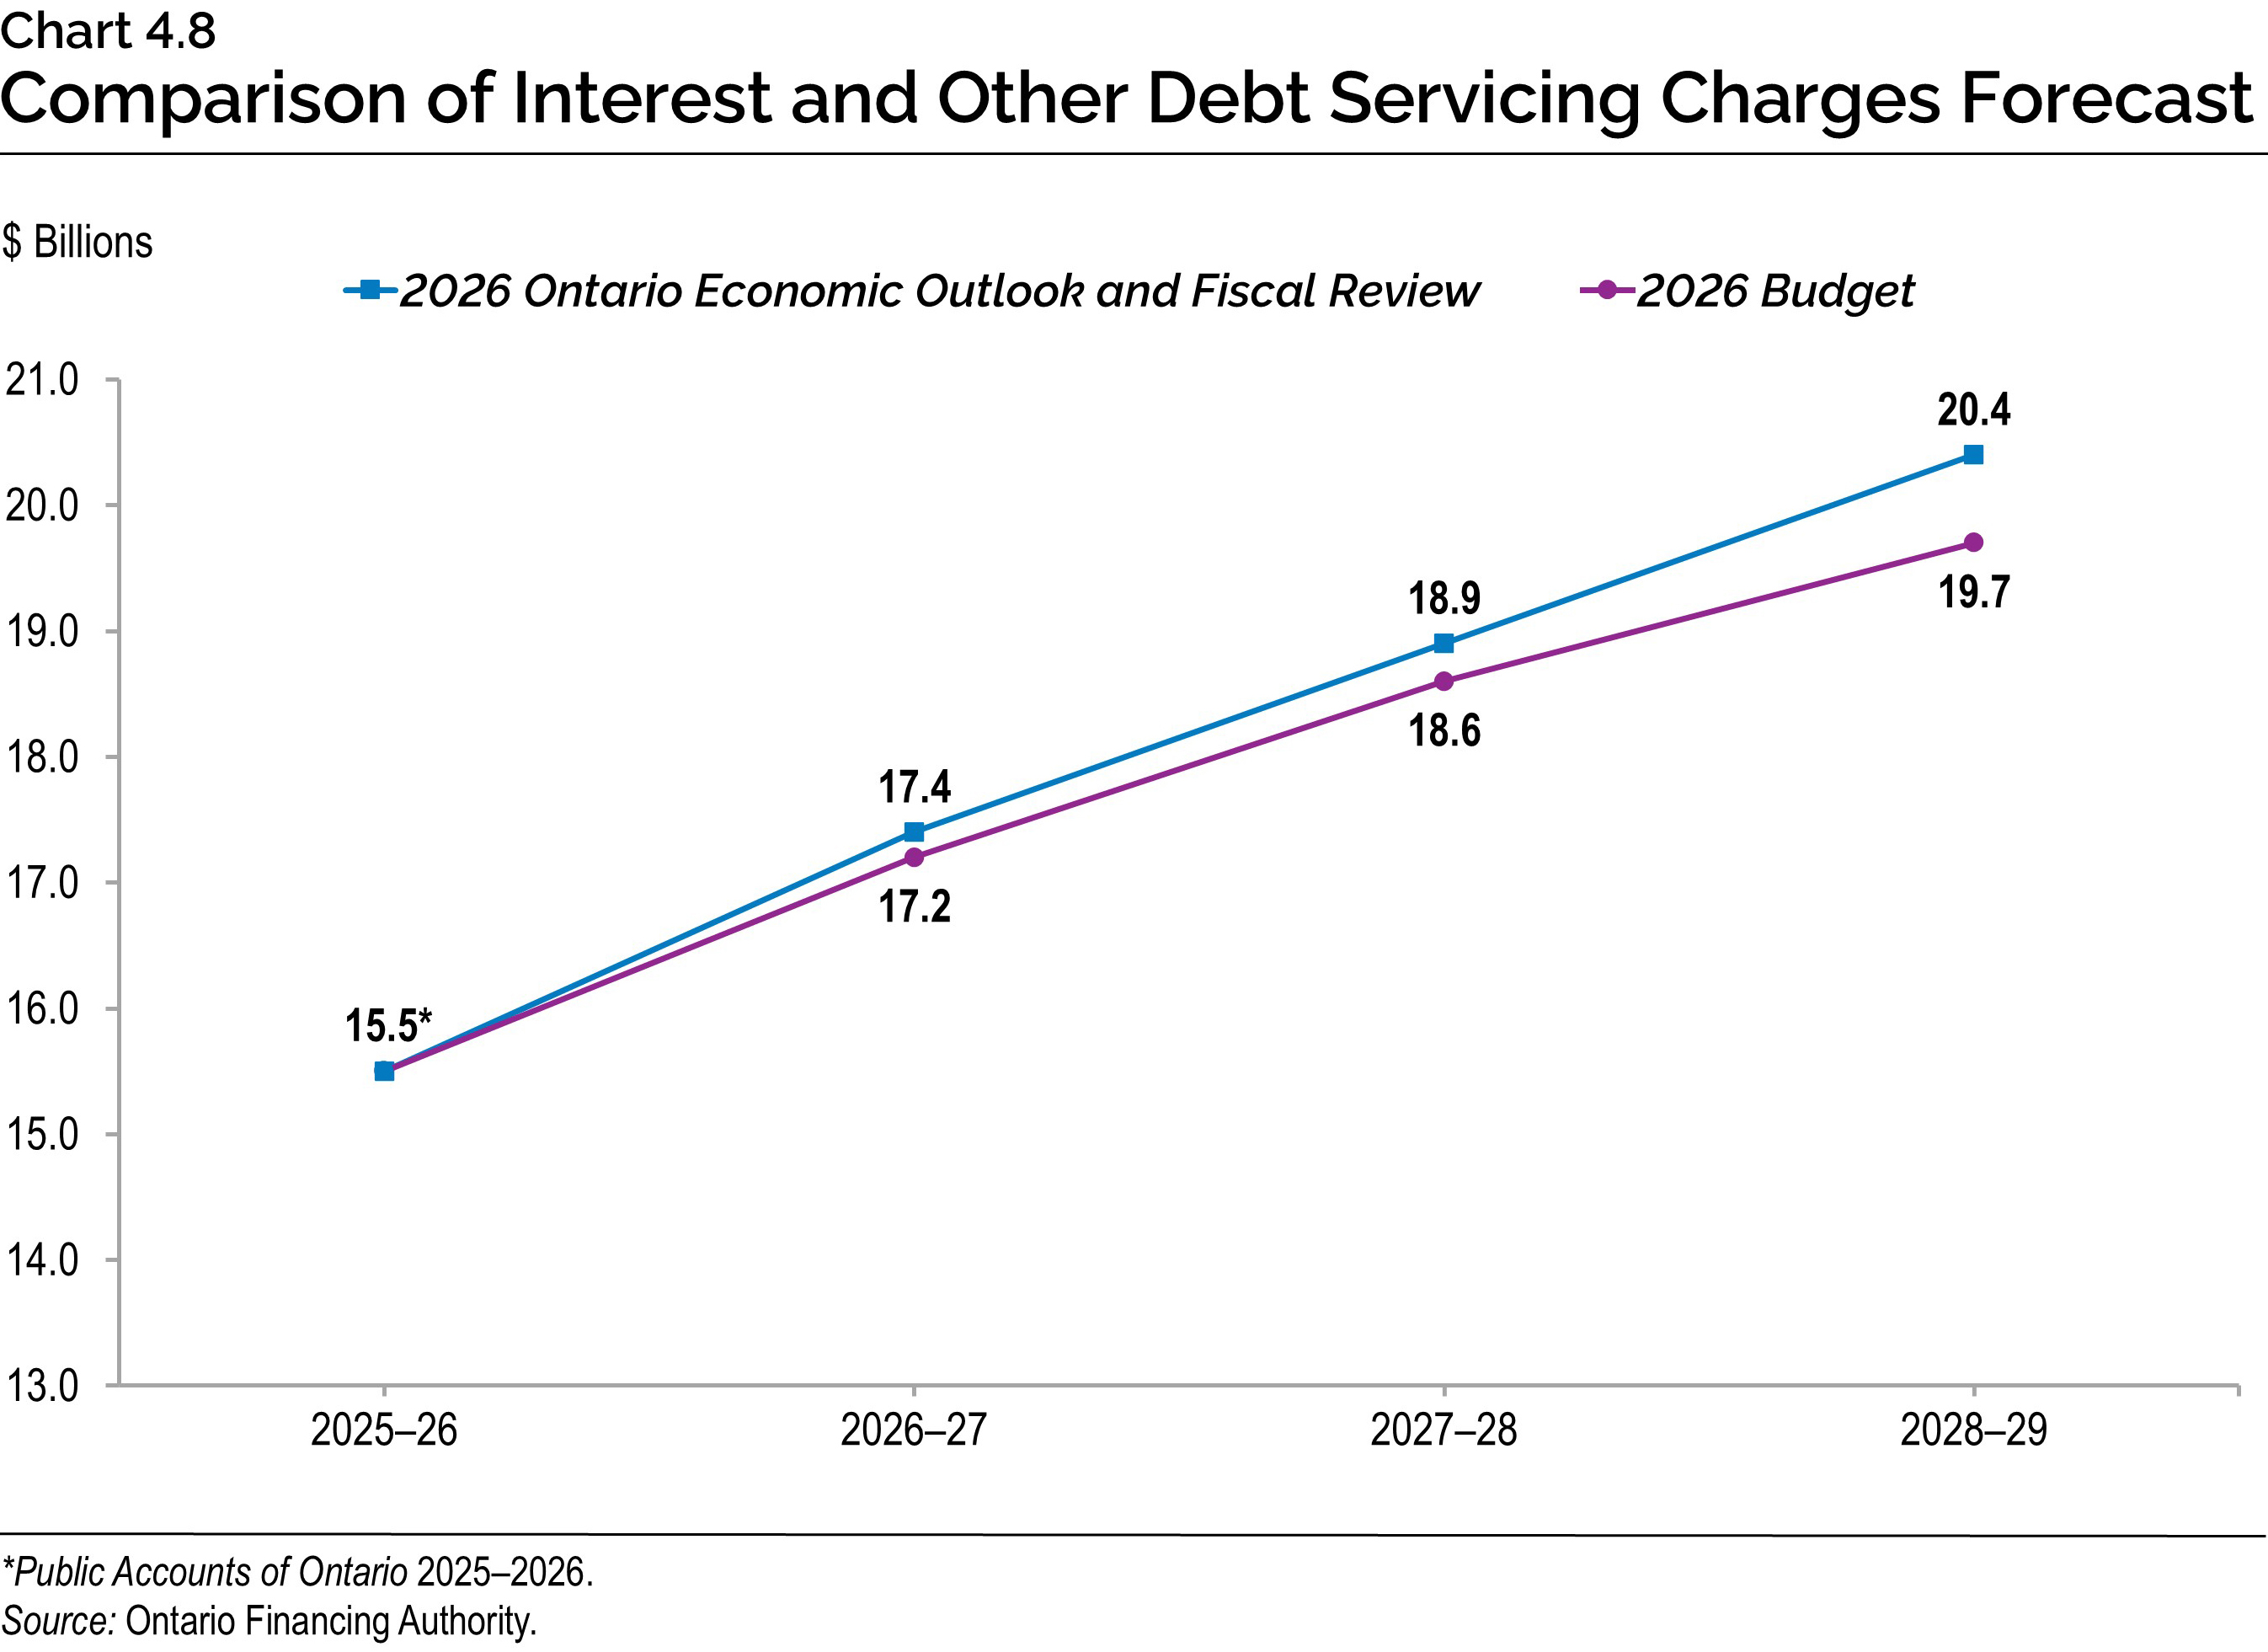
Interest and Other Debt Servicing Charges (IOD) is forecast to be $17.4 billion in 2026–27, an increase of $0.1 billion from the 2026 Budget.
The net debt-to-gross domestic product (GDP) ratio is forecast to be 37.4 per cent in 2026–27, compared with the forecast of 37.7 per cent in the 2026 Budget. Ontario remains committed to fiscal sustainability and its plan keeps this level below the target of 40 per cent over the medium-term outlook.
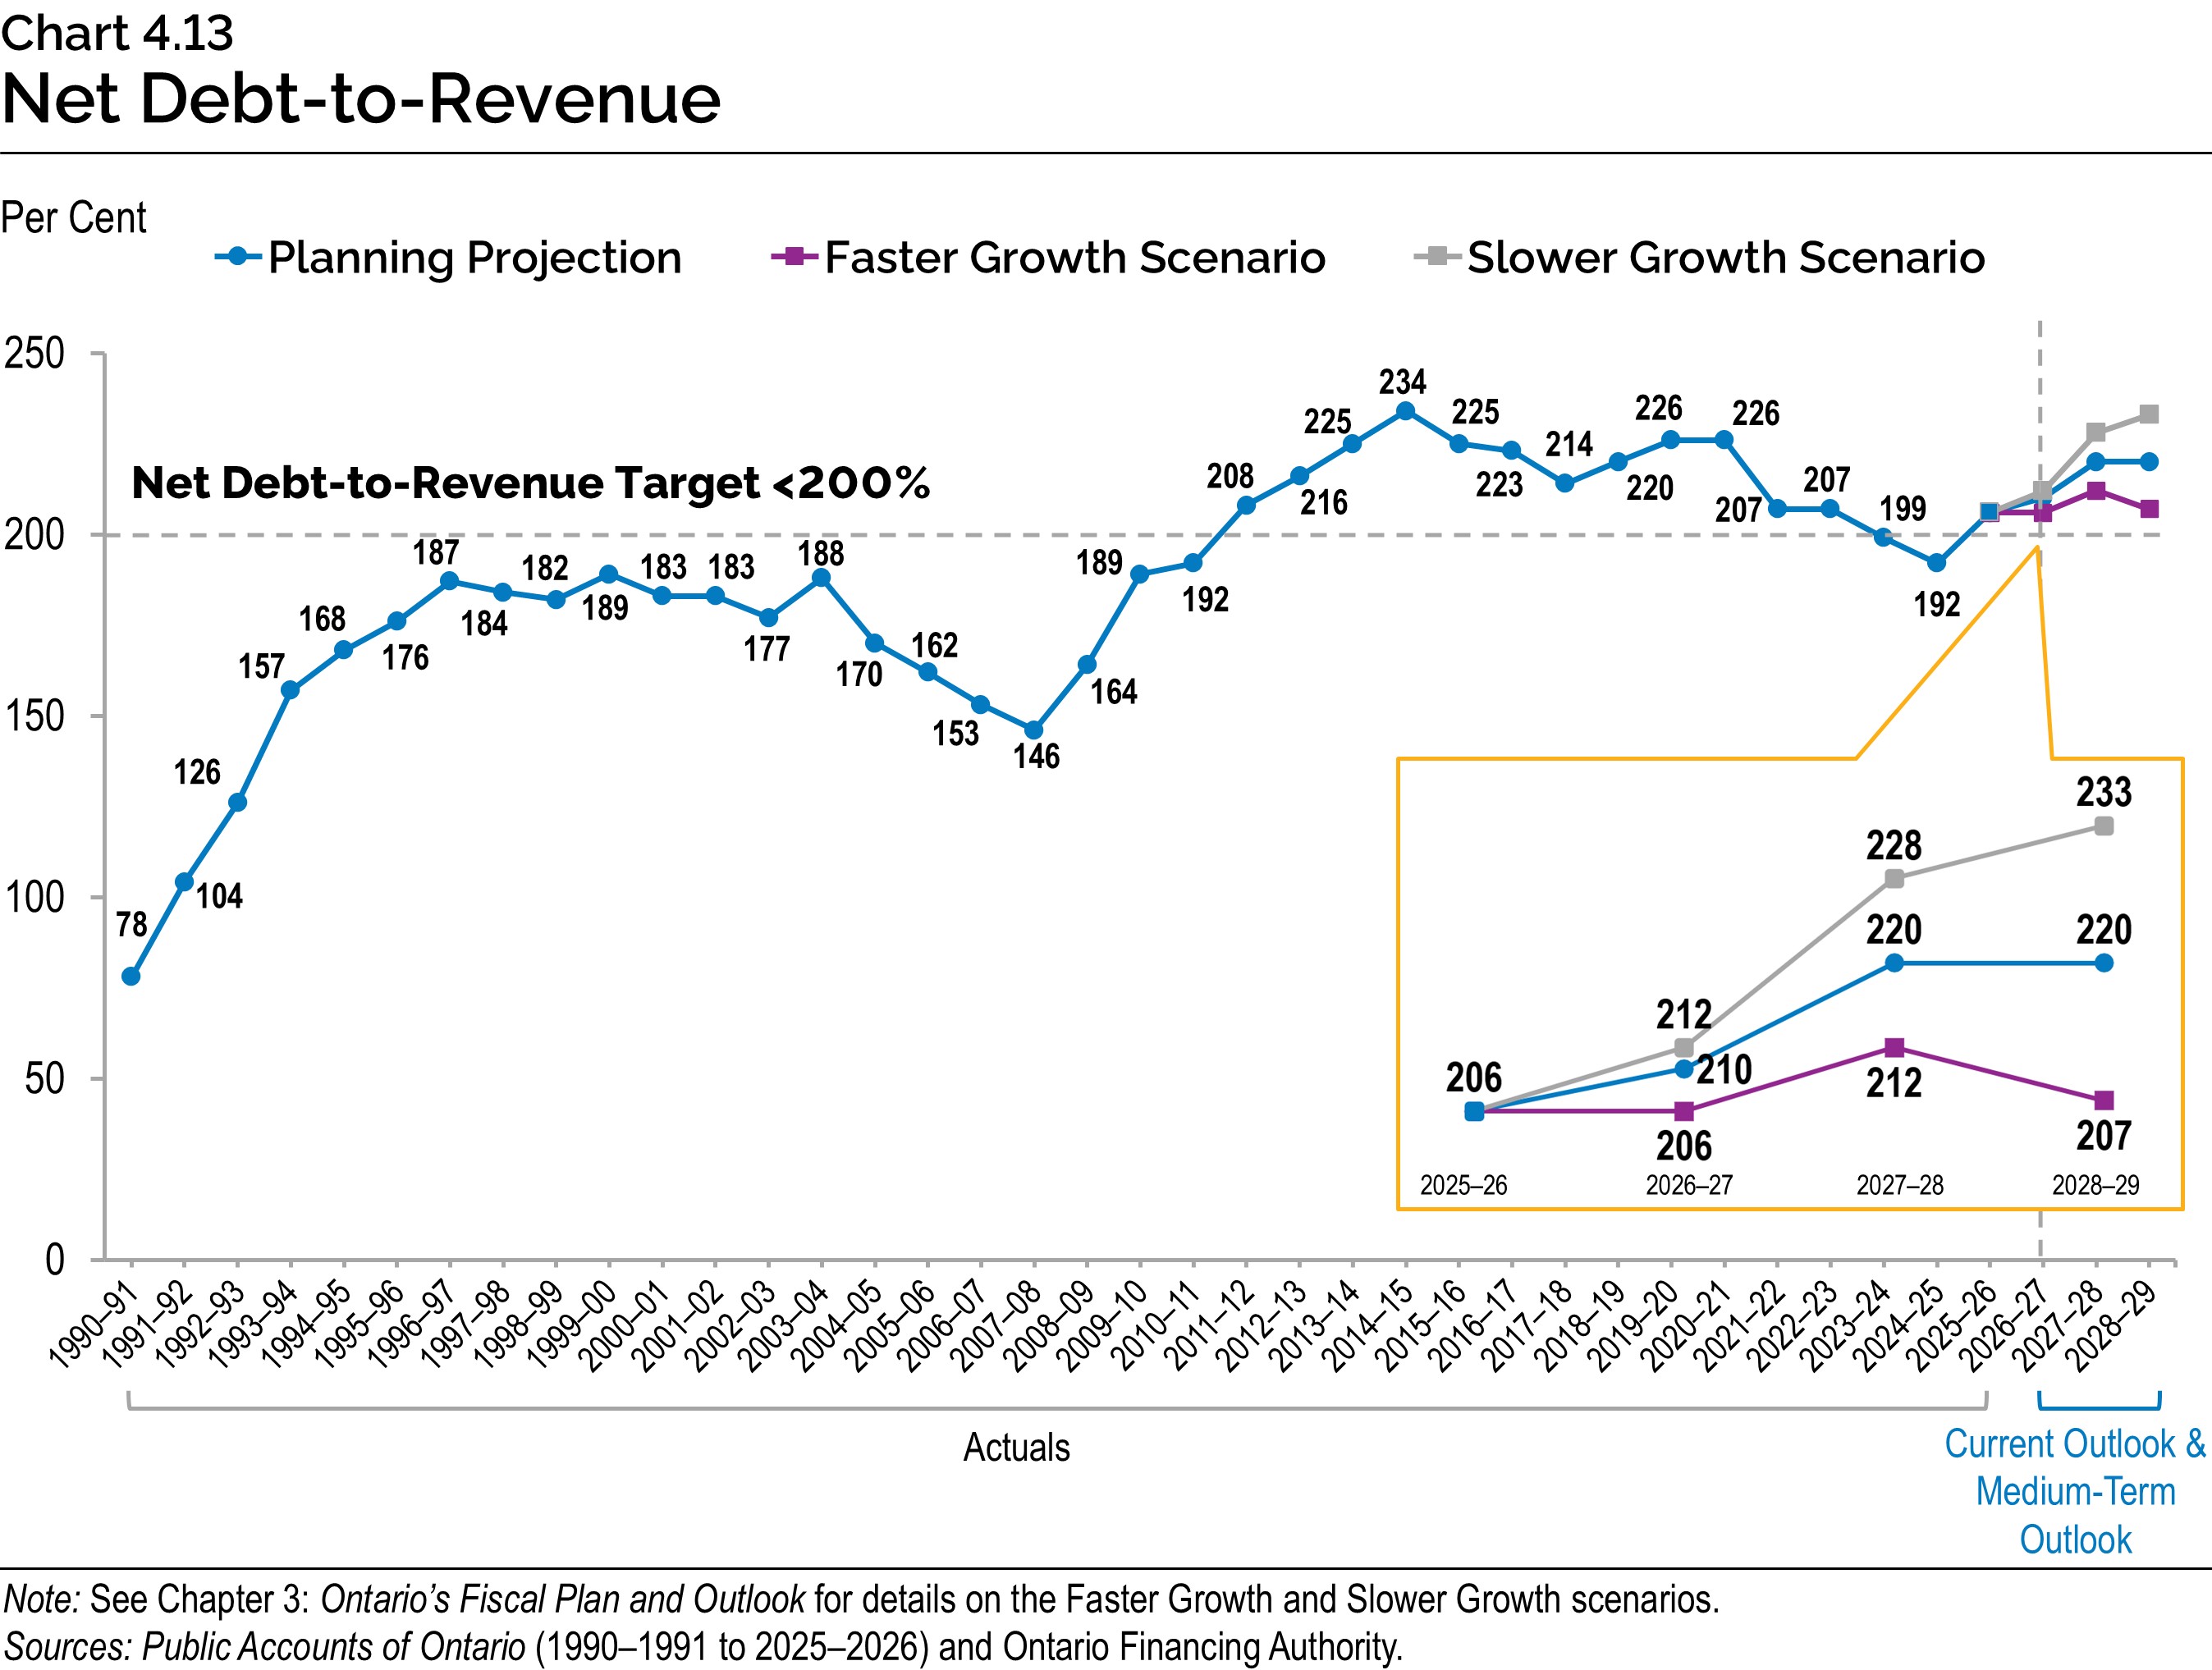
The net debt-to-revenue is forecast to be 210 per cent in 2026–27, compared with the forecast of 211 per cent in the 2026 Budget. While the current economic environment will temporarily raise the level of this ratio, Ontario remains committed to achieving the 200 per cent target and has already proven that it can, after doing so consecutively in 2023–24 and 2024–25.
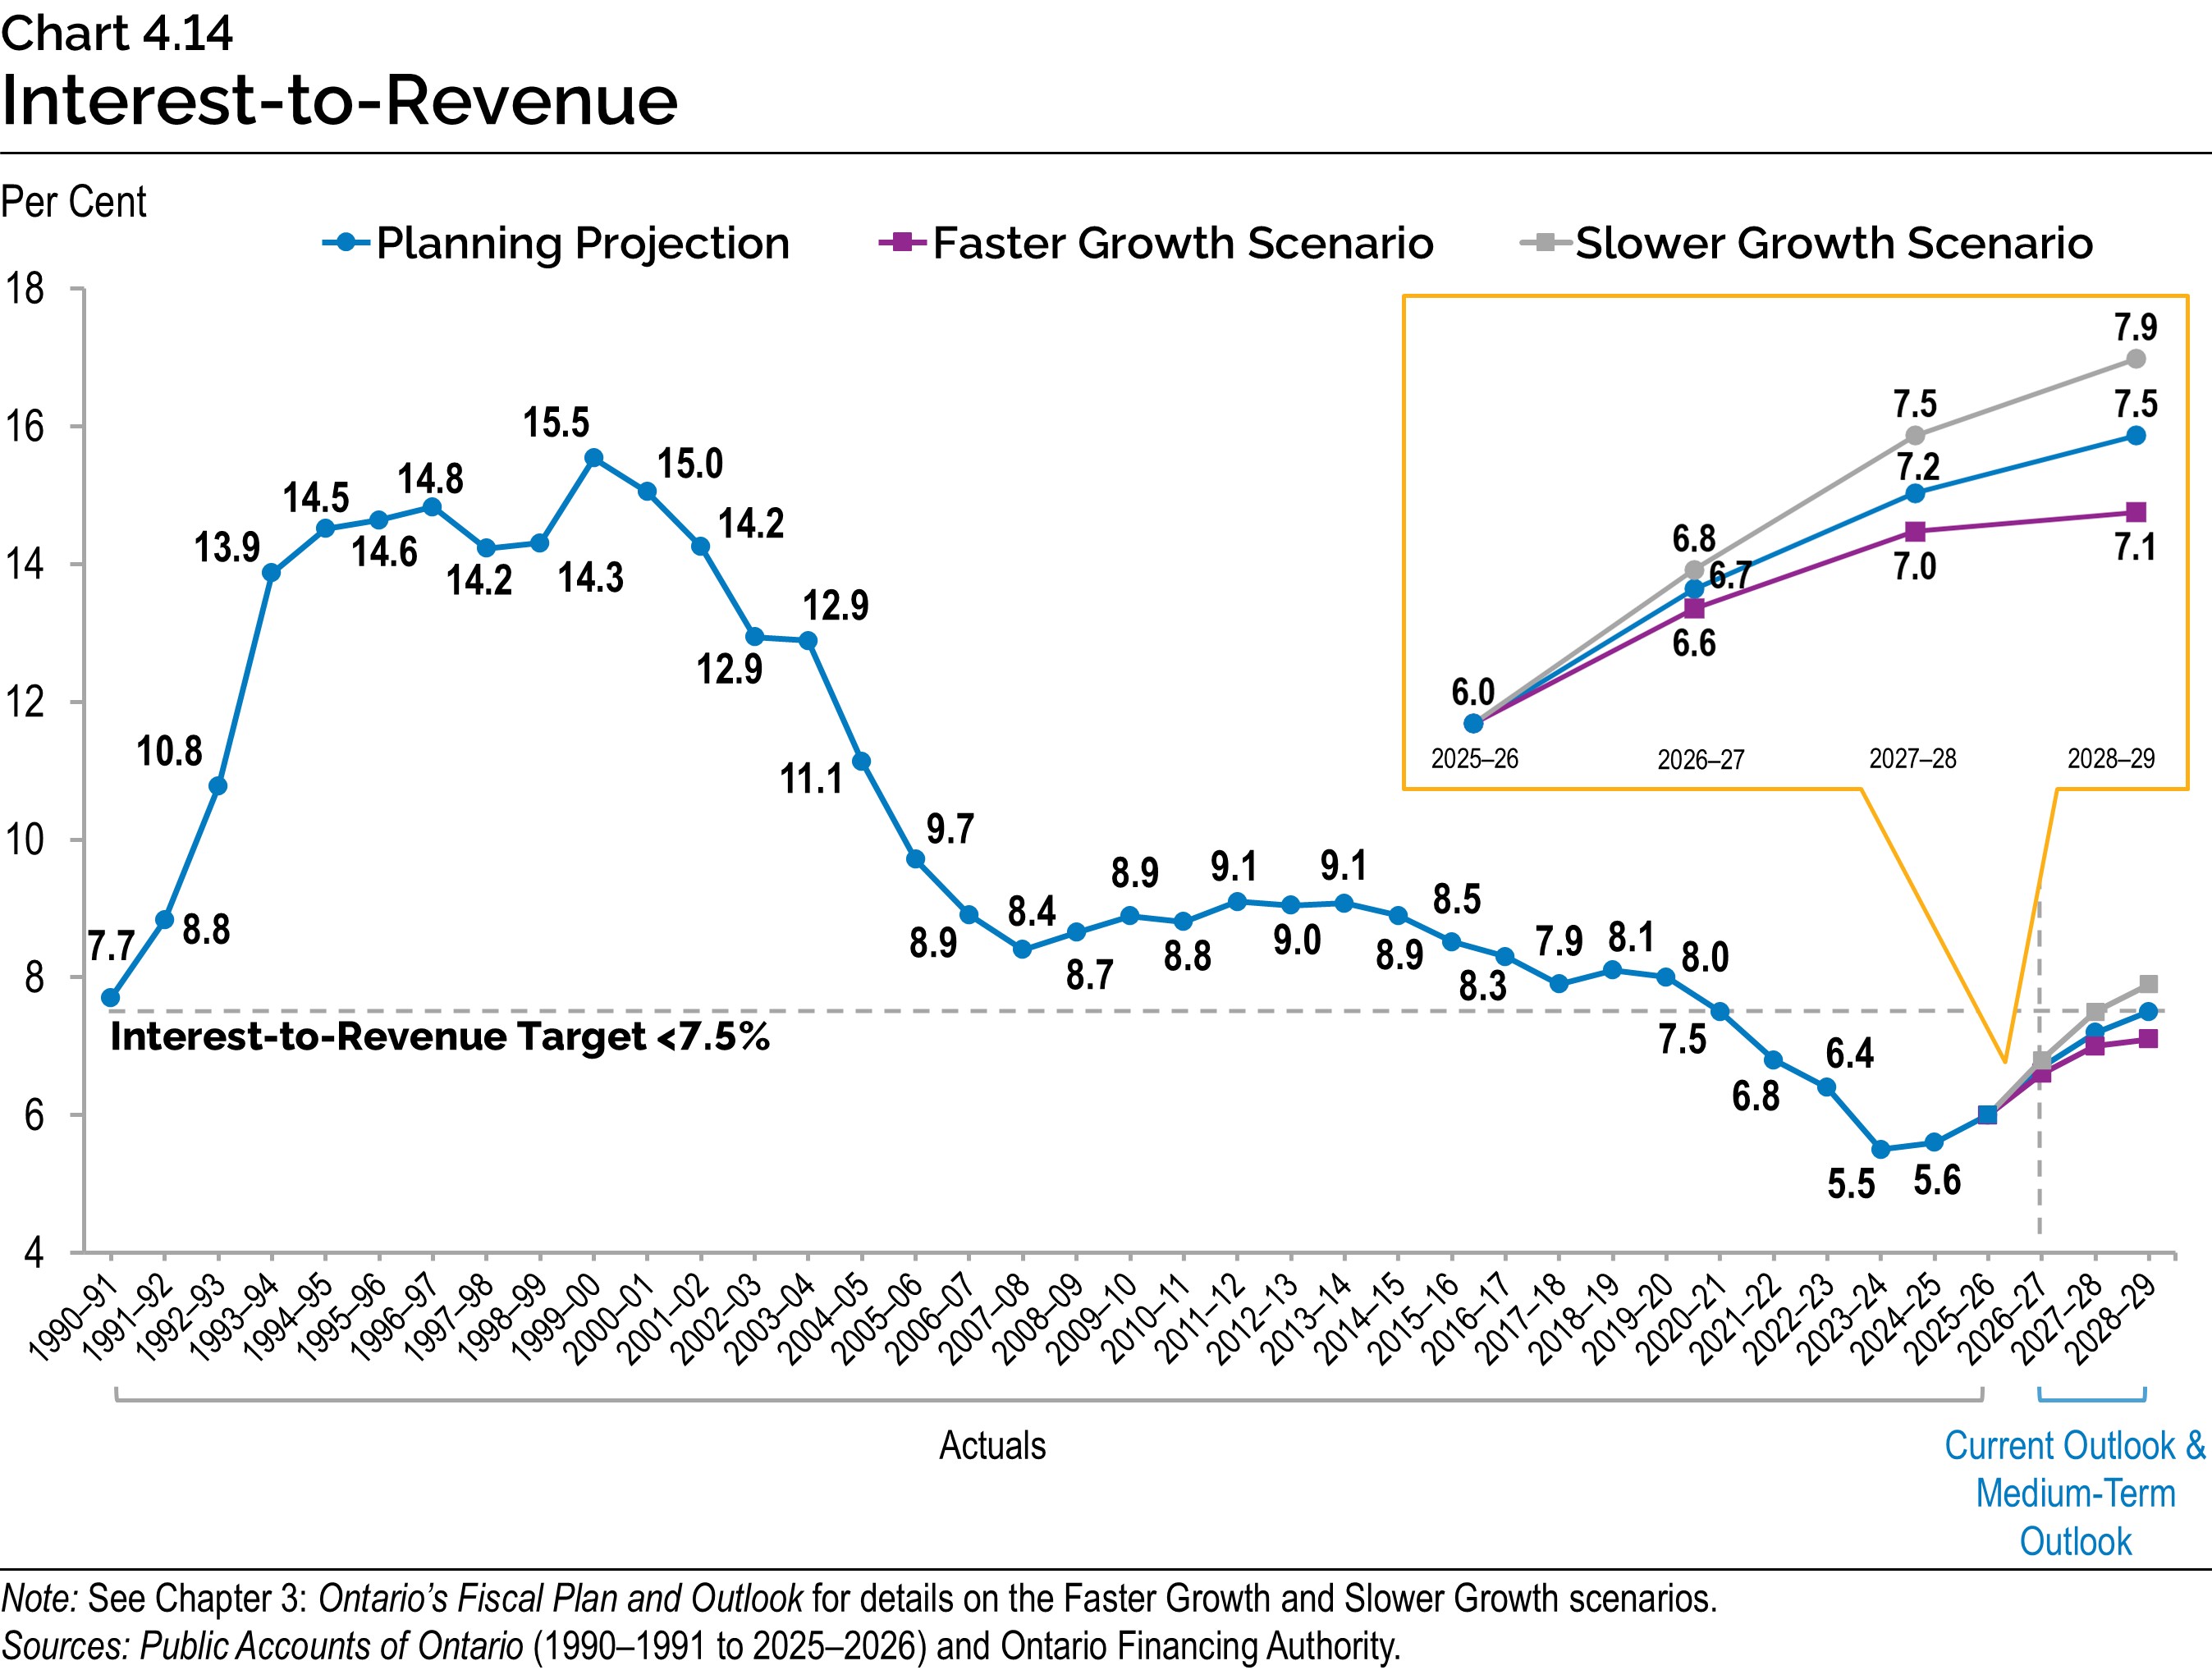
The interest-to-revenue ratio is forecast to be 6.7 per cent in 2026–27, consistent with the forecast in the 2026 Budget and remains at or below its target level of 7.5 per cent over the medium-term outlook.
| Item | Actual 2025–26 |
2026 Budget 2026–27 |
2026 FES 2026–27 |
Change Since 2026 Budget 2026–27 |
|---|---|---|---|---|
| Long-Term Borrowing Requirement | 58.6 | 47.2 | 51.1 | 3.9 |
| IOD | 15.5 | 17.2 | 17.4 | 0.1 |
| Net Debt-to-GDP | 36.5% | 37.7% | 37.4% | (0.3)% |
| Net Debt-to-Revenue | 205.7% | 210.9% | 209.7% | (1.2)% |
| Interest-to-Revenue | 6.0% | 6.7% | 6.7% | 0.0% |
Table 4.1 footnotes:
Note: 2026 FES in the table is defined as the 2026 Ontario Economic Outlook and Fiscal Review.
Source: Ontario Financing Authority.
Borrowing Program
Ontario’s borrowing program is primarily used to fund deficits, refinance maturing debt, make investments in capital assets and support other loans and investments that advance key provincial priorities. Ontario will continue to rely primarily on long-term public market financing, complemented by a strategic increase in short-term borrowing through existing programs and the launch of a new Euro-Commercial Paper (ECP) programme.
| Item | 2026 Budget |
In-Year Change |
Current Outlook 2026–27 |
Medium-Term Outlook 2027–28 |
Medium-Term Outlook 2028–29 |
|---|---|---|---|---|---|
| Deficit/(Surplus) | 13.8 | 3.1 | 16.9 | 12.7 | 6.7 |
| Provincial Investment in Capital Assets | 28.0 | – | 28.0 | 28.0 | 22.4 |
| Amortization of Capital Assets | (10.2) | – | (10.2) | (10.5) | (11.4) |
| Non-Cash and Cash Timing Adjustments | (2.5) | (0.7) | (3.2) | (4.3) | (4.8) |
| Net Loans and Investments | 5.2 | 0.5 | 5.7 | 5.5 | 4.8 |
| Debt Maturities and Redemptions | 26.9 | – | 26.9 | 27.5 | 30.7 |
| Total Funding Requirement | 61.2 | 2.9 | 64.1 | 59.0 | 48.4 |
| Decrease/(Increase) in Short-Term Borrowing | (6.0) | (2.0) | (8.0) | (6.0) | – |
| Increase/(Decrease) in Year-End Cash and Cash Equivalents | (8.0) | 3.0 | (5.0) | (5.0) | (3.0) |
| Total Long-Term Borrowing | 47.2 | 3.9 | 51.1 | 48.0 | 45.4 |
Table 4.2 footnotes:
Note: Numbers may not add due to rounding.
Source: Ontario Financing Authority.
As of October 8, 2026, Ontario has completed $36.3 billion of its $51.1 billion long-term borrowing program for 2026–27. This fiscal year’s long-term borrowing program is $3.9 billion higher than forecasted in the 2026 Budget. The 2027–28 and 2028–29 long-term public borrowing forecasts are $48.0 billion and $45.4 billion.
Year-end cash and cash equivalents are forecast to decrease by $5.0 billion in 2026–27, $5.0 billion in 2027–28 and by $3.0 billion in 2028–29.
Ontario plans to increase short-term borrowing by $8.0 billion in 2026–27 and by a further $6.0 billion in 2027–28. This approach will further diversify Ontario’s investor base through the re‑established U.S. Commercial Paper (USCP) program and the introduction of a new ECP programme. The province will deploy this additional capacity across Ontario’s short-term borrowing programs to respond to shifting market conditions, investor demand and funding requirements. Short-term borrowing outstanding is anticipated to reach $41.5 billion by fiscal year-end.
The new ECP programme will expand access to global money market investors, provide an additional source of short-term funding, and enhance Ontario’s ability to respond to evolving market conditions. Together with Ontario’s treasury bill program, the USCP and ECP programs will broaden market access, diversify funding sources and strengthen the province’s ability to access short-term liquidity across multiple markets.
These initiatives enhance Ontario’s liquidity management framework and support the province’s ability to meet its short- and long-term financing obligations under a wide range of market conditions.
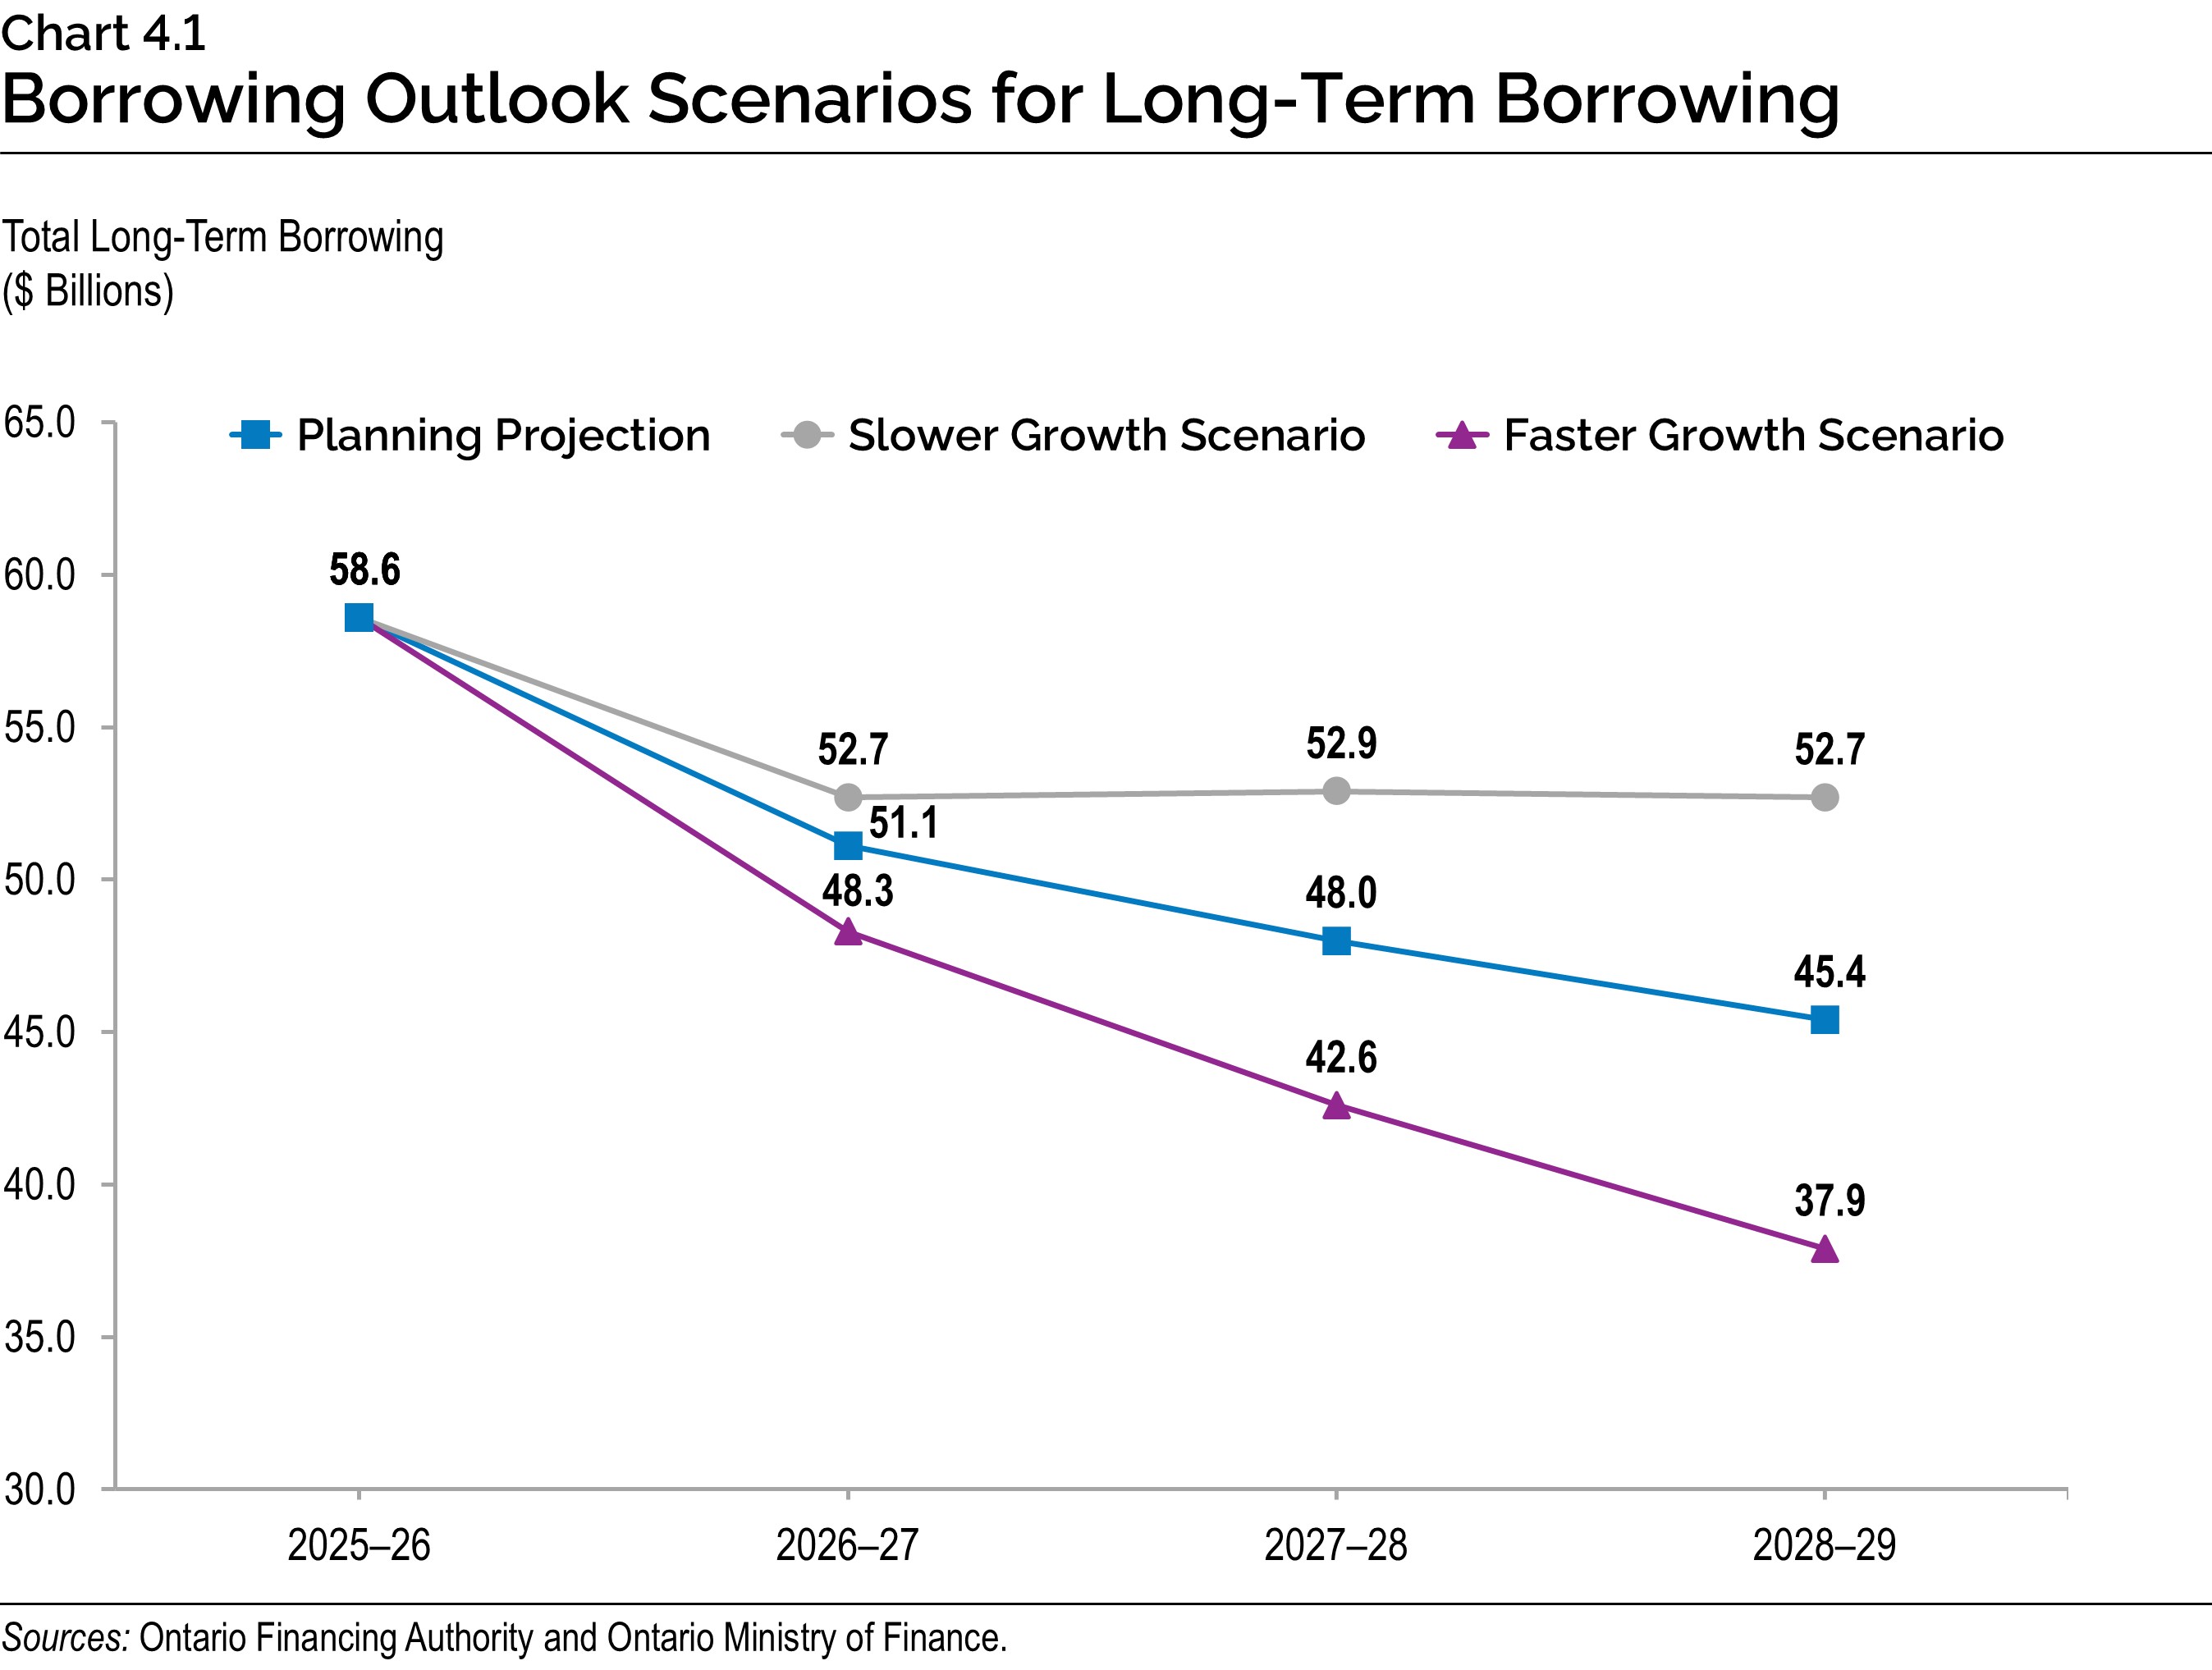
In the event that alternative economic scenarios materialize, Ontario’s borrowing requirements over the next three years would also change (see Chapter 3: Ontario’s Fiscal Plan and Outlook for more details, and a description of the resulting alternative medium-term outlook scenarios). Under the Faster Growth scenario, long-term borrowing would decrease by a total of $15.7 billion over the three-year outlook period, while under the Slower Growth scenario, long-term borrowing would increase by $13.8 billion over the same period.
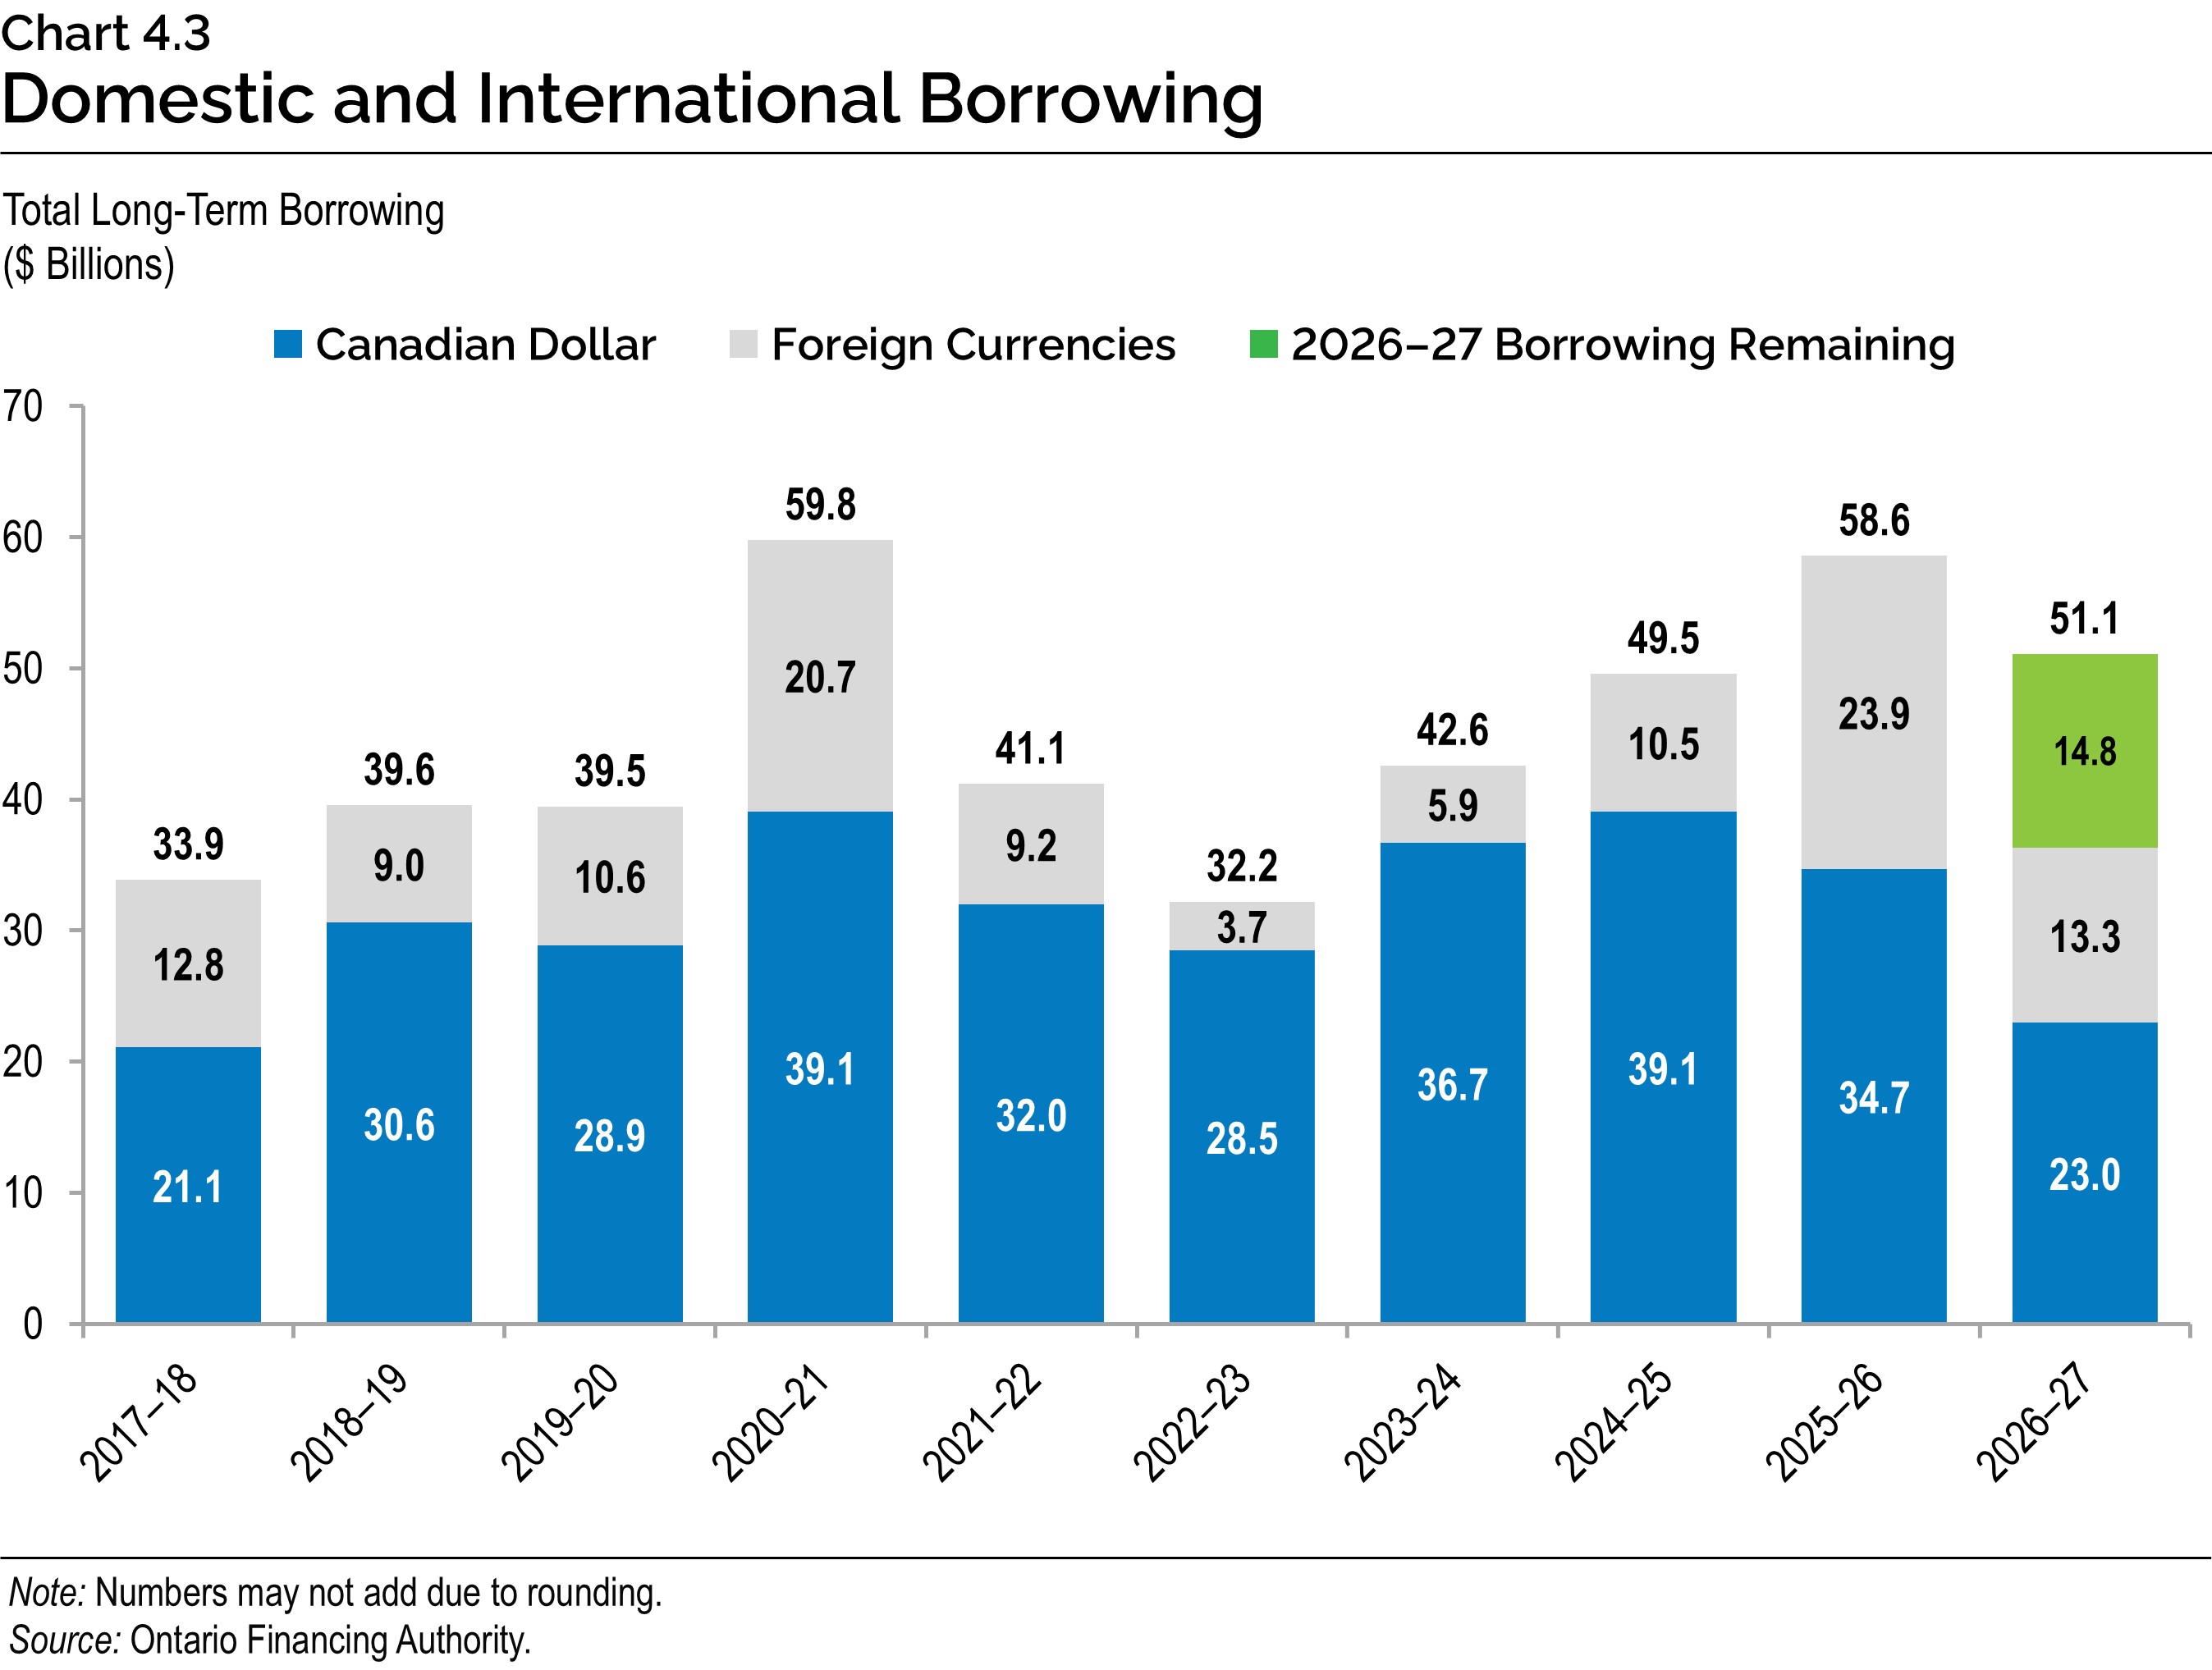
Approximately 63.5 per cent of 2026–27 long-term borrowing was completed in Canadian dollars, through 23 syndicated issues and two Green Bonds. This percentage is within Ontario’s new guidance for domestic borrowing of 60 to 80 per cent for 2026–27, which was adjusted from the 65 to 80 per cent target range in the 2026 Budget. This range will continue to be adjusted, if necessary, in response to evolving investor demand in the Canadian dollar and foreign currency debt markets.
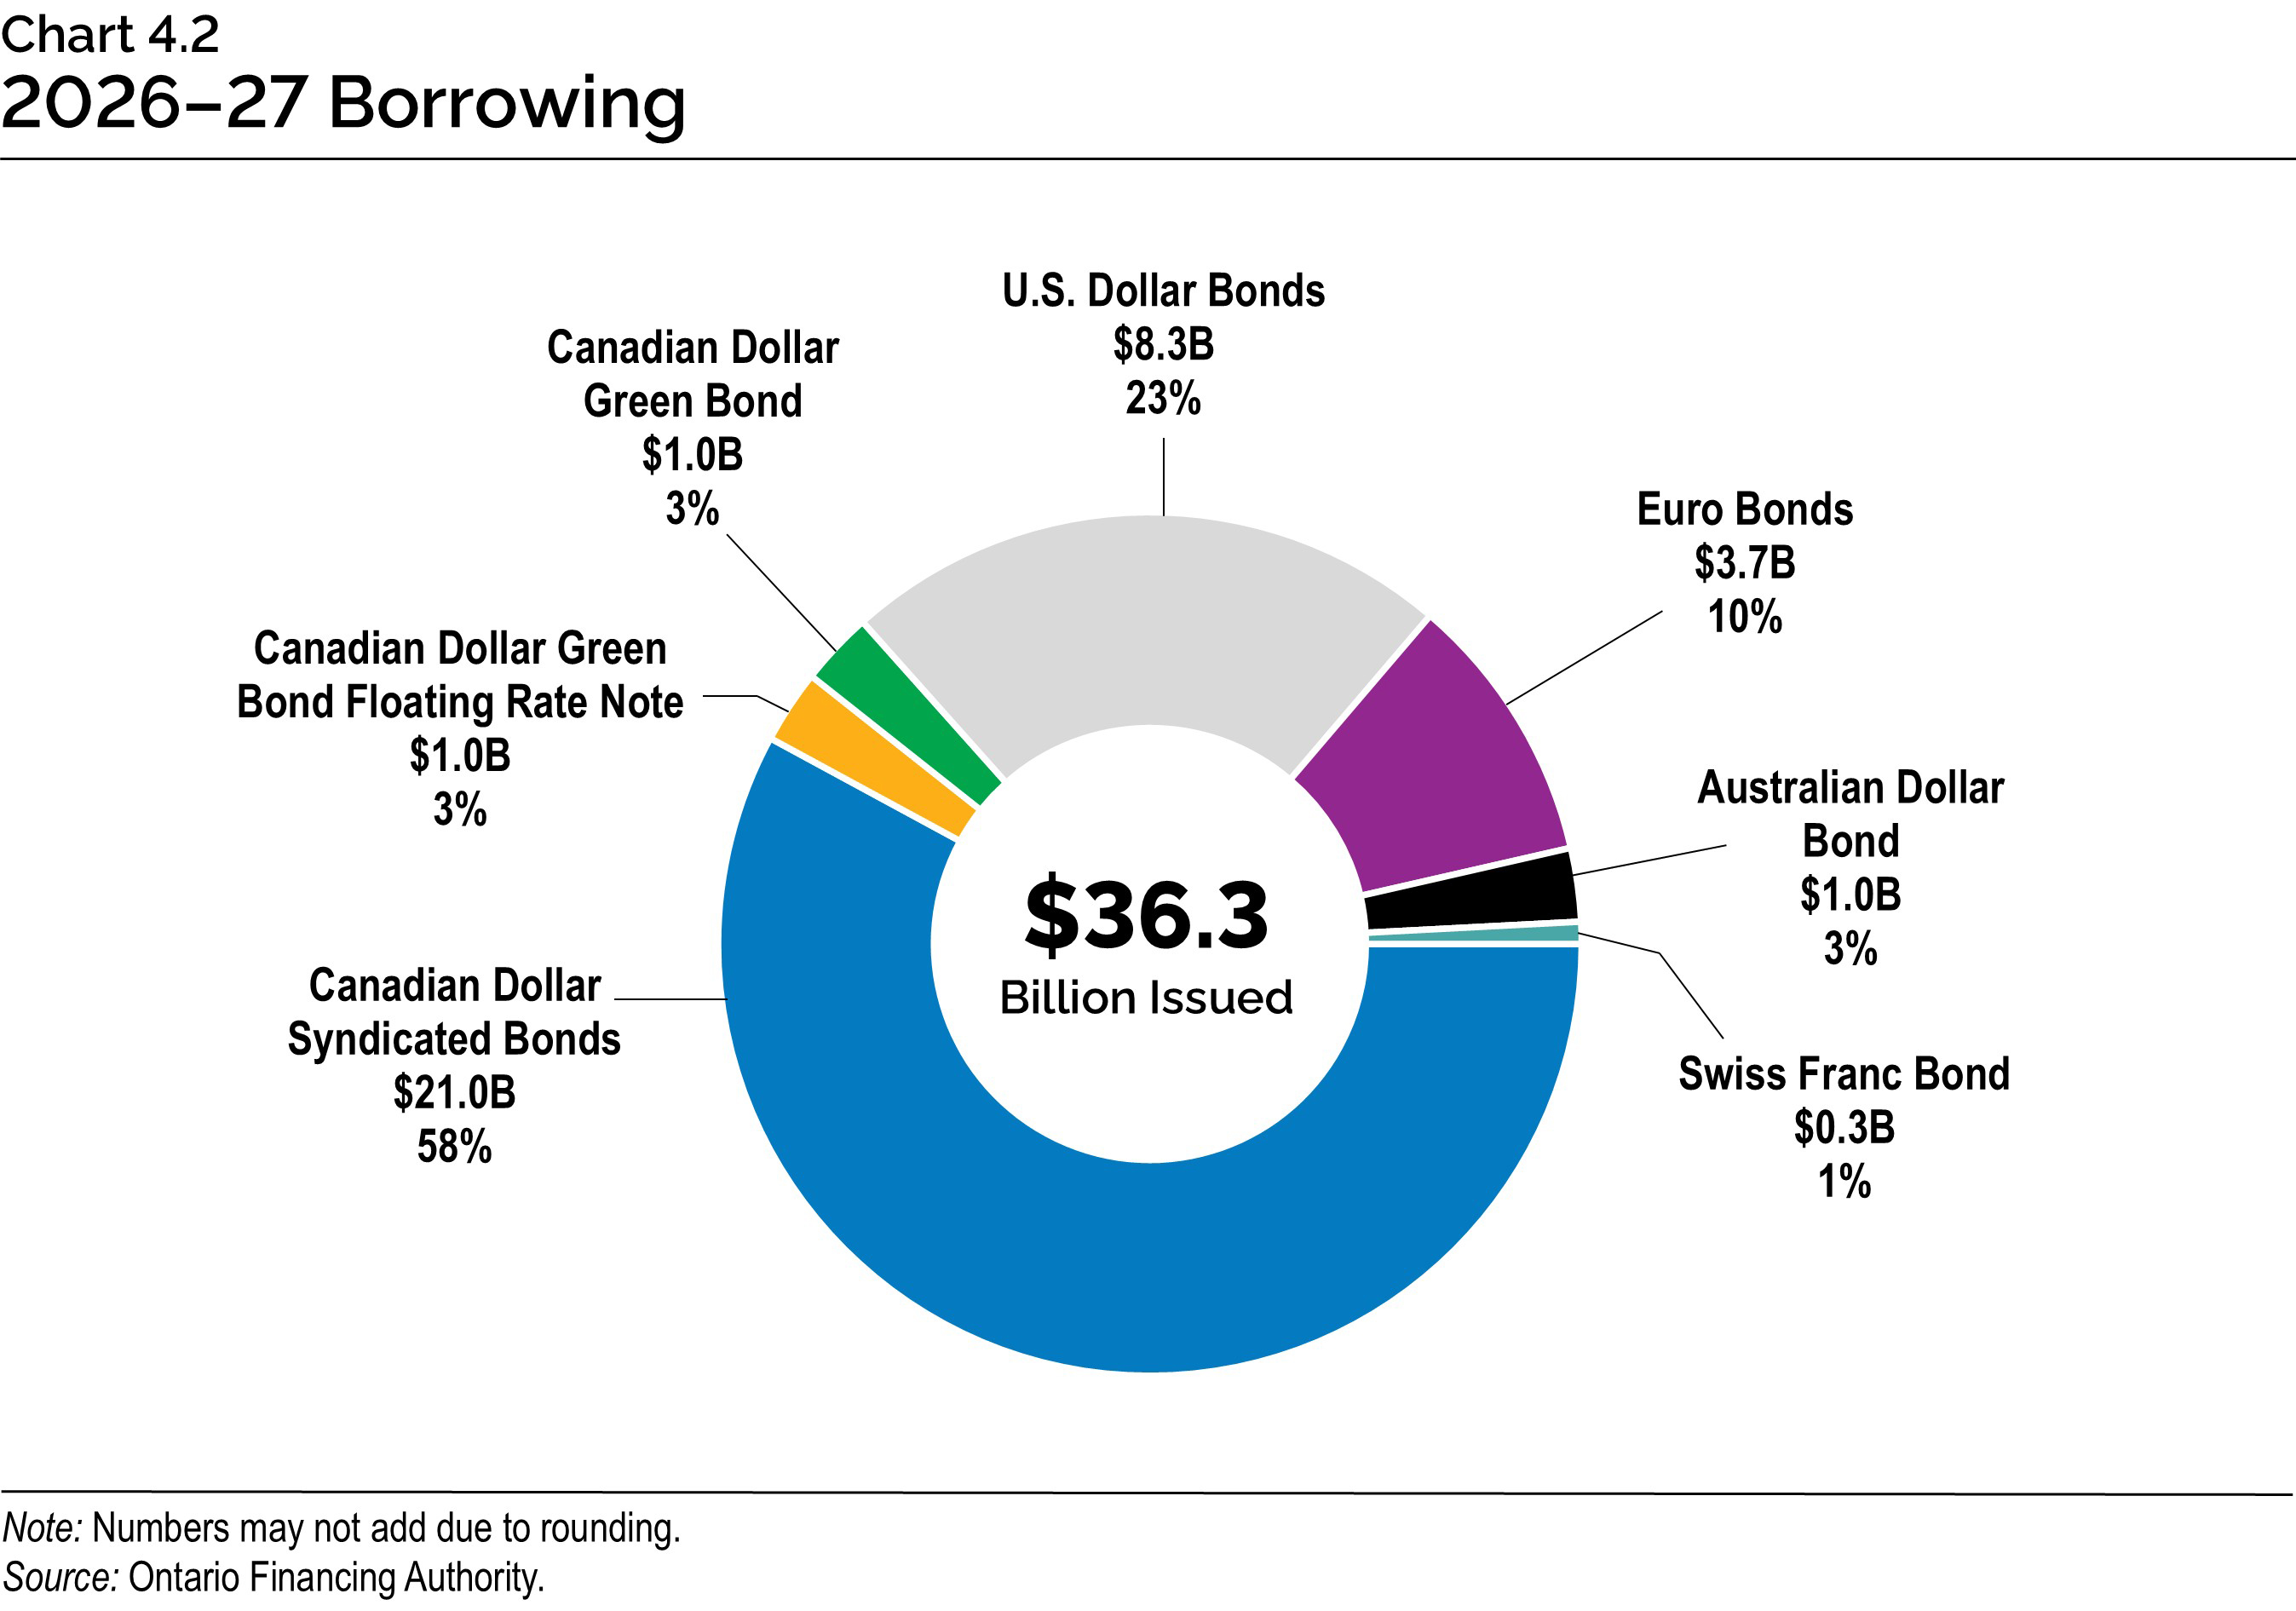
Foreign currency borrowing helps reduce Ontario’s overall borrowing costs by continuing to diversify Ontario’s investor base. This diversification ensures Ontario will continue to have access to capital, even if domestic market conditions become challenging. Approximately $13.3 billion, or 36.5 per cent, of this year’s long-term borrowing was completed in U.S. dollars, euros, Australian dollars and Swiss francs.
Ontario Bond Frameworks
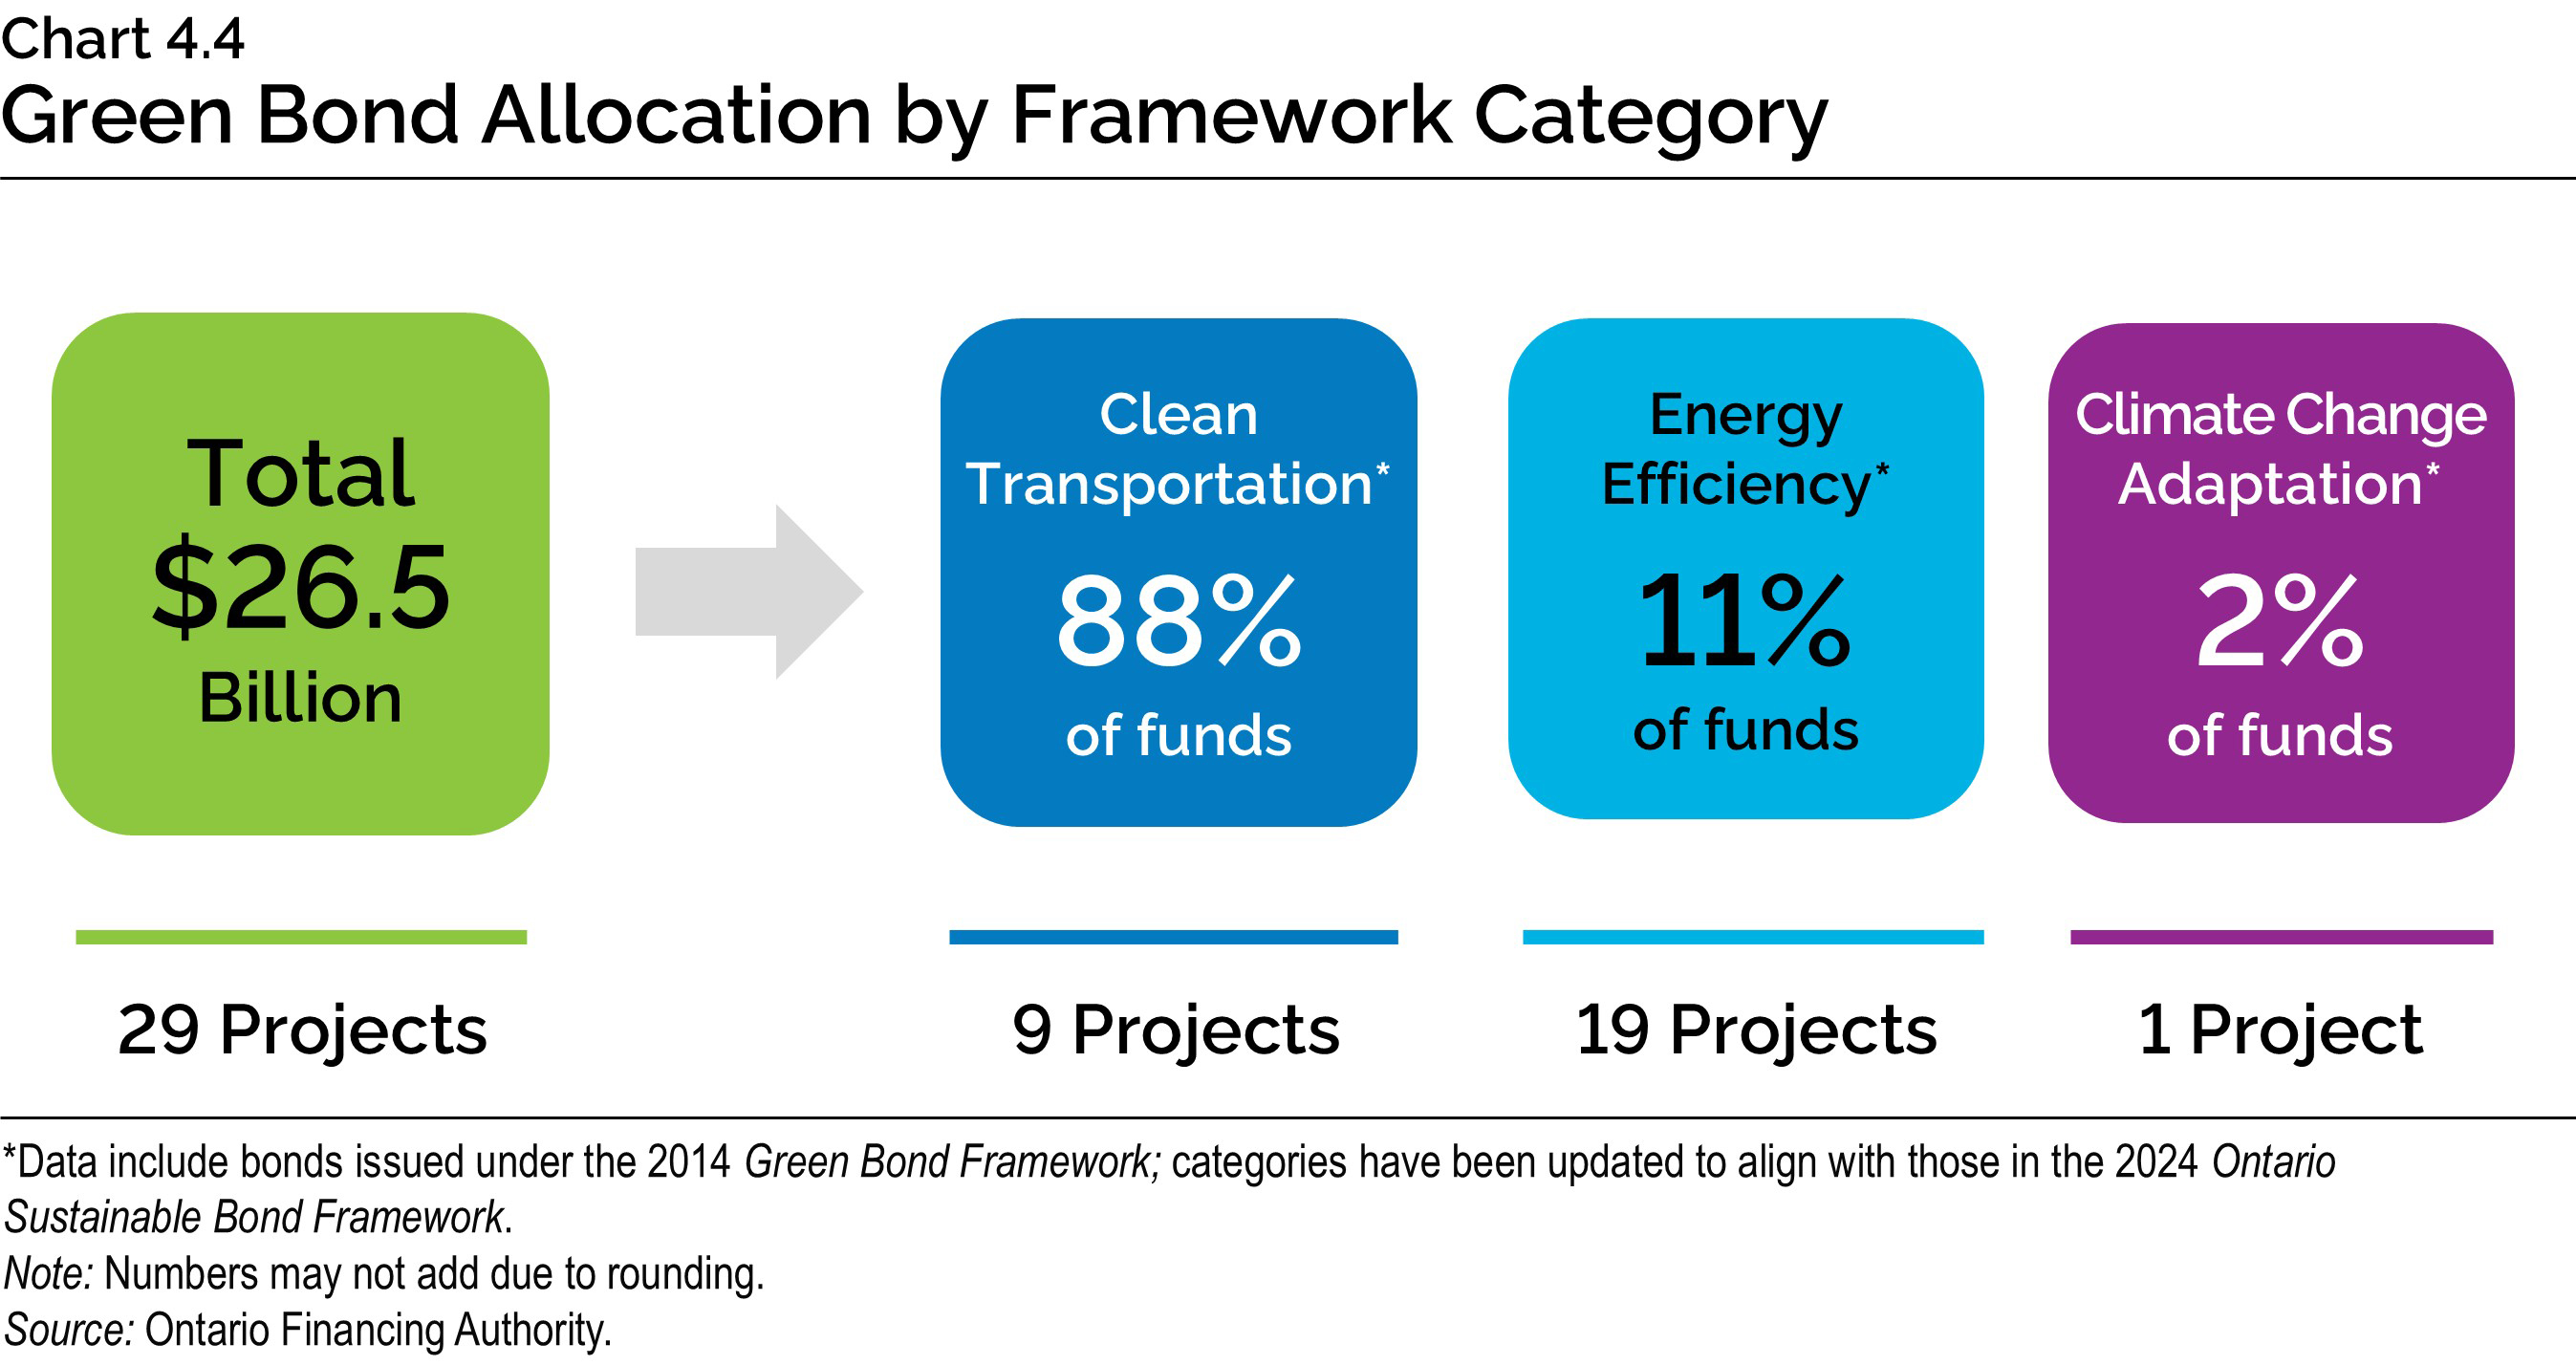
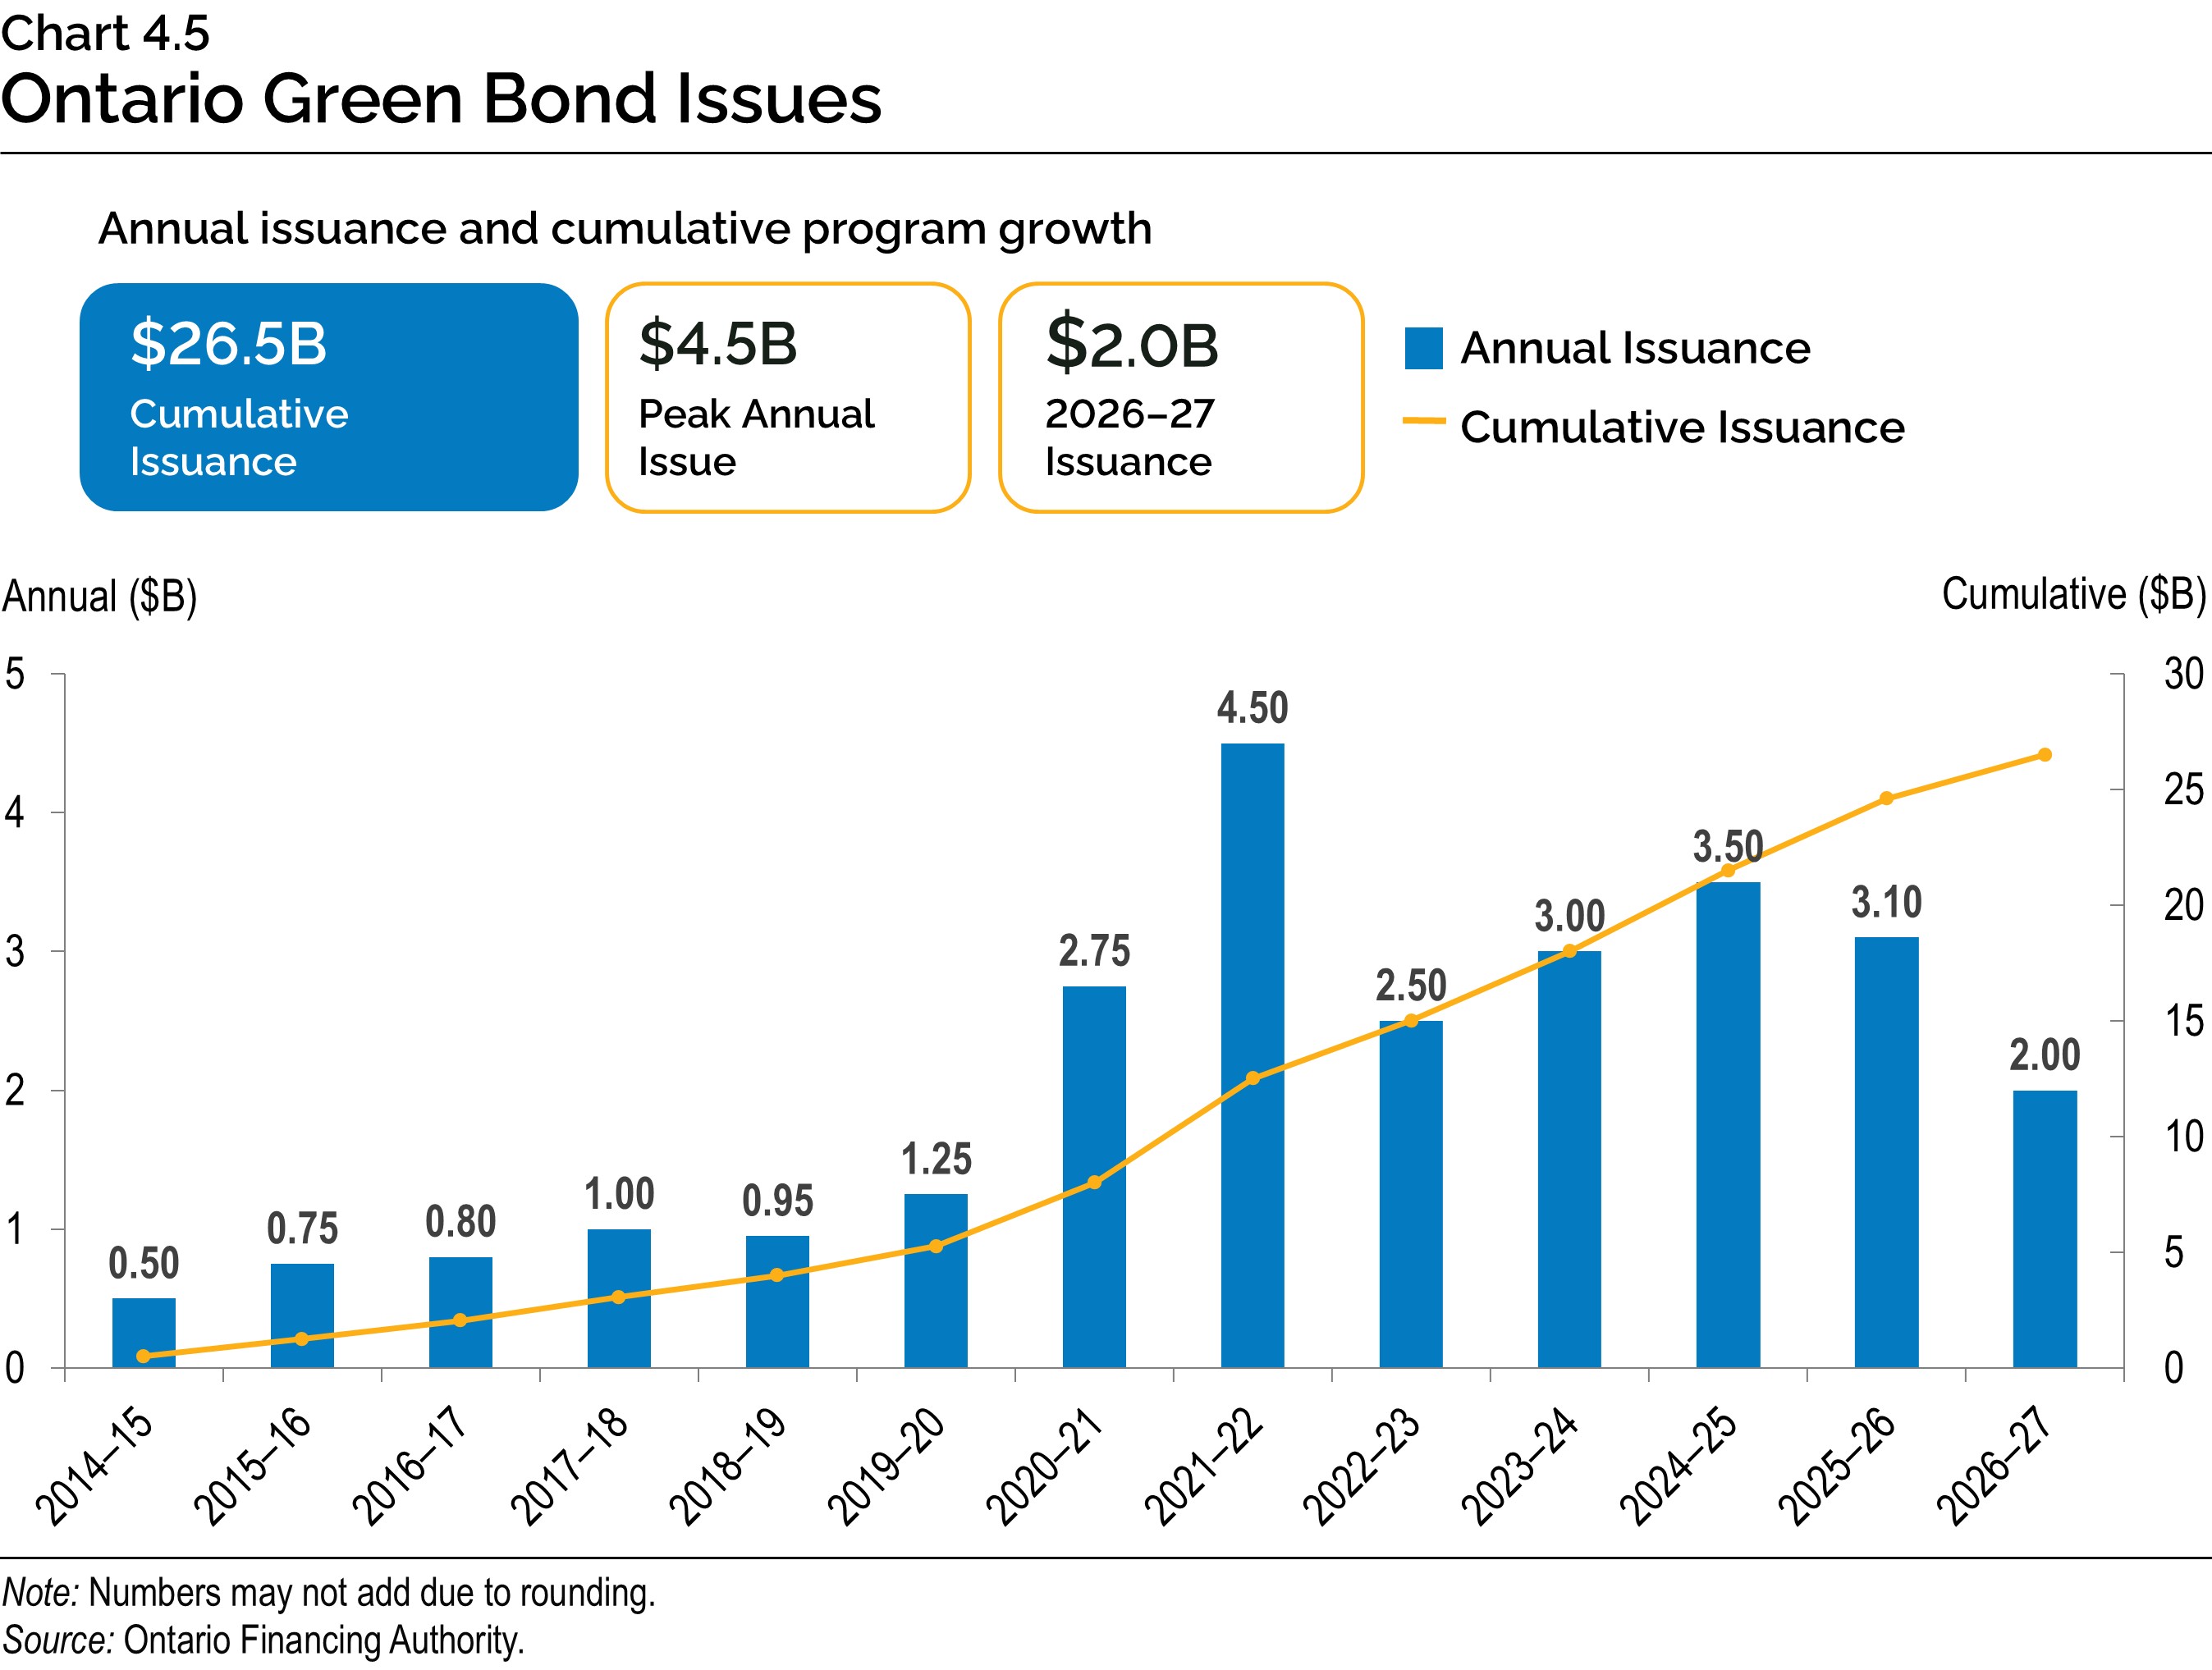
Ontario is a leader in issuing Canadian dollar labelled bonds and plans to issue multiple labelled bonds each fiscal year. Ontario’s Sustainable Bond Framework allows the province to issue Green Bonds, Social Bonds and Sustainability Bonds. The Green Bond program has been a core component of the Sustainable Bond Framework. It is an important tool to help finance public transit initiatives, extreme weather-resistant infrastructure, as well as energy efficiency and conservation projects. Ontario remains the largest and most frequent issuer of Canadian dollar Green Bonds, with 23 issues totalling $26.5 billion since 2014–15 and $21.85 billion outstanding.
Ontario has issued two Green Bonds so far in 2026–27. On August 20, 2026, Ontario issued a
dual-tranche offering of a new $1.0 billion 10-year Green Bond and a new $1.0 billion 6-year Green Bond Floating Rate Note. Three projects were selected to receive funding from the most recent Green Bond:
- the Hazel McCallion Line;
- the Ontario Line Subway; and
- the Scarborough Subway Extension.
Ontario is taking a coordinated approach to strengthening the province’s defence, security and resilience ecosystem by aligning public financing tools with long-term strategic industrial objectives. To further scale investment and ensure transparency for investors, the province is developing a Security and Resilience Bond Framework that would establish a clear approach for financing eligible defence, security and resilience initiatives and support the Ontario Defence Industrial Strategy (ODIS). Ontario plans to issue Security and Resilience Bonds in the future under this framework. These bonds will serve as an important tool to help fund defence and security projects, while benefiting from the government’s ability to raise funds at lower interest rates.
Cost of Debt
Since easing policy rates in October 2025, the Bank of Canada has maintained a cautious approach to monetary policy, as inflation has remained near the upper end of its target range and global economic uncertainty has persisted. While short-term overnight rates have remained relatively stable, long-term bond yields have increased globally, driven largely by trade tensions, geopolitical developments, and inflation pressures from elevated commodity prices.
Ontario actively manages financial market risk and adapts interest rate risk management strategies to minimize the impact of changing market conditions on borrowing costs. Adaptive interest rate risk management is especially important in 2026–27, given the potential for central banks to increase policy rates amid global economic uncertainty surrounding tariffs.
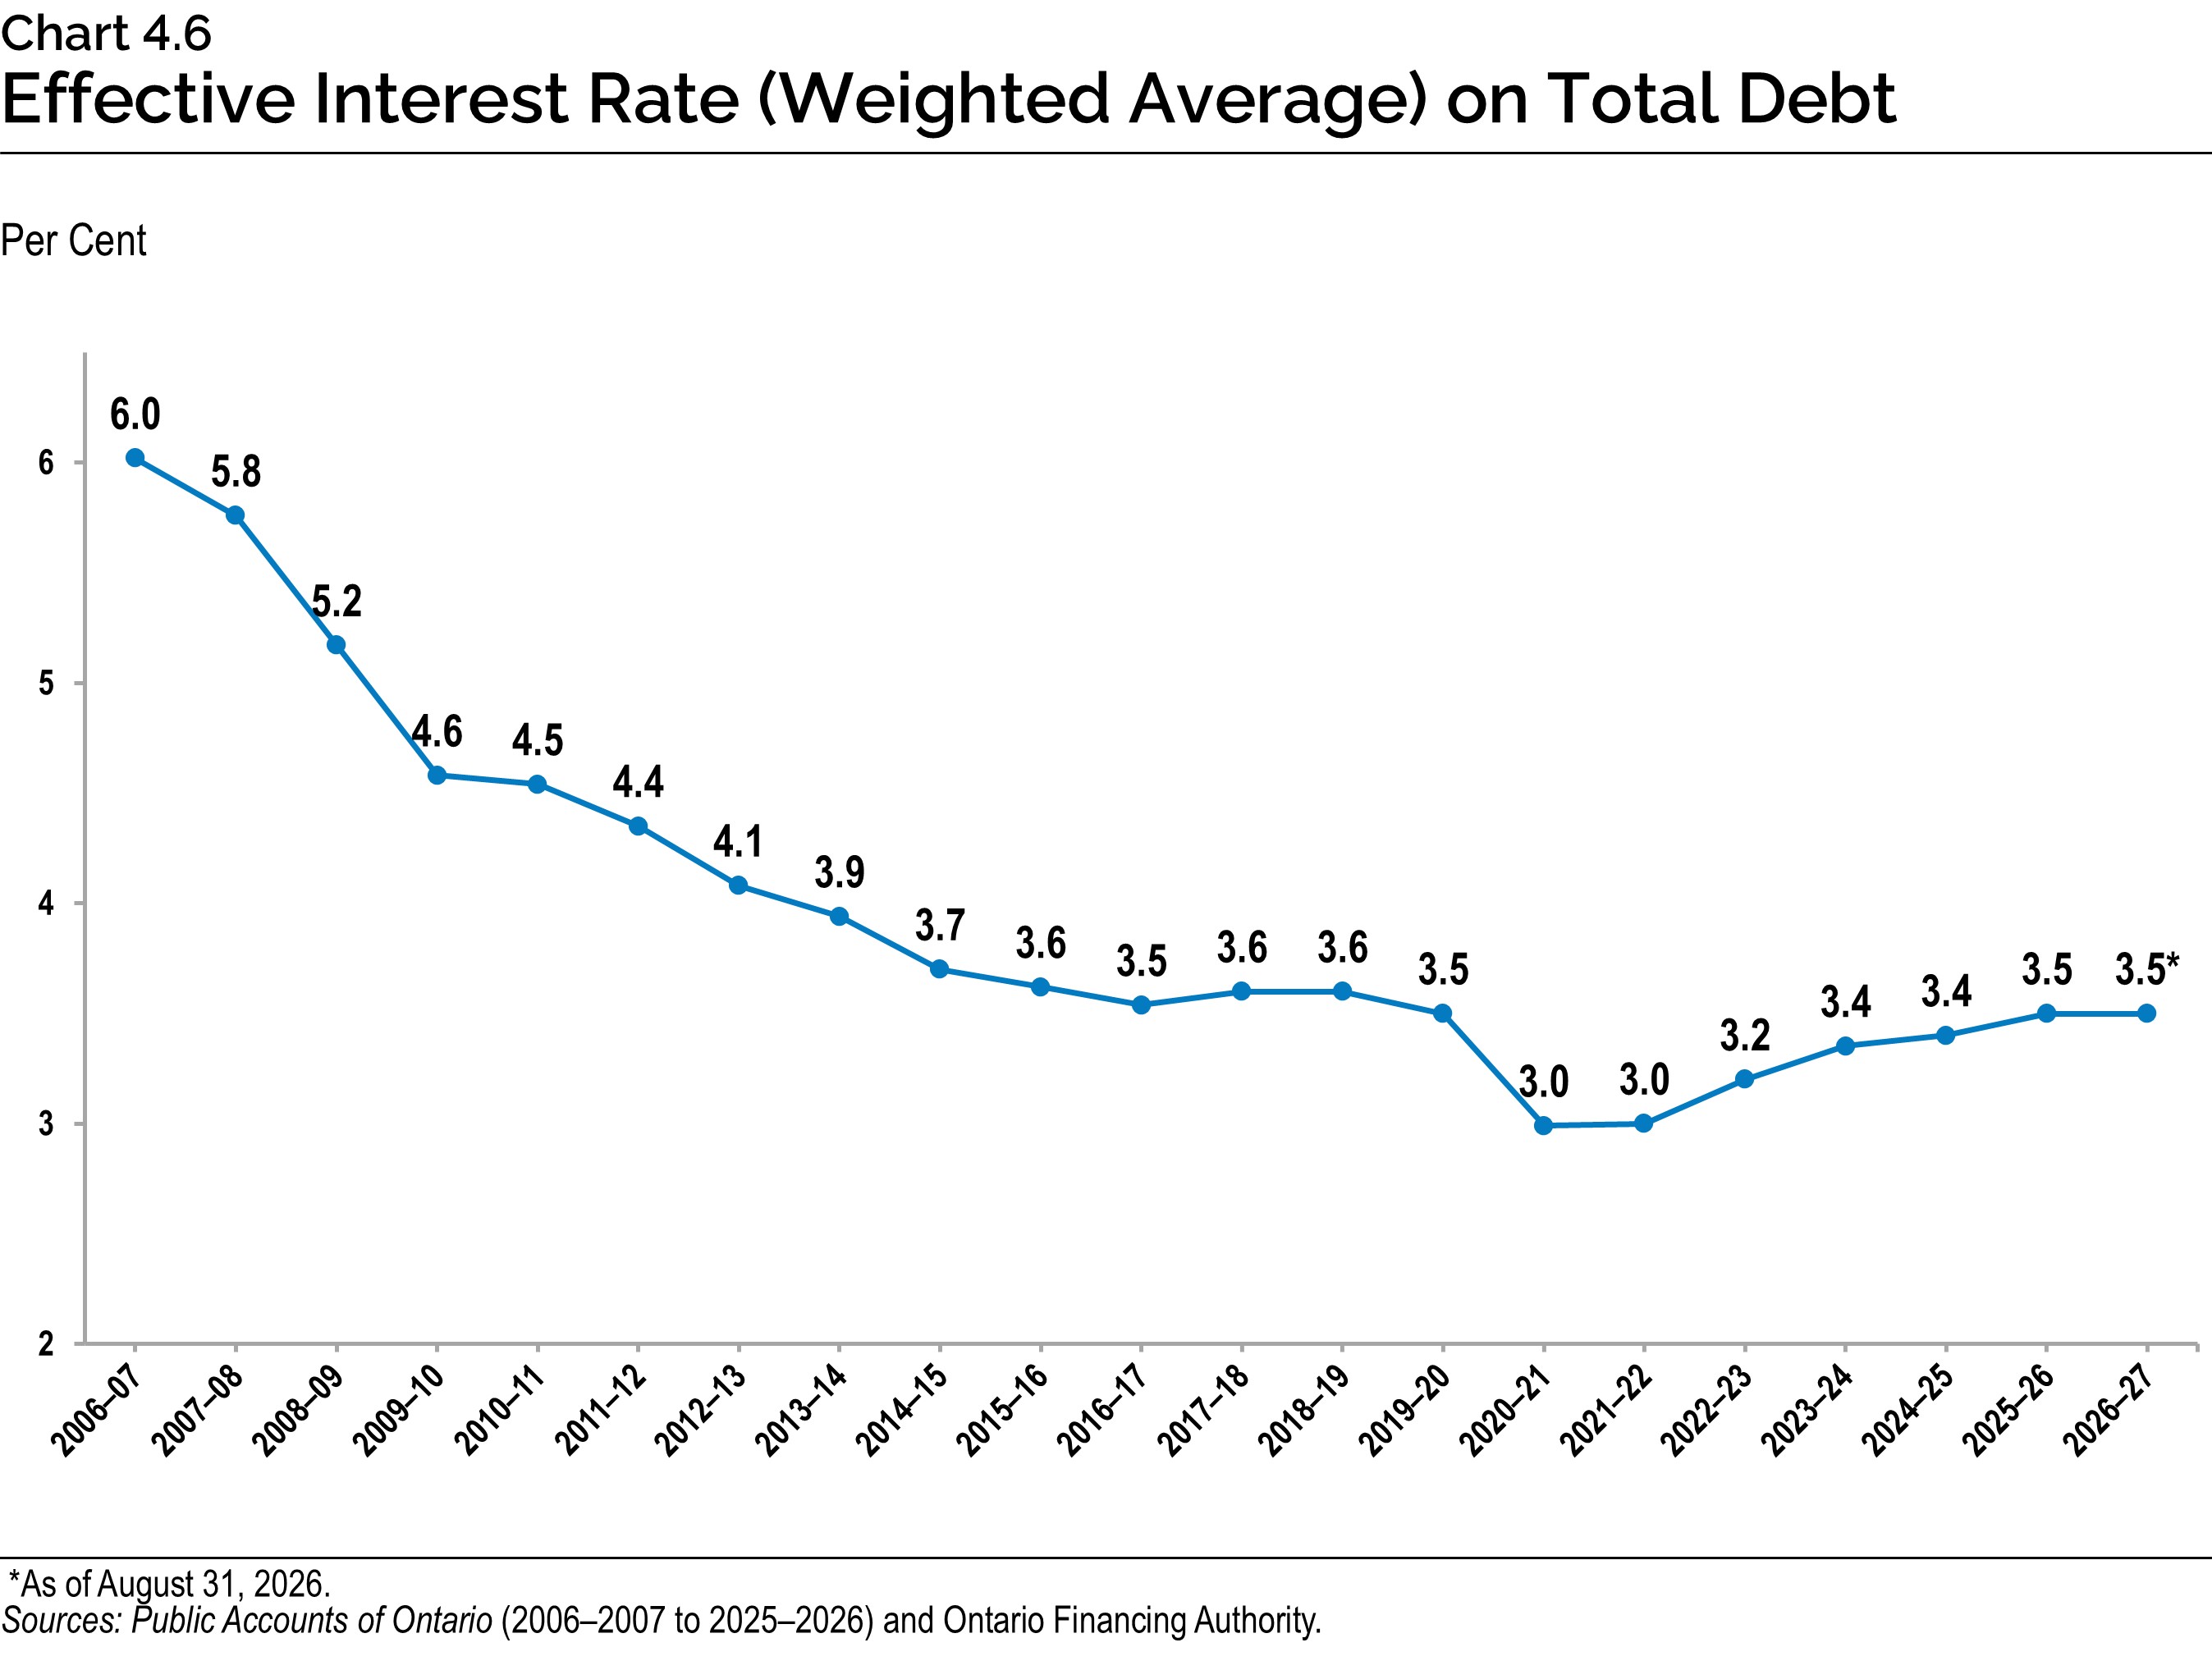
Chart 4.6 shows Ontario’s decision to lock in long-term rates and extend the term of its debt, since the Global Financial Crisis in 2007–08 has kept the weighted average interest rate on the total debt portfolio low in historical terms, despite broader market conditions.
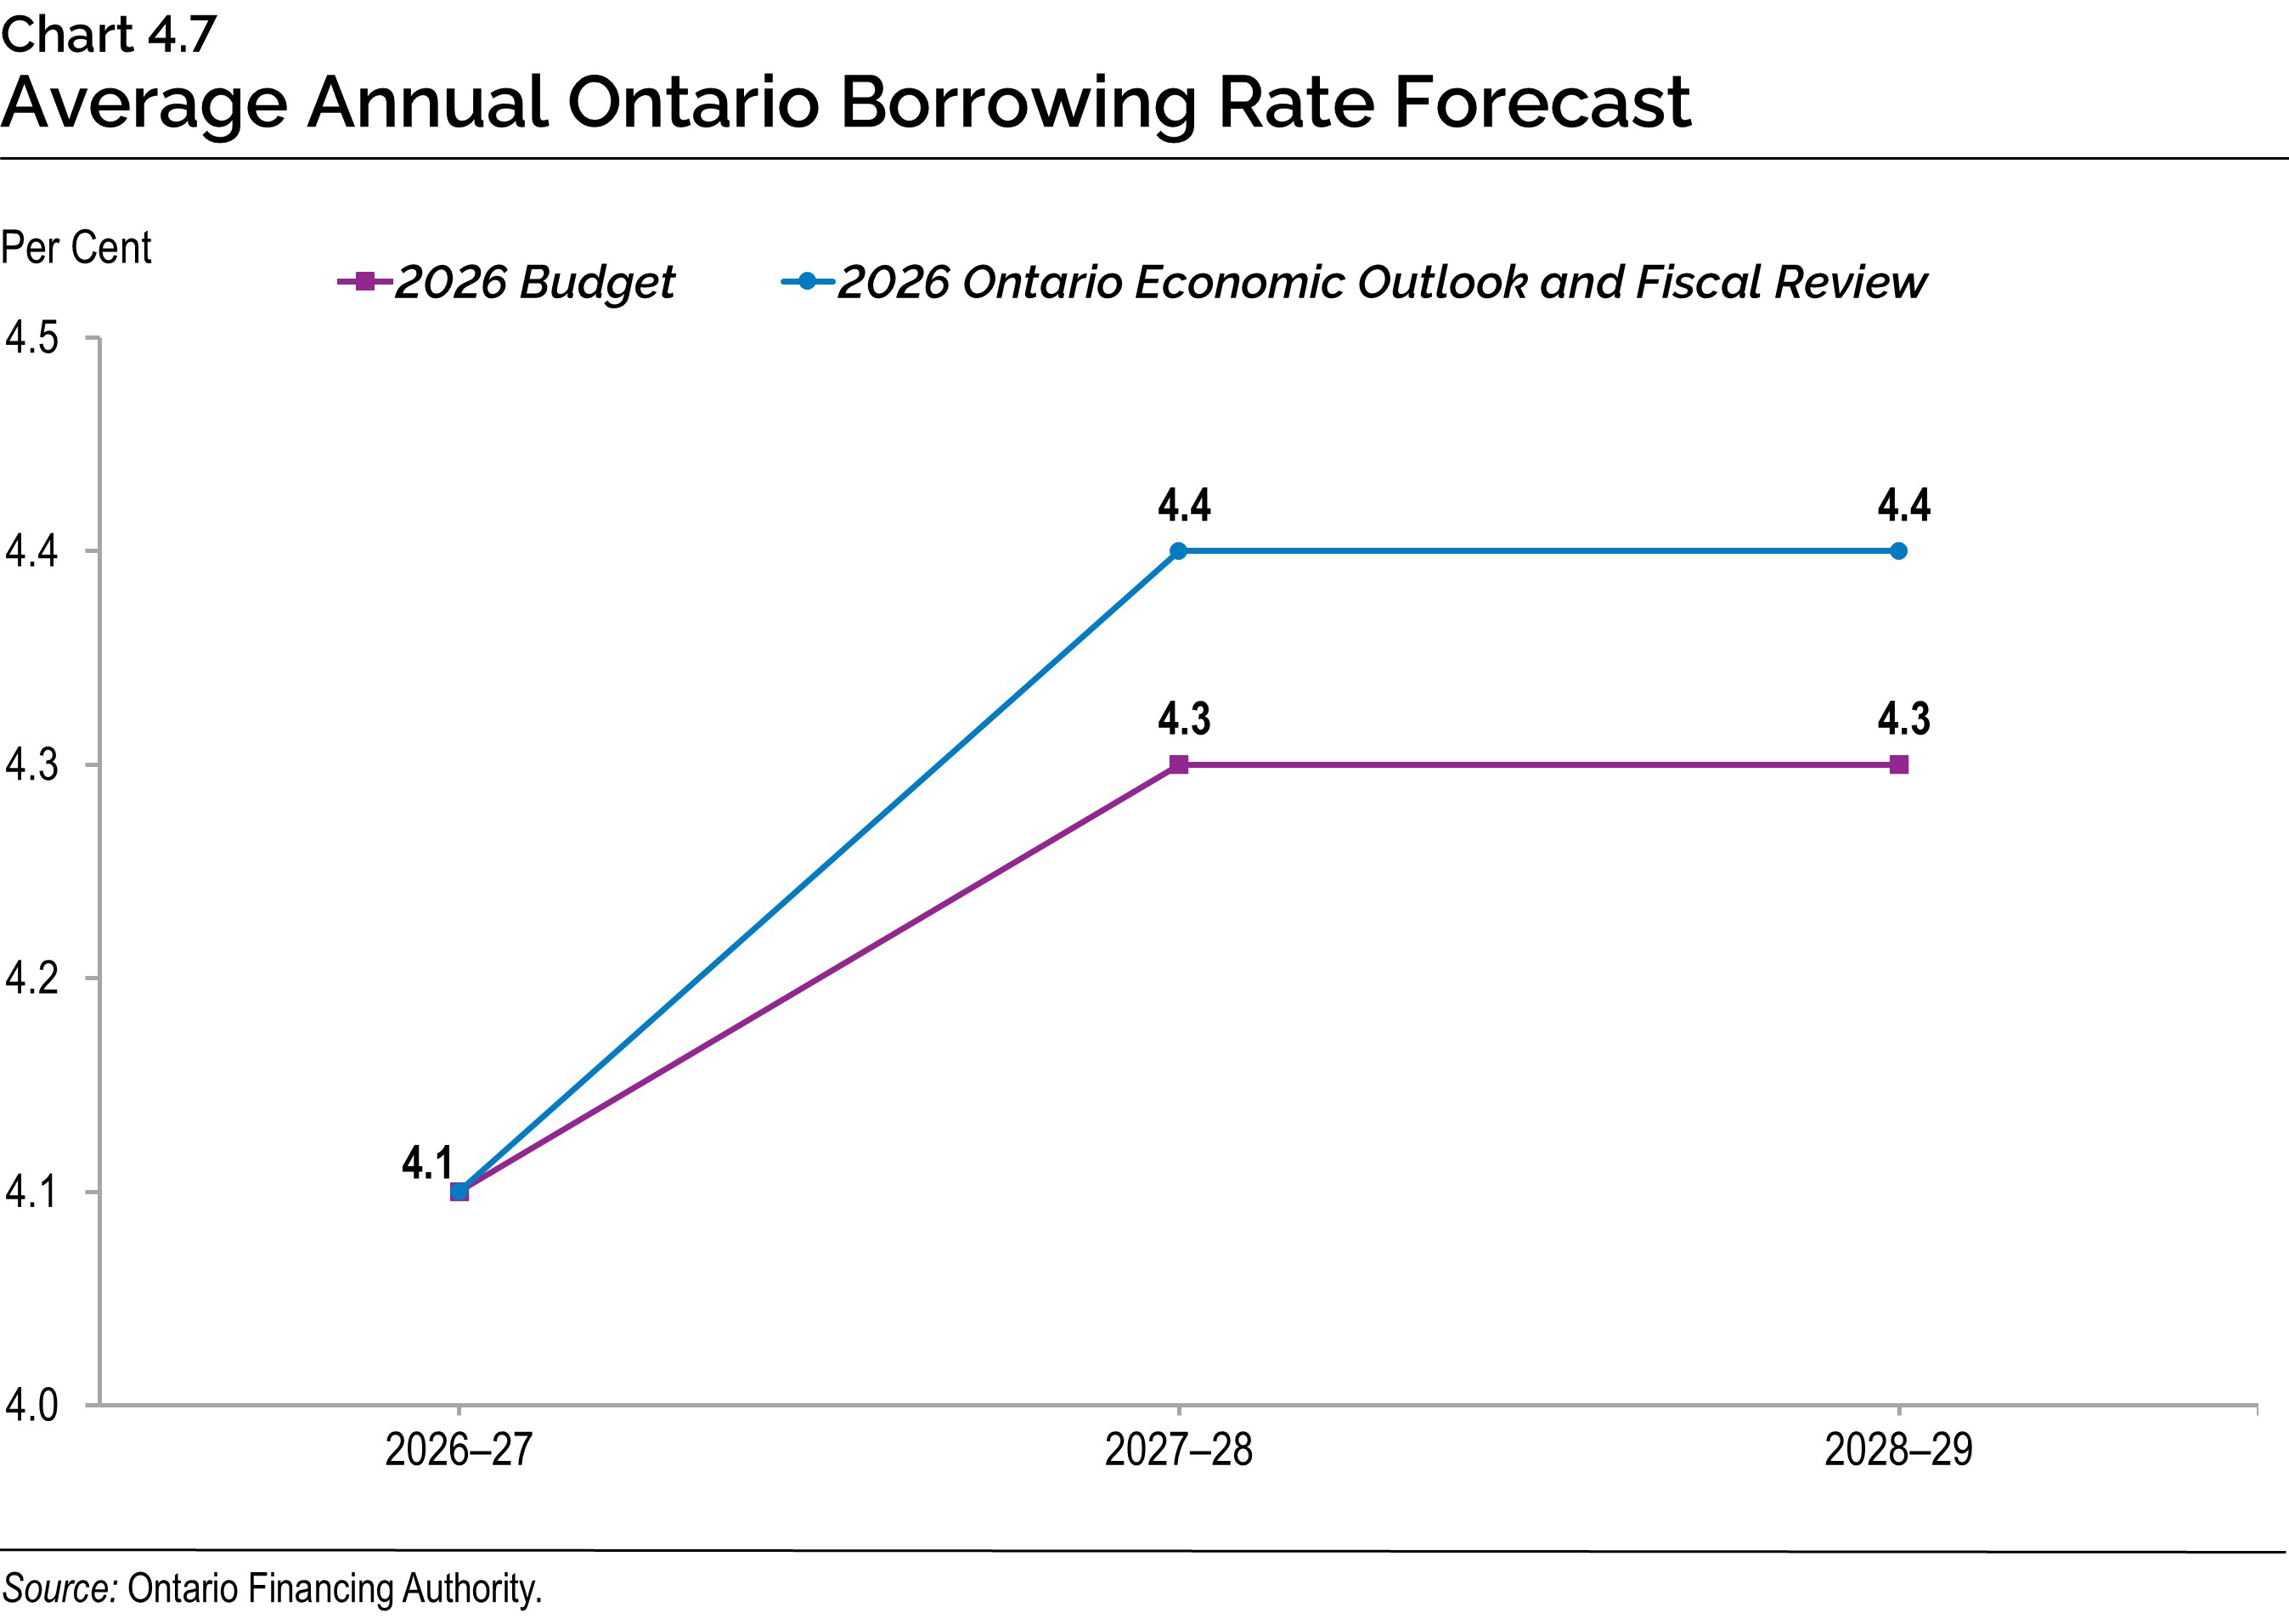
Ontario’s average borrowing rate for 2026–27 is estimated to be 4.1 per cent, unchanged from the 2026 Budget forecast. Borrowing rates for 2027–28 and 2028–29 are projected to be 10 basis points higher than the 2026 Budget forecast, reflecting rising government bond yields and the prospect of a sustained high interest rate environment.
A one percentage point change in interest rates, either up or down from the current forecast, is estimated to have a corresponding change in Ontario’s borrowing costs of approximately $0.9 billion in the first full year. Interest and Other Debt Servicing Charges (IOD) remains Ontario’s fourth largest expense after health care, education and social services.
The forecast for IOD is higher over the medium-term outlook due to an increase in borrowing combined with an increase in borrowing rates.
Term of Debt
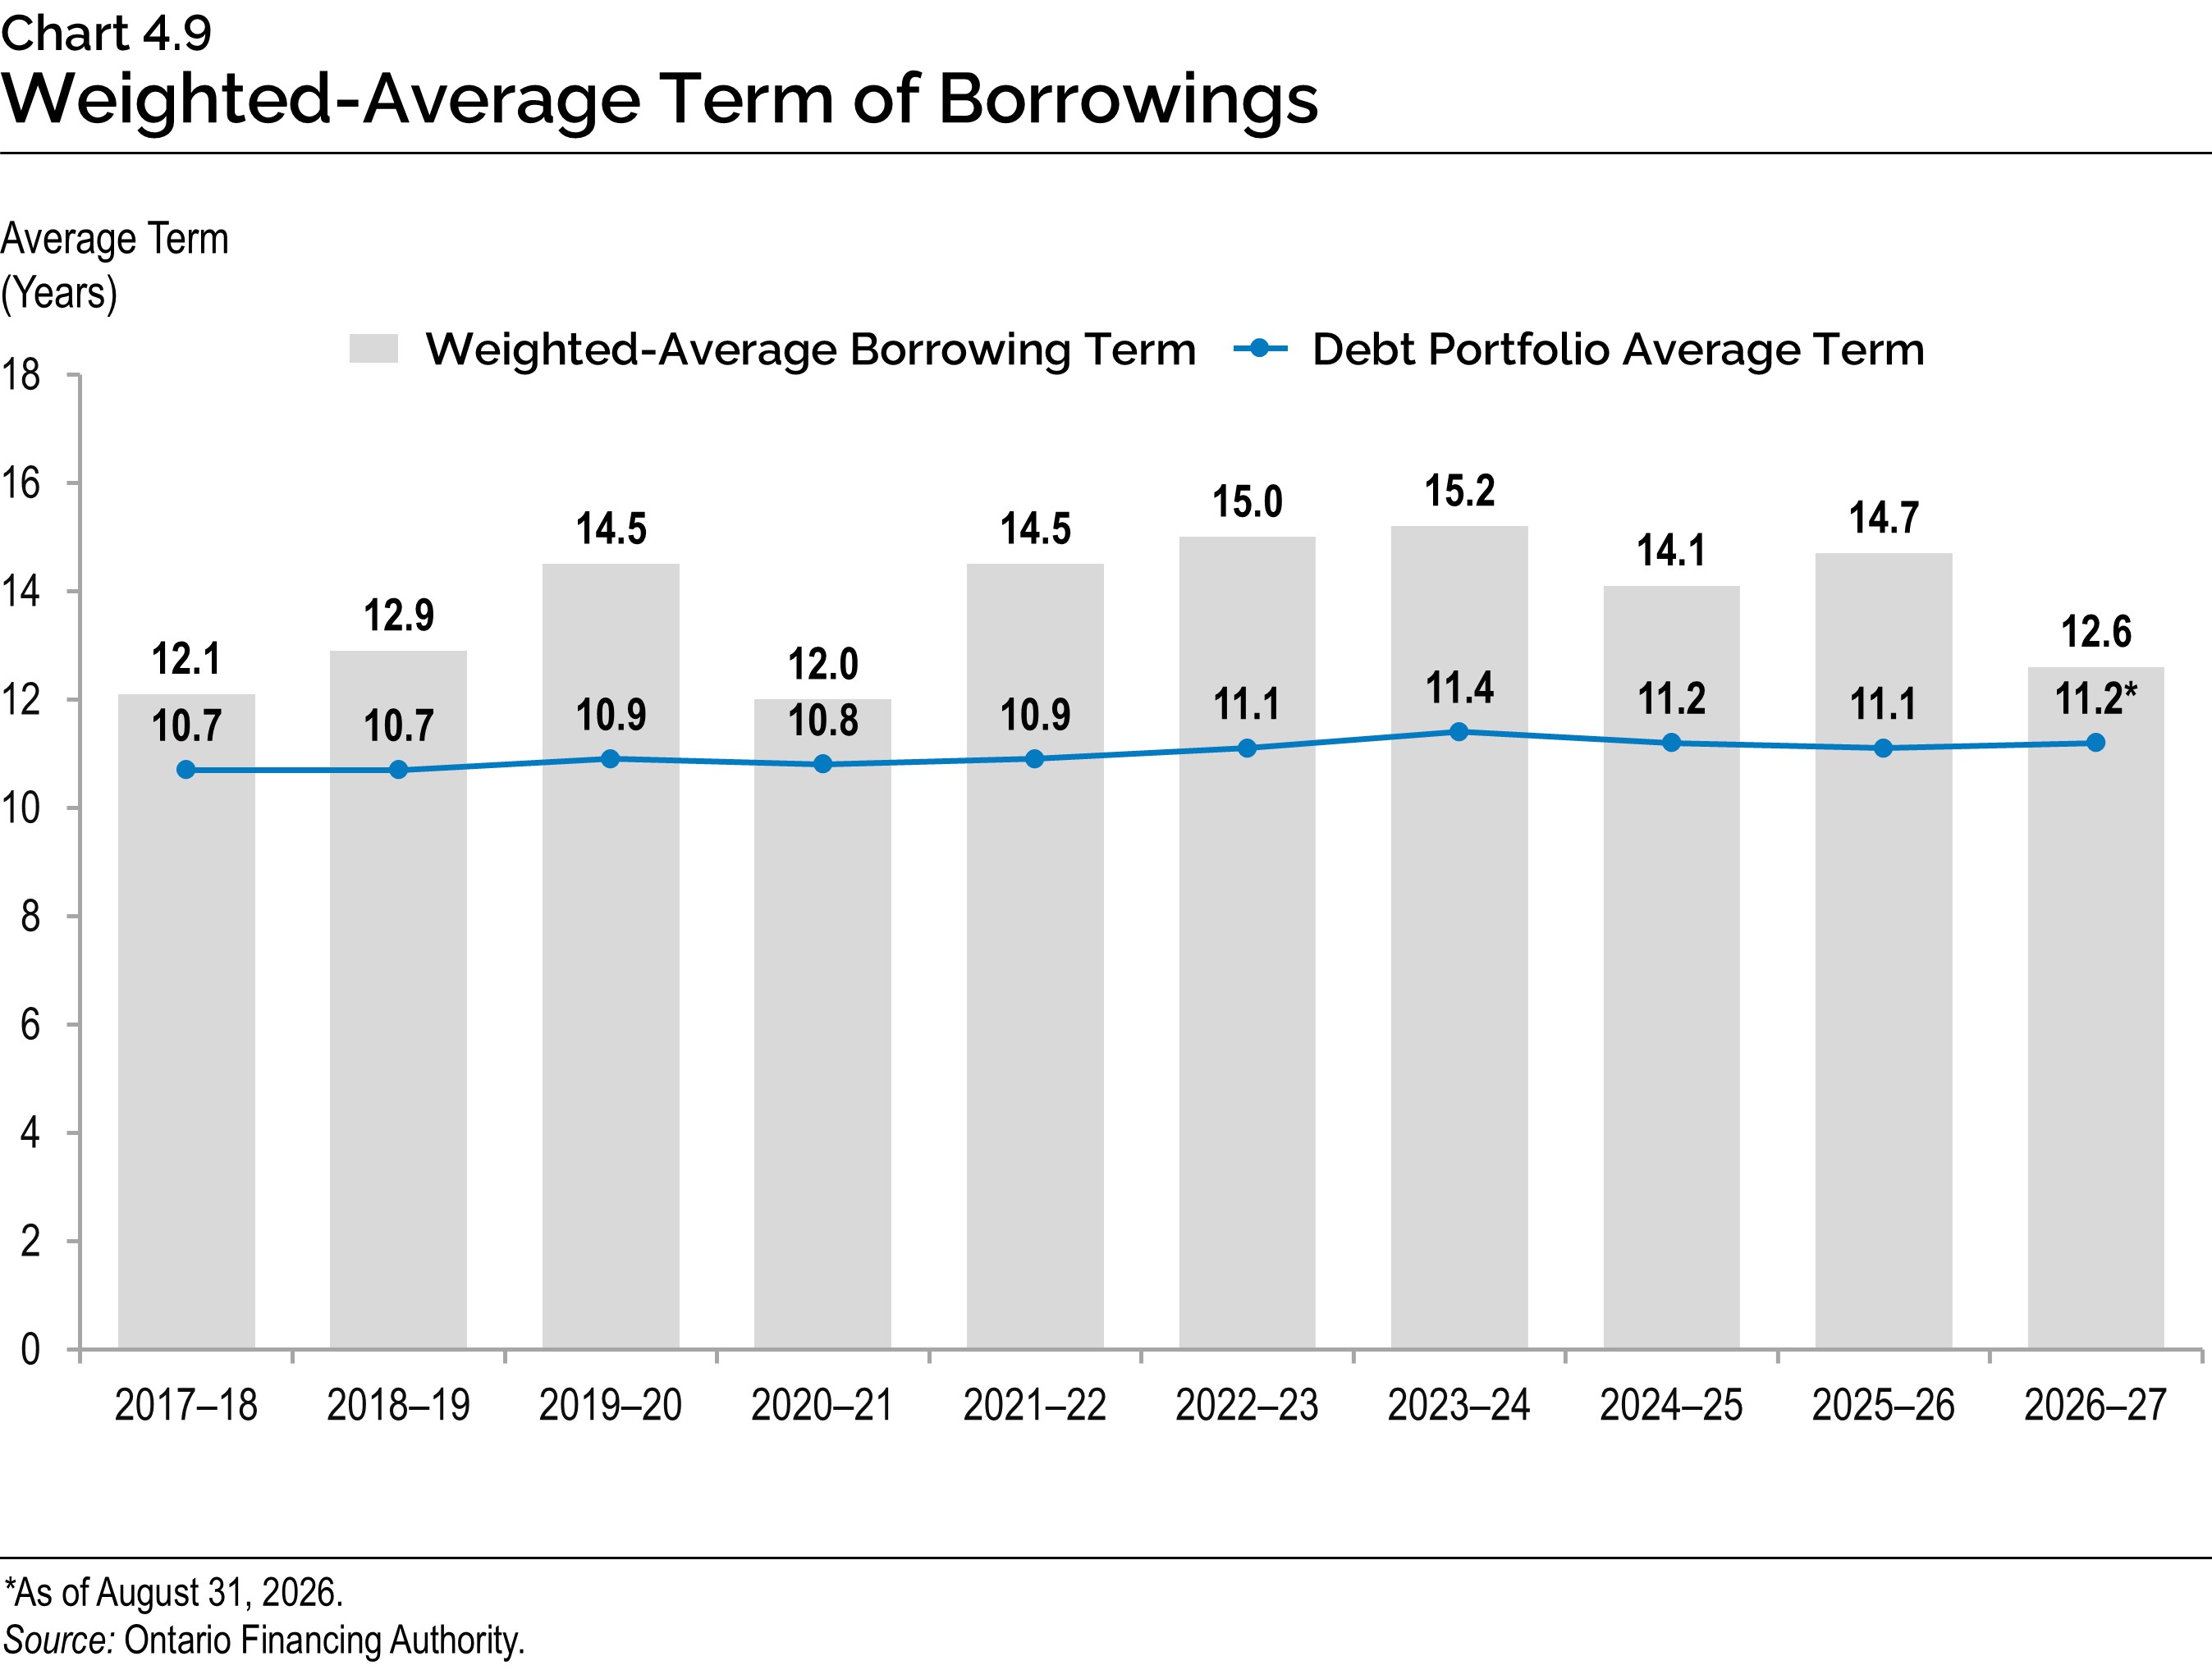
Ontario has continued to extend the term of its debt when investor demand has allowed, helping to reduce future refinancing risk. This also protects the IOD forecast in the long term against future interest rate increases. Since 2010–11, Ontario has issued over $167.1 billion of 30-year or longer bonds, representing almost one-third of total debt outstanding. This includes $6.3 billion issued in 2026–27.
Ontario’s successful extension of the term of its debt from the time of the Global Financial Crisis has created flexibility for managing its large borrowing program and debt portfolio. Due to the extension of the term of debt, the impact on IOD in the short and medium terms has been lessened. Ontario will continue to monitor the market and adjust the debt term strategy in response to further changes to interest rates and the yield curve.
Ensuring Adequate Liquidity Levels
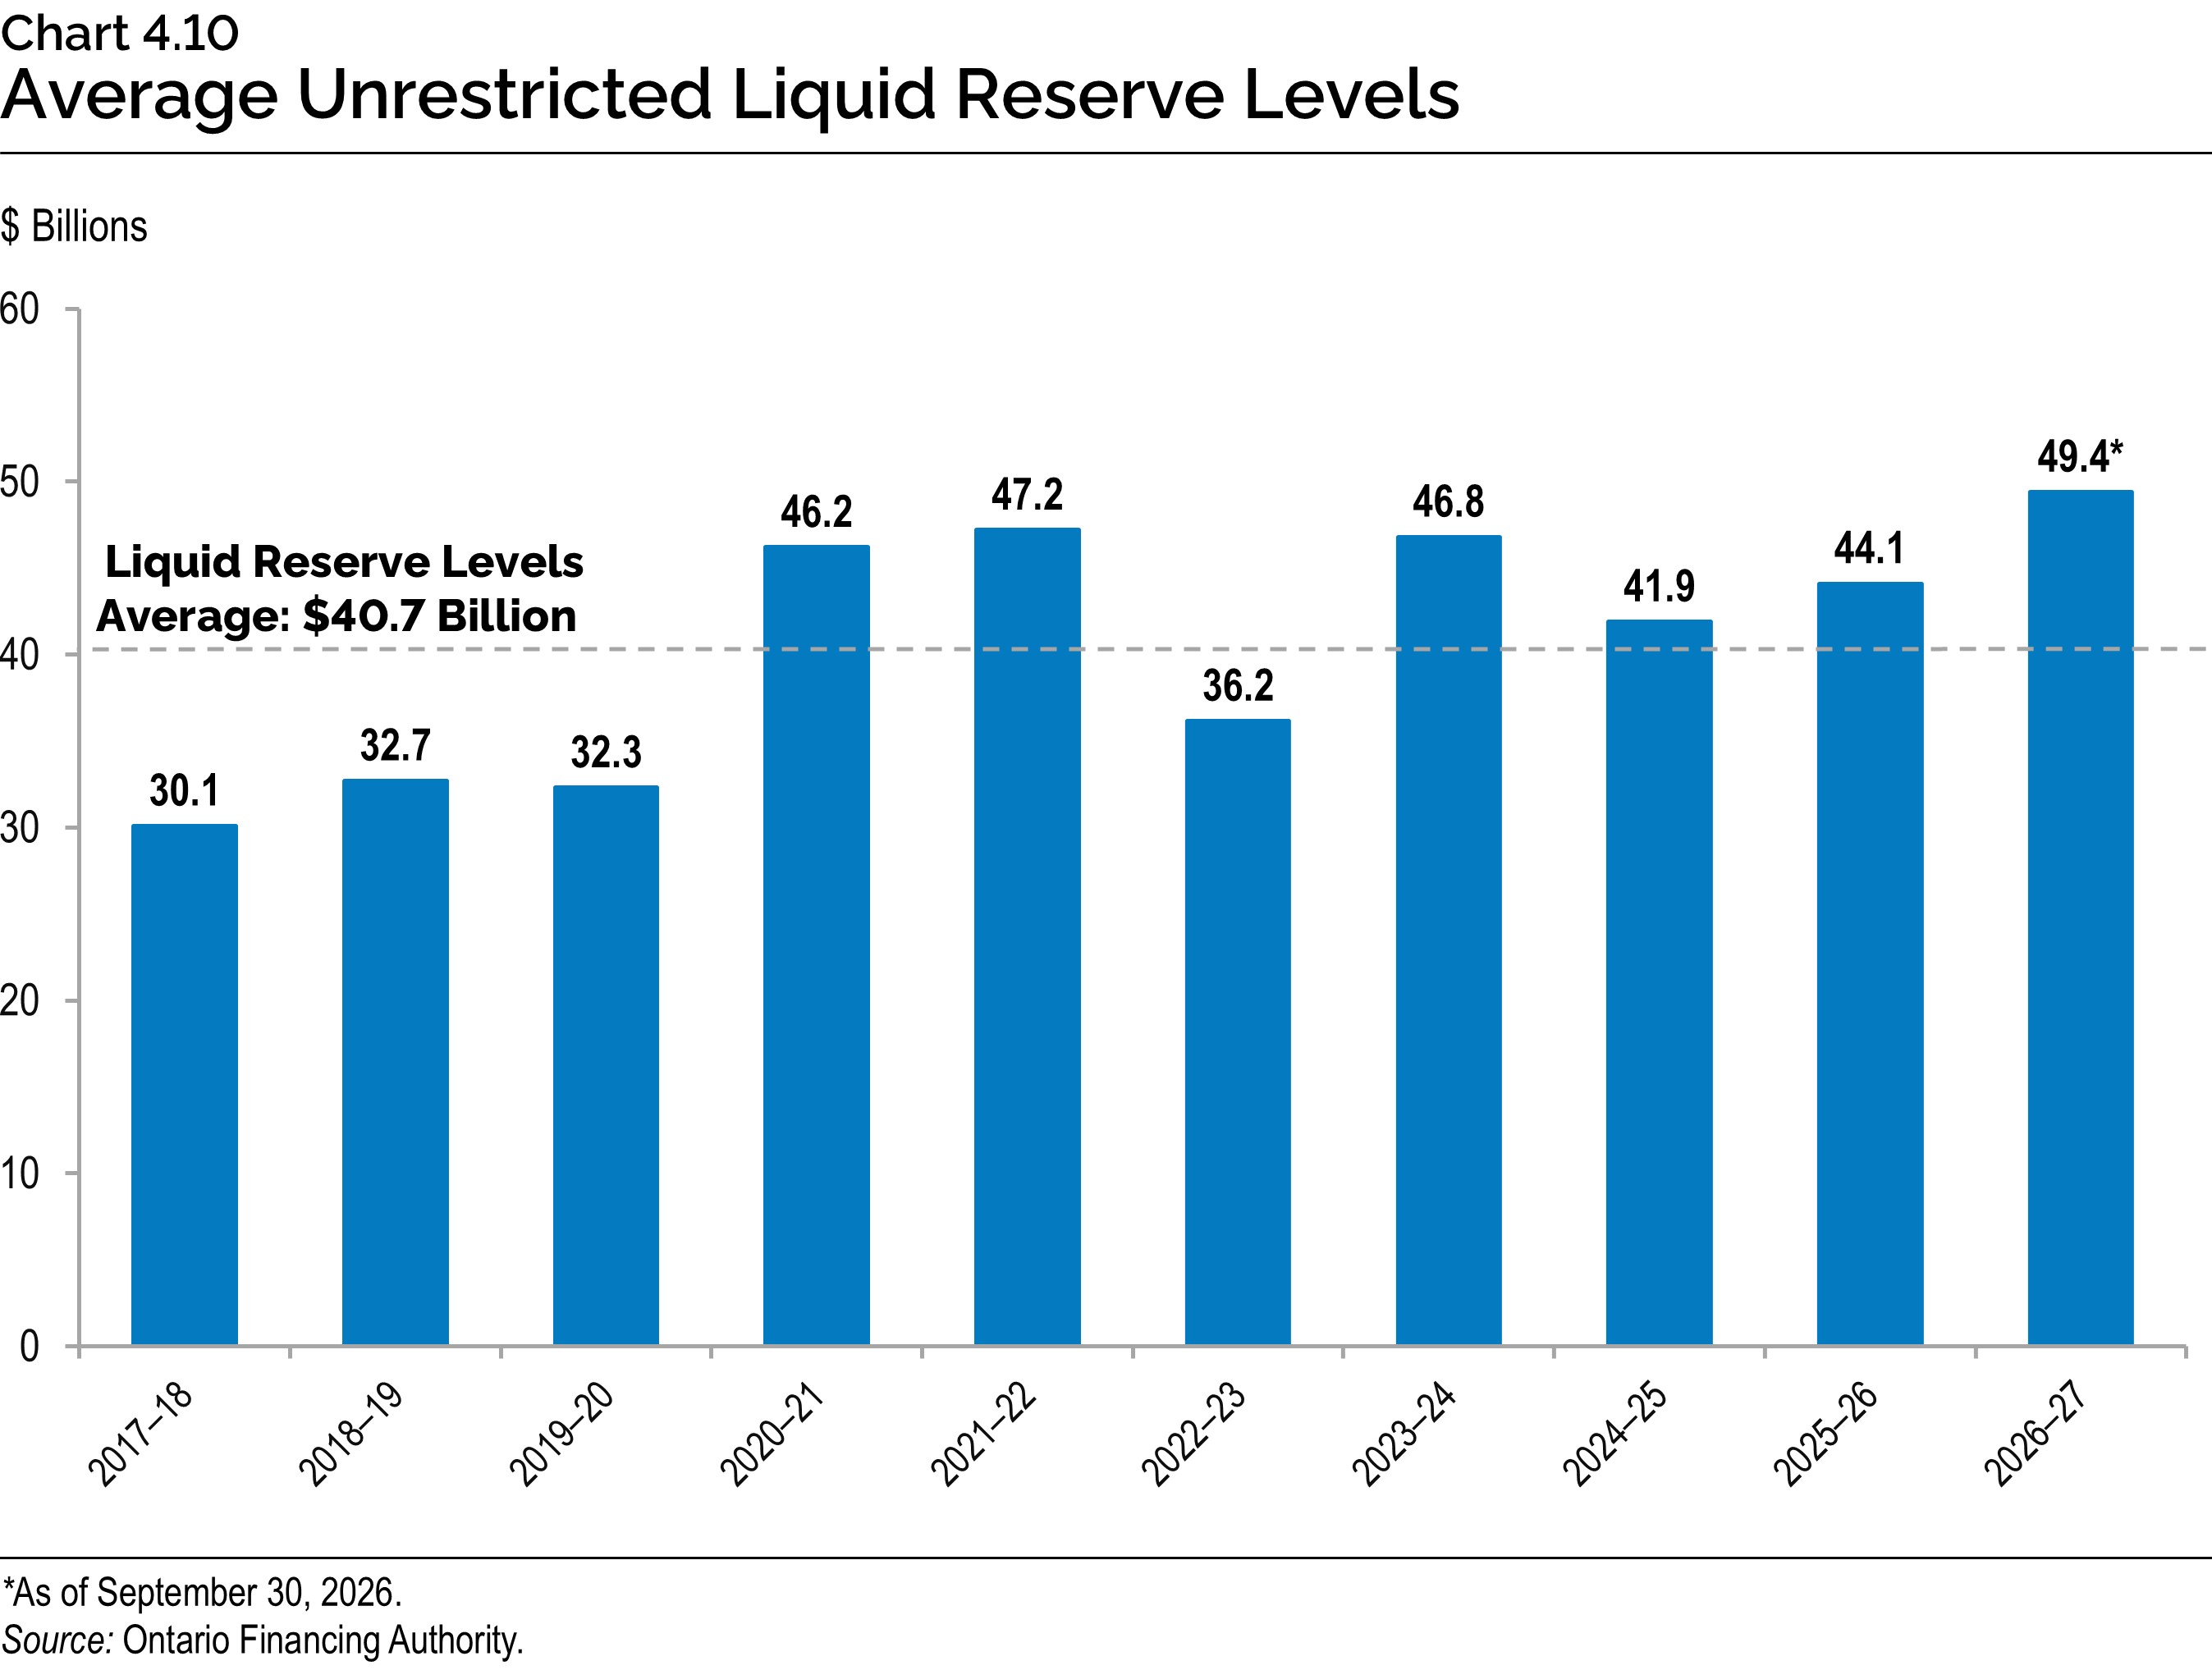
Ontario aims to maintain an optimal level of liquid reserves that balances carrying costs with the need to meet financial obligations in a timely manner and respond effectively to periods of economic stress or market disruption. To ensure abundant liquidity during the current period of economic uncertainty, the forecast for year-end cash and cash equivalents for 2026–27 has been changed from a decline of $8.0 billion to a decline of $5.0 billion.
As the yield curve has normalized, with short-term interest rates now below long-term rates, Ontario has increased the term profile of its liquid reserve portfolio. A new portfolio within the existing liquid reserves framework will hold longer-duration, high-quality securities that can be readily sold or used as collateral to generate short-term liquidity when needed. This approach enhances liquidity management, improves asset-liability alignment and reduces the overall carrying cost of liquid reserves.
Adequate liquid reserves combined with robust short-term funding programs provide Ontario with the liquidity, flexibility and market access needed to ensure the province can meet its obligations under all market conditions.
Debt Burden Reduction Strategy
The Debt Burden Reduction Strategy set out below provides the government’s progress and associated metrics required under the Fiscal Sustainability, Transparency and Accountability Act, 2019.
The government remains committed to reducing the debt burden while ensuring that Ontario’s finances are sustainable. Ontario continues to maintain its targets and make progress towards achieving them over the medium-term outlook.
Following the release of Ontario’s 2026 Budget, a new Public Sector Accounting Standard (PS 1202 Financial Statement Presentation) came into effect. The new standard updates how the government presents and discloses financial information.
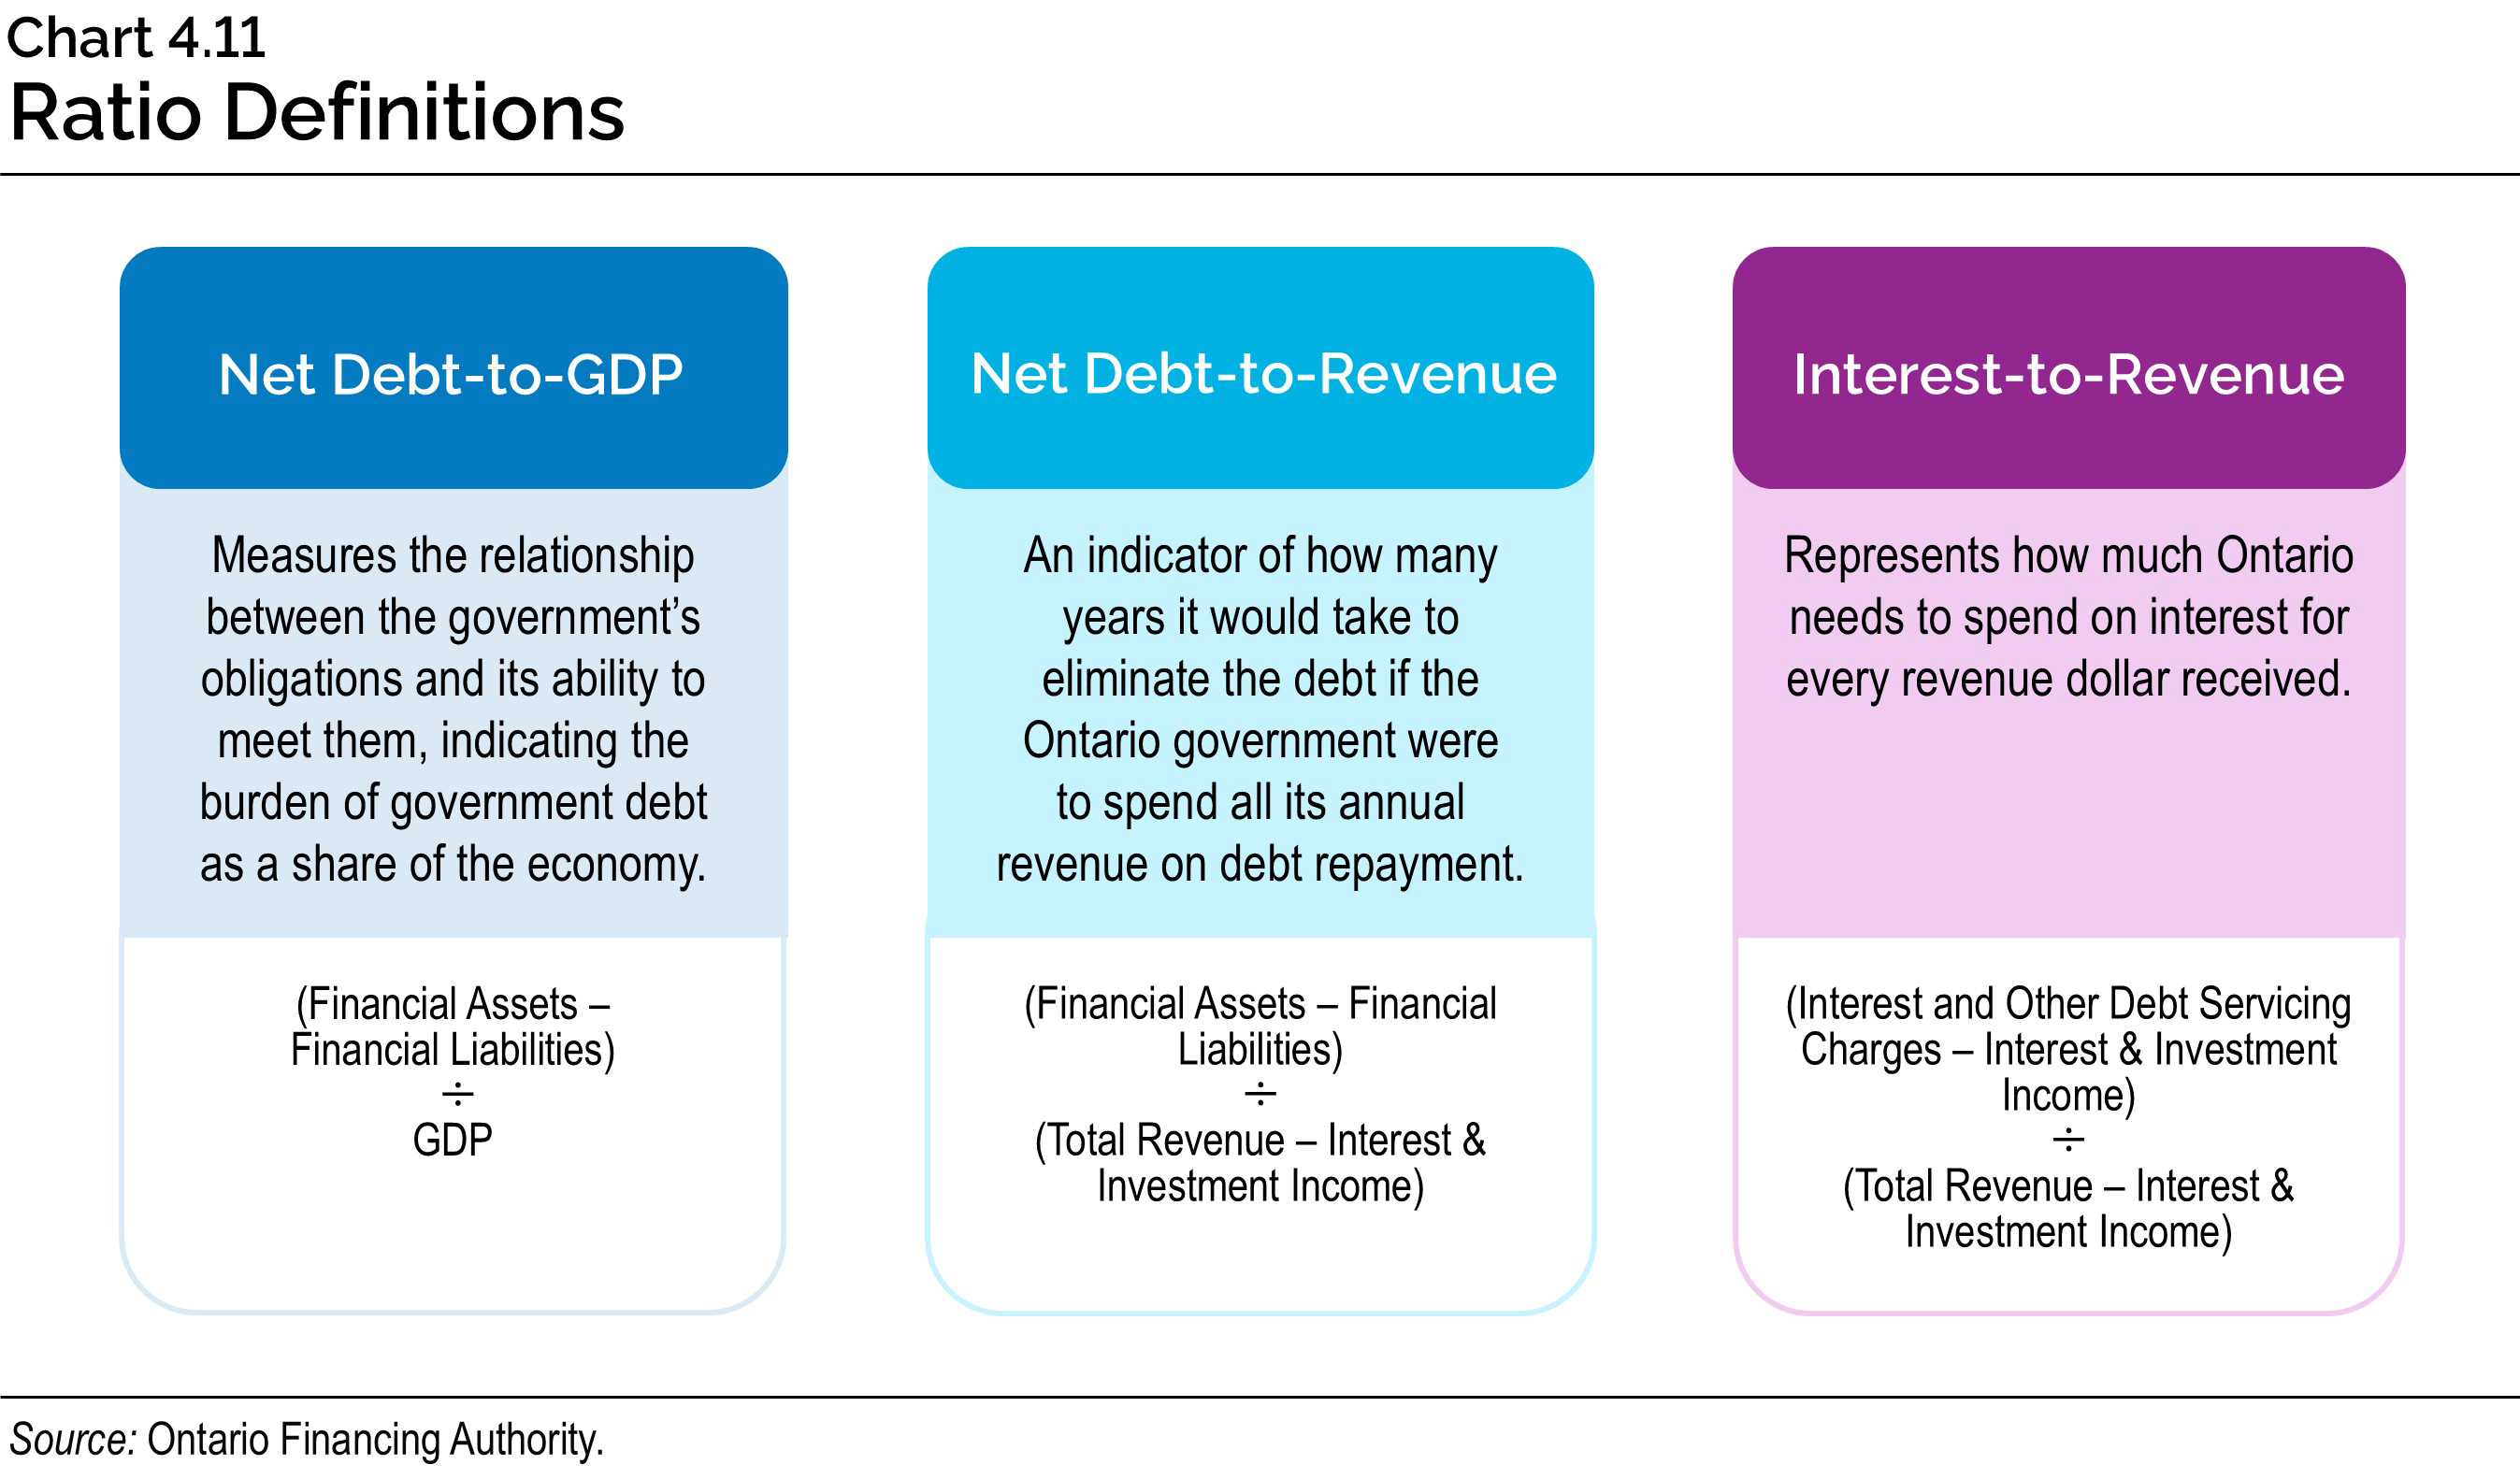
Chart 4.11 provides an overview of Ontario’s debt sustainability measures and the inputs and calculation method for each ratio.
| Item | Targets | 2026 Budget 2026–27 Forecast |
2026 FES 2026–27 Forecast |
|---|---|---|---|
| Net Debt-to-GDP | <40.0 | 37.7 | 37.4 |
| Net Debt-to-Revenue | <200 | 211 | 210 |
| Interest-to-Revenue | <7.5 | 6.7 | 6.7 |
Table 4.3 footnotes:
Note: 2026 FES in the table is defined as the 2026 Ontario Economic Outlook and Fiscal Review.
Source: Ontario Financing Authority.
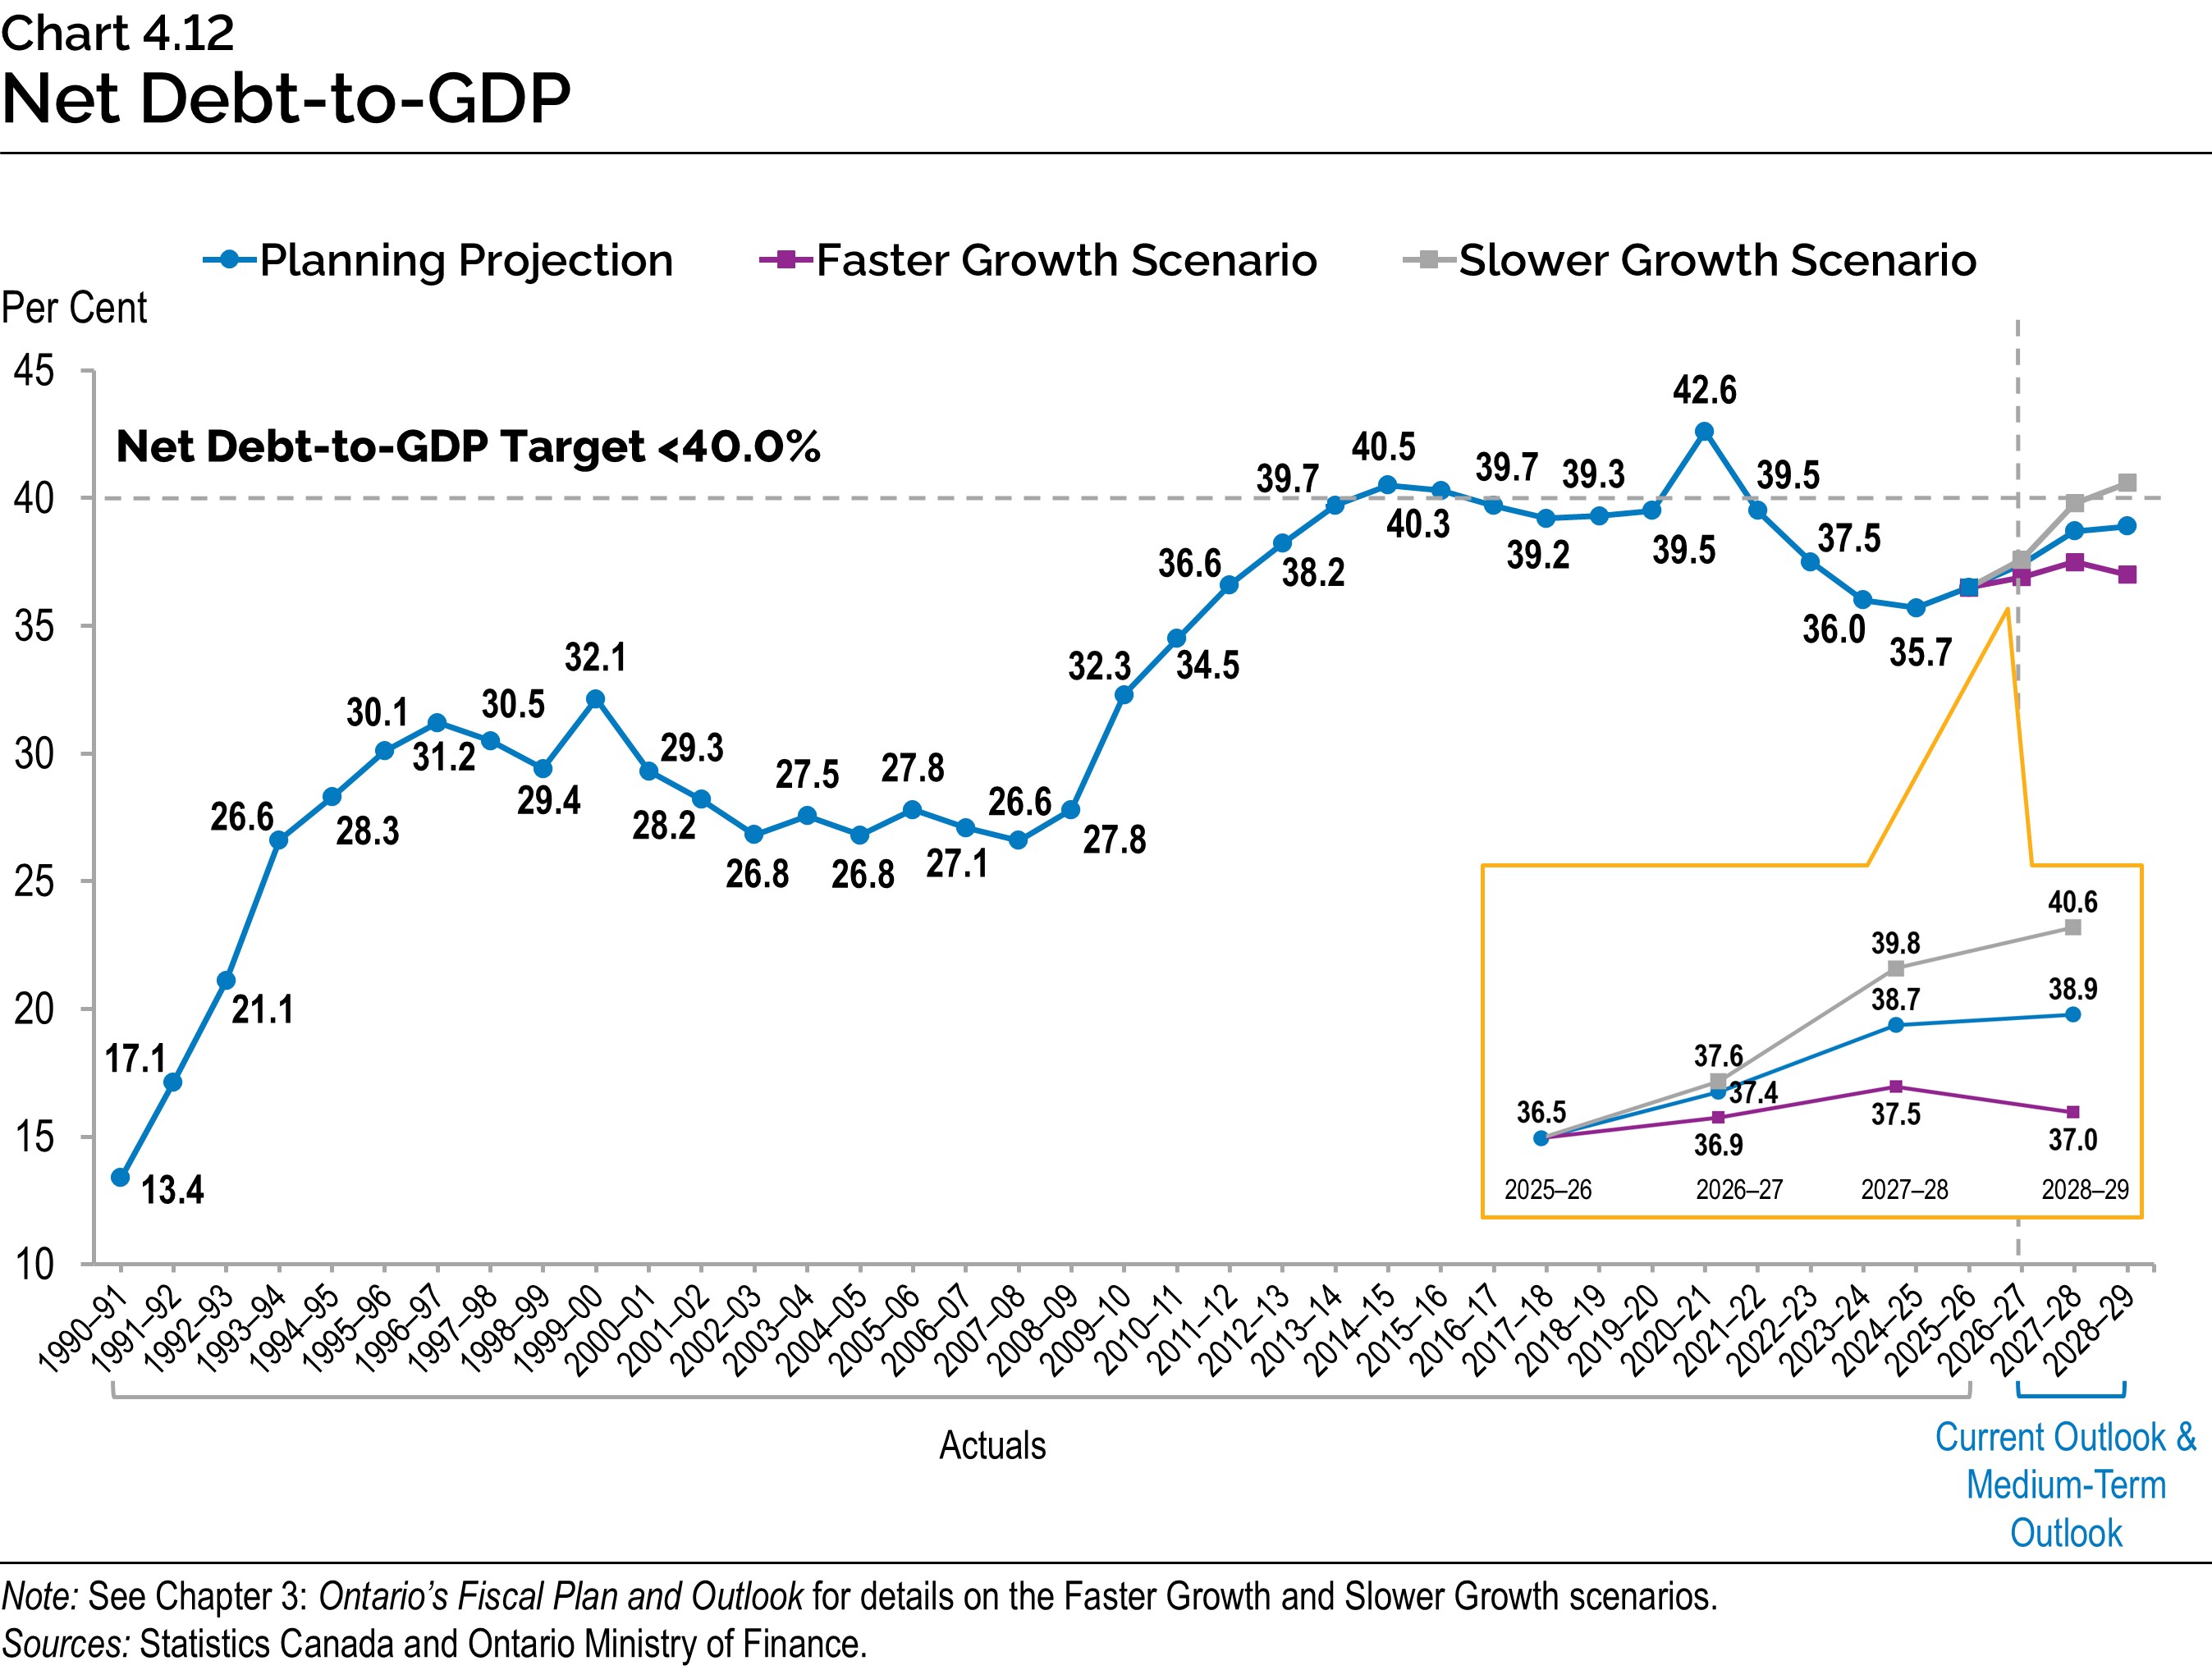
Ontario’s net debt‐to‐GDP ratio is forecast to be 37.4 per cent in 2026–27, a decrease of 0.3 percentage points from the 37.7 per cent forecast in the 2026 Budget. Over the medium-term outlook, the ratio is forecast to be 38.7 per cent in 2027–28 and 38.9 per cent in 2028–29, which is higher in both fiscal years when compared to the 2026 Budget forecast.
Over the medium-term outlook, the net debt‑to‑GDP ratio is forecast to stay below the target of 40.0 per cent, demonstrating that Ontario continues to manage the debt burden in a sustainable manner.
Ontario’s net debt-to-revenue ratio is forecast to be 210 per cent in 2026–27, a decrease of one percentage point from the 211 per cent forecast in the 2026 Budget. Over the medium-term outlook, this ratio is forecast to be 220 per cent in 2027–28 and 2028–29, which is higher in both fiscal years when compared to the 2026 Budget forecast. The government remains committed to achieving the 200 per cent target and has demonstrated its ability to do so as it did in fiscal years 2023–24 and 2024–25.
Ontario’s interest-to-revenue ratio is forecast to be 6.7 per cent in 2026–27, consistent with the forecast in the 2026 Budget. Over the medium-term outlook, this ratio is forecast to be 7.2 per cent in 2027–28 and 7.5 per cent in 2028–29, which is higher in both fiscal years when compared to the 2026 Budget forecast, but remains at, or below, the target of 7.5 per cent.
| Item | 2026–27 | 2027–28 | 2028–29 |
|---|---|---|---|
| Total Debt | 540,037 | 566,502 | 581,202 |
| Other Net Financial (Assets)/Liabilities | (72,543) | (63,927) | (56,921) |
| Broader Public Sector Net Debt | 16,335 | 17,114 | 17,545 |
| Net Debt | 483,829 | 519,689 | 541,826 |
| Non-Financial Assets | (208,884) | (232,024) | (247,485) |
| Accumulated Deficit | 274,945 | 287,665 | 294,341 |
Table 4.4 footnotes:
Note: Numbers may not add due to rounding.
Sources: Ontario Financing Authority and Ontario Ministry of Finance.
Chart Descriptions
Chart 4.1: Borrowing Outlook Scenarios for Long-Term Borrowing
| Year | 2025–26 | 2026–27 | 2027–28 | 2028–29 |
|---|---|---|---|---|
| Planning Projection | 58.6 | 51.1 | 48.0 | 45.4 |
| Slower Growth Scenario | 58.6 | 52.7 | 52.9 | 52.7 |
| Faster Growth Scenario | 58.6 | 48.3 | 42.6 | 37.9 |
Sources: Ontario Financing Authority and Ontario Ministry of Finance.
Chart 4.2: 2026–27 Borrowing
Long-term public borrowing of $36.3 billion has been completed so far for fiscal year 2026–27. This consisted of $21.0 billion (58 per cent) of Canadian dollar syndicated bonds, $1.0 billion (3 per cent) Canadian dollar Green Bond, $1.0 billion (3 per cent) Canadian dollar Green Floating Rate Note, $3.7 billion (10 per cent) of Euro bonds, $1.0 billion (3 per cent) of Australian dollar bond, $0.3 billion (1 per cent) of Swiss franc bond and $8.3 billion (23 per cent) of U.S. dollar bonds.
Note: Numbers may not add due to rounding.
Source: Ontario Financing Authority.
Chart 4.3: Domestic and International Borrowing
Ontario’s total long-term borrowing completed in 2026–27 is forecast to be $51.1 billion — $23.0 billion was borrowed in the Canadian dollar market and $13.3 billion was borrowed in foreign currencies, with $14.8 billion of borrowing remaining for 2026–27.
| Year | Canadian Dollar ($ Billions) | Foreign Currencies ($ Billions) | Total ($ Billions) |
|---|---|---|---|
| 2017–18 | 21.1 | 12.8 | 33.9 |
| 2018–19 | 30.6 | 9.0 | 39.6 |
| 2019–20 | 28.9 | 10.6 | 39.5 |
| 2020–21 | 39.1 | 20.7 | 59.8 |
| 2021–22 | 32.0 | 9.2 | 41.1 |
| 2022–23 | 28.5 | 3.7 | 32.2 |
| 2023–24 | 36.7 | 5.9 | 42.6 |
| 2024–25 | 39.1 | 10.5 | 49.5 |
| 2025–26 | 34.7 | 23.9 | 58.6 |
| 2026–27 | 23.0 | 13.3 | 51.1 |
Note: Numbers may not add due to rounding.
Source: Ontario Financing Authority.
Chart 4.4: Green Bond Allocation by Framework Category
A total of $26.5 billion in Green Bond funding has provided or will provide funding for 29 projects. Nine of those projects are under the Clean Transportation framework category and have received 88 per cent of the funding. Nineteen projects are under the Energy Efficiency category and have received 11 per cent of the funding. One project is under the Climate Change Adaptation category and has received 2 per cent of the funding.
Note: Numbers may not add due to rounding.
Source: Ontario Financing Authority.
Chart 4.5: Ontario Green Bond Issues
Ontario has cumulatively issued $26.5 billion of Green Bonds. Over 13 fiscal years, the peak annual issuance was $4.5 billion with Ontario issuing $2.0 billion in 2026–27.
| Year | 2014–15 | 2015–16 | 2016–17 | 2017–18 | 2018–19 | 2019–20 | 2020–21 | 2021–22 | 2022–23 | 2023–24 | 2024–25 | 2025–26 | 2026–27 |
|---|---|---|---|---|---|---|---|---|---|---|---|---|---|
| Annual Issuance ($) | $0.5 billion | $0.75 billion | $0.8 billion | $1.0 billion | $0.95 billion | $1.25 billion |
$2.75 billion | $4.5 billion | $2.5 billion | $3.0 billion | $3.5 billion | $3.1 billion | $2.0 billion |
| Cumulative Issuance ($) | $0.5 billion | $1.25 billion | $2.05 billion | $3.05 billion | $4.0 billion | $5.25 billion | $8.0 billion | $12.5 billion | $15.0 billion | $18.0 billion | $21.5 billion | $24.6 billion | $26.5 billion |
Note: Numbers may not add due to rounding.
Source: Ontario Financing Authority.
Chart 4.6: Effective Interest Rate (Weighted Average) on Total Debt
As of August 31, 2026, the effective interest rate (calculated as a weighted average) for fiscal year-end is forecast to be 3.5 per cent on Ontario’s total debt.
| Year | Effective Interest Rate (%) |
|---|---|
| 2006–07 | 6.0 |
| 2007–08 | 5.8 |
| 2008–09 | 5.2 |
| 2009–10 | 4.6 |
| 2010–11 | 4.5 |
| 2011–12 | 4.4 |
| 2012–13 | 4.1 |
| 2013–14 | 3.9 |
| 2014–15 | 3.7 |
| 2015–16 | 3.6 |
| 2016–17 | 3.5 |
| 2017–18 | 3.6 |
| 2018–19 | 3.6 |
| 2019–20 | 3.5 |
| 2020–21 | 3.0 |
| 2021–22 | 3.0 |
| 2022–23 | 3.2 |
| 2023–24 | 3.4 |
| 2024–25 | 3.4 |
| 2025–26 | 3.5 |
| 2026–27 | 3.5* |
*As of August 31, 2026.
Sources: Public Accounts of Ontario (2006–2007 to 2025–2026) and Ontario Financing Authority.
Chart 4.7: Average Annual Ontario Borrowing Rate Forecast
| Year | 2026 Ontario Economic Outlook and Fiscal Review (%) |
2026 Budget (%) |
|---|---|---|
| 2026–27 | 4.1 | 4.1 |
| 2027–28 | 4.4 | 4.3 |
| 2028–29 | 4.4 | 4.3 |
Source: Ontario Financing Authority.
Chart 4.8: Comparison of Interest and Other Debt Servicing Charges Forecast
| Year | 2026 Ontario Economic Outlook and Fiscal Review ($ Billions) |
2026 Budget ($ Billions) |
|---|---|---|
| 2025–26 | 15.5* | 15.5* |
| 2026–27 | 17.4 | 17.2 |
| 2027–28 | 18.9 | 18.6 |
| 2028–29 | 20.4 | 19.7 |
*Public Accounts of Ontario 2025–2026.
Source: Ontario Financing Authority.
Chart 4.9: Weighted-Average Term of Borrowings
The average term of Ontario’s debt portfolio has been extended from 10.7 years in 2017–18 to 11.2 years in 2026–27. The weighted-average borrowing term for 2026–27 was 12.6 years as of October 8, 2026.
| Year | Weighted-Average Borrowing Term (Years) | Debt Portfolio Average Term (Years) |
|---|---|---|
| 2017–18 | 12.1 | 10.7 |
| 2018–19 | 12.9 | 10.7 |
| 2019–20 | 14.5 | 10.9 |
| 2020–21 | 12 | 10.8 |
| 2021–22 | 14.5 | 10.9 |
| 2022–23 | 15 | 11.1 |
| 2023–24 | 15.2 | 11.4 |
| 2024–25 | 14.1 | 11.2 |
| 2025–26 | 14.7 | 11.1 |
| 2026–27 | 12.6 | 11.2* |
* As of August 31, 2026.
Source: Ontario Financing Authority.
Chart 4.10: Average Unrestricted Liquid Reserve Levels
Average unrestricted liquid reserve levels are forecast to be $49.4 billion as of September 30, 2026.
| Year | Average Unrestricted Liquid Reserve Levels ($ billions) |
|---|---|
| 2017–18 | 30.1 |
| 2018–19 | 32.7 |
| 2019–20 | 32.3 |
| 2020–21 | 46.2 |
| 2021–22 | 47.2 |
| 2022–23 | 36.2 |
| 2023–24 | 46.8 |
| 2024–25 | 41.9 |
| 2025–26 | 44.1 |
| 2026–27 | 49.4* |
* As of September 30, 2026.
Source: Ontario Financing Authority.
Chart 4.11: Ratio Definitions
Net Debt-to-Gross Domestic Product (GDP) measures the relationship between the government’s obligations and its ability to meet them, indicating the burden of government debt as a share of the economy. It is calculated by (Financial Assets – Financial Liabilities) ÷ GDP.
Net Debt-to-Revenue is an indicator of how many years it would take to eliminate the debt if the Ontario government were to spend all its annual revenue on debt repayment. It is calculated by (Financial Assets – Financial Liabilities) ÷ (Total Revenue – Interest & Investment Income).
Interest-to-Revenue represents how much Ontario needs to spend on interest for every revenue dollar received. It is calculated by (Interest and Other Debt Servicing Charges – Interest & Investment Income) ÷ (Total Revenue – Interest & Investment Income).
Source: Ontario Financing Authority.
Chart 4.12: Net Debt-to-GDP
Ontario’s net debt-to-GDP ratio is forecast to be 37.4 per cent in 2026–27.
| Year | Planning Projection (%) |
Faster Growth Scenario (%) |
Slower Growth Scenario (%) |
|---|---|---|---|
| 1990–91 | 13.4 | – | – |
| 1991–92 | 17.1 | – | – |
| 1992–93 | 21.1 | – | – |
| 1993–94 | 26.6 | – | – |
| 1994–95 | 28.3 | – | – |
| 1995–96 | 30.1 | – | – |
| 1996–97 | 31.2 | – | – |
| 1997–98 | 30.5 | – | – |
| 1998–99 | 29.4 | – | – |
| 1999–00 | 32.1 | – | – |
| 2000–01 | 29.3 | – | – |
| 2001–02 | 28.2 | – | – |
| 2002–03 | 26.8 | – | – |
| 2003–04 | 27.5 | – | – |
| 2004–05 | 26.8 | – | – |
| 2005–06 | 27.8 | – | – |
| 2006–07 | 27.1 | – | – |
| 2007–08 | 26.6 | – | – |
| 2008–09 | 27.8 | – | – |
| 2009–10 | 32.3 | – | – |
| 2010–11 | 34.5 | – | – |
| 2011–12 | 36.6 | – | – |
| 2012–13 | 38.2 | – | – |
| 2013–14 | 39.7 | – | – |
| 2014–15 | 40.5 | – | – |
| 2015–16 | 40.3 | – | – |
| 2016–17 | 39.7 | – | – |
| 2017–18 | 39.2 | – | – |
| 2018–19 | 39.3 | – | – |
| 2019–20 | 39.5 | – | – |
| 2020–21 | 42.6 | – | – |
| 2021–22 | 39.5 | – | – |
| 2022–23 | 37.5 | – | – |
| 2023–24 | 36.0 | – | – |
| 2024–25 | 35.7 | – | – |
| 2025–26 | 36.5 | – | – |
| 2026–27 | 37.4 | 36.9 | 37.6 |
| 2027–28 | 38.7 | 37.5 | 39.8 |
| 2028–29 | 38.9 | 37.0 | 40.6 |
Note: See Chapter 3: Ontario’s Fiscal Plan and Outlook for details on the Faster Growth and Slower Growth scenarios.
Sources: Statistics Canada and Ontario Ministry of Finance.
Chart 4.13: Net Debt-to-Revenue
Ontario’s net debt-to-revenue ratio is forecast to be 210 per cent in 2026–27.
| Year | Planning Projection (%) |
Faster Growth Scenario (%) |
Slower Growth Scenario (%) |
|---|---|---|---|
| 1990–91 | 78 | – | – |
| 1991–92 | 104 | – | – |
| 1992–93 | 126 | – | – |
| 1993–94 | 157 | – | – |
| 1994–95 | 168 | – | – |
| 1995–96 | 176 | – | – |
| 1996–97 | 187 | – | – |
| 1997–98 | 184 | – | – |
| 1998–99 | 182 | – | – |
| 1999–00 | 189 | – | – |
| 2000–01 | 183 | – | – |
| 2001–02 | 183 | – | – |
| 2002–03 | 177 | – | – |
| 2003–04 | 188 | – | – |
| 2004–05 | 170 | – | – |
| 2005–06 | 162 | – | – |
| 2006–07 | 153 | – | – |
| 2007–08 | 146 | – | – |
| 2008–09 | 164 | – | – |
| 2009–10 | 189 | – | – |
| 2010–11 | 192 | – | – |
| 2011–12 | 208 | – | – |
| 2012–13 | 216 | – | – |
| 2013–14 | 225 | – | – |
| 2014–15 | 234 | – | – |
| 2015–16 | 225 | – | – |
| 2016–17 | 223 | – | – |
| 2017–18 | 214 | – | – |
| 2018–19 | 220 | – | – |
| 2019–20 | 226 | – | – |
| 2020–21 | 226 | – | – |
| 2021–22 | 207 | – | – |
| 2022–23 | 207 | – | – |
| 2023–24 | 199 | – | – |
| 2024–25 | 192 | – | – |
| 2025–26 | 206 | – | – |
| 2026–27 | 210 | 206 | 212 |
| 2027–28 | 220 | 212 | 228 |
| 2028–29 | 220 | 207 | 233 |
Note: See Chapter 3: Ontario’s Fiscal Plan and Outlook for details on the Faster Growth and Slower Growth scenarios.
Sources: Public Accounts of Ontario (1990–1991 to 2025–2026) and Ontario Financing Authority.
Chart 4.14: Interest-to-Revenue
Ontario’s interest-to-revenue ratio is forecast to be 6.7 per cent in 2026–27.
| Year | Planning Projection (%) |
Faster Growth Scenario (%) |
Slower Growth Scenario (%) |
|---|---|---|---|
| 1990–91 | 7.7 | – | – |
| 1991–92 | 8.8 | – | – |
| 1992–93 | 10.8 | – | – |
| 1993–94 | 13.9 | – | – |
| 1994–95 | 14.5 | – | – |
| 1995–96 | 14.6 | – | – |
| 1996–97 | 14.8 | – | – |
| 1997–98 | 14.2 | – | – |
| 1998–99 | 14.3 | – | – |
| 1999–00 | 15.5 | – | – |
| 2000–01 | 15.0 | – | – |
| 2001–02 | 14.2 | – | – |
| 2002–03 | 12.9 | – | – |
| 2003–04 | 12.9 | – | – |
| 2004–05 | 11.1 | – | – |
| 2005–06 | 9.7 | – | – |
| 2006–07 | 8.9 | – | – |
| 2007–08 | 8.4 | – | – |
| 2008–09 | 8.7 | – | – |
| 2009–10 | 8.9 | – | – |
| 2010–11 | 8.8 | – | – |
| 2011–12 | 9.1 | – | – |
| 2012–13 | 9.0 | – | – |
| 2013–14 | 9.1 | – | – |
| 2014–15 | 8.9 | – | – |
| 2015–16 | 8.5 | – | – |
| 2016–17 | 8.3 | – | – |
| 2017–18 | 7.9 | – | – |
| 2018–19 | 8.1 | – | – |
| 2019–20 | 8.0 | – | – |
| 2020–21 | 7.5 | – | – |
| 2021–22 | 6.8 | – | – |
| 2022–23 | 6.4 | – | – |
| 2023–24 | 5.5 | – | – |
| 2024–25 | 5.6 | – | – |
| 2025–26 | 6.0 | – | – |
| 2026–27 | 6.7 | 6.6 | 6.8 |
| 2027–28 | 7.2 | 7.0 | 7.5 |
| 2028–29 | 7.5 | 7.1 | 7.9 |
Note: See Chapter 3: Ontario’s Fiscal Plan and Outlook for details on the Faster Growth and Slower Growth scenarios.
Sources: Public Accounts of Ontario (1990–1991 to 2025–2026) and Ontario Financing Authority.