Ontario’s Economic and Fiscal Outlook in Brief
Restoring trust and accountability in Ontario starts with a clear and transparent reporting of the state of the Province’s finances. Unlike the previous administration, this government is committed to full transparency in the presentation of key economic and fiscal information. That is why the government created this new chapter in the 2018 Ontario Economic Outlook and Fiscal Review. The Province’s fiscal situation is challenging — but the people of Ontario need access to this important information to fully understand the difficult but necessary choices that lie ahead in restoring fiscal balance and sustainability.
As the foundation for the 2018 Ontario Economic Outlook and Fiscal Review, this new first section provides, with clarity and transparency, the financial state of the Province of Ontario.
Independent Financial Commission of Inquiry
Immediately after taking office, the government established an Independent Financial Commission of Inquiry (Commission) under the Public Inquiries Act, 2009. The Commission was mandated to look into the previous government’s accounting practices and provide a baseline for the Province’s fiscal outlook to support planning moving forward.
The Commission delivered its report to the government on August 30, 2018, and concluded that the government inherited a deficit of $15 billion for 2018–19 from the previous administration. A summary of the Commission’s estimated deficit outlook is provided below.
| 2018–19 | |
|---|---|
| Surplus/(Deficit) from the 2018 Budget | (6.7) |
| Proposed Revisions to the Revenue Outlook — Revise economic growth forecast | (0.4) |
| Proposed Revisions to the Revenue Outlook — Revise impact of housing market | (0.4) |
| Proposed Revisions to the Revenue Outlook — Revise impact of minimum wage increase | (0.1) |
| Proposed Revisions to the Revenue Outlook — Revise impact of U.S. tax reform | (0.8) |
| Proposed Revisions to the Revenue Outlook — Reflect updated 2017 tax assessment information | 0.2 |
| Projected Revenue Shortfall Relative to the 2018 Budget | (1.5) |
| Proposed Revisions to the Expense Outlook — Provisionally adopt Auditor General’s accounting treatment of pension expenses | 2.7 |
| Proposed Revisions to the Expense Outlook — Adopt Auditor General’s accounting treatment of global adjustment refinancing | 2.4 |
| Proposed Revisions to the Expense Outlook — Reverse year-end savings and program review savings targets | 1.4 |
| Projected Expense Increase Relative to the 2018 Budget | 6.4 |
| Revision to Reserve Relative to the 2018 Budget | 0.3 |
| Impact on 2018 Budget Surplus/(Deficit) | (8.3) |
| 2018–19 Surplus/(Deficit) as identified by the Commission | (15.0) |
Table footnotes:
Note: Numbers may not add due to rounding.
Source: Details reproduced from the Report of the Independent Financial Commission of Inquiry released September 21, 2018.
Ontario’s Fiscal Outlook
Building on the Commission’s recommendations and taking into account new information as well as government actions and decisions to date, the government is now projecting a deficit of $14.5 billion in 2018–19. This is a $0.5 billion improvement compared to the baseline for planning provided by the Commission just 11 weeks ago.
The updated deficit target for 2018–19 reflects the actions undertaken by the government to find efficiencies and reduce spending — resulting in $3.2 billion in program expense savings since the government took office on June 29, 2018. In addition, the government has reduced the previous government’s deficit, while also providing meaningful tax relief to people and businesses. This tax relief has reduced revenue by almost $2.7 billion through eliminating tax increases planned or imposed by the previous government, and cancelling the cap-and-trade carbon tax. It also supports other measures that will strengthen economic competitiveness.
As recommended by the Commission, the fiscal outlook for 2018–19 includes a reserve of $1.0 billion, returning it to its historical level.
The government is committed to returning the Province to balanced budgets on a modest, reasonable and pragmatic timetable.
See Chapter 3: Ontario’s Fiscal Plan and Outlook for more details on the Province’s fiscal outlook.
| Actual 2017–18 |
Commission Revised Baseline 2018–19 |
Change | Current Outlook 2018–19 | |
|---|---|---|---|---|
| Revenue | 150.6 | 150.9 | (2.7) | 148.2 |
| Expense — Programs | 142.4 | 152.4 | (3.2) | 149.2 |
| Expense — Interest on Debt | 11.9 | 12.5 | – | 12.5 |
| Total Expense | 154.3 | 164.9 | (3.2) | 161.8 |
| Surplus/(Deficit) Before Reserve | (3.7) | (14.0) | 0.5 | (13.5) |
| Reserve | – | 1.0 | – | 1.0 |
| Surplus/(Deficit) | (3.7) | (15.0) | 0.5 | (14.5) |
| Net Debt as a Per Cent of GDP | 39.2 | 40.8 | 40.5 | |
| Accumulated Deficit as a Per Cent of GDP | 25.3 | N.A. | 26.1 |
Table footnotes:
Notes: Numbers may not add due to rounding. To ensure consistency and comparability of numbers between the current outlook, the Commission’s baseline forecast and prior year results, the Commission’s Net Debt as a Per Cent of GDP estimate has been revised from 40.5 per cent after updating GDP with the most recent numbers from Statistics Canada’s Provincial and Territorial Economic Accounts, 2017.
Inflated Non-Recurring Revenues
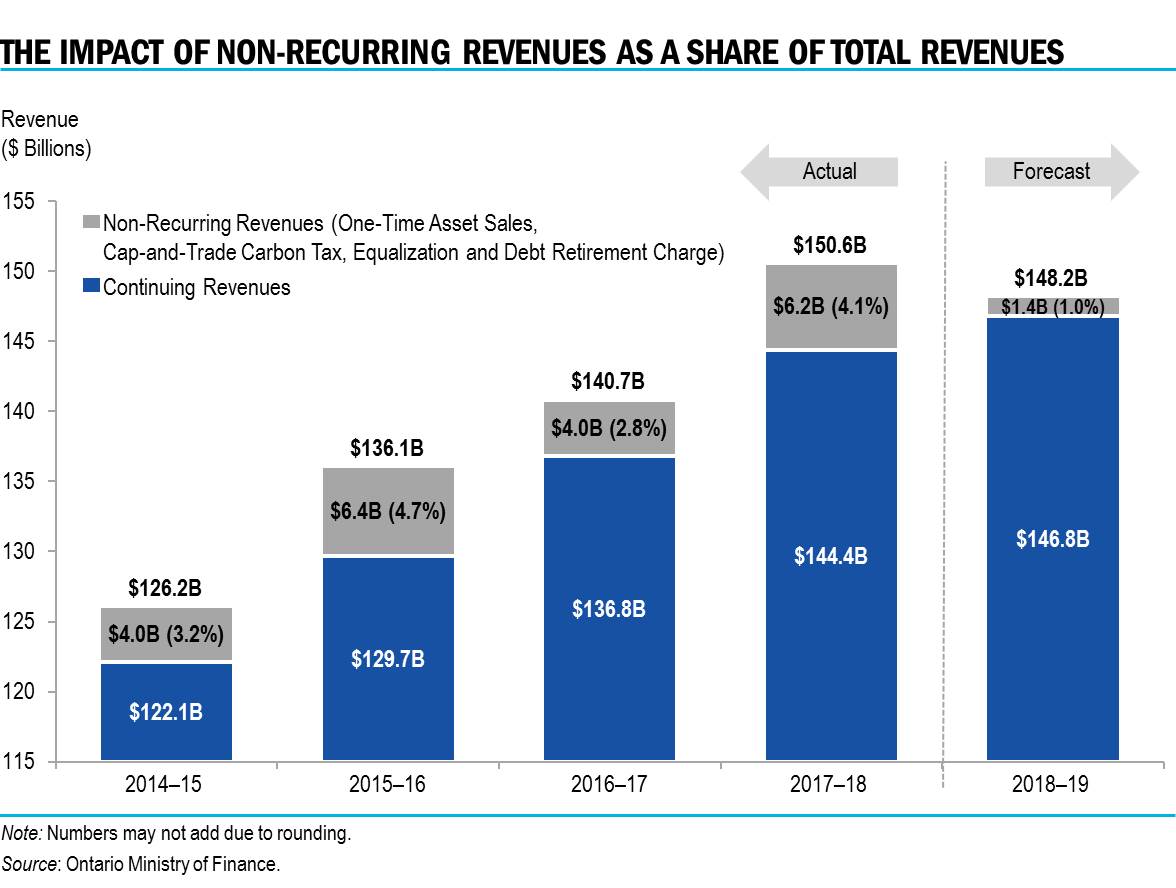
The Commission’s findings affirmed the Auditor General of Ontario’s observation that the previous government’s 2018 Pre-Election Report on Ontario’s Finances, based on the 2018 Budget, was “not a reasonable presentation of Ontario’s finances”.1 It is also clear that the fiscal challenge has been further amplified as a result of the previous government’s significant reliance on non-recurring revenues that inflated revenues temporarily to support attempts to meet short-term fiscal targets and a balanced budget target date of 2017–18, which was not achieved. In fact, by selling a number of its assets, including Hydro One shares, the Liquor Control Board of Ontario (LCBO) headquarters’ site and the Ontario Power Generation (OPG) head office and Lakeview properties, the government was able to secure revenue that would then reduce significantly in 2018–19.
The graph below provides an overview of the extent of these non-recurring revenues.
Ontario’s Economic Outlook
Ontario’s economy has struggled over the past 15 years, with its performance slipping compared to other provinces. Ontario also faces a number of challenges that have the potential to adversely affect its growth in the short-term, and dampen economic prospects and prosperity in the longer term. These challenges include regulatory barriers for businesses, a lack of tax competitiveness, as well as uncertainty related to global trade tensions. In addition, many workers find themselves not suitably trained for today’s job market, which hinders income growth and contributes to higher household debt.
Over the 2018 to 2021 period, Ontario’s economy is expected to grow, with rising employment, higher incomes, improved business investment and gains in exports.
A summary of Ontario’s economic outlook is presented below. See Chapter 2: Economic Outlook for more details.
| 2015 | 2016 | 2017 | 2018p | 2019p | 2020p | 2021p | |
|---|---|---|---|---|---|---|---|
| Real GDP Growth | 2.5 | 2.3 | 2.8 | 2.0 | 1.8 | 1.7 | 1.5 |
| Nominal GDP Growth | 4.6 | 4.4 | 4.1 | 3.8 | 3.8 | 3.5 | 3.2 |
| Employment Growth | 0.7 | 1.1 | 1.8 | 1.5 | 1.2 | 1.0 | 0.8 |
| CPI Inflation | 1.2 | 1.8 | 1.7 | 2.5 | 2.1 | 2.0 | 1.6 |
Table footnotes:
p = Ontario Ministry of Finance planning projection based on information up to October 22, 2018.
Sources: Statistics Canada and Ontario Ministry of Finance.
Ontario’s Debt
The Province has reported deficits in 24 of the last 29 years. Ontario now has the highest subnational debt of any jurisdiction in the world. Ontario’s net debt has grown to more than one-third of a trillion dollars – $347 billion in 2018-19. Net debt per capita has increased from $13,163 per person or $52,652 per family of four at the beginning of the 2008–09 global economic downturn to a projected $24,231 per person or $96,924 per family of four in 2018–19. Additionally, there are daily interest charges that accumulate on the debt. In 2018–19, the government is forecasting $12.5 billion in interest payments to service that debt, or almost $900 this year alone for every man, woman and child in Ontario.
The chart and table below provide information on Ontario’s debt burden and borrowing program. See Chapter 4: Borrowing and Debt Management for more details.

| 2018 Budget | Outlook Based on Commission of Inquiry | Change from Commission of Inquiry Outlook | Current Outlook | |
|---|---|---|---|---|
| Deficit/(Surplus) | 6.7 | 15.0 | (0.5) | 14.5 |
| Investment in Capital Assets | 14.2 | 14.2 | (1.4) | 12.8 |
| Non-Cash Adjustments | (7.1) | (7.4) | – | (7.4) |
| Loans to Infrastructure Ontario | 0.4 | 0.4 | – | 0.4 |
| Other Net Loans/Investments | 1.5 | 0.5 | (0.6) | (0.0) |
| Debt Maturities | 21.5 | 21.5 | 0.3 | 21.8 |
| Debt Redemptions | 0.1 | 0.1 | 0.1 | 0.1 |
| Total Funding Requirement | 37.3 | 44.3 | (2.1) | 42.1 |
| Canada Pension Plan Borrowing | (0.0) | (0.0) | – | (0.0) |
| Decrease/(Increase) in Short-Term Borrowing | – | – | – | – |
| Increase/(Decrease) in Cash and Cash Equivalents | 6.0 | 3.3 | 0.2 | 3.5 |
| Pre-Borrowing from 2017–18 | (11.5) | (12.4) | – | (12.4) |
| Total Long-Term Public Borrowing | 31.7 | 35.1 | (1.9) | 33.2 |
Table footnotes:
Note: Numbers may not add due to rounding.
Footnotes
[1] Office of the Auditor General of Ontario, “Review of the 2018 Pre-Election Report on Ontario’s Finances,” (2018), http://www.auditor.on.ca/en/content/specialreports/specialreports/2018Pre-Election_en.pdf
Chart Descriptions
Chart: The Impact of Non-Recurring Revenues as a Share of Total Revenues
The stacked bar chart presents the value of Ontario’s continuing revenues and non-recurring revenues (such as one-time asset sales, cap-and-trade carbon tax, Equalization and the electricity debt retirement charge) for the five fiscal years from 2014–15 to 2018–19.
Total revenues were $126.2 billion in 2014–15, $136.1 billion in 2015–16, $140.7 billion in 2016–17, $150.6 billion in 2017–18 and $148.2 billion in 2018–19. Continuing revenues were $122.1 billion in 2014–15, $129.7 billion in 2015–16, $136.8 billion in 2016–17, $144.4 billion in 2017–18 and $146.8 billion in 2018–19. Non-recurring revenues totaled $4.0 billion (3.2 per cent of total revenue) in 2014–15, $6.4 billion (4.7 per cent of total revenue) in 2015–16, $4.0 billion (2.8 per cent of total revenue) in 2016–17, $6.2 billion (4.1 per cent of total revenue) in 2017–18, and $1.4 billion (1.0 per cent of total revenue) in 2018–19.
Chart: Net Debt Per Capita
- Ontario’s net debt per person was $3,733 in 1990–91.
- Ontario’s net debt per person was $10,974 in 2002–03.
- Ontario’s net debt per person was $13,163 in 2008–09.
- Ontario’s net debt per person is forecast at $24,231 in 2018–19.