Introduction
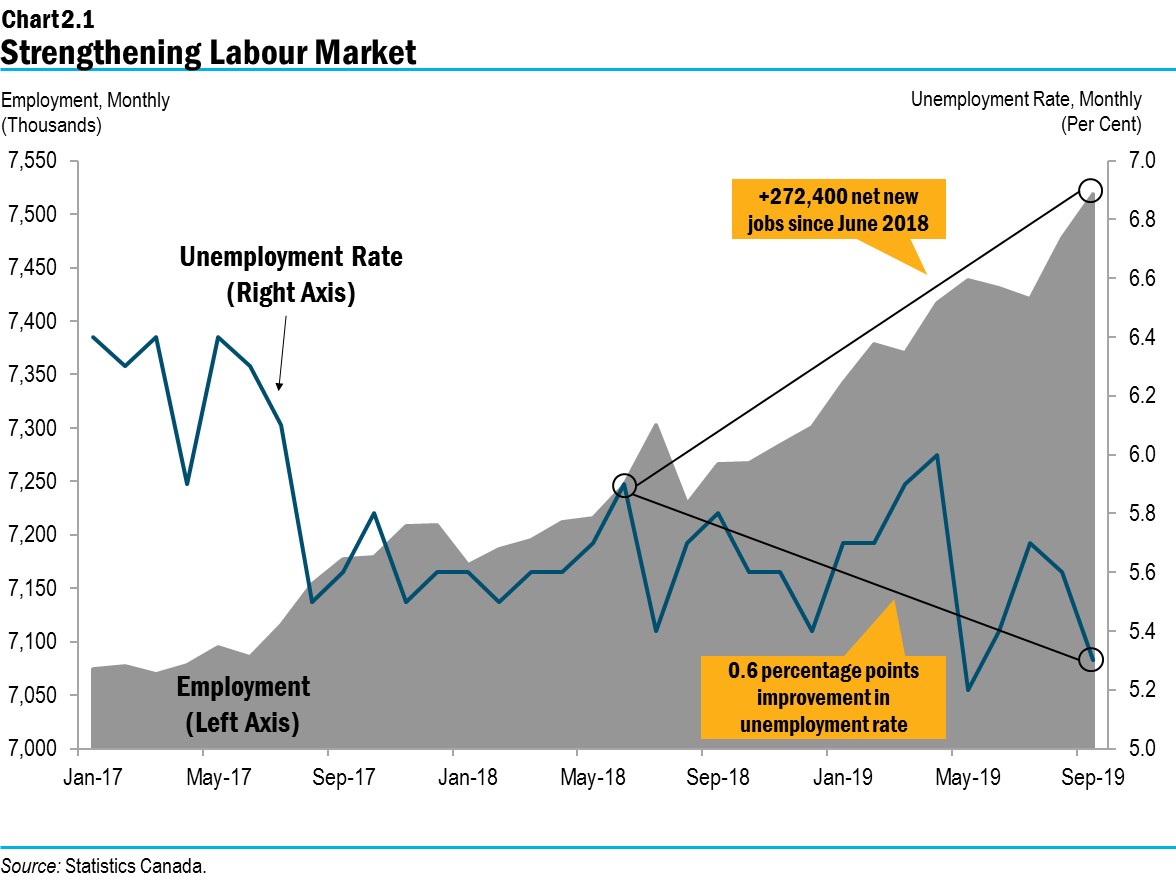
Ontario’s economy continues to grow in a highly uncertain global environment. Since June 2018, 272,400 net new jobs have been created, and the unemployment rate has been near its historic low. Growth has been supported by provincial government policies that have lowered business costs, reduced regulatory red tape and enhanced workforce skills. These are outlined in more depth in Chapter 1: A Plan to Build Ontario Together.
The Ministry of Finance has updated its outlook to reflect changes in private-sector forecasts. Steady economic growth is projected for the province by all private-sector forecasters, consistent with the outlook at the time of the 2019 Budget. There are a number of factors in the current global economic environment that could affect economic growth. Key risks include heightened global trade and political tensions, slowing global growth, elevated household debt levels, and financial market volatility.
Ontario’s Recent Economic Strength
Ontario’s economy has continued to grow, supported by government measures to improve business competitiveness and promote job creation, while making government spending smarter and more accountable. Ontario’s real gross domestic product (GDP) advanced by 0.8 per cent in the second quarter of 2019 supported by strong exports and consumer spending. This follows two quarters of relatively slower growth, which were adversely affected by unusually harsh winter weather and a slowdown in housing market activity. Although growth has been uneven over the past four quarters, on average over that period the Ontario economy has been expanding at a slightly stronger pace than Canada and the average of the G7 countries.
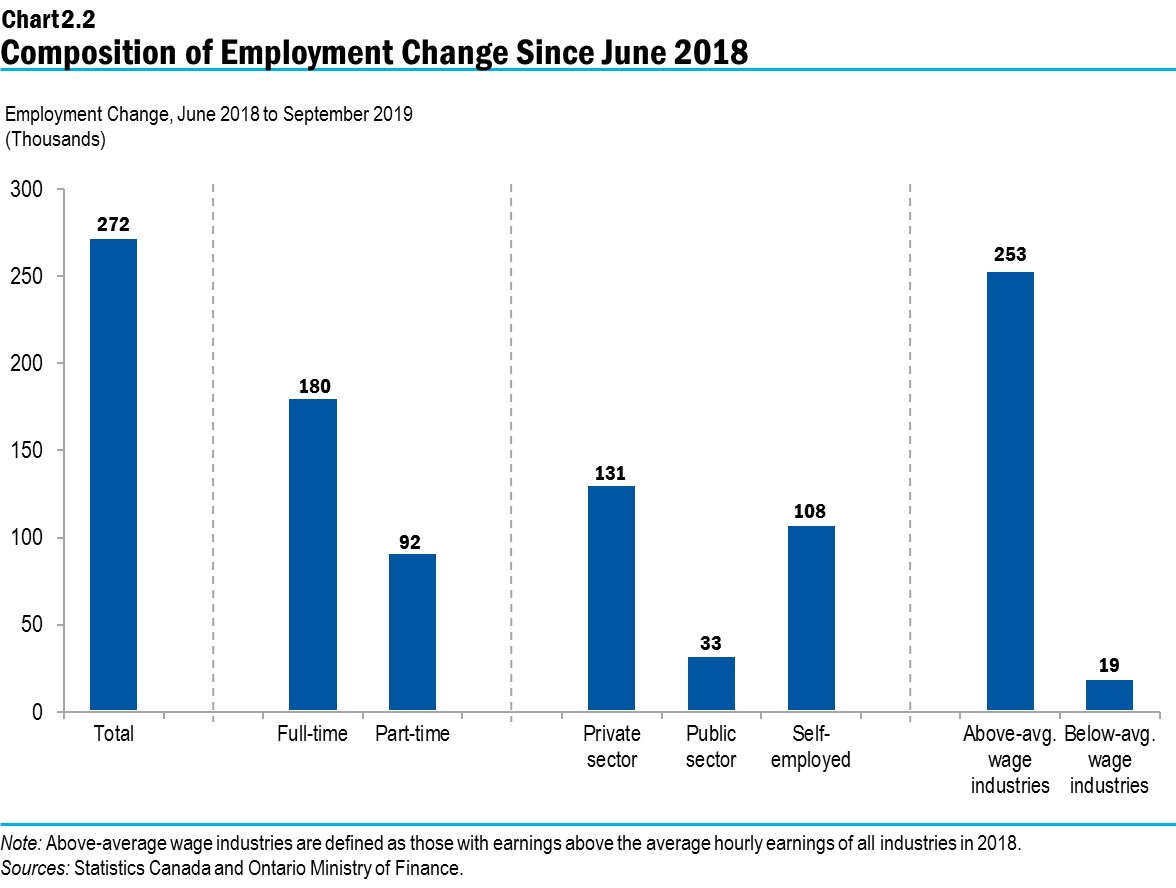
The labour market has been strong, with 272,400 net new jobs created since June 2018. The majority of the net new jobs were full-time and in industries paying above-average wages. There were also notable gains in private-sector positions. In addition, the unemployment rate, at 5.3 per cent in September, was near its historic low. While overall employment is up, growth has been uneven across Ontario’s regions.
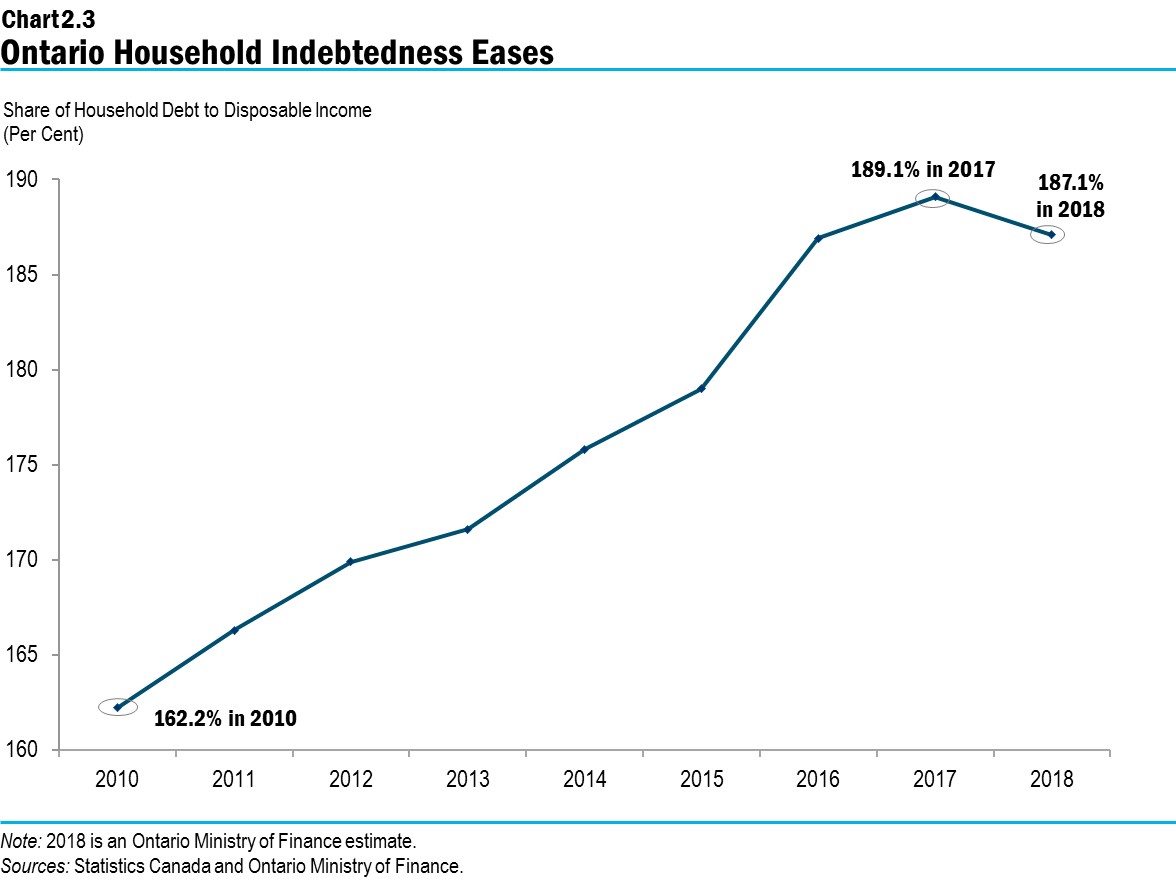
Robust job and wage growth, combined with the government’s plan to make life more affordable for individuals, families and businesses, have led to strong household disposable income growth averaging 0.9 per cent over the past four quarters. This has supported real household spending to advance at an average of 0.5 per cent per quarter since the middle of 2018. Income growth has also helped to slightly ease the burden of household debt. The proportion of household debt to disposable income has declined from a recent high of 189.1 per cent in 2017 to 187.1 per cent in 2018.
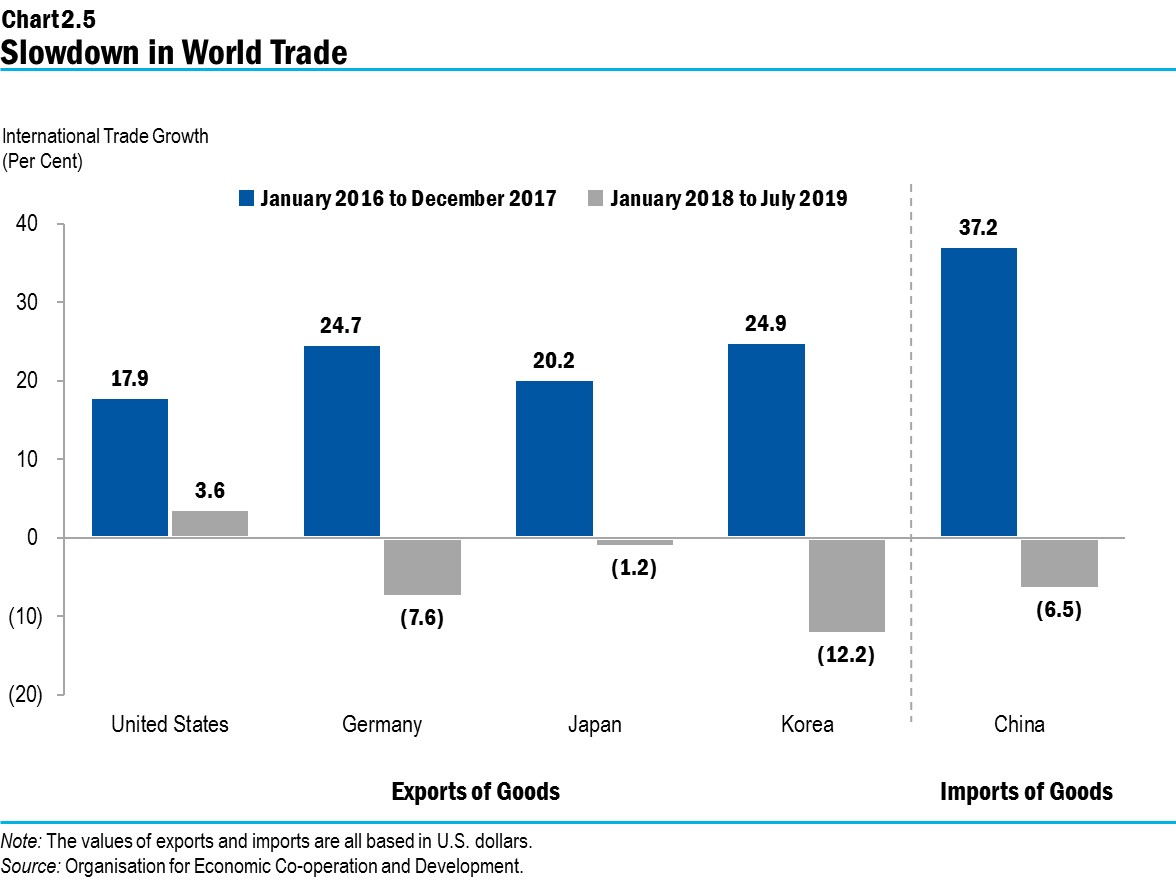
Trade is an important driver for Ontario’s economy. International exports have continued to rise, increasing 1.9 per cent in 2018, despite having been impacted by lower demand for automobiles in North America, slowing global growth, trade tensions and ongoing competition by global exporters.
Outlook for Continued Economic Growth
Ontario is expected to experience continued growth over the 2019 to 2022 period. The Ministry of Finance is forecasting Ontario’s real GDP to grow by 1.4 per cent in 2019, 1.5 per cent in 2020, 1.5 per cent in 2021 and 1.9 per cent in 2022. For prudent fiscal planning, the Ministry of Finance’s real GDP growth projections are slightly below the average of private-sector forecasts.
| 2018 | 2019p | 2020p | 2021p | 2022p | |
|---|---|---|---|---|---|
| Real GDP Growth | 2.3 | 1.4 | 1.5 | 1.5 | 1.9 |
| Nominal GDP Growth | 3.5 | 3.4 | 3.3 | 3.3 | 3.6 |
| Employment Growth | 1.6 | 2.6 | 1.2 | 1.0 | 1.1 |
| CPI Inflation | 2.4 | 2.0 | 2.0 | 1.9 | 1.9 |
Table 2.1 footnotes:
p = Ontario Ministry of Finance planning projection based on information up to October 9, 2019.
Sources: Statistics Canada and Ontario Ministry of Finance.
The Ministry of Finance regularly consults with private-sector economists and considers their economic forecasts when developing the government’s planning assumptions. These economists are projecting continued growth for Ontario over the forecast horizon. On average, they are calling for real GDP growth of 1.5 per cent in 2019, 1.7 per cent in 2020, 1.7 per cent in 2021 and 2.0 per cent in 2022.
| 2019 | 2020 | 2021 | 2022 | |
|---|---|---|---|---|
| BMO Capital Markets (October) | 1.7 | 1.8 | – | – |
| Central 1 Credit Union (May/March) | 1.6 | 1.5 | 1.7 | 2.2 |
| CIBC Capital Markets (October) | 1.7 | 1.3 | 1.6 | – |
| The Conference Board of Canada (July) | 1.6 | 1.7 | 1.6 | 1.7 |
| Desjardins Group (September) | 1.5 | 1.6 | 1.3 | 1.8 |
| Laurentian Bank Securities (September) | 1.4 | 1.7 | 1.5 | – |
| National Bank of Canada Financial Markets (October) | 1.4 | 1.6 | – | – |
| Quantitative Economic Decisions, Inc. (August) | 1.3 | 1.9 | 1.6 | 1.7 |
| Royal Bank of Canada (September) | 1.5 | 1.5 | – | – |
| Scotiabank (September) | 1.6 | 1.8 | – | – |
| Stokes Economics (July) | 1.4 | 1.7 | 1.9 | 2.0 |
| TD Bank Group (September) | 1.6 | 1.6 | 1.7 | – |
| University of Toronto (July) | 1.8 | 2.1 | 2.3 | 2.3 |
| Private-Sector Survey Average | 1.5 | 1.7 | 1.7 | 2.0 |
| Ontario’s Planning Assumption | 1.4 | 1.5 | 1.5 | 1.9 |
Table 2.2 footnotes:
Source: Ontario Ministry of Finance Survey of Forecasters (October 9, 2019).
Global Economic Growth
Developments in the global economic environment have a strong influence on the pace of economic activity in Ontario. Forecasts for key external factors are summarized in Table 2.3. These are used as the basis for the forecasts for economic growth in the province.
| 2018 | 2019p | 2020p | 2021p | 2022p | |
|---|---|---|---|---|---|
| World Real GDP Growth (Per Cent) | 3.6 | 3.2 | 3.5 | 3.6 | 3.6 |
| U.S. Real GDP Growth (Per Cent) | 2.9 | 2.3 | 1.7 | 1.8 | 1.9 |
| West Texas Intermediate (WTI) Crude Oil ($US per Barrel) | 65 | 57 | 58 | 63 | 65 |
| Canadian Dollar (Cents US) | 77.2 | 75.4 | 76.3 | 77.0 | 77.9 |
| Three-Month Treasury Bill Rate1 (Per Cent) | 1.4 | 1.6 | 1.5 | 1.5 | 1.8 |
| 10-Year Government Bond Rate2 (Per Cent) | 2.3 | 1.5 | 1.6 | 2.1 | 2.5 |
Table 2.3 footnotes:
p = Ontario Ministry of Finance planning projection based on external sources.
[1], [2] Government of Canada interest rates.
Sources: IMF World Economic Outlook (April 2019) and World Economic Outlook Update (July 2019), United States Bureau of Economic Analysis, “Blue Chip Economic Indicators” (October 2019), U.S. Energy Information Administration, Bank of Canada, Ontario Ministry of Finance Survey of Forecasters (October 2019) and Ontario Ministry of Finance.
The global growth outlook indicates continued economic growth at a moderate pace. Broad-based weakness in global manufacturing activity and U.S.-China trade tensions are contributing to sluggish economic activity and growth prospects. Meanwhile, monetary policy easing across advanced and emerging-market countries is helping to partially offset the negative impact of trade tensions.
U.S. real GDP growth is expected to slow from 2.3 per cent in 2019 to 1.7 per cent in 2020. Though the U.S. economy has proven resilient, some signs of slowing are emerging. Business activity is decelerating, while consumer and business confidence have weakened, offsetting a generally strong labour market and robust wage growth. Additionally, the boost that the 2017 and 2018 fiscal stimulus packages provided to U.S. economic growth is expected to ease.
China’s real GDP growth outlook is expected to slow from 6.2 per cent in 2019 to 6.0 per cent in 2020. In addition to trade tensions, slowing domestic demand is having an impact on China’s growth. Slowing global auto demand and moderating Chinese imports have had wide ramifications, notably among China’s major trading partners such as Korea, Japan and Germany. Brexit has also added a high degree of political and economic uncertainty. The Bank of England recently revised its real GDP growth forecast lower. As well, the British pound has weakened in 2019.
With slowing economic growth and modest price inflation, key central banks have kept their policy interest rates at below historical averages (United States, Canada) or even negative (Europe, Japan). The European Central Bank (ECB) policy rate is negative and is expected to remain low until inflation is close to its two per cent target. Many European long-term government bond yields are negative, suggesting continued economic weakness and risks to financial institutions through lower interest margins. Since the beginning of the year, interest rate forecasts for most key economies have been revised lower.
| Three-month Treasury Bill Rate Forecast — Forecast in January 2019 | Three-month Treasury Bill Rate Forecast — Forecast in January 2020 | Three-month Treasury Bill Rate Forecast — Latest Forecast 2019 | Three-month Treasury Bill Rate Forecast — Latest Forecast 2020 | Central Bank Actions Since January 20191 | |
|---|---|---|---|---|---|
| U.S. | 2.6 | 2.8 | 2.1 | 1.5 | Federal Reserve cut rates by 50 basis points |
| Euro area | 0.0 | 0.3 | -0.5 | -0.4 | ECB cut rates by 10 basis points; resuming quantitative easing |
| Japan | 0.0 | 0.1 | -0.1 | -0.1 | No rate changes |
| U.K. | 1.1 | 1.4 | 0.8 | 0.8 | No rate changes |
| Canada | 2.5 | 2.8 | 1.7 | 1.5 | No rate changes |
Table 2.4 footnotes:
[1] As of October 9, 2019.
Note: The table shows end-of-year forecast averages except for the U.S., which is the annual forecast average.
Sources: Blue Chip Economic Indicators (January 2019 and October 2019). Central banks of U.S., Japan, U.K., Canada and the ECB.
Global financial conditions have improved in recent months, due in part to central bank easing. Most advanced economies are experiencing low long-term interest rates and high equity valuations. Declining government interest rate spreads or inverted yield curves, especially in the United States, have increased concerns about the likelihood of a recession. Other indicators in the United States such as recent gains in stock and home prices, solid employment and income gains suggest household finances remain strong and that consumer spending growth will continue. Private-sector forecasters expect the U.S. economy to continue growing, with real GDP growth of 2.3 per cent in 2019 and 1.7 per cent in 2020.
Financial Markets
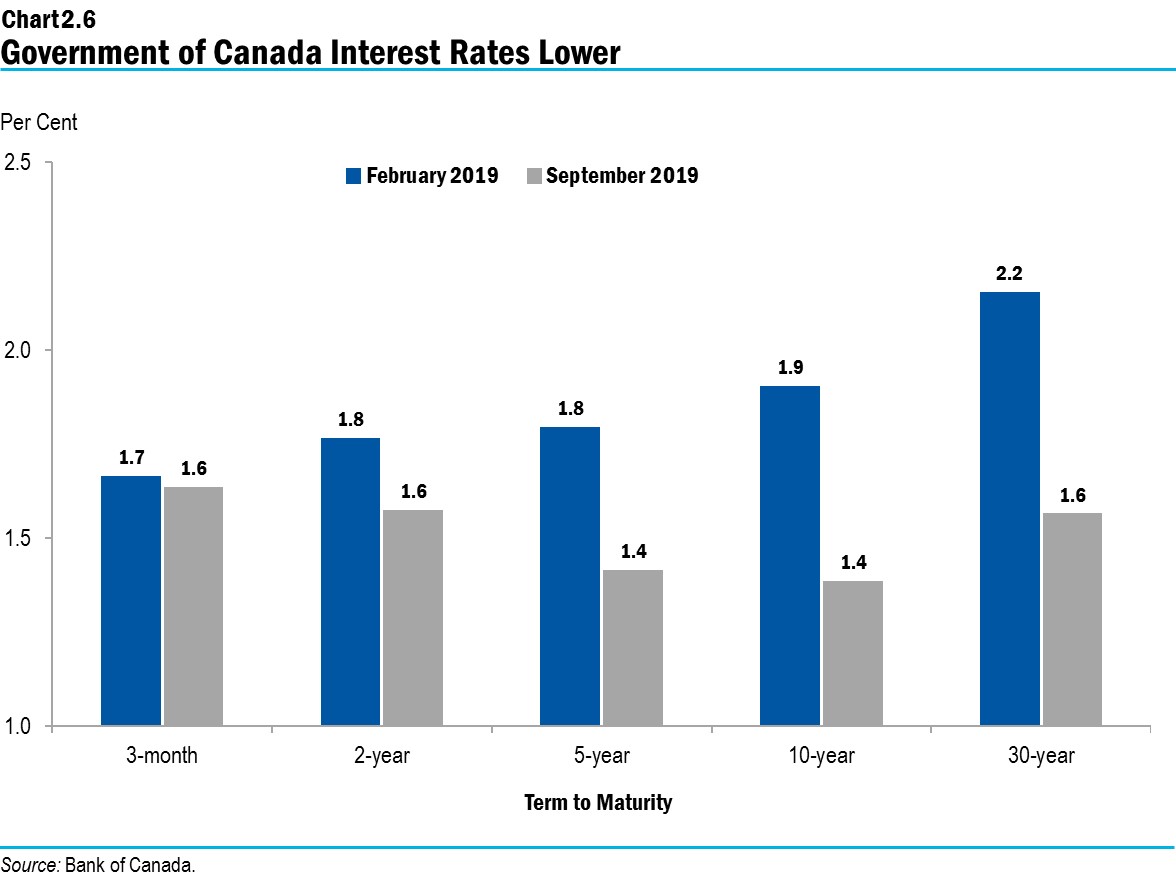
Long-term interest rates in both Canada and the United States have been trending down reflecting trade tensions and the weakening global economic outlook. Long-term interest rates have moved lower than at the time of the 2019 Budget. For example, Canadian 10‑year bond yields declined from 1.9 per cent at the end of February to 1.4 per cent at the end of September. Over the same period, the three-month Government of Canada Treasury Bill rate edged down from 1.7 per cent to 1.6 per cent. The outlook for long-term interest rates is significantly lower over the next few years than at the time of the 2019 Budget. The Canadian 10‑year bond yield is now forecast to average 1.5 per cent in 2019, 1.6 per cent in 2020, and 2.1 per cent in 2021 and then rise to 2.5 per cent in 2022.
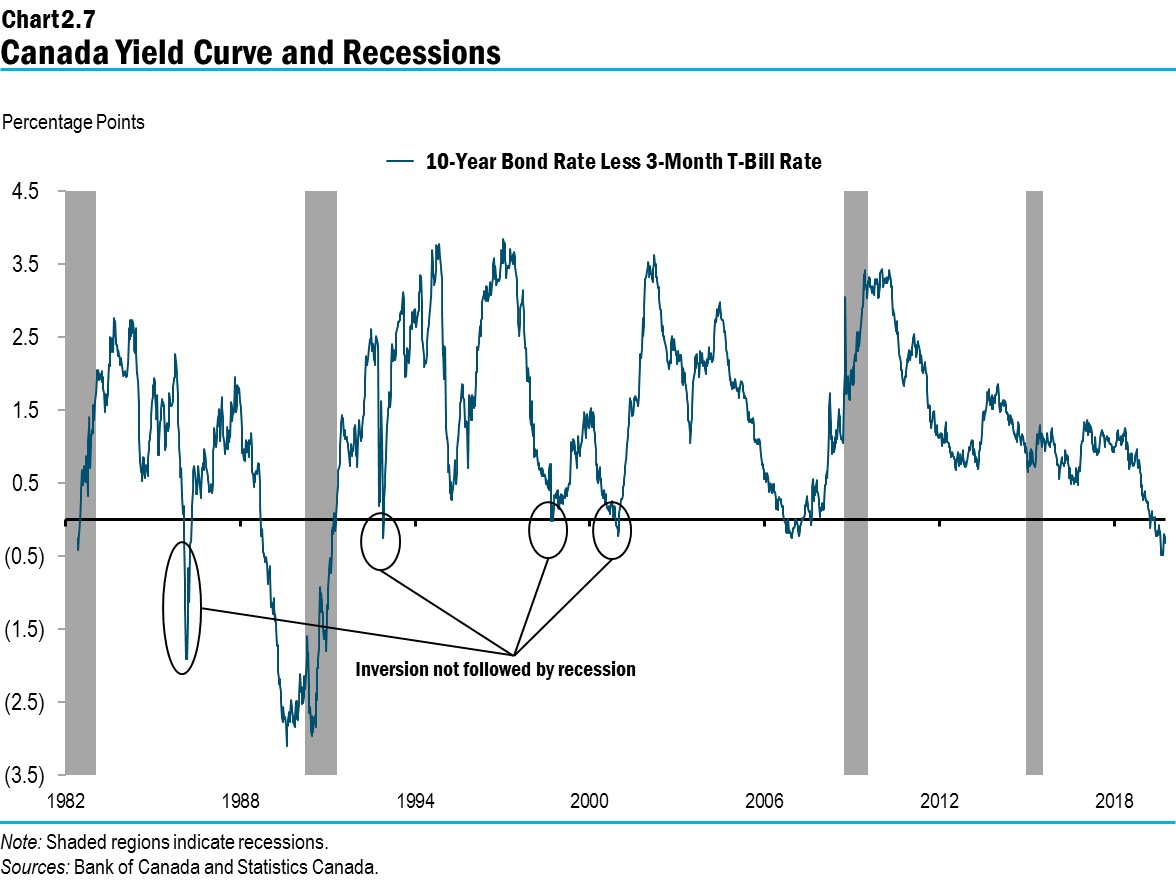
As a result of these recent developments, the yield curve has inverted (long-term interest rates are lower than short-term rates), signalling potential investor concerns about future economic growth. An inverted yield curve sometimes precedes a recession, but there are occasions when the Canadian economy has not fallen into a recession following an inversion of the yield curve.
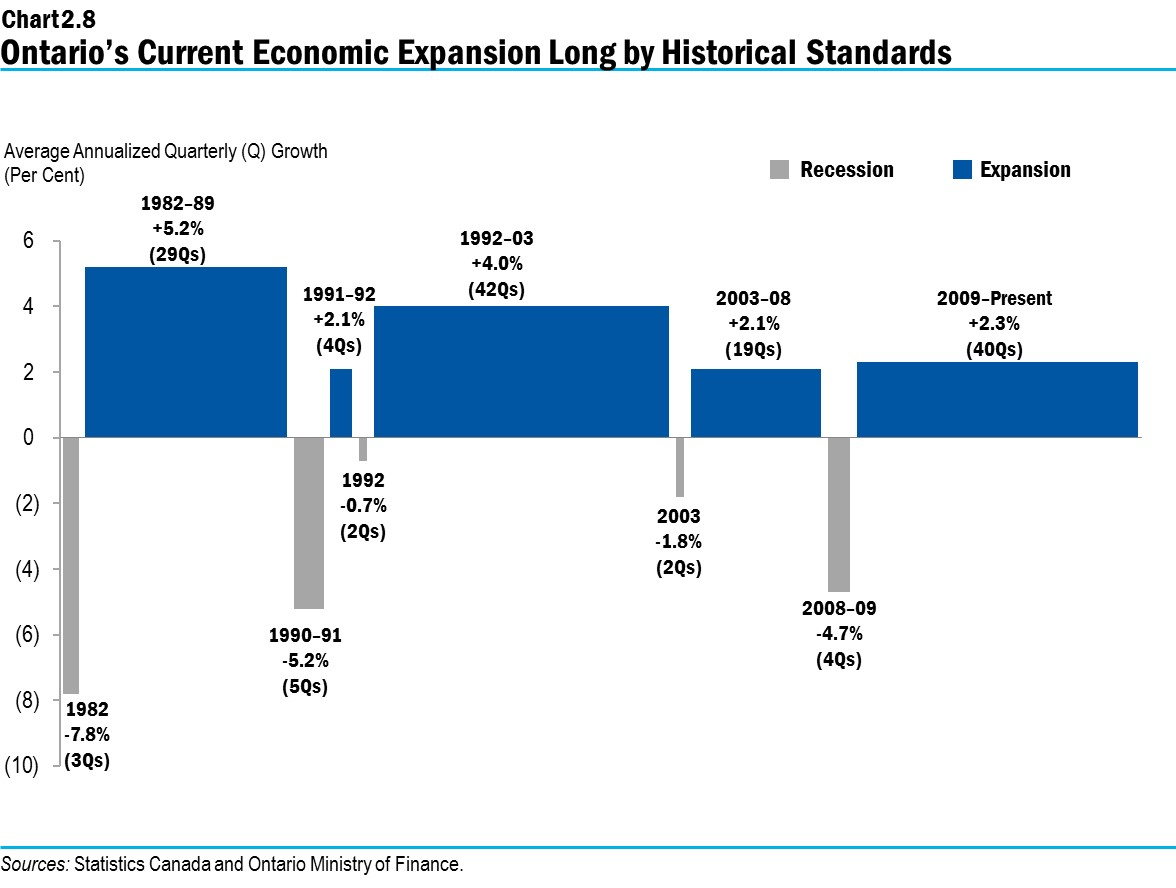
Ontario has experienced a historically long run of economic growth since the last recession. Since 1982, only one period of expansion has been longer, although the average rate of growth in the current expansion has been lower than the historical average.
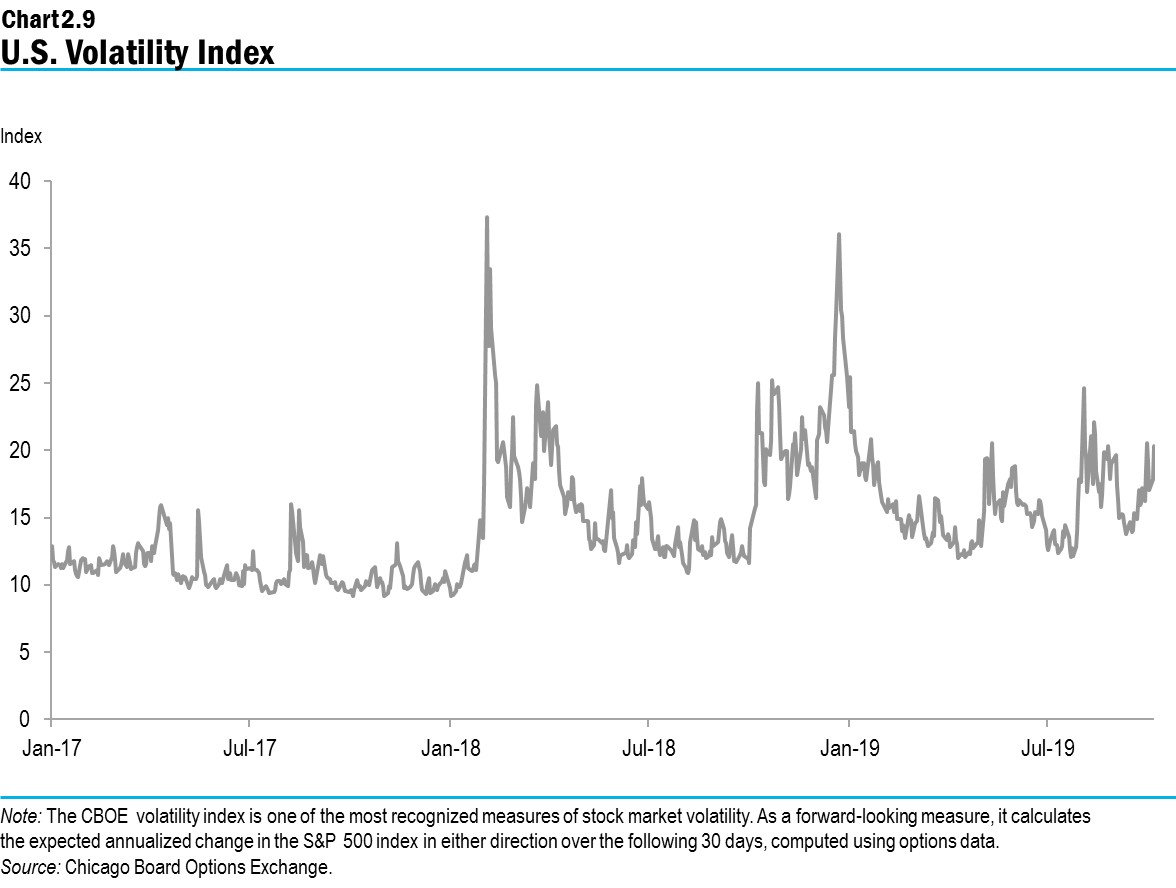
The Bank of Canada has held its policy rate unchanged at 1.75 per cent since October 2018. Financial market participants expect the Bank to cut rates over the next year, following the lead of the U.S. Federal Reserve, which cut its policy rate for the first time in over a decade in July and further reduced it since. For now, private-sector forecasters expect the Bank and Federal Reserve will begin to raise rates in 2021 to levels consistent with economies operating close to full capacity and inflation close to target. However, financial market volatility is likely to remain a challenge for consumer, business and investor confidence. U.S. financial market volatility as measured by the Chicago Board Options Exchange (CBOE) Volatility Index has experienced sharp swings since early 2018.
Oil Prices and the Canadian Dollar
West Texas Intermediate (WTI) crude oil prices declined sharply at the end of 2018 and started 2019 below $50 US per barrel. Oil prices climbed to around $60 US per barrel late in September. The volatility reflects, in part, rising geopolitical tensions including a supply disruption in Saudi Arabia oil operations, and ongoing tensions between the United States and Iran. WTI crude oil prices are expected to average $57 US per barrel in 2019 and $58 US in 2020, before rising to an average annual rate of $64 US between 2021 and 2022.
The Canada-U.S. exchange rate has held relatively steady so far in 2019 and is expected to average 75.4 cents US in 2019 and rise gradually to 77.97 cents US in 2022.
Business Investment and Exports
Supported by provincial government policies, such as providing accelerated writeoffs of capital investments, business investment is expected to continue growing as businesses are operating close to full capacity. Ontario business investment is projected to increase by an annual average rate of 2.6 per cent over the 2020 to 2022 period.
However, a less supportive global outlook and increasing risks could weigh on business confidence and investment plans in Ontario and other advanced economies.
Ontario’s exports are expected to grow at a moderate pace, with real exports forecast to rise at an average annual rate of 2.0 per cent over the 2020 to 2022 period.
Continued Job Growth
Employment gains have been robust in 2019, with annual growth projected to be the strongest in 16 years at 2.6 per cent or close to 200,000 more jobs. Over 125,000 net new private-sector jobs have already been created year-to-date. For the rest of the forecast period, employment growth is expected to continue, with average gains of 1.1 per cent annually.
The unemployment rate is expected to average 5.6 per cent in 2019, matching the unemployment rate in 2018. The unemployment rate is projected to average 5.5 per cent between 2020 and 2022 as employment growth is expected to keep pace with Ontario’s strong population and labour force growth.
The projected employment gains will contribute to continued household income growth, which is projected to average 3.9 per cent annually during the 2019 to 2022 period.
Housing
Ontario’s housing market is emerging from a period of adjustments, with weakness earlier this year expected to lead residential investment to decline 5.3 per cent in 2019, following a 3.0 per cent decrease in 2018. Over the 2020 to 2022 period, residential construction and house prices are expected to grow moderately, supported by steady employment gains, rising incomes and strong population growth.
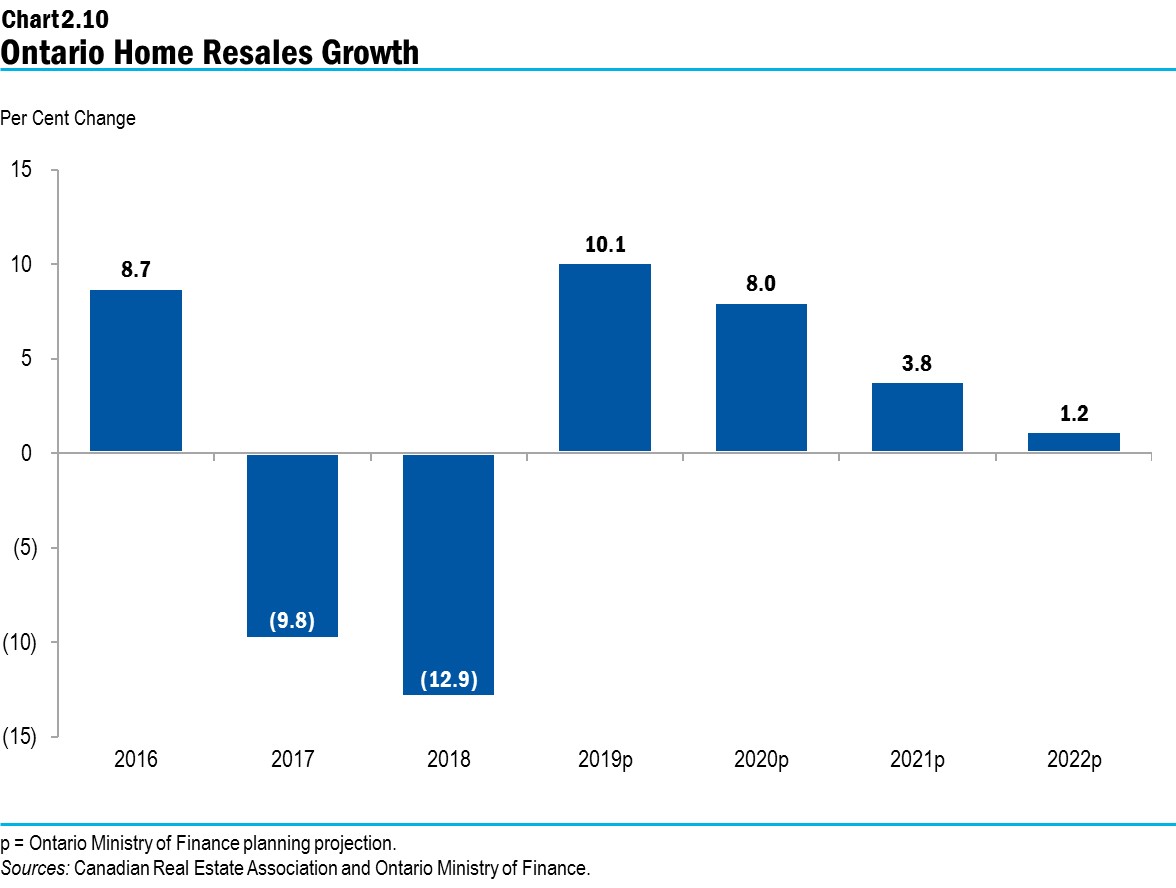
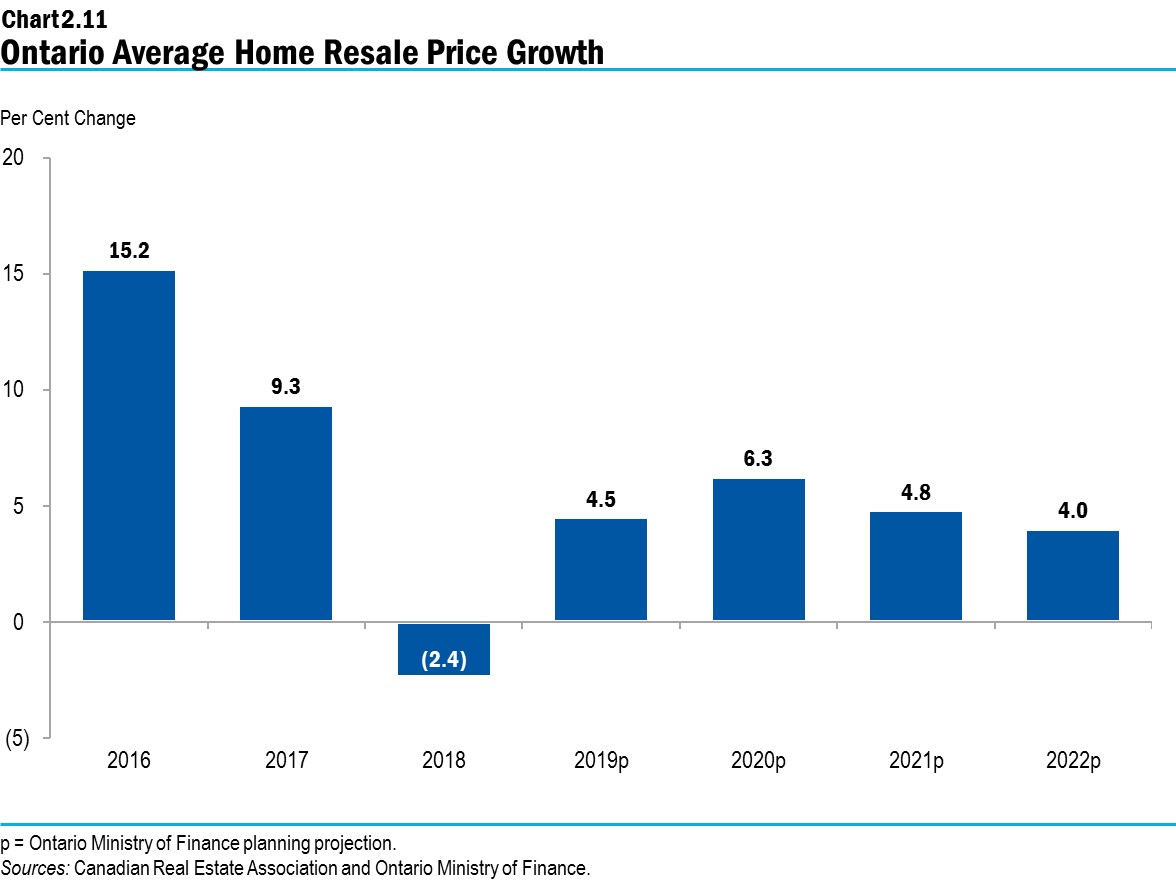
Home resales have tended to be volatile in recent years. Resales are expected to grow at 10.1 per cent in 2019 and 8.0 per cent in 2020, more closely aligning with underlying demand following large declines in 2017 and 2018. Over the rest of the forecast period, more modest growth is expected. Future price gains are expected to be more moderate as compared with those prior to 2018, averaging 4.9 per cent over the 2019 to 2022 period. Support for housing affordability will come from the government’s plan to stimulate the growth of housing supply, which will help people in Ontario find the type of housing they need. See Chapter 1, Section A: A Plan to Build Ontario Together by Making Life More Affordable for more details.
Risks
Ontario’s economy continues to face a number of risks that increase the likelihood of an economic slowdown. Some notable risks facing Ontario’s economy include:
- Weakening global and U.S. economic growth;
- Global trade uncertainty;
- Heightened geopolitical risks;
- Financial and commodity market risks; and
- Household debt levels remaining elevated.
Table 2.5 provides current estimates of the impact of sustained changes in key external factors on the growth of Ontario’s real GDP, assuming other external factors are unchanged. The relatively wide range of estimated impacts reflects the uncertainty regarding how the economy would respond to these changes in external conditions.
| First Year | Second Year | |
|---|---|---|
| Canadian Dollar Depreciates by Five Cents US | +0.1 to +0.7 | +0.2 to +0.8 |
| Crude Oil Prices Decrease by $10 US per Barrel | +0.1 to +0.3 | +0.1 to +0.3 |
| U.S. Real GDP Growth Increases by One Percentage Point | +0.2 to +0.6 | +0.3 to +0.7 |
| Canadian Interest Rates Increase by One Percentage Point | (0.1) to (0.5) | (0.2) to (0.6) |
Table 2.5 footnotes:
Source: Ontario Ministry of Finance.
Details of Ontario’s Economic Outlook
Table 2.6 provides details of the Ontario Ministry of Finance’s economic outlook for the 2019 to 2022 period and the economy’s recent historical performance.
| 2017 | 2018 | 2019p | 2020p | 2021p | 2022p | |
|---|---|---|---|---|---|---|
| Real Gross Domestic Product | 2.8 | 2.3 | 1.4 | 1.5 | 1.5 | 1.9 |
| Household Consumption | 3.9 | 2.9 | 2.0 | 2.0 | 1.8 | 2.0 |
| Residential Construction | 1.0 | (3.0) | (5.3) | 2.7 | 2.5 | 2.8 |
| Non-Residential Construction | 1.7 | (3.4) | (4.1) | 2.5 | 2.5 | 2.5 |
| Machinery and Equipment | 7.9 | 8.9 | (2.1) | 1.1 | 3.1 | 3.1 |
| Exports | 1.8 | 2.4 | 2.7 | 1.8 | 1.8 | 2.2 |
| Imports | 5.1 | 2.0 | 1.3 | 1.7 | 1.9 | 2.1 |
| Nominal Gross Domestic Product | 4.1 | 3.5 | 3.4 | 3.3 | 3.3 | 3.6 |
| Primary Household Income | 4.7 | 4.8 | 4.0 | 3.9 | 3.8 | 3.8 |
| Compensation of Employees | 4.7 | 5.1 | 4.3 | 4.0 | 3.7 | 3.8 |
| Net Operating Surplus — Corporations | 1.8 | (3.7) | 0.6 | 0.6 | 2.7 | 3.9 |
| Other Economic Indicators — Retail Sales | 7.7 | 4.4 | 2.6 | 3.3 | 3.2 | 3.7 |
| Other Economic Indicators — Housing Starts (000s) | 79.1 | 78.7 | 70.1 | 72.3 | 74.0 | 77.3 |
| Other Economic Indicators — Home Resales | (9.8) | (12.9) | 10.1 | 8.0 | 3.8 | 1.2 |
| Other Economic Indicators — Home Resale Prices | 9.3 | (2.4) | 4.5 | 6.3 | 4.8 | 4.0 |
| Other Economic Indicators — Consumer Price Index | 1.7 | 2.4 | 2.0 | 2.0 | 1.9 | 1.9 |
| Other Economic Indicators — Employment | 1.8 | 1.6 | 2.6 | 1.2 | 1.0 | 1.1 |
| Other Economic Indicators — Job Creation (000s) | 128 | 114 | 189 | 89 | 76 | 85 |
| Other Economic Indicators — Unemployment Rate (Per Cent) | 6.0 | 5.6 | 5.6 | 5.5 | 5.5 | 5.5 |
| Key External Variables — U.S. Real Gross Domestic Product | 2.4 | 2.9 | 2.3 | 1.7 | 1.8 | 1.9 |
| Key External Variables — WTI Crude Oil ($ US per Barrel) | 51 | 65 | 57 | 58 | 63 | 65 |
| Key External Variables — Canadian Dollar (Cents US) | 77.0 | 77.2 | 75.4 | 76.3 | 77.0 | 77.9 |
| Key External Variables — Three-Month Treasury Bill Rate1 | 0.7 | 1.4 | 1.6 | 1.5 | 1.5 | 1.8 |
| Key External Variables — 10-Year Government Bond Rate2 | 1.8 | 2.3 | 1.5 | 1.6 | 2.1 | 2.5 |
Table 2.6 footnotes:
p = Ontario Ministry of Finance planning projection.
[1], [2] Government of Canada interest rates (per cent).
Sources: Statistics Canada, Canada Mortgage and Housing Corporation, Canadian Real Estate Association, Bank of Canada, United States Bureau of Economic Analysis, “Blue Chip Economic Indicators” (October 2019), U.S. Energy Information Administration and Ontario Ministry of Finance.
Changes to Ontario’s Economic Outlook
The economic growth outlook for Ontario has not changed materially since the time of the 2019 Budget. Despite slower projections for global economic growth, due to lower interest rates the province’s economic growth outlook is largely unchanged since the 2019 Budget.
| 2019p: 2019 Budget |
2019p: 2019 FES |
2020p: 2019 Budget |
2020p: 2019 FES |
2021p: 2019 Budget |
2021p: 2019 FES |
2022p: 2019 Budget |
2022p: 2019 FES |
|
|---|---|---|---|---|---|---|---|---|
| Real Gross Domestic Product | 1.4 | 1.4 | 1.6 | 1.5 | 1.5 | 1.5 | 1.9 | 1.9 |
| Nominal Gross Domestic Product | 3.4 | 3.4 | 3.4 | 3.3 | 3.2 | 3.3 | 3.6 | 3.6 |
| Retail Sales | 3.7 | 2.6 | 3.3 | 3.3 | 2.9 | 3.2 | 4.0 | 3.7 |
| Housing Starts (000s) | 72.8 | 70.1 | 71.5 | 72.3 | 75.1 | 74.0 | 77.4 | 77.3 |
| Primary Household Income | 3.5 | 4.0 | 3.6 | 3.9 | 3.8 | 3.8 | 3.9 | 3.8 |
| Compensation of Employees | 3.8 | 4.3 | 3.8 | 4.0 | 3.8 | 3.7 | 4.0 | 3.8 |
| Net Operating Surplus — Corporations | 4.4 | 0.6 | 1.2 | 0.6 | 2.9 | 2.7 | 3.7 | 3.9 |
| Employment | 1.3 | 2.6 | 1.0 | 1.2 | 1.0 | 1.0 | 1.0 | 1.1 |
| Job Creation (000s) | 96 | 189 | 70 | 89 | 77 | 76 | 76 | 85 |
| Consumer Price Index | 1.9 | 2.0 | 2.0 | 2.0 | 1.7 | 1.9 | 1.9 | 1.9 |
| Key External Variables — U.S. Real Gross Domestic Product | 2.5 | 2.3 | 1.8 | 1.7 | 1.8 | 1.8 | 1.9 | 1.9 |
| Key External Variables — WTI Crude Oil ($ US per Barrel) | 58 | 57 | 61 | 58 | 61 | 63 | 64 | 65 |
| Key External Variables — Canadian Dollar (Cents US) | 76.0 | 75.4 | 77.3 | 76.3 | 77.9 | 77.0 | 79.1 | 77.9 |
| Key External Variables — Three-Month Treasury Bill Rate1 (Per Cent) | 1.8 | 1.6 | 2.2 | 1.5 | 2.5 | 1.5 | 2.7 | 1.8 |
| Key External Variables — 10-Year Government Bond Rate2 (Per Cent) | 2.1 | 1.5 | 2.6 | 1.6 | 3.3 | 2.1 | 3.5 | 2.5 |
Table 2.7 footnotes:
p = Ontario Ministry of Finance planning projection.
[1], [2] Government of Canada interest rates.
Sources: Statistics Canada, Canada Mortgage and Housing Corporation, Bank of Canada, U.S. Energy Information Administration, United States Bureau of Economic Analysis, “Blue Chip Economic Indicators” (October 2019) and Ontario Ministry of Finance.
Chart Descriptions
Chart 2.1: Strengthening Labour Market
The chart depicts the monthly employment level and the unemployment rate in Ontario from January 2017 to September 2019. There have been steady gains in employment over the period, growing from 7,074,100 jobs in January 2017 to 7,519,200 jobs in September 2019. The unemployment rate has also declined over the period with peaks of 6.4 per cent in early 2017 to a low of 5.2 per cent in May 2019. Since June 2018, Ontario has added 272,400 net new jobs. At the same time, the unemployment rate has declined 0.6 percentage points from 5.9 per cent to 5.3 per cent in September 2019.
Source: Statistics Canada.
Chart 2.2: Composition of Employment Change Since June 2018
The bar chart shows level changes in certain labour market indicators from June 2018 to September 2019. Since June 2018, total employment in Ontario has increased by 272,000; full-time employment has increased by 180,000, while part-time jobs have increased by 92,000; private-sector employment increased by 131,000, while public-sector employment increased 33,000 and self-employment increased 108,000; and employment in industries paying above-average wages increased 253,000, while employment in industries paying below-average wages increased 19,000.
Note: Above-average wage industries are defined as those with earnings above the average hourly earnings of all industries in 2018.
Sources: Statistics Canada and Ontario Ministry of Finance.
Chart 2.3: Ontario Household Indebtedness Eases
The line chart shows the annual share of household debt to disposable income in Ontario. Between 2010 to 2017 the average share of Ontario household debt to disposable income increased from 162.2 per cent in 2010 to 189.1 per cent in 2017. In 2018, the average share of Ontario household debt to disposable income decreased to 187.1 per cent (Ontario Ministry of Finance estimate).
Sources: Statistics Canada and Ontario Ministry of Finance.
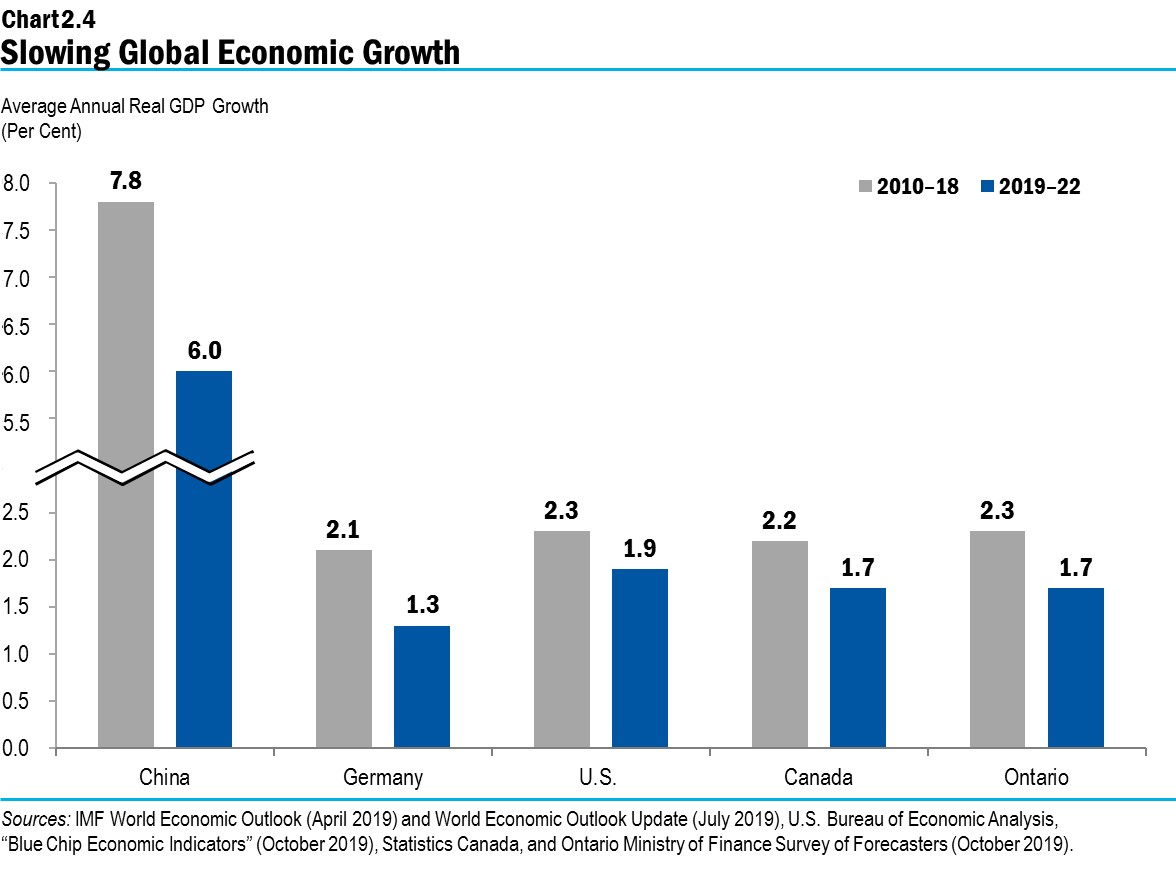
Chart 2.4: Slowing Global Economic Growth
The bar chart illustrates average annual real GDP growth for China, Germany, the United States, Canada and Ontario over the 2010 to 2018 period and the 2019 to 2022 period. Average annual real GDP growth is projected to slow across all these regions over the 2019 to 2022 period. Real GDP is projected to slow from an annual average growth of 7.8 per cent over the 2010 to 2018 period, to 6.0 per cent over the 2019 to 2022 period in China, 2.1 per cent to 1.3 per cent in Germany, 2.3 per cent to 1.9 per cent in the United States, 2.2 per cent to 1.7 per cent in Canada and 2.3 per cent to 1.7 per cent in Ontario.
Sources: IMF World Economic Outlook (April 2019) and Outlook Update (July 2019), U.S. Bureau of Economic Analysis, “Blue Chip Economic Indicators” (October 2019), Statistics Canada, Ontario Ministry of Finance, and Ontario Ministry of Finance Survey of Forecasters (October 2019).
Chart 2.5: Slowdown in World Trade
This bar chart illustrates the growth in exports of goods from the United States, Germany, Japan and Korea and the growth in China’s imports of goods over the January 2016 to December 2017 period and the January 2018 to July 2019 period. Export growth has declined from 17.9 per cent over the January 2016 to December 2017 period, to 3.6 per cent over the January 2018 to July 2019 period in the United States, 24.7 per cent to negative 7.6 per cent in Germany, 20.2 per cent to negative 1.2 per cent in Japan, and 24.9 to negative 12.2 per cent in Korea. In addition, import growth in China has slowed from 37.2 over the January 2016 to December 2017 period, to negative 6.5 per cent over the January 2018 to July 2019 period.
Note: The values of exports and imports are based in U.S. dollars.
Source: Organisation for Economic Co-operation and Development.
Chart 2.6: Government of Canada Interest Rates Lower
The line chart shows yields for Government of Canada Treasury bills and bond yields. In February 2019, the 3-month Treasury bill yield was 1.7 per cent, 2-year was 1.8 per cent, 5-year was 1.8 per cent, 10-year was 1.9 per cent and the 30-year was 2.2 per cent. In September 2019, the 3-month Treasury bill yield was 1.6 per cent, 2-year was 1.6 per cent, 5-year was 1.4 per cent, 10-year was 1.4 per cent and the 30-year was 1.6 per cent.
Source: Bank of Canada.
Chart 2.7: Canada Yield Curve and Recessions
The line chart shows various points since 1982 where the spread between the Government of Canada 10-year bond yield and 3-month Treasury bill rate was negative or inverted. Some of these were followed by a Canada recession, such as the 1990–91 and the 2008–09 recessions. The chart shows inversions in 1986, 1992, 1998 and 2000 were not followed by a recession. The yield curve spread has been inverted since the end of May of 2019.
Sources: Bank of Canada and Statistics Canada.
Chart 2.8: Ontario’s Current Economic Expansion Long by Historical Standards
The chart shows the average annualized quarterly growth rate for Ontario economic expansions and recessions on the vertical axis; it shows the length, in quarters, of expansions and recessions on the horizontal axis. The current expansion, beginning in 2009, has lasted for 40 quarters with an average annualized growth rate of 2.3 per cent.
Other recession or expansion periods with length and growth rates include: 1982, 3 quarters, negative 7.8 per cent; 1982 to 1989, 29 quarters, 5.2 per cent; 1990 to 1991, 5 quarters, negative 5.2 per cent; 1991 to 1992, 4 quarters, 2.1 per cent; 1992, 2 quarters, negative 0.7 per cent; 1992 to 2003, 42 quarters, 4.0 per cent; 2003, 2 quarters, negative 1.8 per cent; 2003 to 2008, 19 quarters, 2.1 per cent; 2008 to 2009, 4 quarters, negative 4.7 per cent.
Sources: Statistics Canada and Ontario Ministry of Finance.
Chart 2.9: U.S. Volatility Index
The line chart shows the U.S. Volatility Index since the beginning of 2017. The index stayed within the range of 9 to 16 throughout 2017. The index spiked above 35 at the beginning and end of 2018. It was also elevated throughout other times of the year. In 2019, the index ranged between 12 and 26. The index averaged 19 in the first week of October.
Note: The CBOE volatility index is one of the most recognized measures of stock market volatility. As a forward-looking measure, it calculates the expected annualized change in the S&P 500 index in either direction over the following 30 days, computed using options data.
Source: Chicago Board Options Exchange.
Chart 2.10: Ontario Home Resales Growth
The bar chart shows historical annual growth in Ontario’s home resales from 2016 to 2018 and projected growth from 2019 to 2022. Ontario’s home resales grew 8.7 per cent in 2016 and declined 9.8 per cent in 2017 and 12.9 per cent in 2018. Resales are projected to grow 10.1 per cent in 2019, 8.0 per cent in 2020, 3.8 per cent in 2021 and 1.2 per cent in 2022.
Sources: Canadian Real Estate Association and Ontario Ministry of Finance.
Chart 2.11: Ontario Average Home Resale Price Growth
The bar chart shows historical annual growth in Ontario’s average home resale price from 2016 to 2018 and projected growth from 2019 to 2022. The Ontario average home resale price grew 15.2 per cent in 2016, 9.3 per cent in 2017 and declined 2.4 per cent in 2018. It is projected to grow 4.5 per cent in 2019, 6.3 per cent in 2020, 4.8 per cent in 2021 and 4.0 per cent in 2022.
Sources: Canadian Real Estate Association and Ontario Ministry of Finance.