Introduction
Since the outset of COVID‑19, the government has created flexibility so that the fiscal plan could be responsive to emerging needs and make the necessary resources available to protect and support people during the health and economic crisis. To build on the government’s record of transparency, the 2020 Budget includes a multi-year fiscal plan to ensure the people of Ontario are informed by the most up-to-date information available, despite the unprecedented uncertainty caused by COVID‑19.
As a result of the response to the COVID‑19 outbreak, the government is projecting a $38.5 billion deficit in 2020–21. Over the medium term, the government projects steadily declining deficits of $33.1 billion in 2021–22, and $28.2 billion in 2022–23.
The net debt-to-GDP ratio is projected to be 47.0 per cent in 2020–21, 0.1 percentage point lower than the 47.1 per cent forecast presented in the 2020–21 First Quarter Finances. The government is projecting higher net debt-to-GDP ratios over the medium-term outlook.
| Actual 2019–20 |
Current Outlook1 2020–21 |
Medium-Term Outlook 2021–22 |
Medium-Term Outlook 2022–23 |
|
|---|---|---|---|---|
| Revenue | 156.1 | 151.1 | 152.3 | 160.2 |
| Expense — Programs | 152.3 | 174.6 | 170.2 | 172.4 |
| Expense — Interest on Debt | 12.5 | 12.5 | 13.2 | 13.9 |
| Total Expense | 164.8 | 187.0 | 183.4 | 186.3 |
| Surplus/(Deficit) Before Reserve | (8.7) | (36.0) | (31.1) | (26.2) |
| Reserve | – | 2.5 | 2.0 | 2.0 |
| Surplus/(Deficit) | (8.7) | (38.5) | (33.1) | (28.2) |
| Net Debt as a Per Cent of GDP | 39.7 | 47.0 | 48.5 | 49.6 |
| Accumulated Deficit as a Per Cent of GDP | 25.3 | 31.2 | 33.0 | 34.1 |
Table 3.1 footnotes:
[1] For the purposes of the legislated requirements for a budget and mid-year review in the Fiscal Sustainability, Transparency, and Accountability Act, 2019, the 2020–21 current outlook represents the plan year of the Budget as well as the current fiscal year of the mid-year review.
Note: Numbers may not add due to rounding.
Sources: Ontario Treasury Board Secretariat and Ministry of Finance.
The following sections detail the actions taken by the government since the release of the March 2020 Economic and Fiscal Update to implement its fiscal plan.
Key 2020–21 Changes
Ontario’s 2020–21 deficit is projected to be $38.5 billion — an increase of $18.0 billion from the outlook published in the March 2020 Economic and Fiscal Update and unchanged from the forecast reported in the 2020–21 First Quarter Finances update. The economic impacts of the COVID‑19 pandemic have been significant and unprecedented. As a result, the 2020–21 First Quarter Finances included substantial new investments and contingencies to support jobs and protect the health of the people of Ontario.
The 2020 Budget is projecting revenues in 2020–21 to be $151.1 billion, $0.5 billion higher than forecast in the 2020–21 First Quarter Finances. This projection is based on revenue information available to October 5, 2020. Information arriving subsequent to this date will be reflected in future updates.
Program expense is projected to be $174.6 billion, $394 million higher than the 2020–21 First Quarter Finances forecast, primarily due to additional supports put in place for the people of Ontario in response to the unprecedented economic and health impacts of COVID‑19.
Ontario is forecast to pay $12.5 billion in interest costs in 2020–21, unchanged from the forecast in the 2020–21 First Quarter Finances.
The net debt-to-GDP ratio is now projected to be 47.0 per cent in 2020–21, 0.1 percentage point lower than the 47.1 per cent forecast in the 2020–21 First Quarter Finances. The net debt-to-GDP ratio decreased as a result of the higher nominal GDP forecast relative to the 2020–21 First Quarter Finances.
The 2020–21 outlook also maintains a $2.5 billion reserve to protect the fiscal plan against unforeseen adverse changes in the Province’s revenue and expense forecasts for the remainder of the fiscal year.
| March 2020 Economic and Fiscal Update | 2020–21 First Quarter Finances | Current Outlook 2020–211 |
Change since March 2020 Economic and Fiscal Update | Change since 2020–21 First Quarter Finances | |
|---|---|---|---|---|---|
| Revenue | 156,266 | 150,612 | 151,074 | (5,192) | 462 |
| Expense — Programs | 161,077 | 174,192 | 174,586 | 13,509 | 394 |
| Expense — Interest on Debt | 13,199 | 12,458 | 12,456 | (743) | (2) |
| Total Expense | 174,276 | 186,651 | 187,042 | 12,766 | 391 |
| Surplus/(Deficit) Before Reserve | (18,010) | (36,038) | (35,968) | (17,958) | 70 |
| Reserve | 2,500 | 2,500 | 2,500 | – | – |
| Surplus/(Deficit) | (20,510) | (38,538) | (38,468) | (17,958) | 70 |
Table 3.2 footnotes:
[1] For the purposes of the legislated requirements for a budget and mid-year review in the Fiscal Sustainability, Transparency and Accountability Act, 2019, the 2020–21 current outlook represents the plan year of the Budget as well as the current fiscal year of the mid-year review.
Note: Numbers may not add due to rounding.
Sources: Ontario Treasury Board Secretariat and Ministry of Finance.
Revenue
The 2020–21 total revenue outlook is $151.1 billion, $462 million higher than projected in the 2020–21 First Quarter Finances. The increase in the revenue forecast is mainly due to higher Government of Canada transfers, partially offset by lower net income from Government Business Enterprises (GBEs).
| 2020–21 | |
|---|---|
| March 2020 Economic and Fiscal Update Revenue Outlook | 156,266 |
| Revenue Changes in the 2020–21 First Quarter Finances | (5,654) |
| Revenue Changes since the 2020–21 First Quarter Finances — Taxation Revenue — Land Transfer Tax | 420 |
| Revenue Changes since the 2020–21 First Quarter Finances — Taxation Revenue — Beer, Wine and Spirits Taxes | 8 |
| Revenue Changes since the 2020–21 First Quarter Finances — Taxation Revenue — Education Property Tax | (210) |
| Revenue Changes since the 2020–21 First Quarter Finances — Taxation Revenue — Employer Health Tax | (90) |
| Revenue Changes since the 2020–21 First Quarter Finances — Taxation Revenue — Sales Tax | (45) |
| Revenue Changes since the 2020–21 First Quarter Finances — Taxation Revenue — Electricity Payments-in-Lieu of Taxes | (19) |
| Revenue Changes since the 2020–21 First Quarter Finances — Total Taxation Revenue | 64 |
| Revenue Changes since the 2020–21 First Quarter Finances — Government of Canada Transfers | 771 |
| Revenue Changes since the 2020–21 First Quarter Finances — Government Business Enterprises — Ontario Lottery and Gaming Corporation | (400) |
| Revenue Changes since the 2020–21 First Quarter Finances — Government Business Enterprises — Liquor Control Board of Ontario | (17) |
| Revenue Changes since the 2020–21 First Quarter Finances — Government Business Enterprises — Ontario Power Generation/Hydro One Ltd. | 31 |
| Revenue Changes since the 2020–21 First Quarter Finances — Total Government Business Enterprises | (386) |
| Revenue Changes since the 2020–21 First Quarter Finances — Other Non-Tax Revenue | 13 |
| Total Revenue Changes since the 2020–21 First Quarter Finances | 462 |
| 2020 Budget Total Revenue Outlook | 151,074 |
Table 3.3 footnotes:
Note: Numbers may not add due to rounding.
Source: Ontario Ministry of Finance.
Key changes in the revenue outlook compared to the 2020–21 First Quarter Finances include:
- Land Transfer Tax revenue is higher by $420 million due to stronger housing resales;
- Beer, Wine and Spirits Taxes are higher by $8 million mainly due to the shift to domestic production of certain beer brands, partially offset by further delaying indexation of beer basic tax rates;
- Education Property Tax is lower by $210 million reflecting the impact of the proposed new municipal option to target tax relief to small businesses and the reduction in Business Education Tax (BET) rates in 2021. For further information, see Annex: Details of Tax Measures and Other Legislative Initiatives;
- Employer Health Tax is lower by $90 million due to the proposed doubling of the Employer Health Tax exemption for eligible private-sector employers. For further information, see Annex: Details of Tax Measures and Other Legislative Initiatives;
- Sales Tax revenue is lower by $45 million reflecting the impact of electricity pricing relief on Harmonized Sales Tax revenues. For more details, see Chapter 1, Section C: Recover — Creating the Conditions for Growth;
- Electricity Payments-in-Lieu of Taxes (PILs) are lower by $19 million mainly due to a revised projection reflecting an updated PILs forecast for municipal electricity utilities (MEUs);
- Government of Canada Transfers have increased by $771 million, mainly reflecting an increase in funding from the Safe Return to Class Fund;
- Net income from the Ontario Lottery and Gaming Corporation is lower by $400 million largely due to the continued shutdown of casinos through the second quarter of the fiscal year;
- Net income from the Liquor Control Board of Ontario is lower by $17 million mainly due to the impact of the shift to domestic production of certain beer brands and cancelling previously scheduled increases to select markups;
- Net income from Ontario Power Generation and Hydro One Ltd. combined is projected to be higher by $31 million, in part due to an Ontario Energy Board decision earlier in the year on Hydro One's 2020–2022 Transmission rate application, as well as Hydro One’s acquisitions of Peterborough Distribution Inc. and Orillia Power Distribution Corporation; and
- Other Non-Tax Revenues combined is higher by $13 million mainly due to revised projections of Power Supply Contracts Recoveries, which is offset by increased expense for Power Supply Contract Costs.
Expense
The 2020–21 total expense outlook is $187.0 billion, $391 million higher than the 2020–21 First Quarter Finances forecast and includes additional supports to protect the people of Ontario through investments in health and supports for people, jobs and economic recovery, mostly funded by existing contingencies.
| 2020–21 | |
|---|---|
| March 2020 Economic and Fiscal Update Expense Outlook | 174,276 |
| Program Expense Changes — Net Program Expense Increase for Safe Restart Agreement — Municipal and Transit1 | 2,406 |
| Program Expense Changes — Net Program Expense Increase for Temporary Pandemic Pay2 | 1,129 |
| Program Expense Changes — Support for Health | 5,883 |
| Program Expense Changes — Support for People and Jobs | 5,510 |
| Program Expense Changes — Top-Up of Standard Contingency Fund | 2,236 |
| Program Expense Changes — Drawdown of the Standard Contingency Fund to Offset Spending | (815) |
| Program Expense Changes — Drawdown of the COVID‑19 Health Contingency Fund to Offset Spending | (894) |
| Program Expense Changes — Drawdown of the Support for People and Jobs Fund | (1,881) |
| Program Expense Changes — Spending Accommodated Through Current Fiscal Framework3 | (459) |
| Total Program Expense Changes | 13,115 |
| Interest on Debt Changes | (741) |
| Total Expense Changes in the 2020–21 First Quarter Finances | 12,374 |
| Program Expense Changes Since the 2020–21 First Quarter Finances — Supports to Protect — Integrated Health Capacity Plan – Testing and Contact Tracing | 1,376 |
| Program Expense Changes Since the 2020–21 First Quarter Finances — Supports to Protect — Integrated Health Capacity Plan – Hospital Capacity | 351 |
| Program Expense Changes Since the 2020–21 First Quarter Finances — Supports to Protect — Integrated Health Capacity Plan – Backlog and Surgeries | 284 |
| Program Expense Changes Since the 2020–21 First Quarter Finances — Supports to Protect — Integrated Health Capacity Plan – Flu Vaccines and Anti-Virals | 29 |
| Program Expense Changes Since the 2020–21 First Quarter Finances — Supports to Protect — Hospitals – COVID‑19 Expenses | 572 |
| Program Expense Changes Since the 2020–21 First Quarter Finances — Supports to Protect — Personal Support and Hospital Workers Strategy | 367 |
| Program Expense Changes Since the 2020–21 First Quarter Finances — Supports to Protect — Additional Personal Protective Equipment (PPE) Procurement | 200 |
| Program Expense Changes Since the 2020–21 First Quarter Finances — Supports to Protect — Infection Prevention and Control (IPAC) | 30 |
| Program Expense Changes Since the 2020–21 First Quarter Finances — Supports to Protect — Enhancing IPAC Capacity Within Congregate Settings4, 5 | 15 |
| Program Expense Changes Since the 2020–21 First Quarter Finances — Supports to Protect — Long-Term Care – Prevention and Containment Measures | 405 |
| Program Expense Changes Since the 2020–21 First Quarter Finances — Supports to Protect — Long-Term Care Minor Capital Renovations for IPAC | 61 |
| Program Expense Changes Since the 2020–21 First Quarter Finances — Supports to Protect — Long-Term Care – Stabilizing Lost Occupancy Revenue | 40 |
| Program Expense Changes Since the 2020–21 First Quarter Finances — Supports to Protect — Long-Term Care IPAC Professionals | 20 |
| Program Expense Changes Since the 2020–21 First Quarter Finances — Supports to Protect — Long-Term Care Commission | 3 |
| Program Expense Changes Since the 2020–21 First Quarter Finances — Supports to Protect — Extending the High Wage Transition Fund (HWTF) | 3 |
| Program Expense Changes Since the 2020–21 First Quarter Finances — Supports to Protect — All Other Changes | 112 |
| Program Expense Changes Since the 2020–21 First Quarter Finances — Total Supports to Protect6 | 3,867 |
| Program Expense Changes Since the 2020–21 First Quarter Finances — Support for People, Jobs and Recovery — Support for Learners | 380 |
| Program Expense Changes Since the 2020–21 First Quarter Finances — Support for People, Jobs and Recovery — Assistance for Businesses Subject to Targeted Public Health Measures | 300 |
| Program Expense Changes Since the 2020–21 First Quarter Finances — Support for People, Jobs and Recovery — Electricity Price Mitigation | 71 |
| Program Expense Changes Since the 2020–21 First Quarter Finances — Support for People, Jobs and Recovery — Main Street Relief Fund | 65 |
| Program Expense Changes Since the 2020–21 First Quarter Finances — Support for People, Jobs and Recovery — Ontario Onwards Acceleration Fund | 60 |
| Program Expense Changes Since the 2020–21 First Quarter Finances — Support for People, Jobs and Recovery — Domestic Tourism | 30 |
| Program Expense Changes Since the 2020–21 First Quarter Finances — Support for People, Jobs and Recovery — Community Building Fund | 25 |
| Program Expense Changes Since the 2020–21 First Quarter Finances — Support for People, Jobs and Recovery — Funding to Preserve Ontario’s Arts Institutions | 25 |
| Program Expense Changes Since the 2020–21 First Quarter Finances — Support for People, Jobs and Recovery — 3M Grant for Project Investment | 23 |
| Program Expense Changes Since the 2020–21 First Quarter Finances — Support for People, Jobs and Recovery — Seniors’ Home Safety Tax Credit | 10 |
| Program Expense Changes Since the 2020–21 First Quarter Finances — Support for People, Jobs and Recovery — Agricultural and Horticultural Societies Enhanced Support | 5 |
| Program Expense Changes Since the 2020–21 First Quarter Finances — Support for People, Jobs and Recovery — Initiatives to Support Parks and Conservation | 5 |
| Program Expense Changes Since the 2020–21 First Quarter Finances — Support for People, Jobs and Recovery — Forest Sector Safety Measures Fund | 5 |
| Program Expense Changes Since the 2020–21 First Quarter Finances — Support for People, Jobs and Recovery — Wastewater Surveillance Pilots for COVID‑19 Detection | 5 |
| Program Expense Changes Since the 2020–21 First Quarter Finances — Support for People, Jobs and Recovery — Increasing Investments in the Ontario Black Youth Action Plan | 4 |
| Program Expense Changes Since the 2020–21 First Quarter Finances — Support for People, Jobs and Recovery — National Disaster Mitigation Program (NDMP)7 | 4 |
| Program Expense Changes Since the 2020–21 First Quarter Finances — Support for People, Jobs and Recovery — Agri-food Prevention and Control Innovation Program | 3 |
| Program Expense Changes Since the 2020–21 First Quarter Finances — Support for People, Jobs and Recovery — The Lou Fruitman Reena Residence | 3 |
| Program Expense Changes Since the 2020–21 First Quarter Finances — Support for People, Jobs and Recovery — Ontario Centres of Excellence/Toronto Business Development Centre Soft Landing Initiative | 1 |
| Program Expense Changes Since the 2020–21 First Quarter Finances — Support for People, Jobs and Recovery — Building Pathways to Careers in Corrections | 1 |
| Program Expense Changes Since the 2020–21 First Quarter Finances — Support for People, Jobs and Recovery — Inclusive Community Grants Program | 1 |
| Program Expense Changes Since the 2020–21 First Quarter Finances — Support for People, Jobs and Recovery — COVID‑19 Relief Fund for Francophone Non-Profit Organizations | 1 |
| Program Expense Changes Since the 2020–21 First Quarter Finances — Total Support for People, Jobs and Recovery8 | 1,028 |
| Program Expense Changes Since the 2020–21 First Quarter Finances — Other Changes — Schools Reopening (Safe Return to Class Fund) | 381 |
| Program Expense Changes Since the 2020–21 First Quarter Finances — Other Changes — Bulk Media Buy Program Advertising Campaigns | 48 |
| Program Expense Changes Since the 2020–21 First Quarter Finances — Other Changes — Digital First Strategy Investments | 2 |
| Program Expense Changes Since the 2020–21 First Quarter Finances — Other Changes — Ontario's Response to Lebanon Disaster – Relief Funding | 2 |
| Program Expense Changes Since the 2020–21 First Quarter Finances — Other Changes — All Other Changes | 4 |
| Program Expense Changes Since the 2020–21 First Quarter Finances — Total Other Changes | 438 |
| Program Expense Changes Since the 2020–21 First Quarter Finances — Drawdown of the Standard Contingency Fund to Offset Spending | (53) |
| Program Expense Changes Since the 2020–21 First Quarter Finances — Projected Drawdown of the COVID‑19 Health Contingency Fund to Offset Spending9 | (3,852) |
| Program Expense Changes Since the 2020–21 First Quarter Finances — Drawdown of the Support for People and Jobs Fund10 | (1,034) |
| Total Program Expense Changes Since the 2020–21 First Quarter Finances | 394 |
| Interest on Debt Change Since the 2020–21 First Quarter Finances | (2) |
| Total Expense Changes Since the 2020–21 First Quarter Finances | 391 |
| 2020 Budget Total Expense Outlook | 187,042 |
Table 3.4 footnotes:
[1], [2] Full or partial funding attributed to increase in the updated Ontario’s Action Plan. Expense change not offset by any funding made available as part of Ontario’s Action Plan: Responding to COVID‑19 announced on March 25, 2020.
[3] Includes inter- and intra-ministry transfers for initiatives announced as part of the March 2020 Economic and Fiscal Update.
[4], [6], [9] The COVID‑19 Health Contingency Fund reflects projected drawdowns for spending in Supports to Protect except Enhancing IPAC Capacity Within Congregate Settings, which is offset by the Support for People and Jobs Fund. For details on time-limited funding and contingencies, see Table 3.10.
[5], [7], [8], [10] The Support for People and Jobs Fund reflects drawdowns for spending in Supports for People, Jobs and Recovery except for items offset by federal revenue and the Enhancing IPAC Capacity Within Congregate Settings in Supports to Protect. For details on time-limited funding and contingencies, see Table 3.10.
Note: Numbers may not add due to rounding.
Sources: Ontario Treasury Board Secretariat and Ministry of Finance.
The 2020–21 First Quarter Finances included substantial new investments to protect the economy and health of the people of Ontario. Key examples include partnering with the federal government to provide $4 billion in one-time assistance for municipalities and transit systems under the Safe Restart Agreement and over $1.5 billion for a temporary pay increase of $4 per hour for more than 375,000 eligible workers for work performed from April 24 to August 13, 2020. Additional prudence totalling almost $9.6 billion was allocated to the standard Contingency Fund, the COVID‑19 Health Contingency Fund and the Support for People and Jobs Fund to ensure that additional resources would be available during the fight against COVID‑19.
As Ontario continues on the path to economic recovery, protecting people’s health remains the government’s top priority and an essential aspect of the province’s economic recovery.
Since the release of the 2020–21 First Quarter Finances, key changes to program expense projections include:
- More resources to bolster health care and support frontline workers:
- $1.4 billion to expand laboratory capacity, reduce testing backlogs, support existing assessment centres and more testing locations. Funding will also support additional contact tracers and case managers to trace and isolate new COVID‑19 cases;
- $351 million to build additional hospital capacity to handle a surge in COVID‑19 and influenza patients;
- $284 million to address surgical and diagnostic backlogs by supporting extended hours for additional priority surgeries and diagnostic imaging;
- $572 million to support hospitals facing additional costs related to responding to COVID‑19;
- $367 million for wage enhancements for personal support workers (PSWs) and direct support workers in home and community care, long-term care, public hospitals and the social services sector. Investments will help attract and retain professionals to care for patients, clients and residents in response to COVID‑19; and
- $200 million for the procurement of personal protective equipment (PPE) and critical supplies to protect health care workers, patients, and frontline staff in other sectors.
- Additional resources to support people and protect jobs through the pandemic and in the long term include:
- $380 million to provide financial assistance directly to parents to help support their children’s learning this year;
- $300 million to provide relief for businesses subject to new, targeted public health measures by helping to offset fixed costs. The Province has committed to assist with costs associated with property taxes and energy bills;
- $71 million for electricity pricing relief for industrial and commercial electricity employers;
- $65 million in support through one-time grants of up to $1,000 for main street small businesses in retail, food, accommodations and other service sectors that have two to nine employees, to help offset unexpected costs of personal protective equipment;
- $60 million for the Ontario Onwards Acceleration Fund to provide targeted funding to support the rapid scale-up and implementation of initiatives that will lay the groundwork for longer-term changes in how government works;
- $30 million to support domestic tourism;
- $25 million to develop a Community Building Fund that supports community tourism, cultural and sport not-for-profit assets in communities that draw both local and regional tourism;
- $25 million to support Ontario’s arts institutions;
- $23 million to support an investment by 3M at its Brockville, Ontario manufacturing facility that will produce made-in-Ontario N95 respirators; and
- $10 million for a proposed new Seniors’ Home Safety Tax Credit.
- Other changes include $381 million from the federal Safe Return to Class Fund to provide critical supports and personal protective equipment to safely reopen schools.
Interest on Debt expense is $12.5 billion, unchanged from the forecast in the 2020–21 First Quarter Finances.
Prudence
The 2020–21 First Quarter Finances maintained a reserve of $2.5 billion set in the March 2020 Economic and Fiscal Update to protect the fiscal outlook against unforeseen adverse changes to revenue and expense. The reserve remains unchanged at $2.5 billion in the 2020 Budget to ensure a prudent risk management approach given uncertainties remaining in the fiscal outlook for 2020–21.
Building on the previous 2020–21 fiscal updates, the government has maintained dedicated contingency funds for any emerging needs to support the Province’s ongoing efforts against COVID‑19. After accounting for the draws from these funds reported in the 2020 Budget, the net position of the dedicated COVID‑19 Health Contingency Fund is projected to be $0.6 billion and the Support for People and Jobs Fund is currently projected at $2.1 billion in 2020–21. Standard Contingency Funds are also maintained to help mitigate expense risks — for example, in cases where health and safety may be compromised — that may otherwise adversely affect Ontario’s fiscal performance. The remaining standard Contingency Fund is currently projected at $3.0 billion for 2020–21. Any unused contingency funds at year end will go towards reducing Ontario’s net debt position.
The COVID‑19 pandemic has reinforced the government’s commitment to managing the province’s finances in a responsible and sustainable manner. This is reflected in the government’s approach to provide targeted time-limited funding to address the extraordinary needs of the health care system and to support people and jobs during this unprecedented global pandemic. This also maintains the government’s ability to remain responsive to COVID‑19.
Medium-Term Fiscal Plan
The government is projecting deficits of $33.1 billion in 2021–22 and $28.2 billion in 2022–23.
Over the medium term, revenue is forecast to increase from $156.1 billion in 2019–20 to $160.2 billion in 2022‑23, while total expense is projected to increase from $164.8 billion to $186.3 billion over the same period. Details of these are outlined below.
The Fiscal Sustainability, Transparency and Accountability Act, 2019 (FSTAA) requires the government to produce estimates of the major components of revenue and expense, and their underlying forecasts and assumptions.
Medium-Term Revenue Outlook
| Actual 2019–20 |
Current Outlook1 2020–21 |
Medium-Term Outlook 2021–22 |
Medium-Term Outlook 2022–23 |
|
|---|---|---|---|---|
| Revenue — Personal Income Tax | 37.7 | 36.9 | 36.0 | 38.1 |
| Revenue — Sales Tax | 28.6 | 24.9 | 27.1 | 29.1 |
| Revenue — Corporations Tax | 15.4 | 9.9 | 13.0 | 14.0 |
| Revenue — Ontario Health Premium | 4.1 | 4.0 | 4.1 | 4.3 |
| Revenue — Education Property Tax | 6.2 | 6.1 | 5.8 | 5.7 |
| Revenue — All Other Taxes | 16.3 | 15.7 | 16.5 | 17.2 |
| Total Taxation Revenue | 108.3 | 97.5 | 102.5 | 108.5 |
| Government of Canada | 25.4 | 33.4 | 27.1 | 27.6 |
| Income from Government Business Enterprises | 5.9 | 3.6 | 4.9 | 6.0 |
| Other Non-Tax Revenue | 16.5 | 16.7 | 17.9 | 18.1 |
| Total Revenue | 156.1 | 151.1 | 152.3 | 160.2 |
Table 3.5 footnotes:
[1]For the purposes of the legislated requirements for a budget and mid-year review in the Fiscal Sustainability, Transparency, and Accountability Act, 2019, the 2020–21 current outlook represents the plan year of the Budget as well as the current fiscal year of the mid-year review.
Note: Numbers may not add due to rounding.
Source: Ontario Ministry of Finance.
The taxation revenue forecast reflects the outlook for the economy, experience from past periods of economic recession and recovery, and government tax policy commitments. See Chapter 2: Recent Economic Performance and Outlook for more details.
The primary driver of the forecast for Personal Income Tax (PIT) revenue is the outlook for economy-wide compensation of employees. The forecast also reflects projected Canada Emergency Response Benefit (CERB) payments that have been deemed taxable by the federal government. Between 2019–20 and 2022–23, PIT revenue is projected to grow at an average annual rate of 0.3 per cent per year, with a decline of 2.2 per cent in 2020–21 and growth averaging 1.6 per cent over 2021–22 and 2022–23.
The Sales Tax revenue projection is based primarily on the outlook for household consumption spending. Sales Tax revenue is projected to grow at an average annual rate of 0.5 per cent between 2019–20 and 2022–23, with a decline of 13.1 per cent in 2020–21 and growth averaging 8.1 per cent over 2021–22 and 2022–23.
The forecast for Corporations Tax (CT) revenue is driven by the projected net operating surplus of corporations. Corporations Tax revenue is projected to decline at an average annual rate of 3.1 per cent between 2019–20 and 2022–23, with a decline of 35.5 per cent in 2020–21 and growth averaging 18.8 per cent over 2021–22 and 2022–23.
The Ontario Health Premium revenue forecast is based primarily on the outlook for compensation of employees. The forecast also reflects projected CERB payments that have been deemed taxable by the federal government. Ontario Health Premium revenue is projected to increase at an average annual rate of 1.9 per cent between 2019–20 and 2022–23, with a decline of 1.3 per cent in 2020–21 and growth averaging 3.5 per cent over 2021–22 and 2022–23.
Education Property Tax revenue is projected to decrease at an average annual rate of 2.5 per cent between 2019–20 and 2022–23. This is largely due to the impact of the proposed new municipal option to target tax relief to small businesses and the reduction in Business Education Tax (BET) rates in 2021. For further information, see Annex: Details of Tax Measures and Other Legislative Initiatives.
Revenues from All Other Taxes are projected to increase at an average annual rate of 2.0 per cent between 2019–20 and 2022–23, with a decline of 3.6 per cent in 2020–21 and growth averaging 4.9 per cent over 2021–22 and 2022–23. This includes revenues from the Employer Health Tax, Land Transfer Tax, Beer, Wine and Spirits Taxes and volume-based taxes such as the Gasoline Tax, Fuel Tax and Tobacco Tax.
The forecast for Government of Canada transfers is based on existing federal–provincial funding agreements and formulas. The sharp increase in 2020–21 reflects one-time federal support of about $7 billion related to the COVID‑19 pandemic. In the medium term, the outlook for federal transfers is mainly driven by existing funding arrangements for major federal transfer programs such as the Canada Health Transfer and the Canada Social Transfer.
The outlook for Income from Government Business Enterprises (GBEs) is based on Ontario Ministry of Finance estimates for Hydro One Ltd. (Hydro One) and projections provided by Ontario Power Generation (OPG), the Ontario Cannabis Store (OCS), the Liquor Control Board of Ontario (LCBO) and the Ontario Lottery and Gaming Corporation (OLG). Revenues from GBEs are projected to decline sharply in 2020–21 mainly due to the impact of the COVID‑19 pandemic on OLG. Combined revenues from GBEs are expected to rise over the forecast period returning to pre-pandemic levels in 2022–23.
The forecast for Other Non-Tax Revenue is based on projections provided by government ministries and provincial agencies. The outlook for Other Non-Tax revenues is projected to increase at an average annual rate of 3.0 per cent, with growth of 1.1 per cent in 2020–21 and averaging 4.0 per cent over 2021–22 and 2022–23.
Cannabis-Related Revenue
Estimates of cannabis-related revenue include Ontario’s portion of the federal cannabis excise duty and the net income of the Ontario Cannabis Store. The outlook for cannabis-related revenue reflects the continued expansion of the province’s open market for retail cannabis stores.
| Revenue | Actual 2019–20 |
Current Outlook1 2020–21 |
Medium-Term
Outlook 2021–22 |
Medium-Term Outlook 2022–23 |
|---|---|---|---|---|
| Ontario Portion of Federal Cannabis Excise Duty | 48 | 145 | 255 | 325 |
| Ontario Cannabis Store Net Income | 19 | 80 | 170 | 240 |
Table 3.6 footnotes:
[1] For the purposes of the legislated requirements for a budget and mid-year review in the Fiscal Sustainability, Transparency, and Accountability Act, 2019, the 2020–21 current outlook represents the plan year of the Budget as well as the current fiscal year of the mid-year review.
Source: Ontario Ministry of Finance.
Risks to the Revenue Outlook
There are a variety of risks to the economic planning assumptions underlying the revenue forecast. As outlined in Chapter 2: Recent Economic Performance and Outlook, global economic risks are elevated due to the COVID‐19 outbreak. Table 3.7 highlights some of the key sensitivities and risks to the 2020–21 revenue forecast that could arise from unexpected changes in economic conditions. These estimates are only guidelines; actual results can vary depending on the composition and interaction of various factors. The risks identified are based on factors that are considered to have the most material impact on the largest revenue sources. In the context of 2020–21, these sensitivities reflect experience during past economic recessions.
Taxation revenues tend to fluctuate more sharply than underlying economic factors during periods of economic recession and recovery for a variety of reasons. For example, past experience indicates that shifts in the composition of household consumption spending towards non-taxed essentials such as food and shelter, and away from durable goods, affect the sales tax revenues generated from the overall level of household consumption spending. Also, sudden swings in corporate incomes from profits to losses result in loss carry back provisions of the tax system being exercised by corporations that generate relatively large changes in Corporate Income Tax revenues. Factors not explicitly reflected in GDP measures, such as revaluation of assets including equities and land can also have played a role in past recessions, reducing revenues more sharply than indicated by GDP. The net impact of these other factors results in the taxation revenue forecast declining by 10.0 per cent in 2020–21, much more sharply than the 5.0 per cent decline in nominal GDP.
| Economic Factors | Revenue Sources | 2020–21 Sensitivities |
|---|---|---|
| Nominal GDP | Total Taxation Revenue | $2,030 million revenue change for each percentage point change in nominal GDP growth. Can vary significantly, depending on the composition and source of changes in GDP growth. |
| Compensation of Employees | Personal Income Tax, Ontario Health Premium and Employer Health Tax | $995 million revenue change for each percentage point change in growth in compensation of employees. |
| Household Consumption Expenditures | Harmonized Sales Tax | $195 million revenue change for each percentage point change in growth of household consumption expenditures. |
| Net Operating Surplus of Corporations | Corporations Tax | $150 million revenue change for each percentage point change in growth of net corporations operating surplus. |
| Housing Resales and Resale Prices | Land Transfer Tax | $35 million revenue change for each percentage point change in growth of either the number or prices of housing resales. |
| Ontario Population Share | Canada Health Transfer | $40 million revenue change for each one-tenth of a percentage point change in Ontario’s population share. |
| Ontario Population Share | Canada Social Transfer | $15 million revenue change for each one-tenth of a percentage point change in Ontario’s population share. |
Table 3.7 footnotes:
Source: Ontario Ministry of Finance.
Revenue Outlook Scenarios
The global economic disruptions caused by the COVID‑19 pandemic have led to unprecedented uncertainty surrounding the economic and revenue forecasts. While the planning assumptions for economic growth used in the development of the revenue forecast are reasonable and slightly prudent based on available private-sector economic forecasts, there are a broad range of factors that could result in economic growth being relatively stronger or weaker.
In order to illustrate the unprecedented degree of economic uncertainty, the Ministry of Finance has developed two plausible alternative scenarios that the economy could take over the next several years. See Chapter 2: Recent Economic Performance and Outlook for more details. Based on the two alternative economic scenarios, two taxation revenue scenarios were developed, Faster Growth and Slower Growth representing reasonable paths intended to illustrate a broader range of possible outcomes.
| 2021–22p | 2022–23p | |
|---|---|---|
| Faster Growth Scenario | 107.8 | 115.1 |
| Planning Projection | 102.5 | 108.5 |
| Slower Growth Scenario | 100.1 | 103.4 |
Table 3.8 footnotes:
p = Ontario Ministry of Finance planning projection and alternative scenarios.
Source: Ontario Ministry of Finance.
In the Faster Growth scenario, total taxation revenue over the medium term is $6.7 billion higher in 2022–23 than the planning projection, while in the Slower Growth scenario, total taxation revenue is $5.1 billion dollars lower.
In the event that the alternative economic scenarios materialize as opposed to the planning projection, the province’s deficit outlook in the next two years will also change as a result, assuming that program spending plans remain the same.
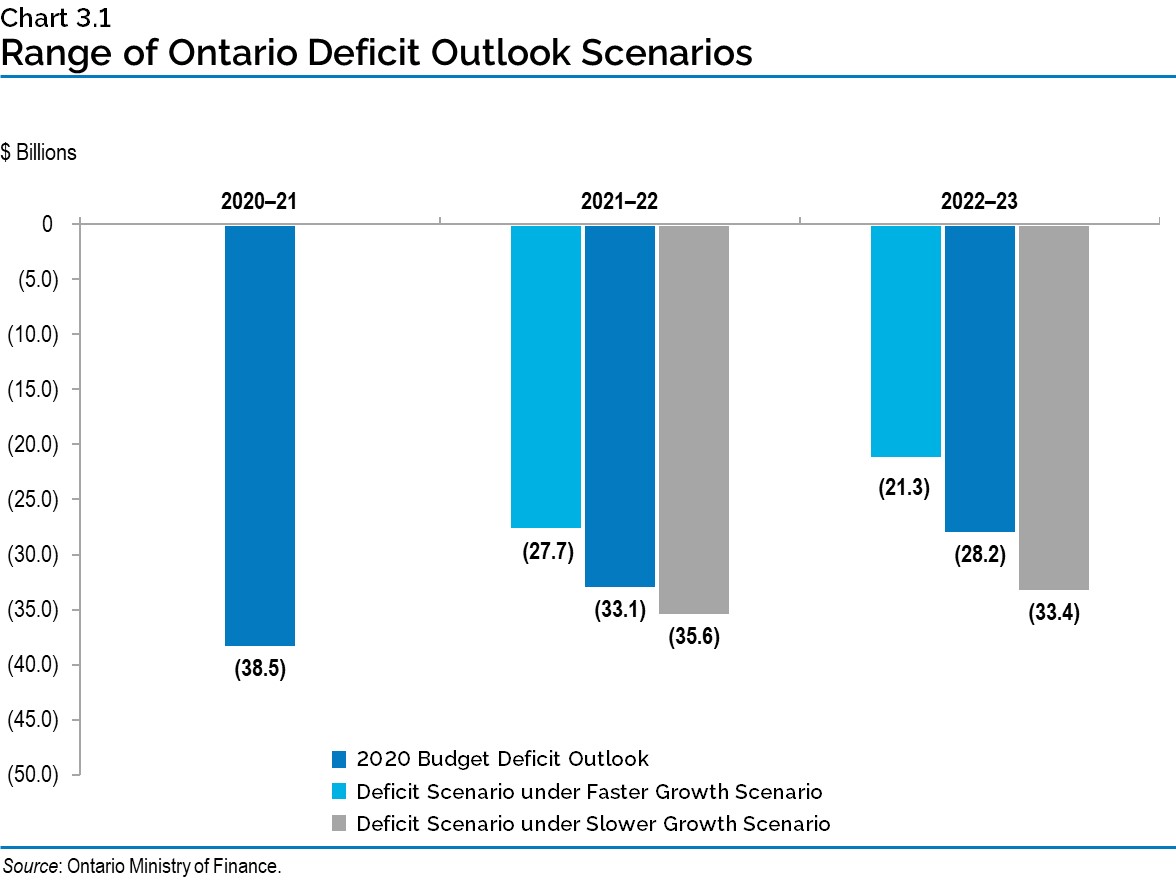
Under the Faster Growth scenario, the deficit outlook may improve to $27.7 billion in 2021–22 and $21.3 billion in 2022–23. However, if the Slower Growth scenario takes place instead, the deficit outlook may deteriorate to $35.6 billion and $33.4 billion in the next two years.
Medium-Term Expense Outlook
The Province’s program expense outlook is projected to grow from $152.3 billion in 2019–20 to $172.4 billion in 2022–23. This reflects the government’s commitment to invest in programs such as health care, education, child care and social services for the province’s most vulnerable people.
| Actual 2019–20 |
Current Outlook1 2020–21 |
Medium-Term Outlook 2021–22 |
Medium-Term Outlook 2022–23 |
|
|---|---|---|---|---|
| Programs — Health Sector2 | 63.7 | 64.6 | 67.0 | 68.5 |
| Programs — Education Sector3 | 30.2 | 31.0 | 31.1 | 31.3 |
| Programs — Postsecondary Education Sector | 10.5 | 10.7 | 10.9 | 11.2 |
| Programs — Children’s and Social Services Sector | 17.1 | 17.9 | 17.8 | 17.9 |
| Programs — Justice Sector | 4.7 | 4.6 | 4.6 | 4.6 |
| Programs — Other Programs4 | 26.0 | 45.7 | 38.8 | 38.9 |
| Total Programs | 152.3 | 174.6 | 170.2 | 172.4 |
| Interest on Debt | 12.5 | 12.5 | 13.2 | 13.9 |
| Total Expense | 164.8 | 187.0 | 183.4 | 186.3 |
Table 3.9 footnotes:
[1] For the purposes of the legislated requirements for a budget and mid-year review in the Fiscal Sustainability, Transparency, and Accountability Act, 2019, the 2020–21 current outlook represents the plan year of the Budget as well as the current fiscal year of the mid-year review.
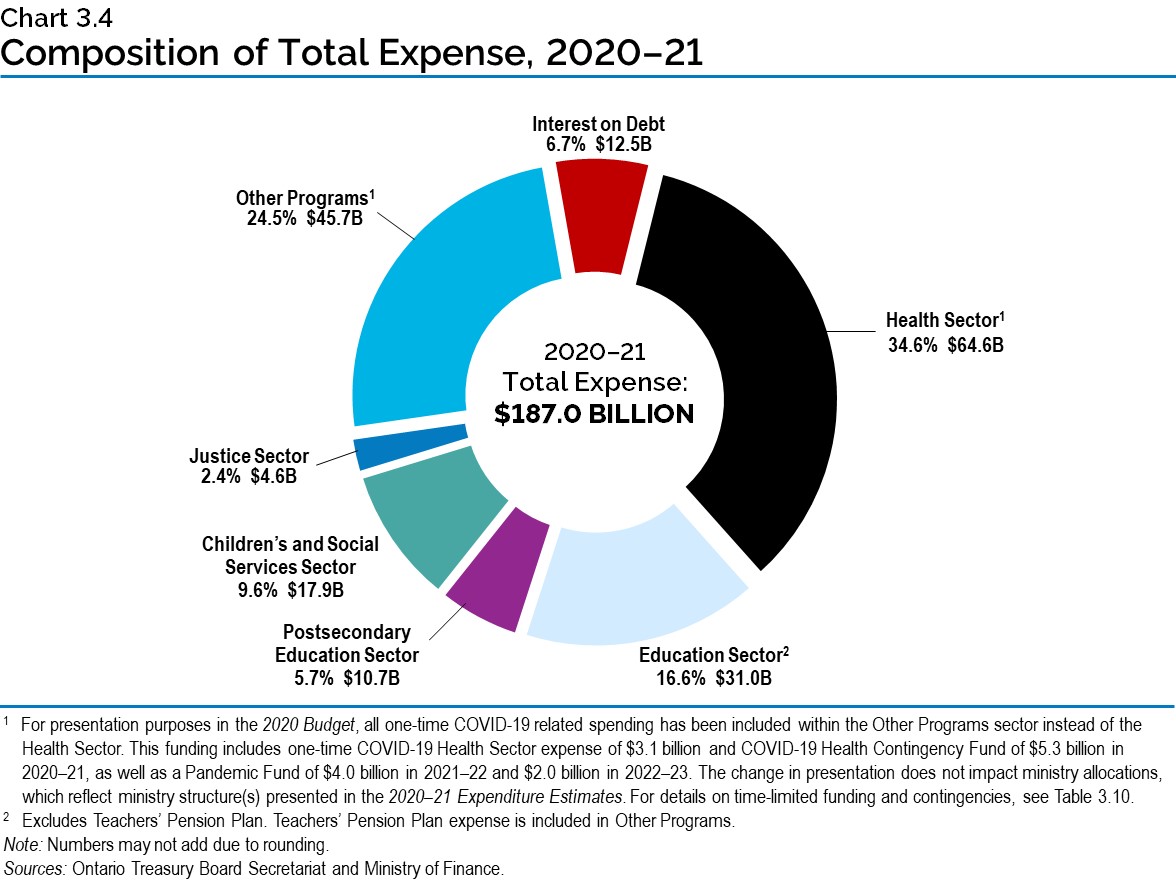
[2], [4] For presentation purposes in the 2020 Budget, all one-time COVID‑19 related spending has been included within the Other Programs sector instead of the Health Sector. This funding includes one-time COVID‑19 Health Sector expense of $3.1 billion and COVID‑19 Health Contingency Fund of $5.3 billion in 2020–21, as well as a Pandemic Fund of $4.0 billion in 2021–22 and $2.0 billion in 2022–23. The change in presentation does not impact ministry allocations, which reflect ministry structure(s) presented in the 2020–21 Expenditure Estimates. For details on time-limited funding and contingencies, see Table 3.10.
[3] Excludes Teachers’ Pension Plan, which is included in Other Programs.
Note: Numbers may not add due to rounding.
Sources: Ontario Treasury Board Secretariat and Ministry of Finance.
Highlights of the program expense outlook over the medium term include the following:
- Base Health sector expense is projected to increase from $63.7 billion in 2019–20 to $68.5 billion in 2022–23. Key initiatives include:
- Providing hospitals with $594 million in additional annualized funding over three years to help stabilize the sector, increase hospital capacity, address increased demands on hospitals, and manage waitlists for life-saving and elective treatments and procedures;
- Investments to enable more physicians to conduct virtual care visits with their patients using digital channels. An increased number of patients will be able to have virtual visits with their health care providers, including home and community care and community paramedicine, from their location of choice, such as the comfort of their own home;
- $206 million over three years to protect the people of Ontario from preventable diseases by purchasing vaccines and antivirals to support the Province’s immunization program and stockpiles;
- $131 million over three years to ensure the people of Ontario have access to vital blood products used to treat a variety of conditions including burns, bleeding disorders, liver diseases and many types of cancer;
- $61 million annually to increase support for the operations of long-term care homes and to improve and maintain the quality of care and overall resident experience; and
- $23 million annually for a new minor capital program that will support the ongoing repair of long-term care homes and allow operators to maintain safe and modern facilities for their residents.
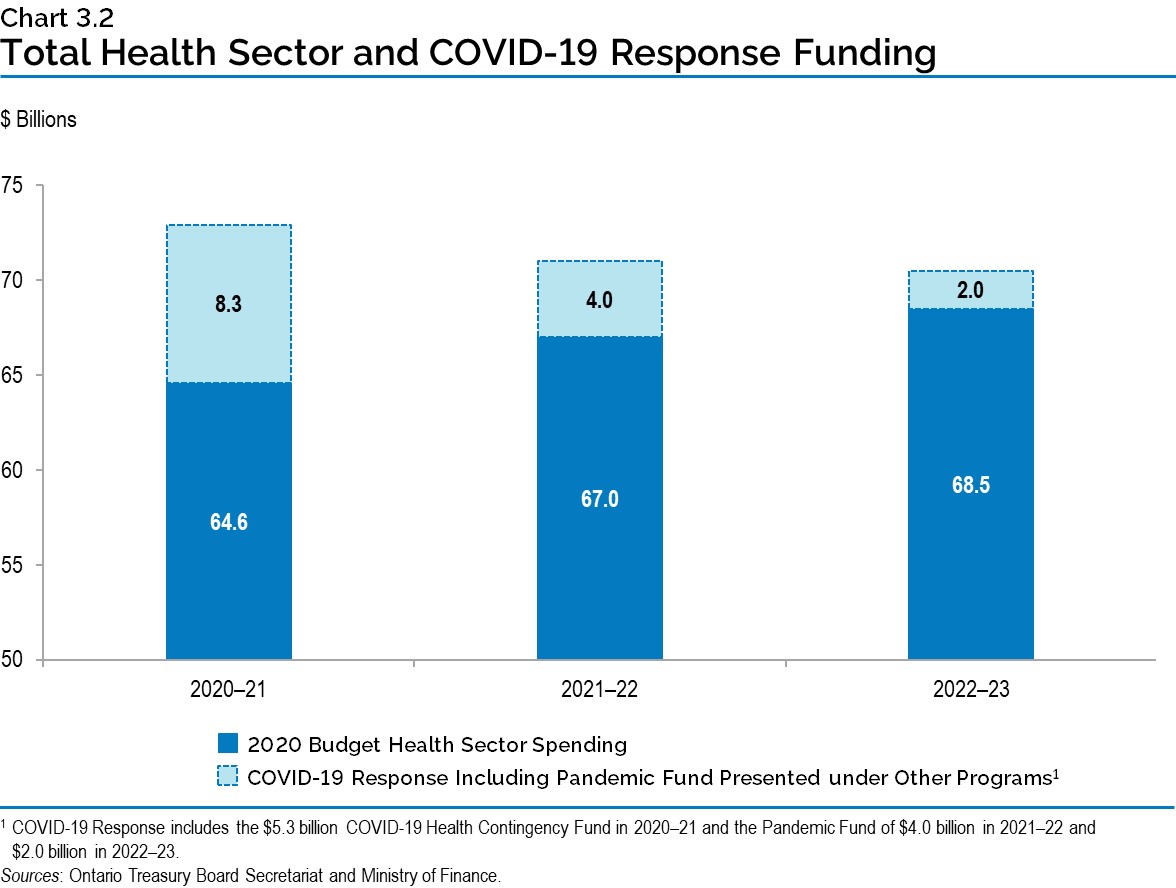
The Province continues to ensure that the necessary resources are available to protect people’s health and support the health care system. As a result, it has made substantial time-limited funding available for the Province’s health sector response that is dedicated to support the fight against the pandemic. In 2020–21 this dedicated support is projected to be $8.3 billion, with an additional $4 billion set-aside in 2021–22, and a further $2 billion in 2022–23.
- Education sector expense is projected to increase from $30.2 billion in 2019‑20 to $31.3 billion in 2022‑23. Key initiatives include:
- $381 million from the federal Safe Return to Class Fund to provide critical supports and personal protective equipment to safely reopen schools;
- Incorporating the terms of the ratified central agreements with teachers and education workers; and
- $380 million in time-limited financial support directly to parents to help them support their children’s learning in 2020–21.
- Postsecondary Education sector expense is projected to increase from $10.5 billion in 2019–20 to $11.2 billion in 2022–23. Key initiatives in this sector include:
- Investing $59.5 million over three years in support of the development, delivery, and expansion of Ontario’s Micro-credentials Strategy;
- Maintaining financial sustainability of the Ontario Student Assistance Program (OSAP); and
- Investing $466 million in capital grants over three years to improve the state of facilities at postsecondary institutions and ensure that facilities provide a safe environment for faculty, staff and students.
- Children’s and Social Services sector expense is projected to increase from $17.1 billion in
2019–20 to $17.9 billion in 2022–23. Key initiatives include:- Increased funding of $361 million in 2021–22 in Developmental Services to continue to support clients currently in service and new high-risk clients; and
- Increased funding of $526 million in 2021–22 to social assistance as the government implements a sustainable and modern recovery and renewal plan that gives recipients a path to jobs, greater independence and improved outcomes.
- Justice sector expense is projected to remain stable, decreasing slightly from $4.7 billion in
2019–20 to $4.6 billion in 2022–23. Key initiatives include:- Collective bargaining increases for the Ontario Provincial Police (OPP), correctional services staff, provincial government lawyers and judicial officers;
- Investments of $217 million over three years to enhance resources for frontline and emergency responders;
- Statutory obligations related to the Crown Liability and Proceedings Act, 2019; and
- Enhancement of the Victim Quick Response Program+ to better support victims of crime and their families.
- Other Programs sector expense is projected to increase from $26.0 billion in 2019–20 to $38.9 billion in 2022–23. Key Initiatives include:
- $8.3 billion made available in 2020–21 as part of the Province’s COVID‑19 response to continue to protect the province from COVID‑19. For the next two years, 2021–22 and 2022–23, an additional support of $6.0 billion is also dedicated towards pandemic funding;
- An additional $1.8 billion in the Support for People and Jobs Fund over the next two years, 2021–22 and 2022–23, to continue providing supports for the people of Ontario as the economic recovery unfolds;
- Through the Safe Restart Agreement, Ontario and the federal government are providing up to $4 billion in 2020–21 in urgently needed one-time assistance to Ontario’s 444 municipalities and 110 transit systems to help local governments address municipal operating pressures and maintain critical services such as public transit;
- Approximately $1.3 billion over three years to provide electricity pricing relief for industrial and commercial employers;
- $340 million in 2020–21 to provide temporary immediate relief for industrial and commercial employers that do not participate in the Regulated Price Plan by deferring a portion of Global Adjustment (GA) charges. The deferred amount is expected to be recovered over a 12-month period beginning in January 2021;
- Over $680 million in additional funding over the next four years to expand broadband and cellular infrastructure across Ontario to enable economic recovery and growth, create direct and indirect jobs, improve connectivity and enable Ontario’s businesses to remain competitive in the global economy; and
- Over $1 billion in federal and provincial funding under the newly established COVID‑19 Resilience stream of the Investing in Canada Infrastructure Program (ICIP), to support health and safety through the accelerated delivery of priority municipal infrastructure projects as well as investments to retrofit schools and long-term care homes.
The total expense outlook includes interest on debt expense, which is projected to grow from $12.5 billion in 2019–20 to $13.9 billion in 2022–23 due to the increase in debt required to fund deficits as well as investments in capital infrastructure.
Prudence
In keeping with sound fiscal practices, the Province’s revenue outlook is based on prudent economic planning projections, as discussed in Chapter 2: Recent Economic Performance and Outlook.
Ontario incorporates prudence in the form of a reserve to protect the fiscal outlook against unforeseen adverse changes in the province’s revenue and expense, including those resulting from changes in Ontario’s economic performance. The reserve has been set at $2.5 billion in 2020–21, $2.0 billion in 2021–22, and $2.0 billion in 2022–23. Additionally, standard Contingency Funds are maintained to help mitigate expense risks — for example, in cases where health and safety may be compromised, and which may otherwise adversely affect Ontario’s fiscal performance.
In order to support Ontario families, businesses and the health care heroes on the front lines of the pandemic, the Province has made available time-limited funding and extraordinary contingencies of $13.3 billion in 2020–21, $5 billion in 2021–22 and $2.8 billion in 2022–23. This funding is tracked under the categories of COVID‑19 health sector response, a Pandemic Fund and the Support for People and Jobs Fund and is reflected in the Other Programs sector of the expense outlook. The balances remaining in these funds enable the government to continue to respond to COVID‑19 and support the recovery for the province.
| Current
Outlook1 2020–21 |
Medium-Term Outlook 2021–22 |
Medium-Term Outlook 2022–23 |
|
|---|---|---|---|
| Time-Limited Funding and Contingencies — One-time COVID‑19 Health Sector Expense | 3,052 | – | – |
| Time-Limited Funding and Contingencies — COVID‑19 Health Contingency Fund | 5,294 | – | – |
| Time-Limited Funding and Contingencies — Pandemic Fund | – | 4,000 | 2,000 |
| Time-Limited Funding and Contingencies — Subtotal: COVID‑19 Response Including Pandemic Fund | 8,346 | 4,000 | 2,000 |
| Time-Limited Funding and Contingencies — Support for People and Jobs Fund | 4,966 | 1,000 | 800 |
| Total Time-Limited Funding and Contingencies | 13,312 | 5,000 | 2,800 |
| Remaining Balances2 — COVID‑19 Health Contingency Fund Net of New Projected Drawdowns in the 2020 Budget3 | 598 | – | – |
| Remaining Balances4 — Pandemic Fund | – | 4,000 | 2,000 |
| Remaining Balances5 — Subtotal: COVID‑19 Response Including Pandemic Fund | 598 | 4,000 | 2,000 |
| Remaining Balances6 — Support for People and Jobs Fund | 2,050 | 1,000 | 800 |
| Total Remaining Balances | 2,648 | 5,000 | 2,800 |
Table 3.10 footnotes:
[1] For the purposes of the legislated requirements for a budget and mid-year review in the Fiscal Sustainability, Transparency, and Accountability Act, 2019, the 2020–21 current outlook represents the plan year of the Budget as well as the current fiscal year of the mid-year review.
[2], [4], [5], [6] As at October 13, 2020.
[3] The COVID‑19 Health Contingency Fund remaining balance is net of projected new spending drawn from the fund since 2020–21 First Quarter Finances. See Table 3.4 for details.
Note: Numbers may not add due to rounding.
Sources: Ontario Treasury Board Secretariat and Ministry of Finance.
Risks to the Expense Outlook
Table 3.11 provides a summary of key expense risks and sensitivities that could result from unexpected changes in economic conditions and program demands. A change in these factors could affect total expense and the public sector, causing variances in the overall fiscal forecast. These sensitivities are illustrative and can vary, depending on the nature and composition of potential risks.
| Program/Sector | 2020–21 Assumption | 2020–21 Sensitivity |
|---|---|---|
| Health Sector (base) | Annual growth of 1.5 per cent | One per cent change in health spending: $646.5 million |
| Hospitals Sector Expense (base)1 | Annual growth of 2.6 per cent | One per cent change in hospitals sector expense: $188.8 million |
| COVID‑19 Testing | Cost per additional 10,000 tests/day | Additional 10,000 COVID‑19 tests: $0.48 million/day2 |
| Drug Programs (base) | Annual growth of 1.3 per cent | One per cent change in program expenditure of drug programs: $48.5 million |
| Ontario Health Insurance Plan (OHIP) (base) | Annual growth of 3.4 per cent | One per cent change in OHIP expense: $163.1 million |
| Long-Term Care Homes | 78,188 long-term care home beds. Average provincial annual operating cost per bed in a long-term care home: $58,237 | One per cent change in number of beds: approximately $45.5 million3 |
| Home Care4 | Approximately 32.6 million hours of personal support services | One per cent change in hours of personal support services: approximately $12.8 million |
| Home Care5 | Approximately 9.2 million nursing and therapy visits and 2.5 million nursing shifts | One per cent change in all nursing and therapy visits: approximately $10.6 million |
| Elementary and Secondary Schools | Approximately 2,036,000 average daily pupil enrolment | One per cent enrolment change: approximately $170 million |
| Ontario Works6 | 238,970 average annual caseloads | One per cent caseload change: approximately $28 million |
| Ontario Disability Support Program7 | 388,626 average annual caseloads | One per cent caseload change: approximately $57 million |
| Interest on Debt | Average cost of borrowing in 2020–21 is forecast to be 1.60 per cent | The impact of a 100 basis-point change in borrowing rates is forecast to be over $800 million |
Table 3.11 footnotes:
[1] Hospitals Sector Expense includes funding from the Ministry of Health and the Ministry of Long-Term Care, and a number of provincial programs from other ministries, as well as other third-party revenues.
[2] Estimated cost per day is based on an average of $47.50 per test for tests conducted by the diagnostic lab network. Tests processed outside of the network are more expensive on a per-test basis.
[3] Based on Long Term Care Transfer Payment 2020–21 Plan of $4,553.4 million.
[4], [5] Home Care statistics are based on 2018–19 data and estimates.
[6], [7] Expense sensitivities for Ontario Works and the Ontario Disability Support Program do not reflect the impact of COVID‑19.
Sources: Ontario Treasury Board Secretariat and Ministry of Finance.
Contingent Liabilities
In addition to the key demand sensitivities and economic risks to the fiscal plan, there are risks stemming from the government’s contingent liabilities. Whether these contingencies will result in actual liabilities for the Province is beyond the direct control of the government. Losses could result from legal settlements, defaults on projects, and loan and funding guarantees. Provisions for losses that are likely to occur and can be reasonably estimated are expensed and reported as liabilities in the Province’s financial statements. Any significant contingent liabilities related to the 2019–20 fiscal year have been disclosed as part of the Public Accounts of Ontario 2019–2020 released in September.
Transparency and Risks
The government is committed to being open and transparent about the state of Ontario’s finances. This principle is reflected in the Fiscal Sustainability, Transparency and Accountability Act, 2019,which stipulates that Ontario’s fiscal policy should be based on cautious assumptions.
While mid-year updates to the government’s finances are informed by the latest information available, key information still to be received over the remainder of the fiscal year may have further upside and downside risks, which could materially affect the fiscal outlook. Revenue could be affected by changes in the economy, while expenses could be impacted by changes in utilization of large demand driven programs.
As a matter of transparent fiscal risk management practices, risks are monitored throughout the fiscal year by the Treasury Board, with the goal of ensuring that robust and prudent methodologies are used to develop forecasts. Other important risk management tools include closely tracking the pace of implementation of initiatives and proactively identifying emerging program and policy risks. Comprehensive analysis of known risks informs the fiscal planning processes, including the development of plans to mitigate and manage fiscal risks, as well as integrating risks into medium-term fiscal projections when appropriate.
Details of Ontario’s Finances
| Actual 2017–18 |
Actual 2018–19 |
Actual
2019–20 |
Current Outlook1 2020–21 |
|
|---|---|---|---|---|
| Taxation Revenue — Personal Income Tax | 32,900 | 35,381 | 37,743 | 36,901 |
| Taxation Revenue — Sales Taxes | 25,923 | 27,804 | 28,619 | 24,879 |
| Taxation Revenue — Corporations Tax | 15,612 | 16,606 | 15,414 | 9,941 |
| Taxation Revenue — Education Property Tax | 5,883 | 6,171 | 6,179 | 6,060 |
| Taxation Revenue — Employer Health Tax | 6,205 | 6,544 | 6,731 | 6,346 |
| Taxation Revenue — Ontario Health Premium | 3,672 | 3,819 | 4,059 | 4,007 |
| Taxation Revenue — Gasoline Tax | 2,701 | 2,709 | 2,783 | 2,379 |
| Taxation Revenue — Land Transfer Tax | 3,174 | 2,761 | 3,067 | 3,384 |
| Taxation Revenue — Tobacco Tax | 1,244 | 1,241 | 1,118 | 1,108 |
| Taxation Revenue — Fuel Tax | 760 | 774 | 807 | 672 |
| Taxation Revenue — Beer, Wine and Spirits Taxes | 603 | 607 | 582 | 593 |
| Taxation Revenue — Electricity Payments in Lieu of Taxes | 494 | 435 | 505 | 486 |
| Taxation Revenue — Ontario Portion of the Federal Cannabis Excise Duty | – | 19 | 48 | 145 |
| Taxation Revenue — Other Taxes | 552 | 653 | 623 | 561 |
| Taxation Revenue — Total | 99,723 | 105,524 | 108,278 | 97,462 |
| Government of Canada — Canada Health Transfer | 14,359 | 14,852 | 15,640 | 16,252 |
| Government of Canada — Canada Social Transfer | 5,314 | 5,451 | 5,650 | 5,832 |
| Government of Canada — Equalization | 1,424 | 963 | – | – |
| Government of Canada — Infrastructure Programs | 1,065 | 605 | 400 | 1,013 |
| Government of Canada — Labour Market Programs | 969 | 1,015 | 1,054 | 1,091 |
| Government of Canada — Social Housing Agreement | 419 | 394 | 484 | 331 |
| Government of Canada — Other Federal Payments | 996 | 1,420 | 1,756 | 8,434 |
| Government of Canada — Direct Transfers to Broader Public-Sector Organizations | 314 | 390 | 414 | 407 |
| Government of Canada — Total | 24,860 | 25,090 | 25,398 | 33,360 |
| Income from Government Business Enterprises — Liquor Control Board of Ontario | 2,207 | 2,276 | 2,402 | 2,377 |
| Income from Government Business Enterprises — Ontario Power Generation Inc./Hydro One Ltd. | 1,464 | 772 | 1,167 | 893 |
| Income from Government Business Enterprises — Ontario Lottery and Gaming Corporation | 2,487 | 2,464 | 2,309 | 200 |
| Income from Government Business Enterprises — Ontario Cannabis Store | (6) | (42) | 19 | 80 |
| Income from Government Business Enterprises — Total | 6,152 | 5,470 | 5,897 | 3,550 |
| Other Non-Tax Revenue — Fees, Donations and Other Revenues from Hospitals, School Boards and Colleges | 8,309 | 9,237 | 9,281 | 9,740 |
| Other Non-Tax Revenue — Vehicle and Driver Registration Fees | 1,912 | 1,991 | 2,055 | 2,061 |
| Other Non-Tax Revenue — Miscellaneous Other Non-Tax Revenue | 1,616 | 1,873 | 1,222 | 1,377 |
| Other Non-Tax Revenue — Other Fees and Licences | 1,029 | 1,088 | 1,156 | 1,105 |
| Other Non-Tax Revenue — Sales and Rentals2 | 2,450 | 1,477 | 1,369 | 1,045 |
| Other Non-Tax Revenue — Reimbursements | 1,000 | 998 | 1,005 | 961 |
| Other Non-Tax Revenue — Royalties | 290 | 251 | 283 | 278 |
| Other Non-Tax Revenue — Power Supply Contract Recoveries | 185 | 173 | 122 | 107 |
| Other Non-Tax Revenue — Net Reduction of Power Purchase Contracts | 74 | 41 | 30 | 28 |
| Other Non-Tax Revenue — Electricity Debt Retirement Charge3 | 593 | 15 | – | – |
| Other Non-Tax Revenue — Carbon Allowance Proceeds | 2,401 | 472 | – | – |
| Other Non-Tax Revenue — Total | 19,859 | 17,616 | 16,523 | 16,702 |
| Total Revenue | 150,594 | 153,700 | 156,096 | 151,074 |
Table 3.12 footnotes:
[1] For the purposes of the legislated requirements for a budget and mid-year review in the Fiscal Sustainability, Transparency, and Accountability Act, 2019, the 2020–21 current outlook represents the plan year of the Budget as well as the current fiscal year of the mid-year review.
[2] Higher Sales and Rentals revenues in 2017–18 compared to 2018–19 and 2019–20 are mainly due to significant, non-recurring asset sale initiatives such as the sale of Hydro One shares.
[3] The Debt Retirement Charge cost was removed from residential electricity users’ electricity bills as of January 1, 2016 and for all other consumers as of April 1, 2018. Residual revenues recorded afterwards due to higher than expected amounts received following the 2017–18 year-end, compared to the estimated accrual amounts in 2017–18.
Note: Numbers may not add due to rounding.
Source: Ontario Ministry of Finance.
| Ministry Expense | Actual 2017–18 |
Actual 2018–19 |
Actual 2019–20 |
Current Outlook2 2020–21 |
|---|---|---|---|---|
| Agriculture, Food and Rural Affairs (Base) | 384 | 330 | 298 | 313.8 |
| Agriculture, Food and Rural Affairs — Federal-Provincial Infrastructure Programs | 102 | 96 | 94 | 104.0 |
| Agriculture, Food and Rural Affairs — Municipal Infrastructure Program Investments3 | 195 | 257 | 222 | 10.0 |
| Agriculture, Food and Rural Affairs — Demand-Driven Risk Management and Time-Limited Programs4 | 312 | 383 | 518 | 442.6 |
| Agriculture, Food and Rural Affairs (Total)5 | 993 | 1,065 | 1,132 | 870.4 |
| Attorney General (Base) | 1,700 | 1,771 | 1,750 | 1,682.2 |
| Attorney General — Statutory Appropriations – Crown Liability and Proceedings Act, 2019 | 42 | 17 | 192 | – |
| Attorney General (Total) | 1,742 | 1,787 | 1,942 | 1,682.2 |
| Board of Internal Economy (Total) | 296 | 371 | 257 | 280.8 |
| Children, Community and Social Services (Total) | 16,300 | 16,841 | 17,104 | 17,927.5 |
| Colleges and Universities (Base) | 8,595 | 9,030 | 9,221 | 9,394.7 |
| Colleges and Universities — Student Financial Assistance | 1,663 | 2,043 | 1,296 | 1,274.4 |
| Colleges and Universities — Time-Limited Infrastructure Funding under the Strategic Investment Fund | 209 | 119 | 2 | – |
| Colleges and Universities6 (Total) | 10,467 | 11,192 | 10,520 | 10,669.1 |
| Economic Development, Job Creation and Trade (Base) | 418 | 356 | 319 | 362.9 |
| Economic Development, Job Creation and Trade — Time-Limited Investments | 422 | 430 | 263 | 356.2 |
| Economic Development, Job Creation and Trade (Total) | 840 | 786 | 582 | 719.2 |
| Education (Base) | 27,265 | 28,746 | 30,181 | 31,038.2 |
| Education — Teachers’ Pension Plan7 | 1,659 | 1,678 | 1,570 | 1,620.7 |
| Education (Total) | 28,923 | 30,424 | 31,751 | 32,658.9 |
| Energy, Northern Development and Mines (Base)8 | 1,283 | 1,362 | 1,100 | 1,047.0 |
| Energy, Northern Development and Mines — Electricity Cost Relief Programs | 2,834 | 4,243 | 5,484 | 6,209.0 |
| Energy, Northern Development and Mines (Total) | 4,117 | 5,605 | 6,584 | 7,256.0 |
| Environment, Conservation and Parks (Base) | 706 | 464 | 610 | 669.1 |
| Environment, Conservation and Parks — Time-Limited Investments | 145 | 223 | 2 | – |
| Environment, Conservation and Parks (Total) | 851 | 687 | 612 | 669.1 |
| Executive Offices (Base) | 37 | 34 | 32 | 37.5 |
| Executive Offices — Time-Limited Assistance | – | – | – | 2.0 |
| Executive Offices (Total) | 37 | 34 | 32 | 39.5 |
| Finance (Base) | 843 | 885 | 806 | 862.0 |
| Finance — Time-Limited Investments | – | – | – | 616.2 |
| Finance — Investment Management Corporation of Ontario9 | – | 67 | 88 | 161.1 |
| Finance — Ontario Municipal Partnership Fund | 506 | 510 | 503 | 501.9 |
| Finance — Power Supply Contract Costs | 191 | 173 | 122 | 107.0 |
| Finance — COVID‑19 Response: Support for People and Jobs Fund | – | – | – | 2,050.0 |
| Finance (Total) | 1,540 | 1,636 | 1,520 | 4,298.2 |
| Francophone Affairs (Total) | 6 | 6 | 5 | 7.1 |
| Government and Consumer Services (Base) | 668 | 651 | 626 | 641.1 |
| Government and Consumer Services — Realty | 982 | 1,012 | 924 | 1,025.9 |
| Government and Consumer Services (Total) | 1,650 | 1,664 | 1,550 | 1,667.0 |
| Health (Total) | 54,982 | 57,573 | 59,293 | 60,110.5 |
| COVID‑19 Response Including COVID‑19 Health Contingency Fund10 | – | – | – | 8,346.0 |
| Heritage, Sport, Tourism and Culture Industries (Base) | 940 | 935 | 908 | 1,031.8 |
| Heritage, Sport, Tourism and Culture Industries — Ontario Cultural Media Tax Credits | 509 | 588 | 656 | 515.2 |
| Heritage, Sport, Tourism and Culture Industries — Ontario Cultural Media Tax Credits – Amounts Related to Prior Years | 145 | 40 | 80 | – |
| Heritage, Sport, Tourism and Culture Industries11 (Total) | 1,594 | 1,562 | 1,643 | 1,547.0 |
| Indigenous Affairs (Base) | 86 | 75 | 73 | 82.2 |
| Indigenous Affairs — One-Time Investments including Settlements | 1,122 | 215 | 14 | 14.0 |
| Indigenous Affairs (Total) | 1,208 | 290 | 87 | 96.2 |
| Infrastructure (Base) | 227 | 161 | 81 | 213.3 |
| Infrastructure — Federal–Provincial Infrastructure Programs | 248 | 352 | 160 | 310.5 |
| Infrastructure — Waterfront Toronto Revitalization (Port Lands Flood Protection) | – | – | 116 | 128.4 |
| Infrastructure — Municipal Infrastructure Program Investments12 | – | – | – | 202.0 |
| Infrastructure (Total) | 475 | 513 | 358 | 854.1 |
| Labour, Training and Skills Development (Base) | 128 | 130 | 100 | 127.7 |
| Labour, Training and Skills Development — Co-op Education and Apprenticeship Tax Credits13 | 208 | 183 | 152 | 82.3 |
| Labour, Training and Skills Development — Demand-Driven Employment and Training Programs | 916 | 943 | 922 | 1,050.9 |
| Labour, Training and Skills Development14 (Total) | 1,253 | 1,257 | 1,173 | 1,260.9 |
| Long-Term Care (Total) | 4,163 | 4,329 | 4,423 | 4,535.8 |
| Municipal Affairs and Housing (Base) | 417 | 475 | 541 | 481.7 |
| Municipal Affairs and Housing — Safe Restart Agreement | – | – | – | 1,900.0 |
| Municipal Affairs and Housing — Time-Limited Investments | 559 | 636 | 317 | 255.8 |
| Municipal Affairs and Housing — Social Housing Agreement – Payments to Service Managers15 | 392 | 367 | 341 | 315.2 |
| Municipal Affairs and Housing (Total) | 1,368 | 1,478 | 1,199 | 2,952.7 |
| Natural Resources and Forestry (Base) | 609 | 505 | 541 | 556.6 |
| Natural Resources and Forestry — Emergency Forest Firefighting | 117 | 208 | 136 | 100.0 |
| Natural Resources and Forestry (Total) | 726 | 713 | 677 | 656.5 |
| Seniors and Accessibility (Base) | 48 | 52 | 54 | 58.2 |
| Seniors and Accessibility — Time-Limited Investments | – | – | – | 129.0 |
| Seniors and Accessibility (Total) | 48 | 52 | 54 | 187.2 |
| Solicitor General (Total) | 2,561 | 2,681 | 2,774 | 2,874.4 |
| Transportation (Base)16 | 4,184 | 4,543 | 4,957 | 4,972.6 |
| Transportation — Safe Restart Agreement | – | – | – | 2,000.0 |
| Transportation — Federal–Provincial Infrastructure Programs | 404 | 297 | 188 | 640.0 |
| Transportation (Total) | 4,588 | 4,840 | 5,145 | 7,612.6 |
| Treasury Board Secretariat (Base) | 194 | 201 | 189 | 406.8 |
| Treasury Board Secretariat — Employee and Pensioner Benefits17 | 1,442 | 1,165 | 1,666 | 1,389.0 |
| Treasury Board Secretariat — Operating Contingency Fund | – | – | – | 2,912.0 |
| Treasury Board Secretariat — Capital Contingency Fund | – | – | – | 99.3 |
| Treasury Board Secretariat (Total) | 1,636 | 1,365 | 1,855 | 4,807.2 |
| Interest on Debt18 | 11,903 | 12,384 | 12,495 | 12,456.0 |
| Total Expense | 154,266 | 161,135 | 164,768 | 187,042.0 |
Table 3.13 footnotes:
[1], [6], [11], [14] Numbers reflect current ministry structure.
[2] For the purposes of the legislated requirements for a budget and mid-year review in the Fiscal Sustainability, Transparency, and Accountability Act, 2019, the 2020–21 current outlook represents the plan year of the Budget as well as the current fiscal year of the mid-year review.
[3], [12], Municipal infrastructure program funding transferring from the Ministry of Agriculture, Food and Rural Affairs to the Ministry of Infrastructure
in 2020–21.
[4] Includes $50 million in previously announced funding to expand the Risk Management Program and reflects extraordinary production insurance payouts due to COVID‑19. Also includes other new time-limited investments in response to COVID‑19.
[5] The 2019–20 amount includes extraordinary production insurance payout of $175 million above annual forecast due to 2019 crop conditions.
[7], [17] Numbers reflect the pension expense that was calculated based on recommendations of the Independent Financial Commission of Inquiry, as described in Note 19 to the Consolidated Financial Statements in Public Accounts of Ontario 2017–2018.
[8], [16] Ontario Northland Transportation Commission transferred from the Ministry of Energy, Northern Development and Mines to the Ministry of Transportation beginning in 2019–20.
[9] Based on the requirements of Public Sector Accounting Standards, the Province consolidated the Investment Management Corporation of Ontario into the Ministry of Finance.
[10] For presentation purposes in the 2020 Budget, all one-time COVID‑19 related spending has been included separately instead of within the Ministry of Health and Ministry of Long-Term Care. This funding includes one-time COVID‑19 Health Sector expense of $3.1 billion and COVID‑19 Health Contingency Fund of $5.3 billion in 2020–21, as well as a Pandemic Fund of $4.0 billion in 2021–22 and $2.0 billion in 2022–23. This change in presentation does not impact ministry allocations, which reflect ministry structure(s) presented in the 2020–21 Expenditure Estimates. For details on time-limited funding and contingencies, see Table 3.10.
[13] Eliminated for eligible apprenticeship programs that commenced on or after November 15, 2017. 2017–18 to 2019–20 include tax credit amounts related to prior years.
[15] The annual decline from 2017–18 to 2020–21 is mainly due to declining federal obligations, such as maturing mortgages, under the Social Housing Agreement.
[18] Interest on debt is net of interest capitalized during construction of tangible capital assets of $234 million in 2020–21.
Note: Numbers may not add due to rounding.
Sources: Ontario Treasury Board Secretariat and Ministry of Finance.
| Sector | Total Infrastructure Expenditures 2019–20 Actual4 |
2020–21 Current Outlook1 Investment in Capital Assets5, 6 |
2020–21 Current Outlook2 Transfers and Other Infrastructure Expenditures7 |
2020–21 Current Outlook3 Total Infrastructure Expenditures |
|---|---|---|---|---|
| Transportation — Transit | 4,374 | 3,704 | 1,095 | 4,799 |
| Transportation — Provincial Highways | 2,596 | 2,477 | 110 | 2,587 |
| Transportation — Other Transportation, Property and Planning | 173 | 166 | 82 | 247 |
| Health — Hospitals | 2,392 | 2,061 | 3 | 2,064 |
| Health — Other Health | 188 | 74 | 169 | 243 |
| Education | 2,064 | 2,382 | 10 | 2,392 |
| Postsecondary Education — Colleges and Other | 444 | 472 | 62 | 534 |
| Postsecondary Education — Universities | 53 | 0 | 100 | 100 |
| Social | 281 | 23 | 145 | 168 |
| Justice | 246 | 519 | 96 | 615 |
| Other Sectors8 | 1,287 | 990 | 1,027 | 2,017 |
| Total Infrastructure Expenditures | 14,098 | 12,868 | 2,899 | 15,767 |
| Less: Other Partner Funding9 | 2,081 | 2,136 | – | 2,136 |
| Total10 | 12,018 | 10,732 | 2,899 | 13,631 |
Table 3.14 footnotes:
[1], [2], [3] For the purposes of the legislated requirements for a budget and mid-year review in the Fiscal Sustainability, Transparency, and Accountability Act, 2019, the 2020–21 current outlook represents the plan year of the Budget as well as the current fiscal year of the mid-year review.
[4] Includes adjustments for the net book value of assets disposed during the year, as well as changes in valuation.
[5] Includes provincial investment in capital assets of $10.6 billion.
[6] Includes $234 million in interest capitalized during construction.
[7] Includes transfers to municipalities, universities and non-consolidated agencies.
[8] Includes government administration, natural resources, and the culture and tourism industries.
[9] Other Partner Funding refers to third-party investments primarily in hospitals, colleges and schools.
[10] Includes Federal/Municipal contributions to provincial infrastructure investments.
Note: Numbers may not add due to rounding.
Source: Ontario Treasury Board Secretariat.
| 2011–12 | 2012–13 | 2013–14 | 2014–15 | 2015–16 | 2016–17 | 2017–18 | 2018–19 | Actual 2019–20 |
Current Outlook3 2020–21 |
|
|---|---|---|---|---|---|---|---|---|---|---|
| Revenue | 116,401 | 120,319 | 122,955 | 126,152 | 136,148 | 140,734 | 150,594 | 153,700 | 156,096 | 151,074 |
| Expense — Programs | 121,222 | 120,103 | 123,330 | 126,199 | 129,905 | 131,460 | 142,363 | 148,751 | 152,273 | 174,586 |
| Expense — Interest on Debt4 | 10,587 | 10,878 | 11,155 | 11,221 | 11,589 | 11,709 | 11,903 | 12,384 | 12,495 | 12,456 |
| Total Expense | 131,809 | 130,981 | 134,485 | 137,420 | 141,494 | 143,169 | 154,266 | 161,135 | 164,768 | 187,042 |
| Reserve | – | – | – | – | – | – | – | – | – | 2,500 |
| Surplus/(Deficit) | (15,408) | (10,662) | (11,530) | (11,268) | (5,346) | (2,435) | (3,672) | (7,435) | (8,672) | (38,468) |
| Net Debt | 241,912 | 259,947 | 276,169 | 294,557 | 306,357 | 314,077 | 323,834 | 338,496 | 353,332 | 397,972 |
| Accumulated Deficit | 164,092 | 174,256 | 184,835 | 196,665 | 203,014 | 205,939 | 209,023 | 216,642 | 225,764 | 264,232 |
| Gross Domestic Product (GDP) at Market Prices | 660,436 | 680,791 | 696,192 | 727,042 | 760,435 | 790,749 | 826,945 | 857,384 | 891,066 | 846,339 |
| Primary Household Income | 444,771 | 459,895 | 473,807 | 490,423 | 512,570 | 520,486 | 543,084 | 567,086 | 590,678 | 580,061 |
| Population — July (000s)5 | 13,261 | 13,391 | 13,511 | 13,618 | 13,707 | 13,875 | 14,070 | 14,309 | 14,545 | 14,734 |
| Net Debt per Capita (dollars) | 18,242 | 19,413 | 20,441 | 21,631 | 22,350 | 22,636 | 23,016 | 23,657 | 24,293 | 27,010 |
| Household Income per Capita (dollars) | 33,539 | 34,345 | 35,069 | 36,014 | 37,394 | 37,511 | 38,598 | 39,632 | 40,611 | 39,369 |
| Net Debt as a Per Cent of Revenue | 207.8% | 216.0% | 224.6% | 233.5% | 225.0% | 223.2% | 215.0% | 220.2% | 226.4% | 263.4% |
| Interest on Debt as a Per Cent of Revenue | 9.1% | 9.0% | 9.1% | 8.9% | 8.5% | 8.3% | 7.9% | 8.1% | 8.0% | 8.2% |
| Net Debt as a Per Cent of GDP | 36.6% | 38.2% | 39.7% | 40.5% | 40.3% | 39.7% | 39.2% | 39.5% | 39.7% | 47.0% |
| Accumulated Deficit as a Per Cent of GDP | 24.8% | 25.6% | 26.5% | 27.1% | 26.7% | 26.0% | 25.3% | 25.3% | 25.3% | 31.2% |
Table 3.15 footnotes:
[1] Amounts reflect a change in pension expense that was calculated based on recommendations of the Independent Financial Commission of Inquiry, as described in Note 19 to the Consolidated Financial Statements, in Public Accounts of Ontario 2017–2018. Amounts for net debt and accumulated deficit also reflect this change.
[2] Revenues and expenses have been restated to reflect the following fiscally neutral changes: i) revised presentation of education property taxes to be included in the taxation revenues; ii) reclassification of certain Government Business Enterprises to other government organizations; iii) reclassification of a number of tax measures that provide a financial benefit through the tax system to be reported as expenses; and iv) change in presentation of third-party revenue for hospitals, school boards and colleges to be reported as revenue.
[3] For the purposes of the legislated requirements for a budget and mid-year review in the Fiscal Sustainability, Transparency, and Accountability Act, 2019, the 2020–21 current outlook represents the plan year of the Budget as well as the current fiscal year of the mid-year review.
[4] Interest on debt is net of interest capitalized during construction of tangible capital assets of $165 million in 2015–16, $159 million in 2016–17, $157 million in 2017–18, $175 million in 2018–19, $245 million in 2019–20 and $234 million in 2020–21.
[5] Population figures are for July 1 of the fiscal year indicated (i.e., for 2011–12, the population on July 1, 2011 is shown).
Note: Numbers may not add due to rounding.
Sources: Statistics Canada, Ontario Treasury Board Secretariat and Ministry of Finance.
Chart Descriptions
Chart 3.1: Range of Ontario Deficit Outlook Scenarios
The bar chart illustrates the range of Ontario deficit outlooks based on the two alternative economic scenarios presented in Chapter 2: Recent Economic Performance and Outlook. The 2020 Budget Deficit Outlook scenario estimates the deficit to be $38.5 billion in 2020–21, $33.1 billion in 2021–22 and $28.2 billion in 2022–23. The Deficit scenario under Faster Growth scenario estimates the deficit to be $27.7 billion in 2021–22 and $21.3 billion in 2022–23. The Deficit scenario under Slower Growth scenario estimates the deficit to be $35.6 billion in 2021–22 and $33.4 billion in 2022–23.
Source: Ontario Ministry of Finance
Chart 3.2: Total Health Sector and COVID‑19 Response Funding
This stacked bar chart illustrates the total health sector spending and the COVID‑19 Response including Pandemic Fund1 spending for 2020–21 to 2022–23. In 2020–21 total health sector spending is forecast to be $64.6 billion and the COVID‑19 Response including Pandemic Fund spending is forecast to be $8.3 billion. In 2021–22 total health sector spending is forecast to be $67.0 billion and the COVID‑19 Response including Pandemic Fund spending is forecast to be $4.0 billion. In 2022–23 total health sector spending is forecast to be $68.5 billion and the COVID‑19 response including Pandemic Fund spending is forecast to be $2.0 billion.
1COVID‑19 Response includes the $5.3 billion COVID‑19 Health Contingency Fund in 2020–21 and the Pandemic Fund of $4.0 billion in 2021–22 and $2.0 billion in 2022–23.
Sources: Ontario Treasury Board Secretariat and Ministry of Finance.
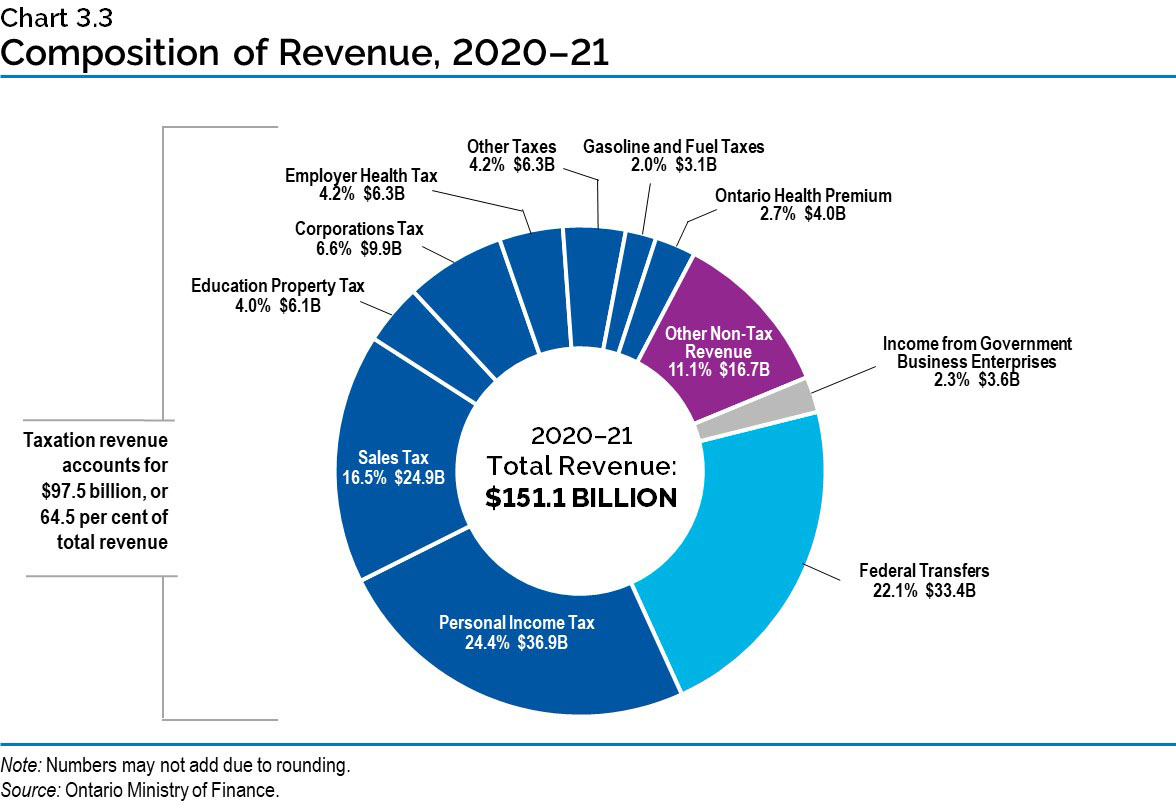
Chart 3.3: Composition of Revenue, 2020–21
The pie chart shows the composition of Ontario’s revenue in 2020–21, which is projected to be $151.1 billion. The largest taxation revenue source is Personal Income Tax revenue at $36.9 billion, accounting for 24.4 per cent of total revenue. This is followed by Sales Tax at $24.9 billion, or 16.5 per cent of total revenue; and Corporations Tax at $9.9 billion, or 6.6 per cent of total revenue. Other components of taxation revenue include Education Property Tax at $6.1 billion, or 4.0 per cent of total revenue; Employer Health Tax at $6.3 billion, or 4.2 per cent; Gasoline and Fuel Taxes at $3.1 billion, or 2.0 per cent; the Ontario Health Premium at $4.0 billion, or 2.7 per cent; and Other Taxes at $6.3 billion, or 4.2 per cent of total revenue.
Total taxation revenue accounts for $97.5 billion, or 64.5 per cent of total revenue.
The other major non-taxation sources of revenue are Federal Transfers of $33.4 billion, or 22.1 per cent of total revenue; Income from Government Business Enterprises at $3.6 billion, or 2.3 per cent of total revenue; and various Other Non-Tax Revenue at $16.7 billion, or 11.1 per cent of total revenue.
Note: Numbers may not add due to rounding.
Source: Ontario Ministry of Finance.
Chart 3.4: Composition of Total Expense, 2020–21
The pie chart shows the share of Ontario’s total expense and dollar amounts by sector in 2020–21.
Total expense in 2020–21 is projected to be $187.0 billion.
The largest expense is the Health Sector at $64.6 billion, accounting for 34.6 per cent of total expense.
The remaining sectors of total expense include the Education Sector at $31.0 billion or 16.6 per cent; the Postsecondary Education Sector at $10.7 billion or 5.7 per cent; the Children’s and Social Services Sector at $17.9 billion or 9.6 per cent; the Justice Sector at $4.6 billion or 2.4 per cent; and Other Programs at $45.7 billion or 24.5 per cent. Interest on Debt, included as part of Total Expense, is $12.5 billion or 6.7 per cent.
1 For presentation purposes in the 2020 Budget, all one-time COVID‑19 related spending has been included within the Other Programs sector instead of the Health Sector. This funding includes one-time COVID‑19 Health Sector expense of $3.1 billion and COVID‑19
Health Contingency Fund of
$5.3 billion in 2020–21, as well as a Pandemic Fund of $4.0 billion in 2021–22 and $2.0 billion in 2022–23. This change in presentation does not impact ministry allocations, which reflect ministry structure(s) presented in the 2020–21 Expenditure Estimates. For details on time-limited funding and contingencies, see Table 3.10.
2Education Sector excludes the Teachers’ Pension Plan. Teachers’ Pension Plan expense is included in Other Programs.
Note: Numbers may not add due to rounding.
Sources: Ontario Treasury Board Secretariat and Ministry of Finance.