Introduction
Total 2020–21 long-term public borrowing is now forecast to be $52.3 billion. This is $0.2 billion higher than the 2020–21 First Quarter Finances forecast due to a planned increase in investments in capital infrastructure. As of October 13, 2020, the Province had completed $34.7 billion, or 66 per cent of its 2020–21 total long-term public borrowing program. Ontario’s 2020–21 net debt-to-GDP ratio is now forecast to be 47.0 per cent, compared to a forecast of 47.1 per cent at the time of the 2020–21 First Quarter Finances. Ontario is forecast to pay $12.5 billion in interest costs in 2020–21, unchanged from the forecast in the 2020–21 First Quarter Finances.
Borrowing Program
Ontario’s borrowing program is primarily used to fund deficits, refinance maturing debt and make investments in capital assets. Ontario will finance most of its borrowing program in the long-term public markets in Canada and internationally. The Province will also continue to increase short-term borrowing to keep the proportion of short-term debt in the range of six to eight per cent of total debt outstanding. The planned increase in short-term borrowing will include a combination of Canadian treasury bills and U.S. Commercial paper issuance.
| 2019–20 | 2020–21 March 2020 Update |
2020–21 First Quarter Finances |
2020–21 Change from First Quarter Finances |
2020–21 Current Outlook1 |
Medium-Term Outlook 2021–22 |
Medium-Term Outlook 2022–23 |
|
|---|---|---|---|---|---|---|---|
| Deficit/(Surplus) | 8.7 | 20.5 | 38.5 | – | 38.5 | 33.1 | 28.2 |
| Investment in Capital Assets | 9.7 | 10.4 | 10.4 | 0.2 | 10.6 | 11.5 | 12.0 |
| Non-Cash Adjustments | (6.0) | (9.2) | (9.2) | – | (9.2) | (8.8) | (8.9) |
| Loans to Infrastructure Ontario | 0.2 | 0.3 | – | – | – | 0.1 | (0.4) |
| Other Net Loans/Investments | 0.3 | 1.2 | 0.5 | 0.1 | 0.6 | (0.5) | (0.3) |
| Debt Maturities/Redemptions | 27.4 | 26.6 | 26.6 | 0.1 | 26.7 | 25.1 | 30.6 |
| Total Funding Requirement | 40.3 | 49.7 | 66.7 | 0.4 | 67.0 | 60.6 | 61.3 |
| Decrease/(Increase) in Short-Term Borrowing | (3.0) | (2.0) | (7.0) | 1.3 | (5.7) | (2.0) | (2.0) |
| Increase/(Decrease) in Cash and Cash Equivalents | (5.4) | – | – | (1.4) | (1.4) | – | – |
| Pre-borrowing in 2019–20 | 7.6 | (4.1) | (7.6) | – | (7.6) | – | – |
| Total Long-Term Public Borrowing | 39.5 | 43.6 | 52.1 | 0.2 | 52.3 | 58.6 | 59.3 |
Table 4.1 footnotes:
[1] For the purposes of the legislated requirements for a budget and mid-year review in the Fiscal Sustainability, Transparency, and Accountability Act, 2019, the 2020–21 current outlook represents the plan year of the Budget as well as the current fiscal year of the mid-year review.
Note: Numbers may not add due to rounding.
Source: Ontario Financing Authority.
The Province’s long-term borrowing requirement for 2020–21 increased by $0.2 billion from the projection in the 2020–21 First Quarter Finances because of a planned increase in investments in capital infrastructure. The Province’s short-term borrowing program in 2020–21 is now forecast to increase by $5.7 billion, a reduction from the $7 billion projected in the 2020–21 First Quarter Finances to reflect the reduced purchases of Ontario treasury bills by the Bank of Canada at the weekly Ontario auctions.
On a cash basis, the 2019–20 deficit and investments in capital assets presented in the 2019–2020 Public Accounts of Ontario were below the interim projections in the March 2020 Economic and Fiscal Update by a total of $1.4 billion. This left the Province with larger cash reserves at the end of 2019–20 and will allow for an equivalent reduction in its cash reserves in 2020–21.
The government will seek further approval from the Legislature for borrowing authority to meet the increase in the Province’s borrowing requirements since the March 2020 Economic and Fiscal Update.
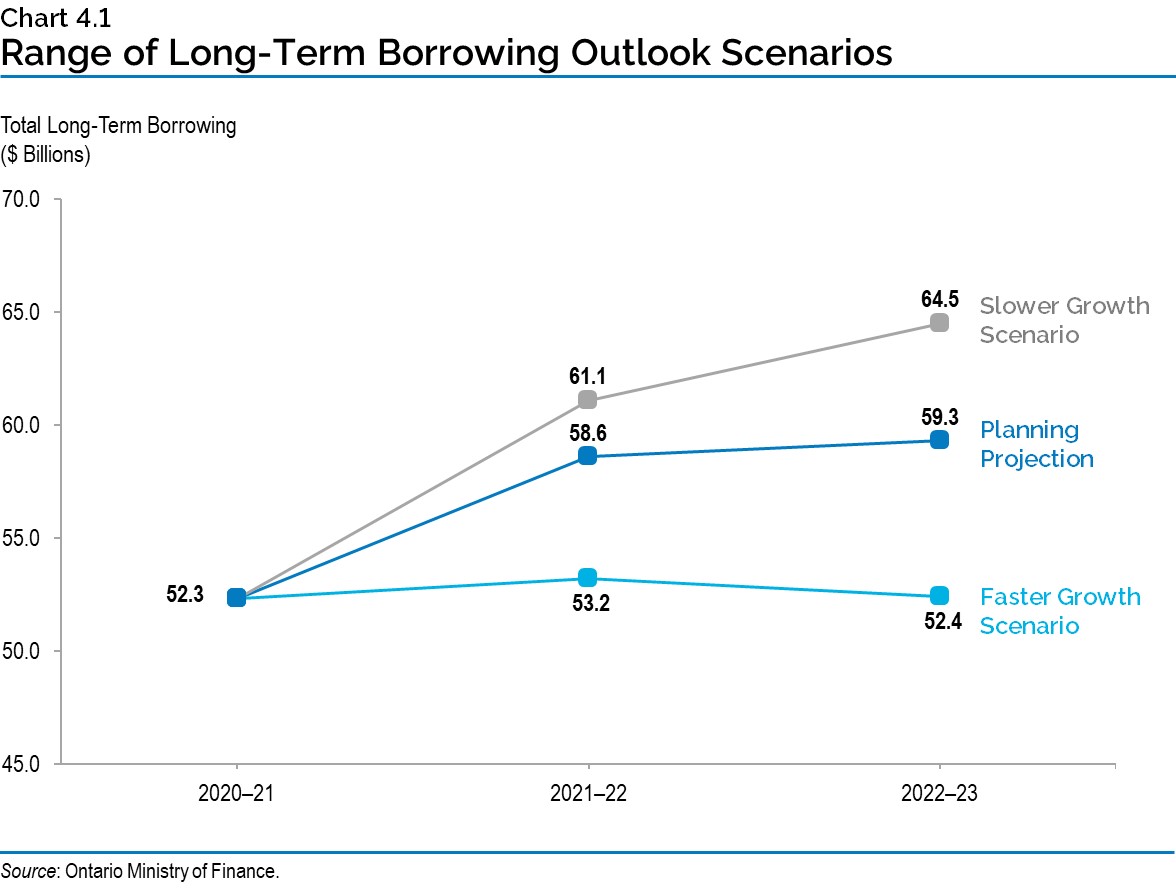
In the event alternative economic scenarios materialize, the province’s deficit outlook in the next two years would also change as a result. See Chapter 3: Ontario’s Fiscal Plan and Outlook for more details and a description of the resulting alternative revenue scenarios. Under the Faster Growth scenario, the long-term borrowing of the Province would decrease by a total of $12.3 billion over the medium-term outlook, while under the Slower Growth scenario, long-term borrowing would increase by $7.7 billion over the same period.
Approximately 79 per cent of 2020–21 borrowing has been completed in Canadian dollars through 25 syndicated issues and a Green Bond. This remains in line with the Province’s target to issue 70 to 80 per cent of total long-term borrowing in the Canadian dollar market. Ontario plans to maintain this target range for the remainder of the 2020–21 fiscal year, but adjust if necessary, depending on investor demand in the Canadian dollar and foreign currency markets.
Ontario will also continue to regularly borrow in currencies other than the Canadian dollar to ensure the continued diversification of its investor base. On September 29, 2020, Ontario issued a US$1.25 billion bond. This was Ontario’s second U.S. dollar bond for fiscal 2020–21. There was strong demand for the bond from over 70 investors. Nearly 75 per cent were investors from Europe, the Middle East and Asia, approximately twice as high a proportion from these regions as has been typical for Ontario U.S. dollar bonds over the past decade. Foreign currency borrowing helps reduce Ontario’s overall borrowing costs and ensures the government will continue to have access to capital if domestic market conditions become more challenging.
Green Bond Program
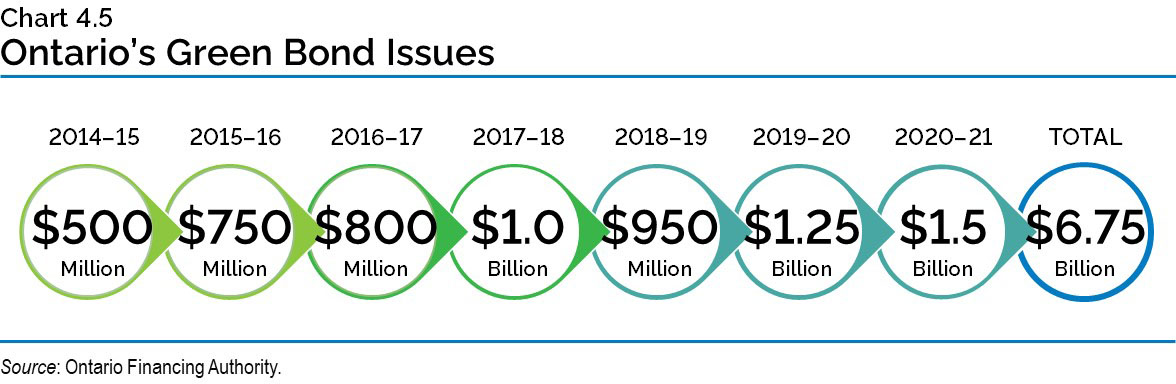
Green Bonds remain a core component of Ontario’s borrowing program and are an important tool to help finance public transit initiatives, extreme weather-resistant infrastructure, and energy efficiency and conservation projects.
On October 6, 2020, Ontario issued its eighth and largest Green Bond to date for $1.5 billion. Four projects have been selected as eligible to receive funding from Ontario’s latest Green Bond, with an emphasis on clean transportation, energy efficiency and conservation, and climate adaptation and resilience categories. Ontario remains the largest issuer of Canadian dollar Green Bonds totaling $6.75 billion since 2014–15, and plans to continue to be an active issuer of Green Bonds in 2020–21. Subject to market conditions, Ontario may issue another Green Bond this fiscal year.
Net Debt-to-GDP
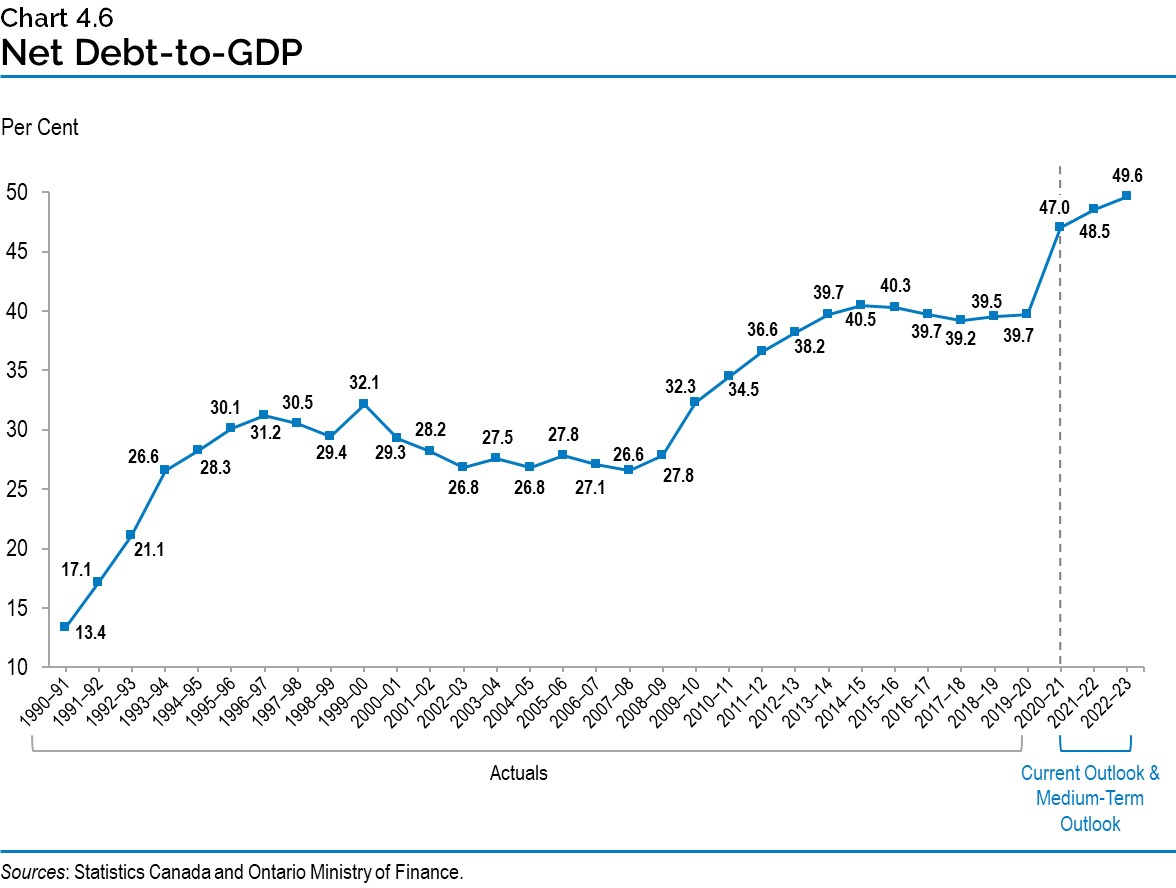
Prior to the COVID‑19 pandemic, the government was making progress on its commitment to keep the net debt-to-GDP ratio, through to 2022–23, to less than the Independent Financial Commission of Inquiry’s forecast of 40.8 per cent for 2018–19. The 2019–20 net debt-to-GDP ratio was 39.7 per cent, a full percentage point lower than the 2019 Budget forecast of 40.7 per cent. These gains created fiscal flexibility that allowed the Province to respond swiftly to the pandemic. The net debt-to-GDP ratio for the current outlook and medium-term plan period is forecast to be higher than the forecasts contained in the 2019 Budget, due to the government’s response to the COVID‑19 pandemic, which has led to necessarily higher deficits combined with lower GDP forecasts.
After the pandemic, the government’s objective will be to slow the rate of increase in the net debt-to-GDP ratio, supported by GDP growth from the economic recovery. Acknowledging the continued uncertainty of the global pandemic, the government plans to set a long-term target for the net debt-to-GDP ratio along with a path to balance in the 2021 Budget.
The net debt-to-GDP ratio in 2020–21 is now projected to be 47.0 per cent, or 0.1 percentage point lower than the 47.1 per cent forecast in the 2020–21 First Quarter Finances.
Cost of Debt
Ontario is forecast to pay $12.5 billion in interest costs in 2020–21, unchanged from the forecast in the 2020–21 First Quarter Finances. Interest on debt (IOD) is Ontario’s fourth largest expense after health care, education and social services.
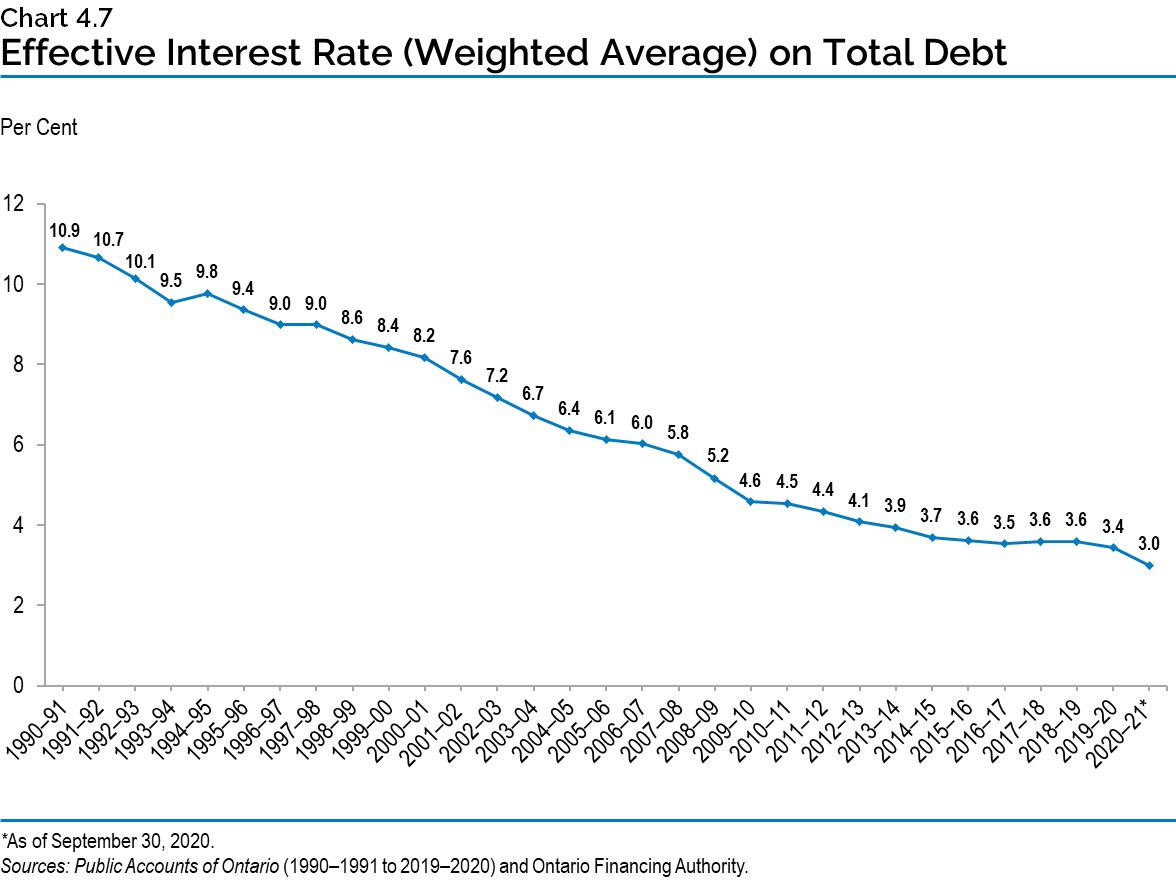
The three-decade decline in interest rates has meant IOD has not risen as quickly as Ontario’s debt. Chart 4.7 shows the declining effective interest rate Ontario is paying on its total debt portfolio.
The interest rates Ontario must pay on new or refinanced debt issued remain near historic lows. Despite a $38.5 billion deficit forecast and $44.6 billion projected increase in net debt in this fiscal year, IOD remains unchanged from 2019–20 to 2020–21.
Ontario’s average cost of borrowing in 2020–21 is forecast to be 1.60 per cent. A one percentage point change in interest rates, either up or down, from the current forecast would have a corresponding change in Ontario’s interest costs by over $800 million in the first full year.
Chart 4.8 shows historic borrowing rates on debt issued and the prudent forecast used to estimate the future cost of borrowing or IOD expense.
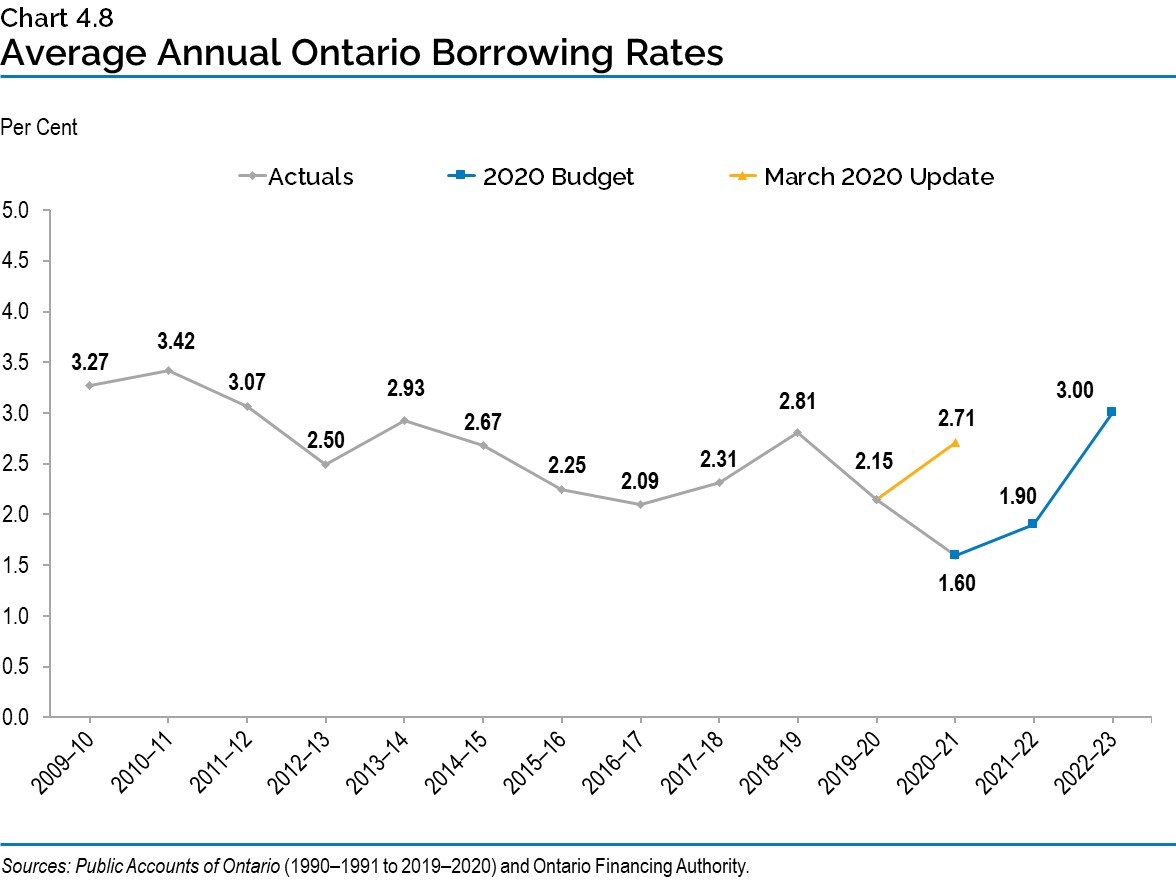
Table 4.2 shows how the Province’s borrowing rate assumptions have dropped since the 2019 Budget by more than two percentage points for this fiscal year and two and a half percentage points for 2021–22, providing significant relief on IOD expenses, despite substantial increases in the deficit.
| 2019–20 | 2020–21 | 2021–22 | |
|---|---|---|---|
| 2019 Budget | 3.44 | 3.73 | 4.40 |
| March 2020 Economic and Fiscal Update | 2.17 | 2.71 | – |
| 2020 Budget | 2.15* | 1.60 | 1.90 |
Table 4.2 footnotes:
[*] Actual average annual Ontario borrowing rate as of 2019–2020 Public Accounts of Ontario.
Source: Ontario Financing Authority.
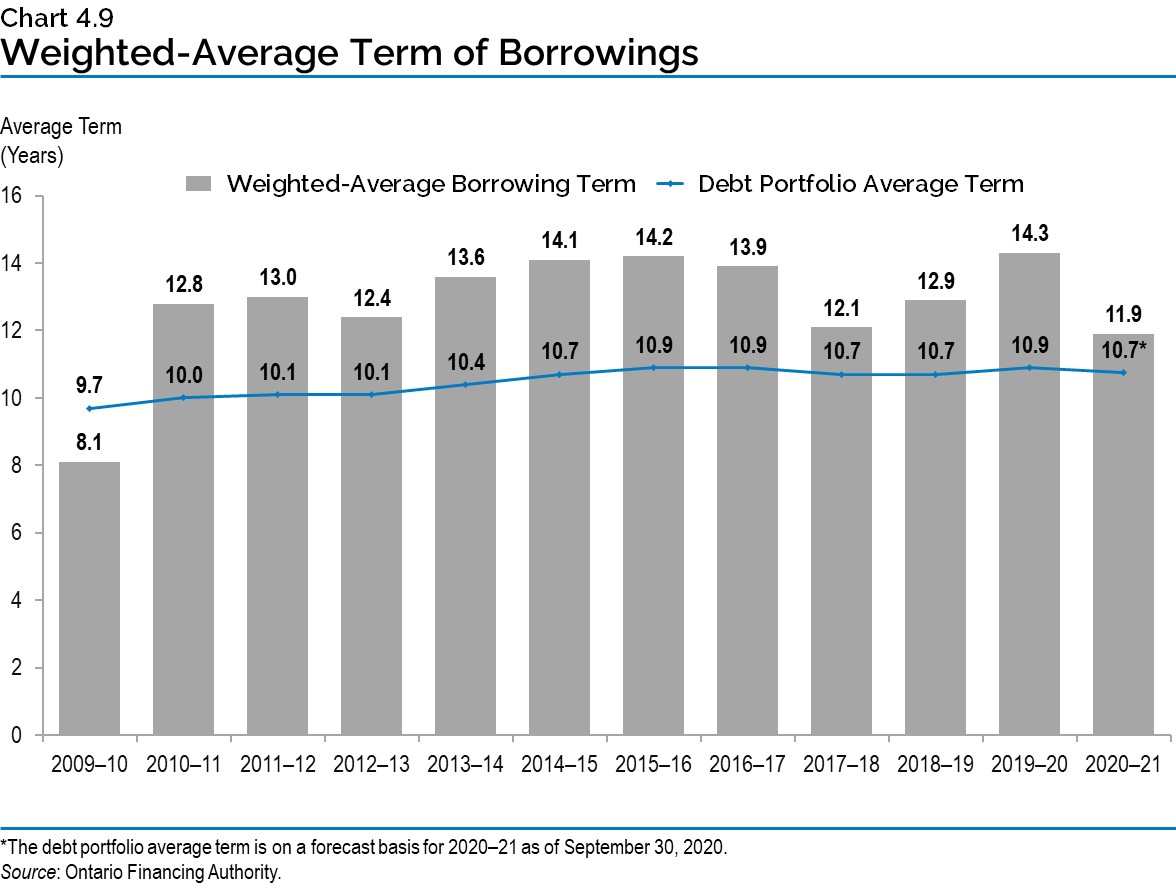
The Province has extended the term of its debt to reduce refinancing risk on maturing debt. This also protects the IOD forecast, in the long term, against possible increases in interest rates from the current historically low levels. Ontario has issued $99.0 billion of bonds, or approximately one‑quarter of total debt, with maturities of 30 years or longer since 2010–11. This includes $6.4 billion so far in 2020–21.
As a result, the average term of Ontario’s debt portfolio has been extended, from 9.7 years in 2009–10 to 10.7 years in 2020–21. The Province monitors interest rates daily. With low interest rates and a large borrowing program, the current plan remains to extend the term of Ontario’s debt, subject to investor demand.
While net debt-to-GDP is the primary measure of the sustainability of Ontario’s debt, another key measure is the IOD-to-revenue ratio. This ratio represents how much Ontario needs to spend on interest for every revenue dollar received. The current forecast is 8.2 cents of interest cost for every dollar of revenue in 2020–21. Despite increases to forecasted deficits, the IOD-to-revenue ratio remains lower than forecasted in the 2019 Budget, demonstrating the continued relative affordability of Ontario’s debt.
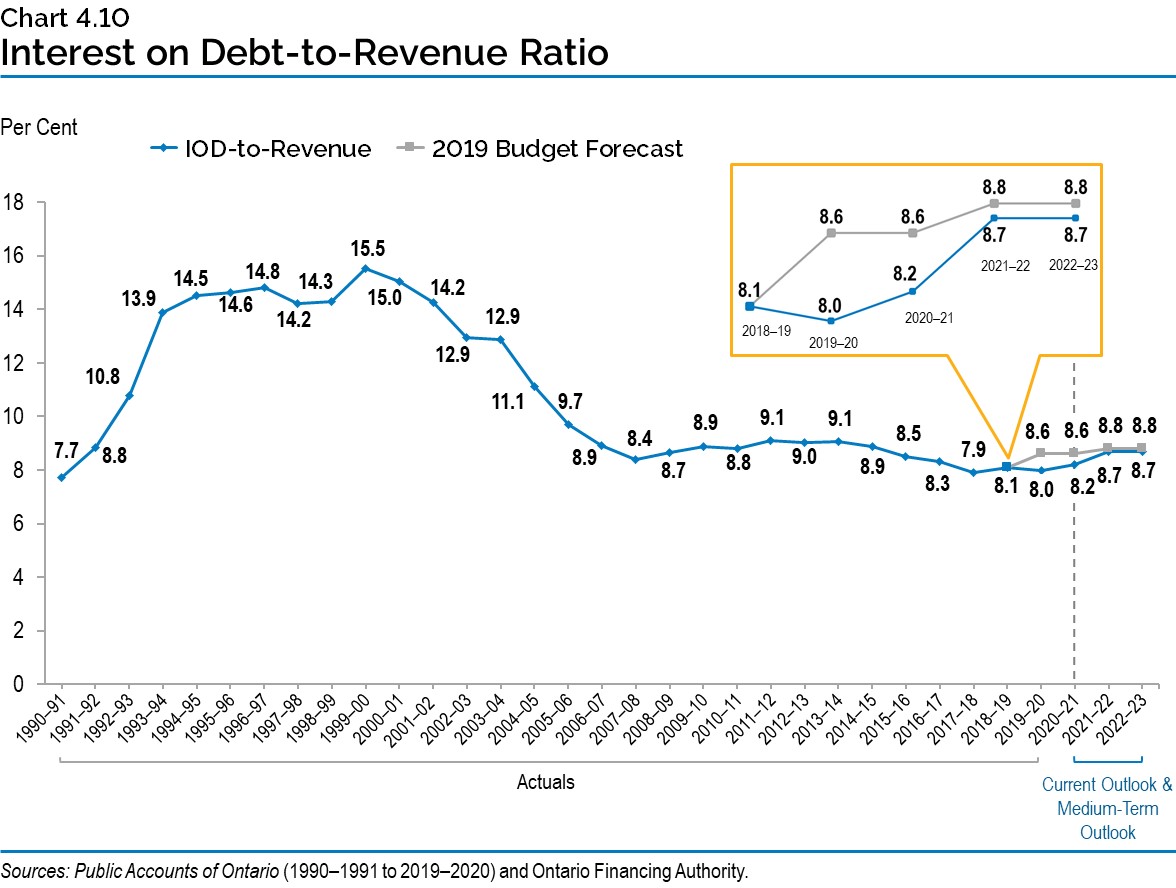
Interest on debt-to-revenue is projected to remain below the forecast contained in the 2019 Budget through the medium term. This will ensure that over 90 per cent of annual revenues received go towards spending on priorities such as health care and education.
Ensuring Adequate Liquidity Levels
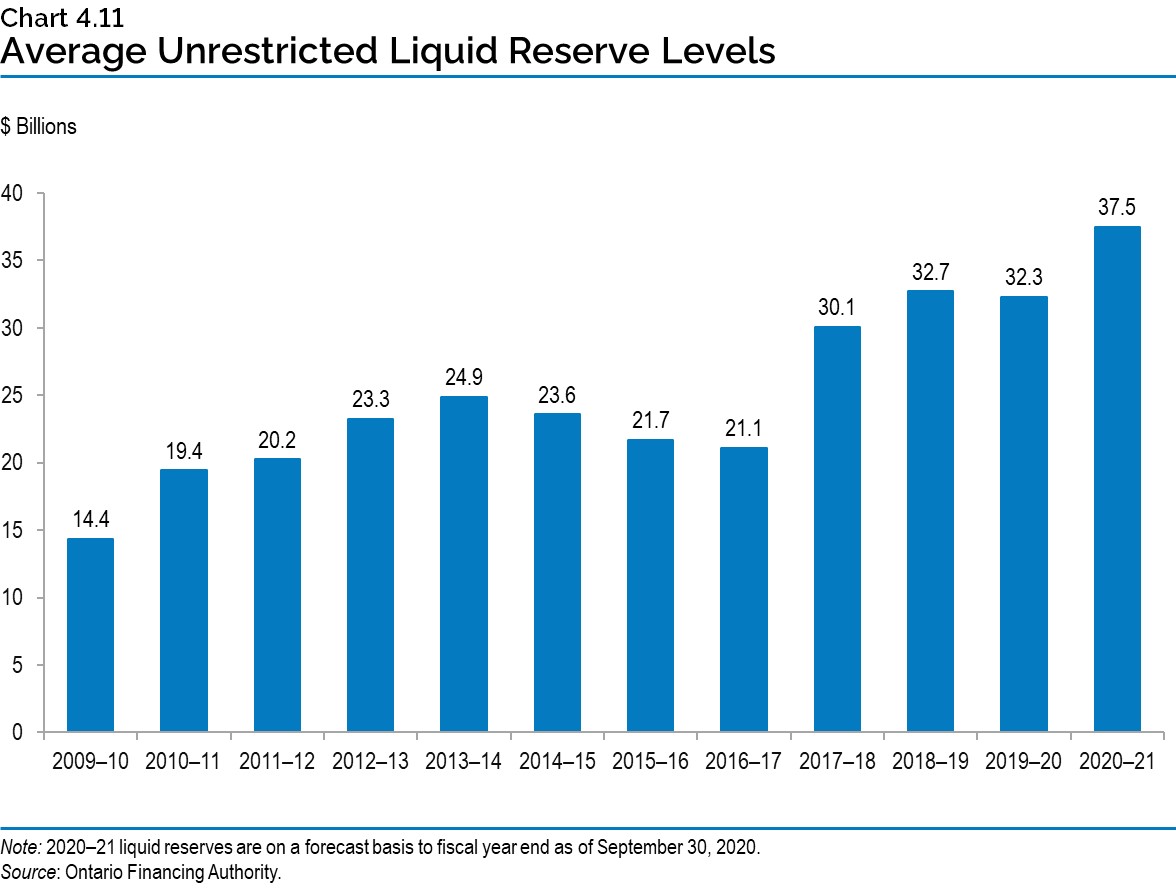
The government balances the objective of minimizing the cost of holding liquid reserves against the need to always have enough cash on hand to pay its bills, invest in capital infrastructure, refinance maturing debt and pay interest. Ensuring Ontario always has sufficient liquidity to meet its cashflow needs is even more critical during the COVID‑19 pandemic to address the potential for unforeseen economic or public health needs. To be prudent, the Province must also be prepared to withstand prolonged periods of borrowing blackouts. These blackouts could be longer than the one experienced in the bond markets in March 2020 when there was little to no long-term provincial bond issuance due to the COVID‑19 outbreak. Other provinces have accelerated their borrowing programs this year and have significantly higher levels of liquidity than they carried in the past.
Another reason the Province has needed to build large cash reserves is that, coming out of the 2008 global financial crisis, the Province responded to investor demand by creating large, liquid 10‑year and 30-year benchmark domestic bond issues. This lowered Ontario’s borrowing costs while significantly enhancing the Province’s ongoing access to capital. Meeting investor preferences has reduced, but not eliminated, the risk of prolonged periods of limited, or no, demand for new issues of Ontario bonds. However, as a result of these large bond issues, Ontario now has large cash outflows on single days, rather than having maturities and interest payments spread more evenly throughout the year.
In anticipation of the need for cash reserves to meet these requirements for large outflows on a single day, and to allow the government to quickly respond to any unforeseen economic or public health circumstances, the Province has built larger cash reserves, as depicted in the chart below.
Consolidated Financial Tables
| Debt2 | 2015–16 | 2016–17 | 2017–18 | 2018–19 | Actual 2019–20 |
Current Outlook1 2020–21 |
|---|---|---|---|---|---|---|
| Publicly Held Debt — Bonds3 | 293,935 | 299,356 | 315,247 | 334,940 | 349,088 | 374,732 |
| Publicly Held Debt — Treasury Bills | 13,921 | 16,120 | 17,528 | 17,546 | 19,175 | 26,369 |
| Publicly Held Debt — U.S. Commercial Paper4 | 6,987 | 5,369 | 3,865 | 3,863 | 3,891 | 2,397 |
| Publicly Held Debt — Infrastructure Ontario (IO)5 | 300 | 300 | 300 | 300 | 300 | 300 |
| Publicly Held Debt — Other | 301 | 296 | 287 | 292 | 264 | 244 |
| Total Publicly Held Debt | 315,444 | 321,441 | 337,227 | 356,941 | 372,718 | 404,042 |
| Non-Public Debt | 11,969 | 11,661 | 11,433 | 11,039 | 10,010 | 9,311 |
| Total Debt | 327,413 | 333,102 | 348,660 | 367,980 | 382,728 | 413,353 |
| Less: Holdings of Ontario bonds and treasury bills | (7,663) | (8,832) | (11,775) | (13,716) | (9,938) | (4,435) |
| Revised Total Debt | 319,750 | 324,270 | 336,885 | 354,264 | 372,790 | 408,918 |
| Cash and Temporary Investments Excluding Broader Public Sector (BPS)6 | (18,102) | (14,590) | (19,571) | (26,250) | (29,934) | (26,430) |
| Total Debt Net of Cash and Temporary Investments | 301,648 | 309,680 | 317,314 | 328,014 | 342,856 | 382,488 |
| Other Net (Assets)/Liabilities7 | (10,415) | (9,991) | (6,791) | (3,422) | (3,423) | 3,580 |
| BPS Net Debt | 15,124 | 14,388 | 13,311 | 13,904 | 13,899 | 11,904 |
| Net Debt | 306,357 | 314,077 | 323,834 | 338,496 | 353,332 | 397,972 |
| Non-Financial Assets8 | (103,343) | (108,138) | (114,811) | (121,854) | (127,568) | (133,740) |
| Accumulated Deficit | 203,014 | 205,939 | 209,023 | 216,642 | 225,764 | 264,232 |
Table 4.3 footnotes:
[1] For the purposes of the legislated requirements for a budget and mid-year review in the Fiscal Sustainability, Transparency, and Accountability Act, 2019, the 2020–21 current outlook represents the plan year of the Budget as well as the current fiscal year of the mid-year review.
[2] Includes debt issued by the Province and all government organizations, including the Ontario Electricity Financial Corporation (OEFC).
[3], [4] All balances are expressed in Canadian dollars. The balances above reflect the effect of related derivative contracts.
[5] IO’s 2019–20 debt is composed of Infrastructure Renewal Bonds ($300 million). IO's debt is not guaranteed by the Province.
[6] Cash amount excludes any holdings in Ontario bonds and T-bills.
[7] Other Net (Assets)/Liabilities include accounts receivable, loans receivable, advances and investments in Government Business Enterprises (GBEs) offset by accounts payable, accrued liabilities, deferred revenue and capital contributions, pensions and other employee future benefits, and other liabilities.
[8] Non-financial assets include the tangible capital assets of the Province and broader public sector.
Source: Ontario Ministry of Finance.
| 2021–22 | 2022–23 | |
|---|---|---|
| Total Debt | 448.9 | 479.5 |
| Cash and Temporary Investments | (30.9) | (30.9) |
| Total Debt Net of Cash and Temporary Investments | 418.0 | 448.6 |
| Other Net (Assets)/Liabilities | 8.3 | 12.9 |
| Broader Public Sector Net Debt | 11.5 | 11.4 |
| Net Debt | 437.8 | 472.9 |
| Non-Financial Assets | (140.5) | (147.4) |
| Accumulated Deficit | 297.3 | 325.5 |
Table 4.4 footnotes:
Source: Ontario Ministry of Finance.
Chart Descriptions
Chart 4.1: Range of Long-Term Borrowing Outlook Scenarios
| Year | 2020–21 | 2021–22 | 2022–23 |
|---|---|---|---|
| Planning Projection | $52.3 billion | $58.6 billion | $59.3 billion |
| Slower Growth Scenario | $52.3 billion | $61.1 billion | $64.5 billion |
| Faster Growth Scenario | $52.3 billion | $53.2 billion | $52.4 billion |
Source: Ontario Ministry of Finance
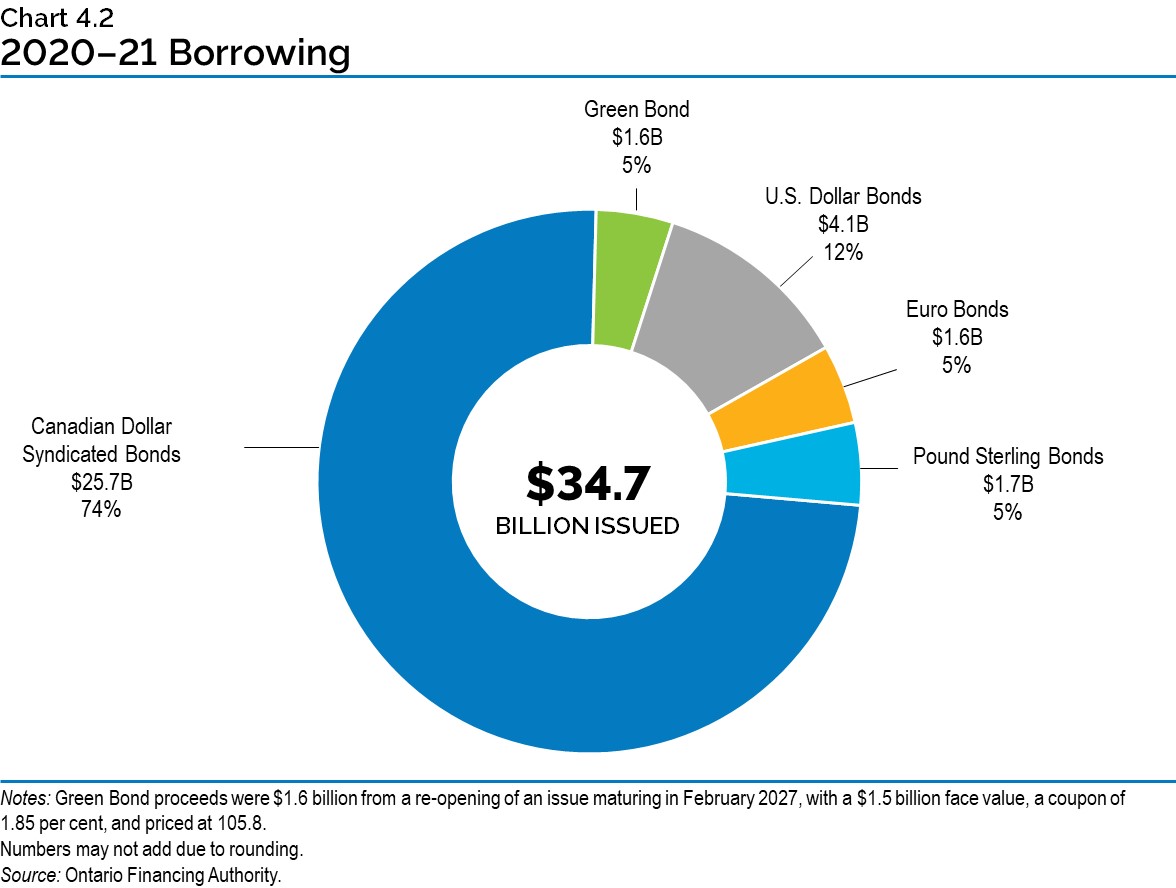
Chart 4.2: 2020–21 Borrowing
$34.7 billion of long-term public borrowing has been completed for fiscal year 2020–21. This consisted of $25.7 billion (74 per cent) of Canadian dollar syndicated bonds, $1.6 billion (5 per cent) of Green Bond, $4.1 billion (12 per cent) of U.S. dollar bonds, $1.6 billion (5 per cent) of Euro bonds, and $1.7 billion (5 per cent) of Pound sterling bonds.
Notes: Green Bond proceeds were $1.6 billion from a re-opening of an issue maturing in February 2027, with a $1.5 billion face value, a coupon of 1.85 per cent, and priced at 105.8.
Numbers may not add due to rounding.
Source: Ontario Financing Authority.
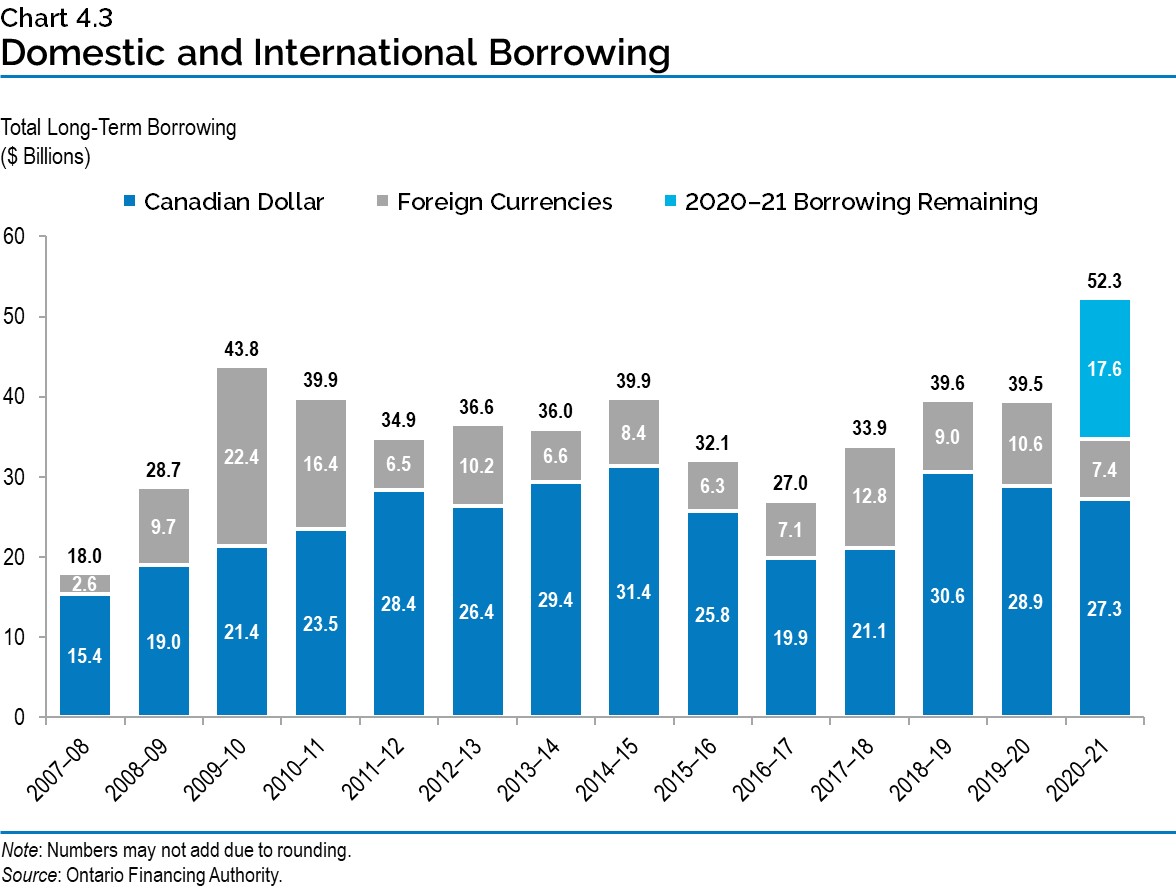
Chart 4.3: Domestic and International Borrowing
The Province’s total long-term borrowing in 2020–21 is forecast to be $52.3 billion — $27.3 billion was borrowed in the Canadian dollar market, $7.4 billion was borrowed in foreign currencies, and $17.6 billion of borrowing remaining for 2020–21.
| Year | Canadian Dollar ($ Billions) |
Foreign Currencies ($ Billions) |
Total ($ Billions) |
|---|---|---|---|
| 2007–08 | 15.4 | 2.6 | 18.0 |
| 2008–09 | 19.0 | 9.7 | 28.7 |
| 2009–10 | 21.4 | 22.4 | 43.8 |
| 2010–11 | 23.5 | 16.4 | 39.9 |
| 2011–12 | 28.4 | 6.5 | 34.9 |
| 2012–13 | 26.4 | 10.2 | 36.6 |
| 2013–14 | 29.4 | 6.6 | 36.0 |
| 2014–15 | 31.4 | 8.4 | 39.9 |
| 2015–16 | 25.8 | 6.3 | 32.1 |
| 2016–17 | 19.9 | 7.1 | 27.0 |
| 2017–18 | 21.1 | 12.8 | 33.9 |
| 2018–19 | 30.6 | 9.0 | 39.6 |
| 2019–20 | 28.9 | 10.6 | 39.5 |
| 2020–21 | 27.3 | 7.4 | 52.3 |
Note: Numbers may not add due to rounding.
Source: Ontario Financing Authority.
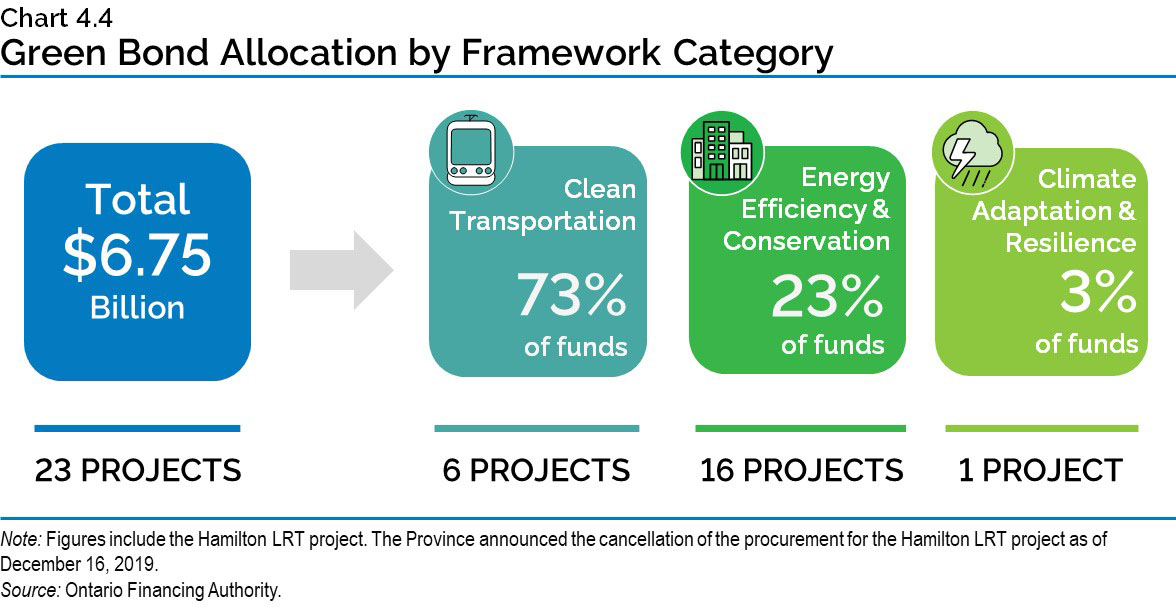
Chart 4.4: Green Bond Allocation by Framework Category
A total of $6.75 billion in Green Bond funding has provided funding to 23 projects. Six of those projects are under the Clean Transportation framework category and have received 73 per cent of the funding. Sixteen projects are under the Energy Efficiency and Conservation category and have received 23 per cent of the funding. One project is under the Climate Adaptation and Resilience category and has received 3 per cent of the funding.
Note: Figures include the Hamilton LRT project. The Province announced the cancellation of the procurement for the Hamilton LRT project as of December 16, 2019.
Source: Ontario Financing Authority
Chart 4.5: Ontario’s Green Bond Issues
Since 2014, Ontario has issued Green Bonds totaling $6.75 billion.
| Year | 2014–15 | 2015–16 | 2016–17 | 2017–18 | 2018–19 | 2019–20 | 2020–21 |
|---|---|---|---|---|---|---|---|
| Green Bond Issues ($) | $500 million | $750 million | $800 million | $1.0 billion | $950 million | $1.25 billion | $1.5 billion |
Chart 4.6: Net Debt-to-GDP
Ontario’s net debt-to-GDP ratio is forecast at 47.0 per cent in 2020–21.
| Year | Net Debt-to-GDP (%) |
|---|---|
| 1990–91 | 13.4 |
| 1991–92 | 17.1 |
| 1992–93 | 21.1 |
| 1993–94 | 26.6 |
| 1994–95 | 28.3 |
| 1995–96 | 30.1 |
| 1996–97 | 31.2 |
| 1997–98 | 30.5 |
| 1998–99 | 29.4 |
| 1999–00 | 32.1 |
| 2000–01 | 29.3 |
| 2001–02 | 28.2 |
| 2002–03 | 26.8 |
| 2003–04 | 27.5 |
| 2004–05 | 26.8 |
| 2005–06 | 27.8 |
| 2006–07 | 27.1 |
| 2007–08 | 26.6 |
| 2008–09 | 27.8 |
| 2009–10 | 32.3 |
| 2010–11 | 34.5 |
| 2011–12 | 36.6 |
| 2012–13 | 38.2 |
| 2013–14 | 39.7 |
| 2014–15 | 40.5 |
| 2015–16 | 40.3 |
| 2016–17 | 39.7 |
| 2017–18 | 39.2 |
| 2018–19 | 39.5 |
| 2019–20 | 39.7 |
| 2020–21 | 47.0 |
| 2021–22 | 48.5 |
| 2022–23 | 49.6 |
Sources: Statistics Canada and Ontario Ministry of Finance.
Chart 4.7: Effective Interest Rate (Weighted-Average) on Total Debt
As of September 30, 2020, the effective interest rate (calculated as a weighted average) for 2020–21 is forecast to be 3.0 per cent on the province’s total debt.
| Year | Effective Interest Rate (%) |
|---|---|
| 1990–91 | 10.9 |
| 1991–92 | 10.7 |
| 1992–93 | 10.1 |
| 1993–94 | 9.5 |
| 1994–95 | 9.8 |
| 1995–96 | 9.4 |
| 1996–97 | 9.0 |
| 1997–98 | 9.0 |
| 1998–99 | 8.6 |
| 1999–00 | 8.4 |
| 2000–01 | 8.2 |
| 2001–02 | 7.6 |
| 2002–03 | 7.2 |
| 2003–04 | 6.7 |
| 2004–05 | 6.4 |
| 2005–06 | 6.1 |
| 2006–07 | 6.0 |
| 2007–08 | 5.8 |
| 2008–09 | 5.2 |
| 2009–10 | 4.6 |
| 2010–11 | 4.5 |
| 2011–12 | 4.4 |
| 2012–13 | 4.1 |
| 2013–14 | 3.9 |
| 2014–15 | 3.7 |
| 2015–16 | 3.6 |
| 2016–17 | 3.5 |
| 2017–18 | 3.6 |
| 2018–19 | 3.6 |
| 2019–20 | 3.4 |
| 2020–21 | 3.0 |
Sources: Public Accounts of Ontario (1990–1991 to 2019–2020) and Ontario Financing Authority.
Chart 4.8: Average Annual Ontario Borrowing Rates
| Year | Actuals(%) | 2020 Budget (%) | March 2020 Update |
|---|---|---|---|
| 2009–10 | 3.27 | – | – |
| 2010–11 | 3.42 | – | – |
| 2011–12 | 3.07 | – | – |
| 2012–13 | 2.50 | – | – |
| 2013–14 | 2.93 | – | – |
| 2014–15 | 2.67 | – | – |
| 2015–16 | 2.25 | – | – |
| 2016–17 | 2.09 | – | – |
| 2017–18 | 2.31 | – | – |
| 2018–19 | 2.81 | – | – |
| 2019–20 | 2.15 | – | – |
| 2020–21 | – | 1.60 | 2.71 |
| 2021–22 | – | 1.90 | – |
| 2022–23 | – | 3.00 | – |
Sources: Public Accounts of Ontario (1990–1991 to 2019–2020) and Ontario Financing Authority.
Chart 4.9: Weighted-Average Term of Borrowings
The average term of Ontario’s debt portfolio has been extended from 9.7 years in 2009–10 to 10.7 years in 2020–21. The weighted-average borrowing term for 2020–21 was 11.9 years as of October 13, 2020.
| Year | 2009–10 | 2010–11 | 2011–12 | 2012–13 | 2013–14 | 2014–15 | 2015–16 | 2016–17 | 2017–18 | 2018–19 | 2019–20 | 2020–21 |
|---|---|---|---|---|---|---|---|---|---|---|---|---|
| Weighted-Average Borrowing Term (Years) | 8.1 | 12.8 | 13.0 | 12.4 | 13.6 | 14.1 | 14.2 | 13.9 | 12.1 | 12.9 | 14.3 | 11.9 |
| Debt Portfolio Average Term (Years) | 9.7 | 10.0 | 10.1 | 10.1 | 10.4 | 10.7 | 10.9 | 10.9 | 10.7 | 10.7 | 10.9 | 10.7 |
Source: Ontario Financing Authority.
Chart 4.10: Interest on Debt-to-Revenue Ratio
Ontario’s interest on debt-to-revenue ratio is forecast to be 8.2 per cent in 2020–21.
| Year | Interest on Debt-to-Revenue Ratio (%) |
2019 Budget Forecast (%) |
|---|---|---|
| 1990–91 | 7.7 | – |
| 1991–92 | 8.8 | – |
| 1992–93 | 10.8 | – |
| 1993–94 | 13.9 | – |
| 1994–95 | 14.5 | – |
| 1995–96 | 14.6 | – |
| 1996–97 | 14.8 | – |
| 1997–98 | 14.2 | – |
| 1998–99 | 14.3 | – |
| 1999–00 | 15.5 | – |
| 2000–01 | 15.0 | – |
| 2001–02 | 14.2 | – |
| 2002–03 | 12.9 | – |
| 2003–04 | 12.9 | – |
| 2004–05 | 11.1 | – |
| 2005–06 | 9.7 | – |
| 2006–07 | 8.9 | – |
| 2007–08 | 8.4 | – |
| 2008–09 | 8.7 | – |
| 2009–10 | 8.9 | – |
| 2010–11 | 8.8 | – |
| 2011–12 | 9.1 | – |
| 2012–13 | 9.0 | – |
| 2013–14 | 9.1 | – |
| 2014–15 | 8.9 | – |
| 2015–16 | 8.5 | – |
| 2016–17 | 8.3 | – |
| 2017–18 | 7.9 | – |
| 2018–19 | 8.1 | – |
| 2019–20 | 8.0 | 8.6 |
| 2020–21 | 8.2 | 8.6 |
| 2021–22 | 8.7 | 8.8 |
| 2022–23 | 8.7 | 8.8 |
Sources: Public Accounts of Ontario (1990–1991 to 2019–2020) and Ontario Financing Authority.
Chart 4.11: Average Unrestricted Liquid Reserve Levels
Average unrestricted liquid reserve levels are forecasted to 2020–21 fiscal year end to be $37.5 billion as of September 30, 2020.
| Year | Average Unrestricted Liquid Reserve Levels ($ billions) |
|---|---|
| 2009–10 | 14.4 |
| 2010–11 | 19.4 |
| 2011–12 | 20.2 |
| 2012–13 | 23.3 |
| 2013–14 | 24.9 |
| 2014–15 | 23.6 |
| 2015–16 | 21.7 |
| 2016–17 | 21.1 |
| 2017–18 | 30.1 |
| 2018–19 | 32.7 |
| 2019–20 | 32.3 |
| 2020–21 | 37.5 |
Source: Ontario Financing Authority.