Introduction
Ontario conducts its borrowing program responsibly and prudently to manage interest on debt (IOD) costs.
Ontario’s forecast total borrowing requirement in 2022–23 has decreased by $12.3 billion, or 22 per cent, compared with the forecast from the 2022 Budget, as a result of lower-than-projected deficits. The long-term and short-term borrowing program forecasts have been reduced by $9.3 billion and $3.0 billion, respectively. With these updates, $18.6 billion, or 58 per cent of this year’s $32.2 billion current long-term borrowing requirement has been completed to date.
Ontario’s net debt-to-GDP ratio is now forecast to be 38.4 per cent in 2022–23, compared with the forecast of 41.4 per cent in the 2022 Budget. This is down by 0.8 percentage points since 2021–22.
Ontario’s net debt-to-revenue is now forecast to be 218 per cent in 2022–23, compared with the forecast of 238 per cent in the 2022 Budget.
Ontario is forecast to pay $13.6 billion in interest costs in 2022–23, up from the 2022 Budget forecast of $13.5 billion as a result of higher-than-projected interest rates. Ontario’s 2022–23 interest on debt-to-revenue is forecasted to be 7.3 per cent, a decrease of 0.2 percentage points from the 2022 Budget forecast of 7.5 per cent.
Borrowing Program
Ontario’s long-term borrowing requirement for 2022–23 is forecast to be $32.2 billion, $9.3 billion less than the 2022 Budget forecast. This is primarily due to the stronger financial results reported in the Public Accounts of Ontario 2021–2022, lower-than-forecast deficit for 2022–23, and pre‑borrowing for 2023–24. Ontario’s borrowing program is also driven by a historic capital plan.
The $8.0 billion in-year change in non-cash and cash timing for 2022–23 is primarily due to higher-than-projected corporate tax and personal income tax revenues in fiscal 2021–22, as reported in the Public Accounts of Ontario 2021–2022. This is projected to increase cash receipts by $8.0 billion in 2022–23, allowing for an equivalent reduction in the total funding requirement.
Over the three-year outlook period, total long-term borrowing is now forecast to be $22.1 billion lower than forecast in the 2022 Budget. Furthermore, the short-term borrowing program is forecast to be $3.0 billion lower in 2022–23 and $1.0 billion lower in 2023–24, reducing Ontario’s overall borrowing needs by $26.1 billion over the three-year outlook period compared to the 2022 Budget forecast. Had the borrowing program stayed the same as in the 2022 Budget forecast, given higher interest rates forecast today, IOD would have been $0.2 billion higher in 2022–23, $0.7 billion higher in 2023–24 and $1.0 billion higher in 2024–25.
| 2022 Budget |
In-Year Change |
Current Outlook 2022–23 |
Medium-Term Outlook 2023–24 |
Medium-Term Outlook 2024–25 |
|
|---|---|---|---|---|---|
| Deficit/(Surplus) | 19.9 | (6.9) | 12.9 | 8.1 | 0.7 |
| Investment in Capital Assets | 13.4 | – | 13.4 | 13.6 | 15.0 |
| Non-Cash and Cash Timing Adjustments | (9.7) | (8.0) | (17.7) | (9.6) | (10.5) |
| Loans to Infrastructure Ontario | (0.1) | (0.1) | (0.2) | 0.1 | 0.1 |
| Other Net Loans/Investments | 0.7 | (0.3) | 0.4 | 0.0 | (0.8) |
| Debt Maturities/Redemptions | 30.5 | 0.0 | 30.6 | 31.2 | 27.8 |
| Total Funding Requirement | 54.7 | (15.3) | 39.5 | 43.4 | 32.3 |
| Decrease/(Increase) in Short-Term Borrowing | (3.0) | 3.0 | – | (2.0) | – |
| Increase/(Decrease) in Cash and Cash Equivalents | – | – | – | – | – |
| Pre-borrowing in 2021–22 for 2022–23 | (10.3) | – | (10.3) | – | – |
| Pre-borrowing for 2023–24 | – | 3.0 | 3.0 | (3.0) | – |
| Total Long-Term Public Borrowing | 41.5 | (9.3) | 32.2 | 38.4 | 32.3 |
Table 4.1 footnotes:
Note: Numbers may not add due to rounding.
Source: Ontario Financing Authority.
As of October 14, 2022, $18.6 billion, or 58 per cent of this year’s long-term public borrowing has been completed. Ontario expects to complete its 2022–23 long-term public borrowing program before the end of the fiscal year, and subject to favourable market conditions, currently plans to pre-borrow $3.0 billion for 2023–24.
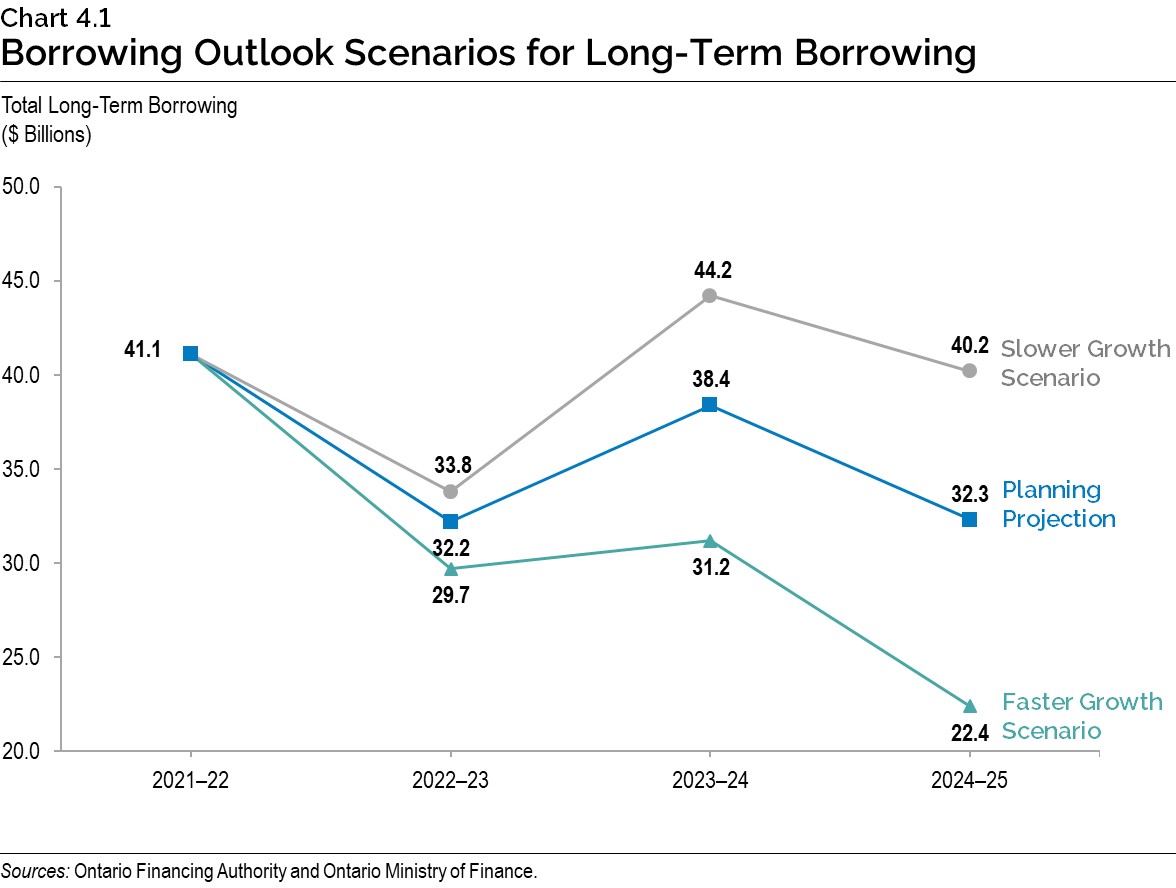
In the event that alternative economic scenarios materialize, Ontario’s borrowing requirements in the next three years would also change. See Ontario’s Economic and Fiscal Outlook in Brief for more details and a description of the resulting alternative medium-term outlook scenarios. Under the Faster Growth scenario, long-term borrowing would decrease by a total of $19.6 billion over the three-year outlook period, while under the Slower Growth scenario, long‑term borrowing would increase by $15.3 billion over the same period.
Approximately 80 per cent of 2022–23 borrowing has been completed in Canadian dollars through 18 syndicated issues and a Green Bond. Ontario’s target range for domestic borrowing remains unchanged at 65 to 80 per cent of borrowing completed for the 2022–23 fiscal year. This range will be further adjusted, if necessary, in response to evolving investor demand in the Canadian dollar and foreign currency debt markets.
Foreign currency borrowing helps reduce Ontario’s overall borrowing costs by continuing to diversify Ontario’s investor base. This diversification ensures the government will continue to have access to capital even if domestic market conditions become challenging. Approximately $3.7 billion, or 20 per cent of this year’s long-term borrowing to date, has been completed in foreign currencies, primarily in U.S. dollars.
Green Bond Program
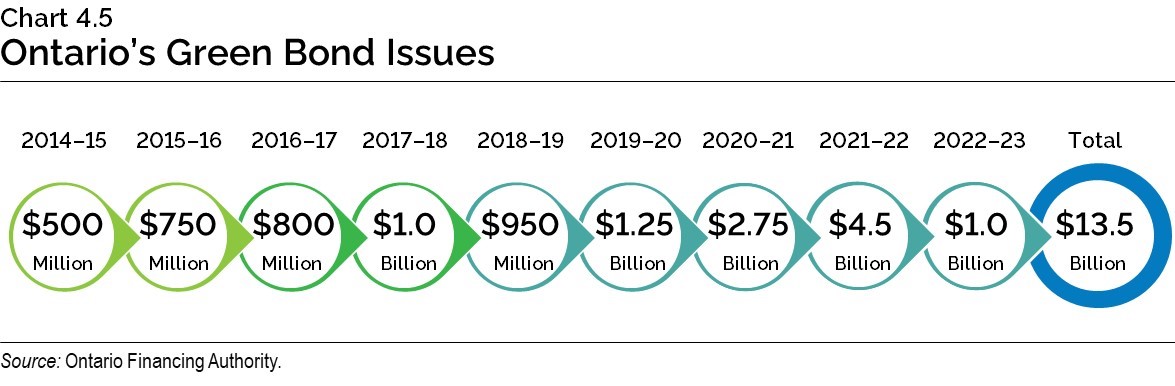
Green Bonds remain a core, cost-effective component of Ontario’s borrowing program and are an important tool to help finance public transit initiatives, extreme weather-resistant infrastructure, as well as energy efficiency and conservation projects. Ontario remains the largest issuer of Canadian dollar Green Bonds, totalling $13.5 billion issued since 2014–15, with $13.0 billion outstanding.
On October 5, 2022, Ontario issued its first Green Bond of 2022–23, and twelfth Green Bond overall for $1.0 billion. Five projects under the Clean Transportation framework category were selected to receive funding from the issue, with a focus on the electrification of Ontario’s mass transit system buildout, as follows:
- GO Expansion;
- Finch West Light Rail Transit (LRT);
- Hurontario LRT;
- Ontario Line Subway; and
- Scarborough Subway Extension.
Ontario is considering updating its Green Bond Framework. The update may include better alignment of framework categories with the Green Bond Principles through standardized wording, as well as the possible expansion from green to sustainable to allow for a greater breadth of potential bond offerings in the future.
Ontario plans to continue its leadership in the Canadian dollar Green Bond market and, subject to market conditions, will issue multiple Green Bonds each fiscal year, including in 2022–23.
Cost of Debt
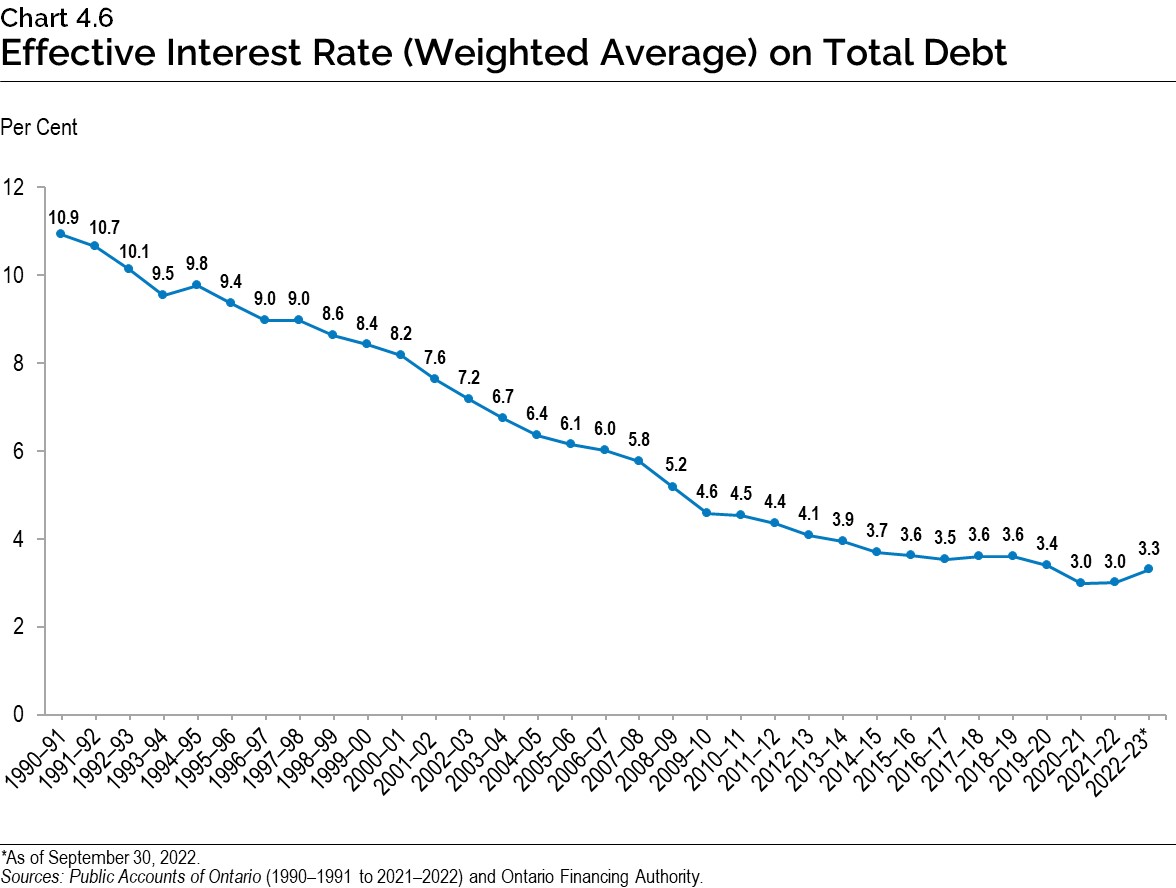
After a three-decade decline, interest rates have begun to rise as central banks, including the Bank of Canada and the U.S. Federal Reserve, have raised overnight interest rates. This will impact Ontario’s interest on debt (IOD) costs. Chart 4.6 shows that while the effective interest rate has begun to rise, the interest rate on the total debt portfolio remains low in historical terms due to Ontario’s decision to lock in long-term rates and extend the term of its debt over the past decade.
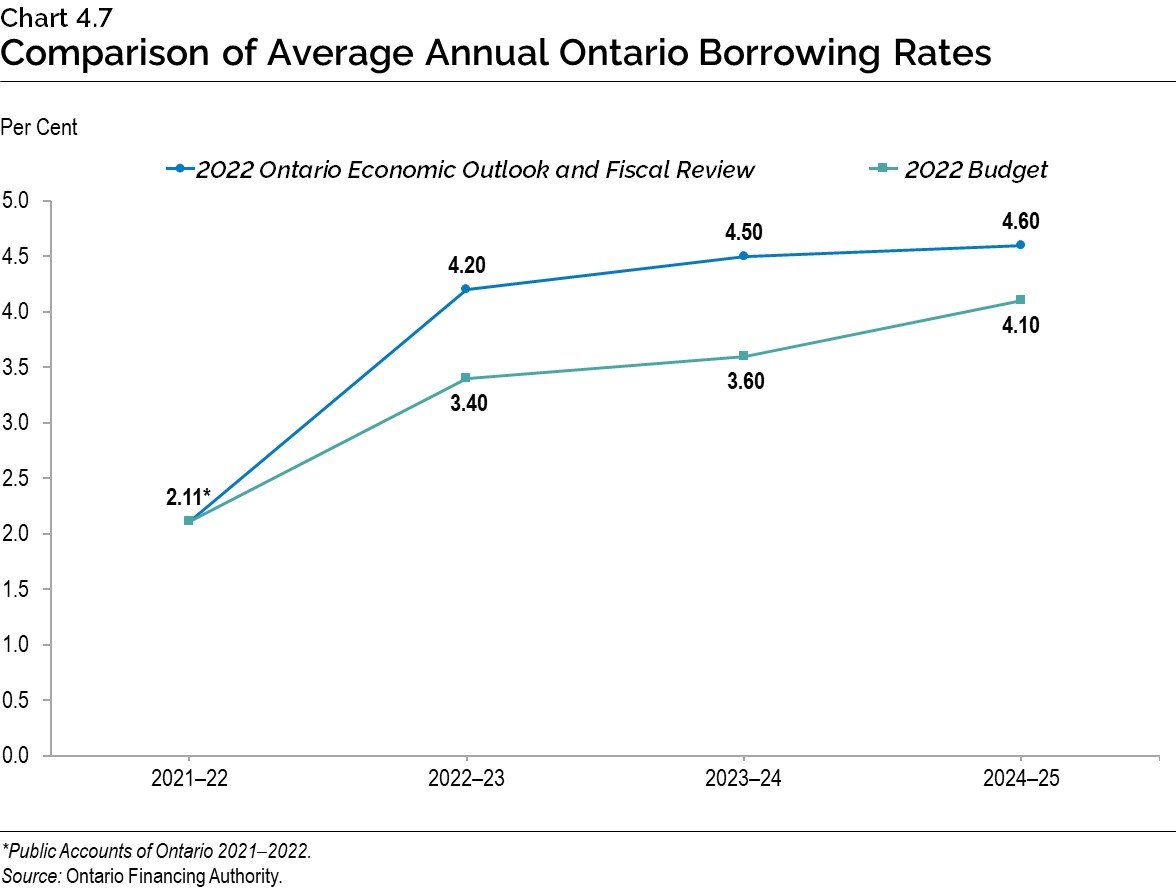
The overall increase in interest rates has resulted in Ontario’s projected cost of borrowing in 2022–23 going up by 80 basis points from the 3.40 per cent forecast in the 2022 Budget. A one percentage point change in interest rates either up or down from the current interest rate forecast is estimated to have a corresponding change in Ontario’s borrowing costs by around $650 million in the first full year, if the size of the borrowing program remains unchanged from the current projection.
Chart 4.7 shows the average borrowing rates on debt issued thus far this fiscal year, combined with the forecast for the remainder of the year, for an average annual borrowing rate projection of 4.20 per cent in 2022–23. The chart also shows the forecast used to estimate the future cost of borrowing or IOD expense for the next two fiscal years.
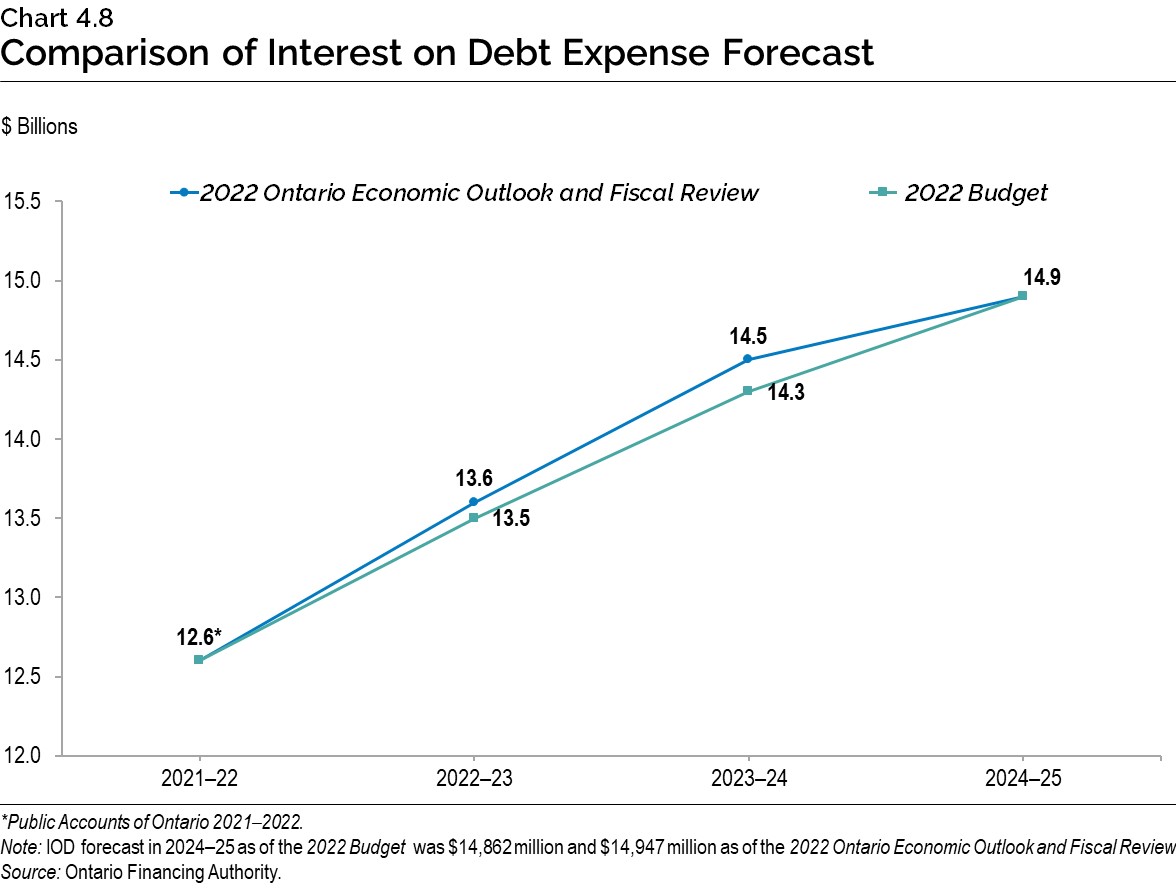
As a result of higher-than-projected interest rates, the IOD forecast for 2022–23 is $13.6 billion, up from the 2022 Budget forecast of $13.5 billion. IOD in 2023–24 and 2024–25 is forecast to be $14.5 billion and $14.9 billion, respectively. When compared to the forecast in the 2022 Budget, IOD is higher by $0.2 billion in 2023–24 and $0.1 billion in 2024–25. IOD remains Ontario’s fourth-largest expense after health care, education and social services.
Term of Debt
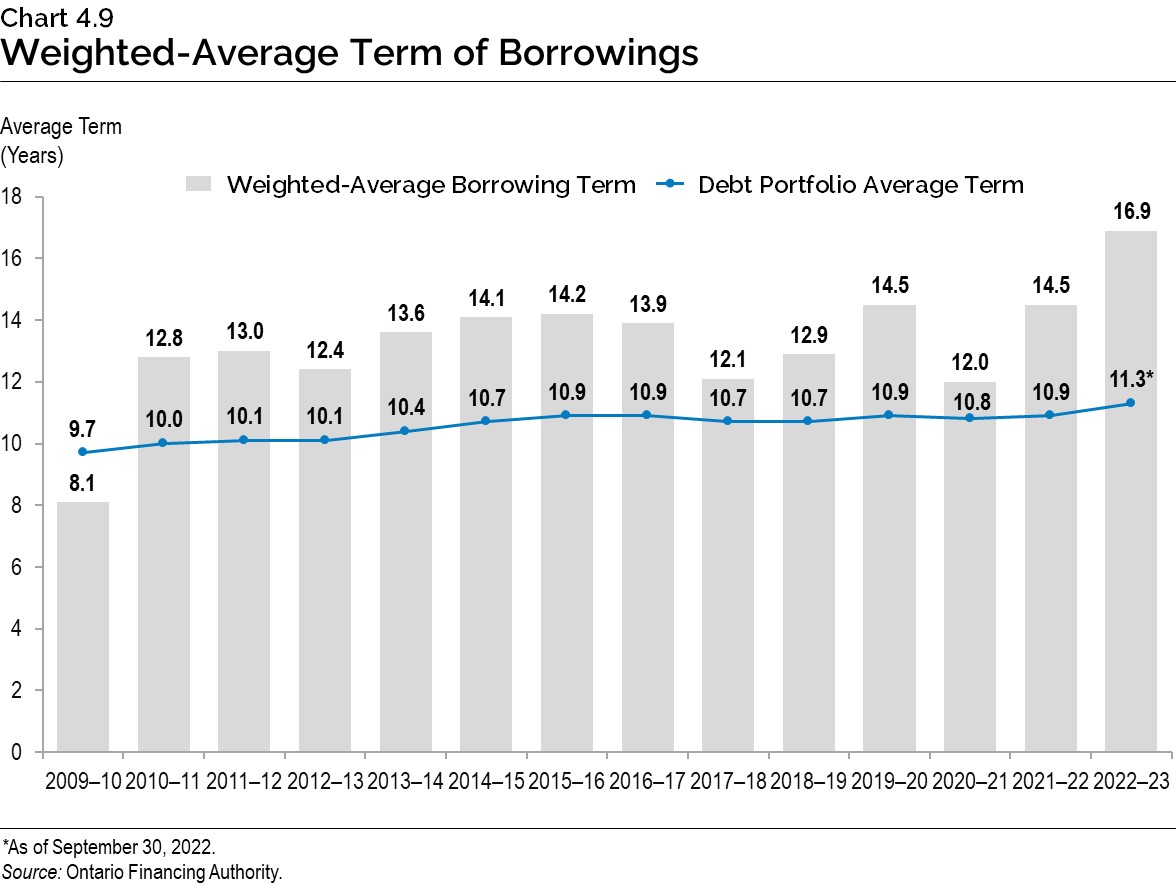
Ontario continues to extend the term of its debt, when investor demand allows, to reduce refinancing risk on maturing debt. This also protects the IOD forecast, in the long term, against further increases in interest rates. Ontario has issued $121.2 billion of bonds, or more than one‑quarter of total debt, with maturities of 30 years or longer since 2010–11. This includes $7.3 billion so far in 2022–23.
With interest rates rising but still low compared to the period preceding the global financial crisis in 2007–08, and a large borrowing program and debt portfolio, the current plan is to maintain the term of Ontario’s debt at the level it has been at since 2014–15. The success Ontario has had in extending the term of its debt from the time of the global financial crisis leaves it with flexibility going forward. The rise in long-term interest rates will be monitored to determine whether a modest change to Ontario’s debt term strategy is appropriate in the future.
Ensuring Adequate Liquidity Levels
Ontario balances the objective of minimizing the cost of holding liquid reserves against the need to always have enough cash on hand to pay its bills, invest in capital assets, refinance maturing debt and pay interest.
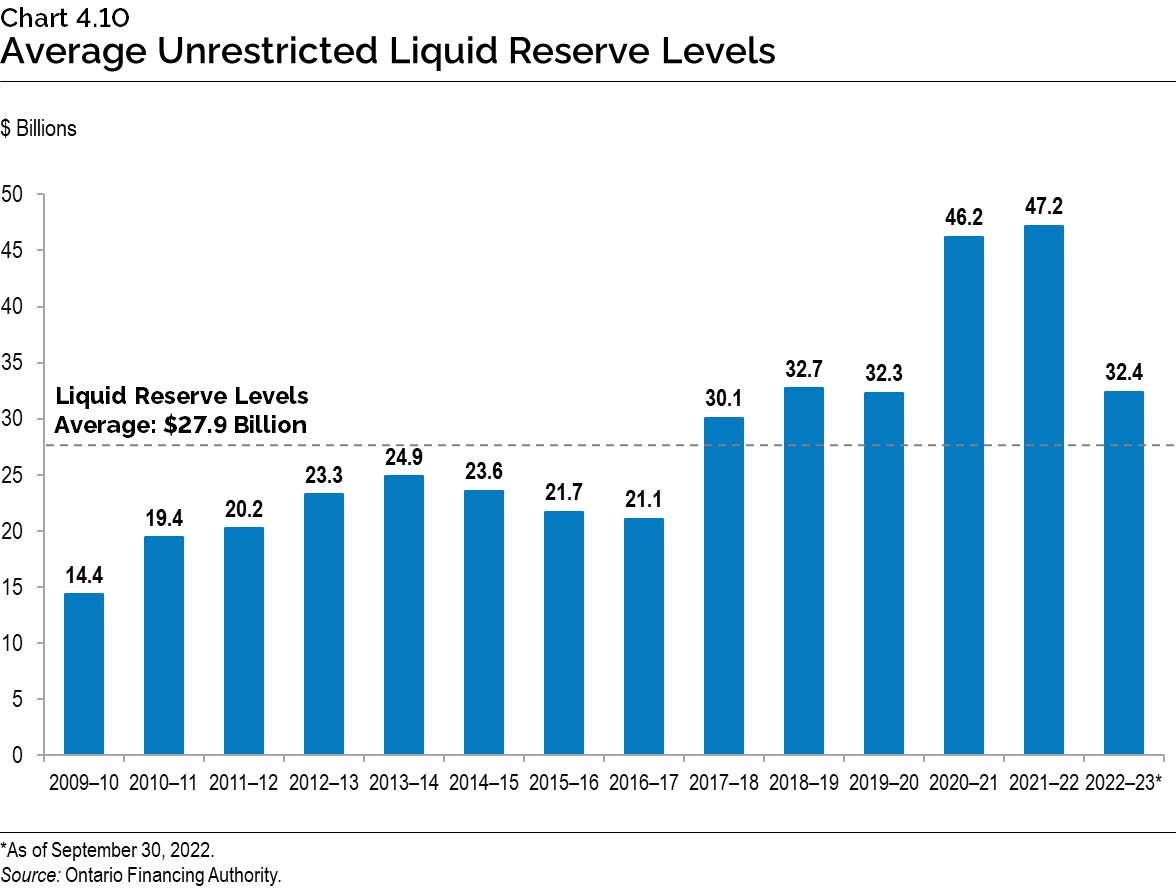
Over the last two years, Ontario had built larger cash reserves due to growth in the borrowing program. Starting in 2022–23, Ontario plans to bring liquid reserves back to pre‑COVID‑19 pandemic levels, as depicted in Chart 4.10. Cash reserves also allow the government to quickly respond to any unforeseen borrowing market, economic or public health circumstances.
Progress on the Debt Burden Reduction Strategy
In the 2022 Budget, Ontario included an updated Debt Burden Reduction Strategy, with specific objectives and new targets over the medium-term outlook for the relevant measures of debt sustainability. The government remains committed to reducing the debt burden and putting Ontario’s finances back on a more sustainable path.
Ontario has made progress towards each of the existing targets in its debt burden reduction strategy, with some notable improvements since the 2022 Budget.
| 2022 Budget Target |
2022 Budget 2022–23 |
2022 FES 2022–23 |
|
|---|---|---|---|
| Net Debt-to- GDP | <42.0 | 41.4 | 38.4 |
| Net Debt-to-Revenue | <250 | 238 | 218 |
| Interest on Debt-to-Revenue | <8.0 | 7.5 | 7.3 |
| Debt Maturities-to-Net Debt | <10.0 | 7.1 | 7.5 |
Table 4.2 footnotes:
Note: 2022 FES in the table is defined as the 2022 Ontario Economic Outlook and Fiscal Review.
Source: Ontario Financing Authority.
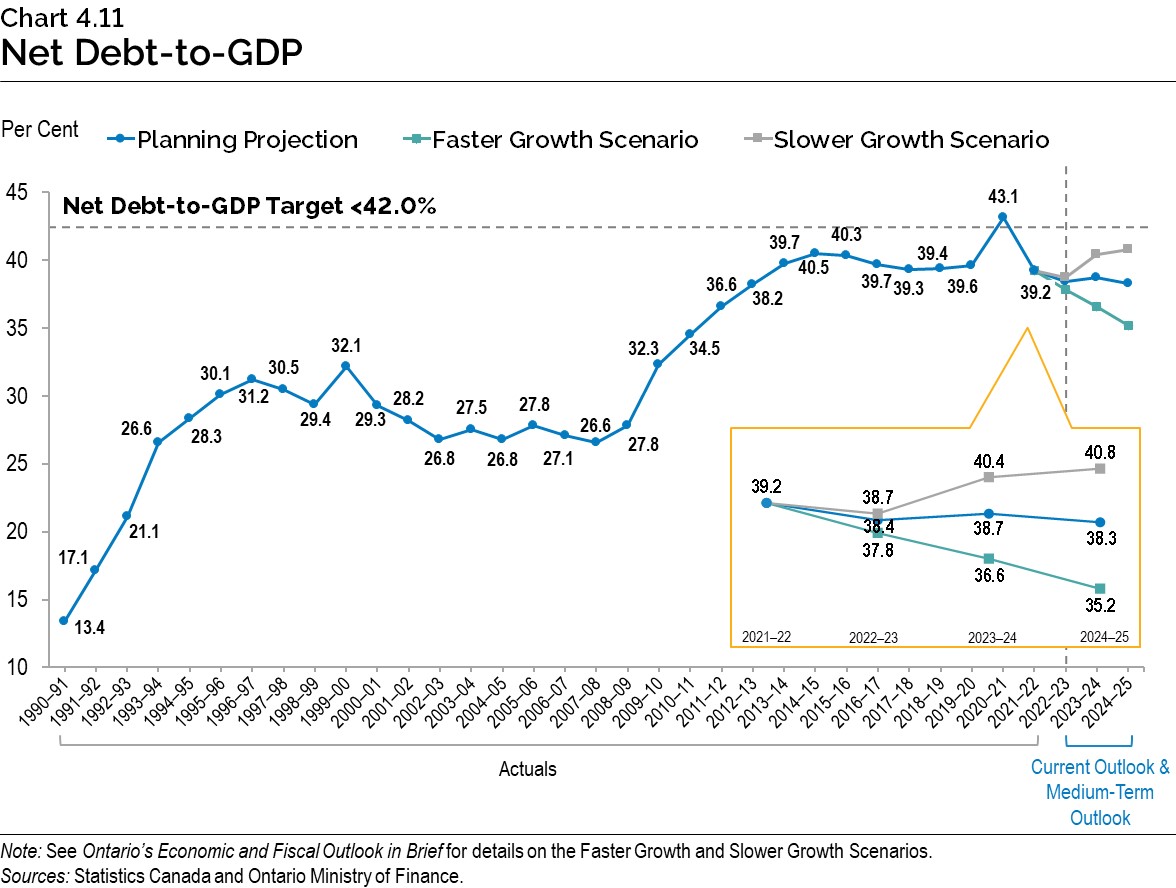
Ontario’s 2022–23 net debt-to-GDP ratio is now forecast to be 38.4 per cent, a decrease of 3.0 percentage points from the forecasted 41.4 per cent at the time of the 2022 Budget, and 0.8 percentage points lower than 2021–22. This was due to lower than previously projected deficits and higher nominal GDP growth. Over the medium-term outlook, the net debt‑to‑GDP ratio is forecast to remain well below the target of42.0 per cent. Ontario’s net debt-to-GDP is now forecast to be 38.7 per cent in 2023–24, and 38.3 per cent in 2024–25, compared to the 2022 Budget forecasts of 41.4 per cent and 41.3 per cent, respectively.
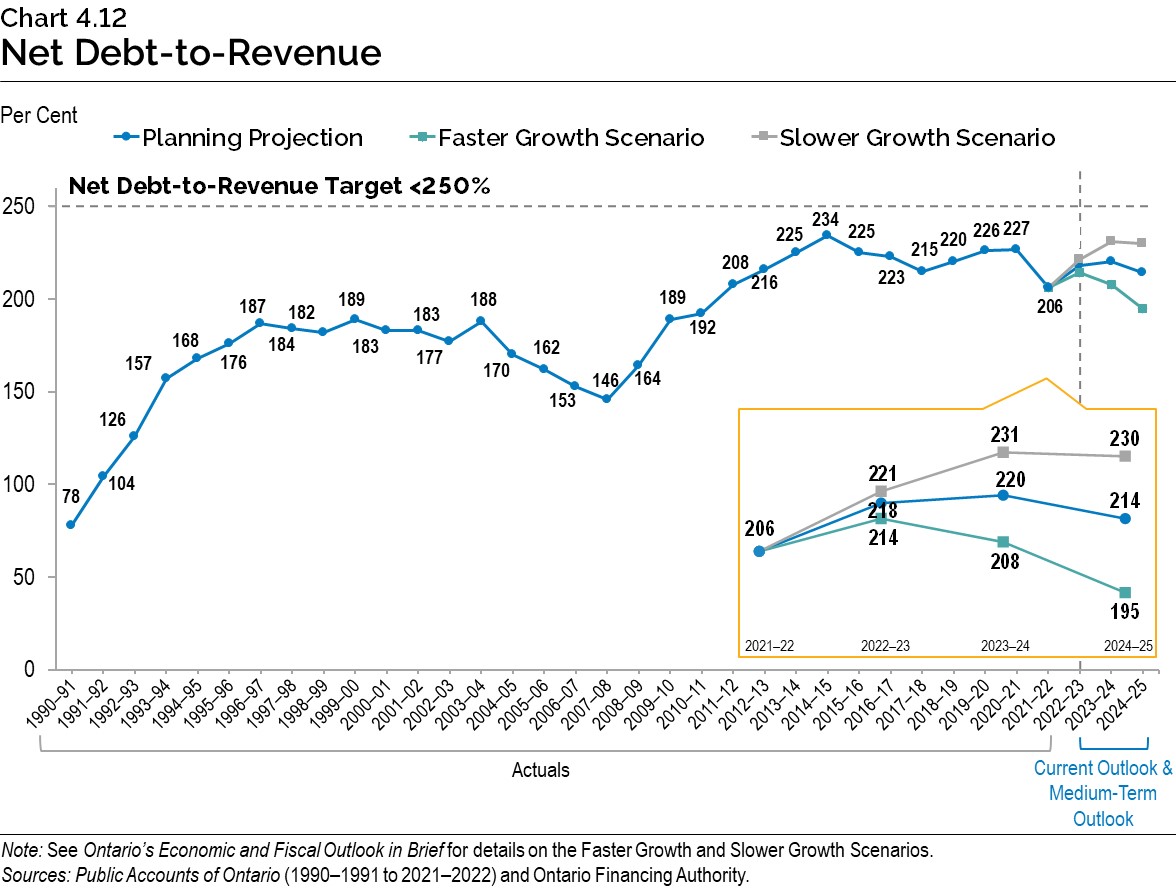
The net debt‑to-revenue ratio is projected to be 218 per cent in 2022–23, 20 percentage points below the 238 per cent forecast in the 2022 Budget. Over the medium-term outlook, this ratio is forecast to be 220 per cent in 2023–24 and 214 per cent in 2024–25, lower by 19 percentage points and 24 percentage points, respectively, compared to the forecast in the 2022 Budget.
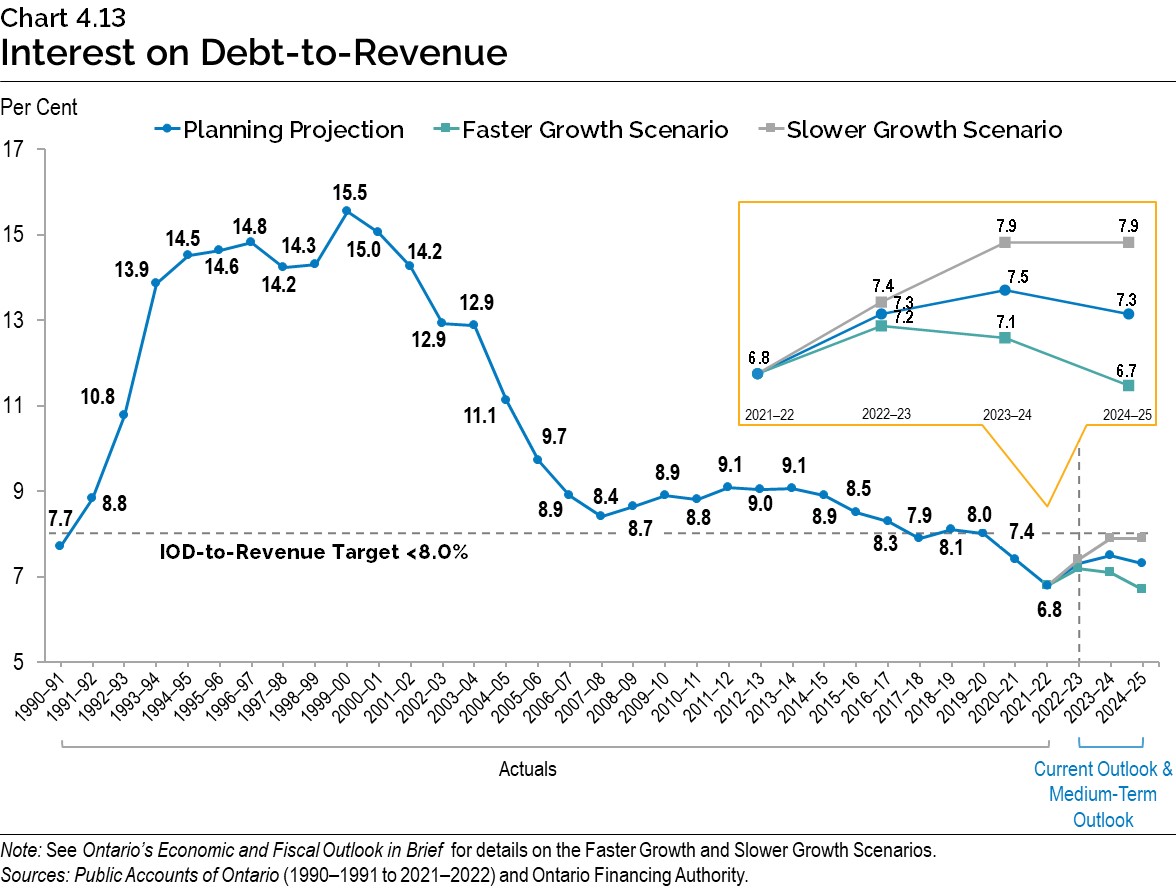
The IOD-to-revenue ratio is forecast to be 7.3 per cent in 2022–23, 0.2 percentage points lower than the 2022 Budget forecast. Despite increases in deficits and borrowing requirements caused by the COVID‑19 pandemic, IOD-to-revenue over the medium term continues to remain lower than forecasted in the pre-COVID‑19 pandemic 2019 Budget. This ratio is forecast to remain below the peak reached following the global financial crisis in 2008–09 and is significantly lower than the levels in the early 1990s through to the mid-2000s.
As of the 2022 Budget, the government introduced an additional relevant measure of debt sustainability in Ontario’s debt burden reduction strategy: debt maturities-to-net debt. The current forecast is 7.5 per cent in 2022–23, 0.4 percentage points higher than the 7.1 per cent forecast in the 2022 Budget, as a result of lower-than-forecasted net debt.
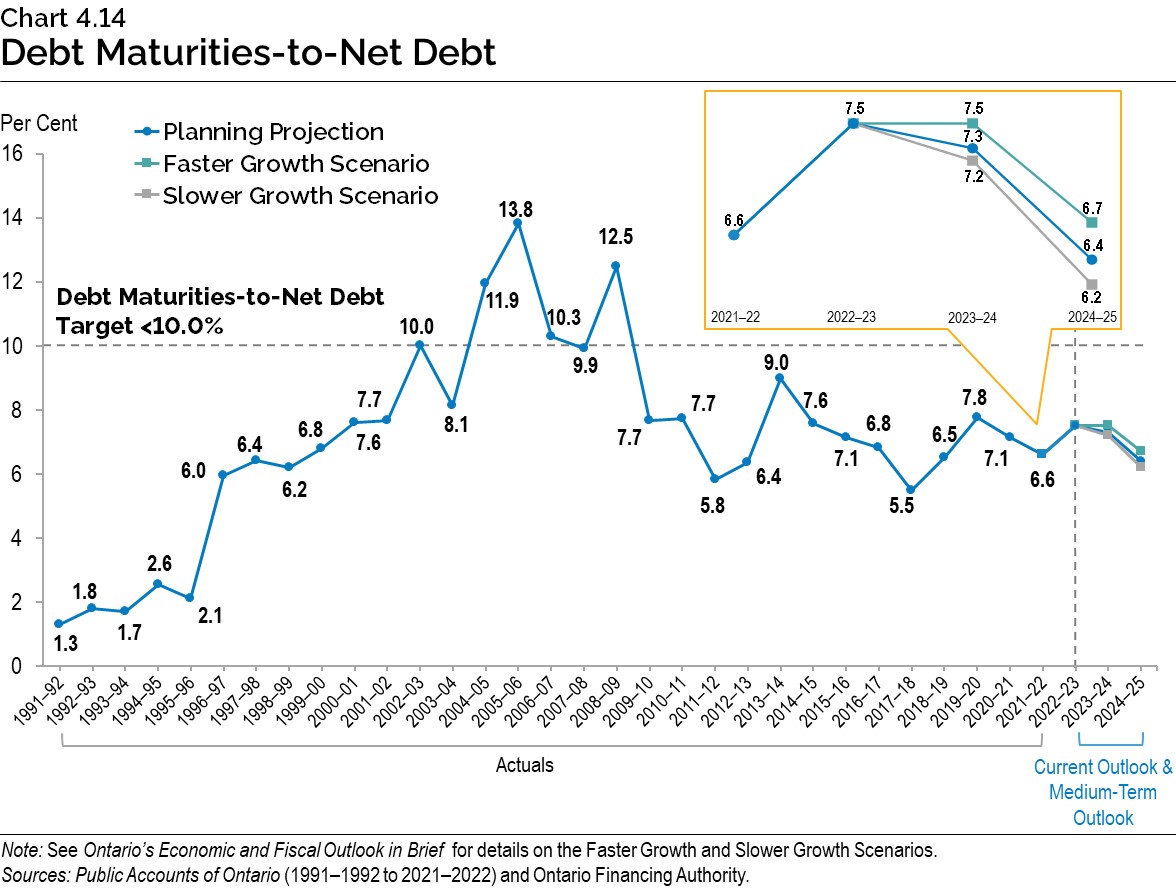
Chart Descriptions
Chart 4.1: Borrowing Outlook Scenarios for Long-Term Borrowing
($ Billions)
| Year | 2021–22 | 2022–23 | 2023–24 | 2024–25 |
|---|---|---|---|---|
| Planning Projection | $41.1 | $32.2 | $38.4 | $32.3 |
| Slower Growth Scenario | $41.1 | $33.8 | $44.2 | $40.2 |
| Faster Growth Scenario | $41.1 | $29.7 | $31.2 | $22.4 |
Sources: Ontario Financing Authority andOntario Ministry of Finance.
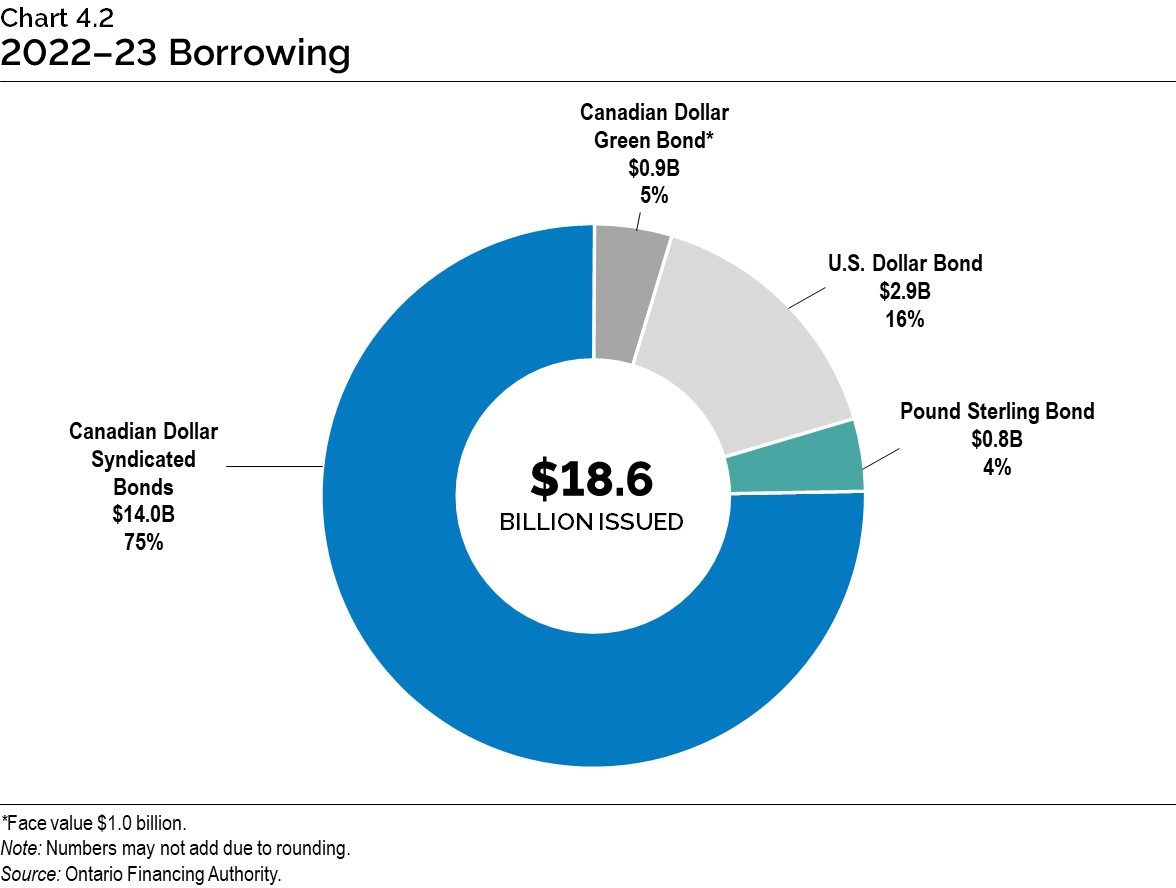
Chart 4.2: 2022–23 Borrowing
Long-term public borrowing of $18.6 billion has been completed for fiscal year 2022–23. This consisted of $14.0 billion (75 per cent) of Canadian dollar syndicated bonds, $0.9 billion (5 per cent) of Canadian dollar Green Bond*, $2.9 billion (16 per cent) of U.S. dollar bond, and $0.8 billion (4 per cent) of Pound sterling bond.
*Face value $1.0 billion.
Note: Numbers may not add due to rounding.
Source: Ontario Financing Authority.
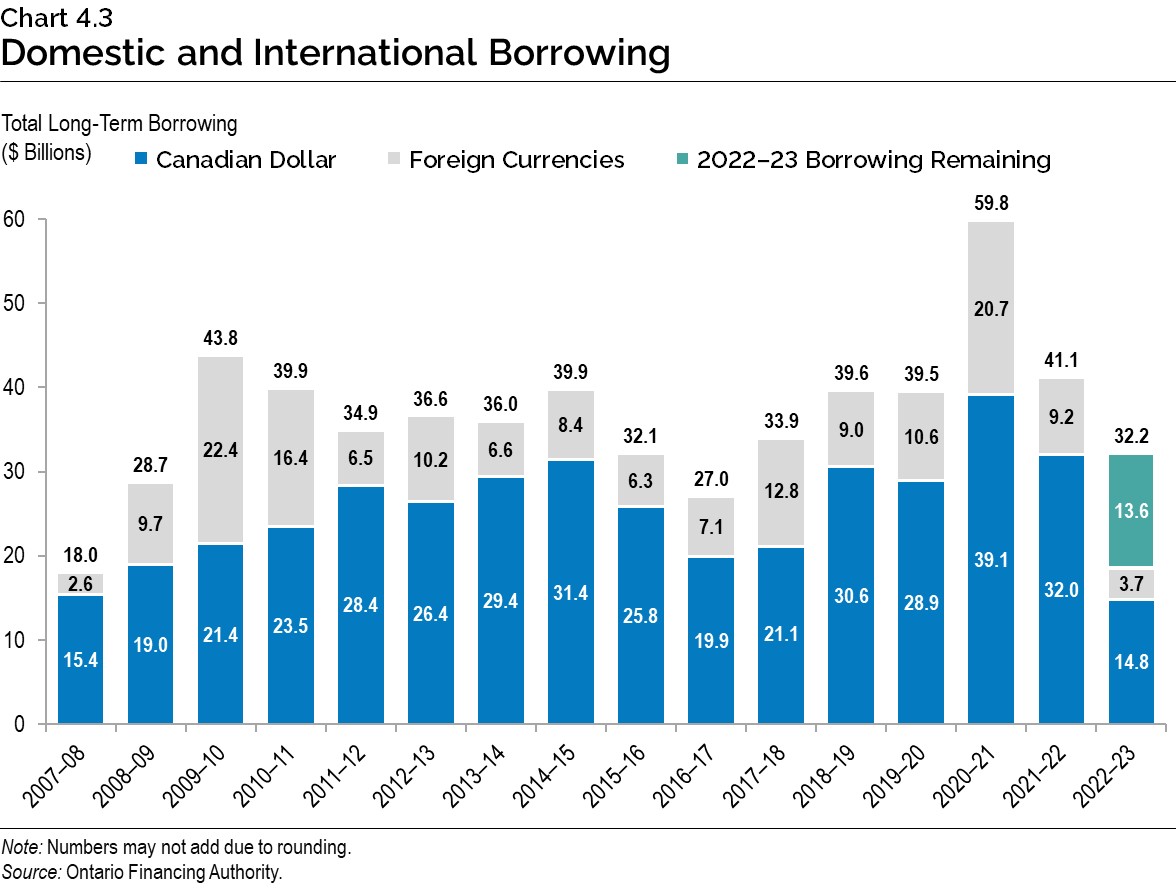
Chart 4.3: Domestic and International Borrowing
Ontario’s total long-term borrowing completed in 2022–23 is forecast to be $32.2 billion — $14.8 billion was borrowed in the Canadian dollar market and $3.7 billion was borrowed in foreign currencies, with $13.6 billion of borrowing remaining for 2022–23.
| Year | Canadian Dollar ($ Billions) |
Foreign Currencies ($ Billions) |
Total ($ Billions) |
|---|---|---|---|
| 2007–08 | 15.4 | 2.6 | 18.0 |
| 2008–09 | 19.0 | 9.7 | 28.7 |
| 2009–10 | 21.4 | 22.4 | 43.8 |
| 2010–11 | 23.5 | 16.4 | 39.9 |
| 2011–12 | 28.4 | 6.5 | 34.9 |
| 2012–13 | 26.4 | 10.2 | 36.6 |
| 2013–14 | 29.4 | 6.6 | 36.0 |
| 2014–15 | 31.4 | 8.4 | 39.9 |
| 2015–16 | 25.8 | 6.3 | 32.1 |
| 2016–17 | 19.9 | 7.1 | 27.0 |
| 2017–18 | 21.1 | 12.8 | 33.9 |
| 2018–19 | 30.6 | 9.0 | 39.6 |
| 2019–20 | 28.9 | 10.6 | 39.5 |
| 2020–21 | 39.1 | 20.7 | 59.8 |
| 2021–22 | 32.0 | 9.2 | 41.1 |
| 2022–23 | 14.8 | 3.7 | 32.2 |
Note: Numbers may not add due to rounding.
Source: Ontario Financing Authority.
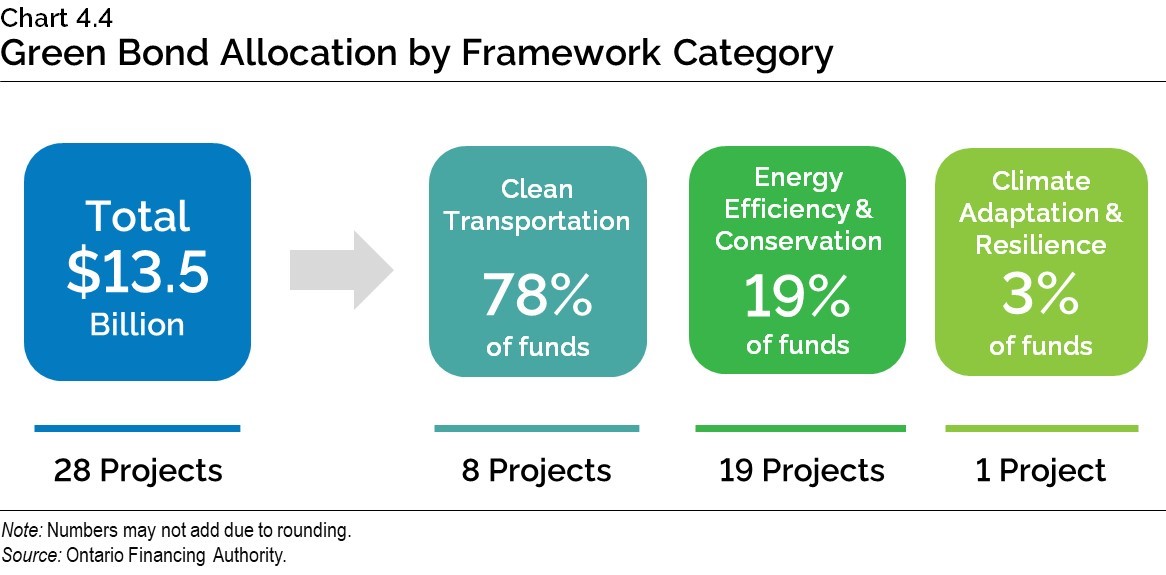
Chart 4.4: Green Bond Allocation by Framework Category
A total of $13.5 billion in Green Bond funding has provided funding for 28 projects. Eight of those projects are under the Clean Transportation framework category and have received 78 per cent of the funding. Nineteen projects are under the Energy Efficiency and Conservation category and have received 19 per cent of the funding. One project is under the Climate Adaptation and Resilience category and has received three per cent of the funding.
Note: Numbers may not add due to rounding.
Source: Ontario Financing Authority.
Chart 4.5: Ontario’s Green Bond Issues
Since 2014, Ontario has issued Green Bonds totalling $13.5 billion.
| Year | 2014–15 | 2015–16 | 2016–17 | 2017–18 | 2018–19 | 2019–20 | 2020–21 | 2021–22 | 2022–23 |
|---|---|---|---|---|---|---|---|---|---|
| Green Bond Issues ($) | $500 million |
$750 million |
$800 million |
$1.0 billion |
$950 million |
$1.25 billion |
$2.75 billion |
$4.5 billion |
$1.0 billion |
Source: Ontario Financing Authority.
Chart 4.6: Effective Interest Rate (Weighted Average) on Total Debt
As of September 30, 2022, the effective interest rate (calculated as a weighted average) for fiscal year-end is forecast to be 3.3 per cent on Ontario’s total debt.
| Year | Effective Interest Rate (%) |
|---|---|
| 1990–91 | 10.9 |
| 1991–92 | 10.7 |
| 1992–93 | 10.1 |
| 1993–94 | 9.5 |
| 1994–95 | 9.8 |
| 1995–96 | 9.4 |
| 1996–97 | 9.0 |
| 1997–98 | 9.0 |
| 1998–99 | 8.6 |
| 1999–00 | 8.4 |
| 2000–01 | 8.2 |
| 2001–02 | 7.6 |
| 2002–03 | 7.2 |
| 2003–04 | 6.7 |
| 2004–05 | 6.4 |
| 2005–06 | 6.1 |
| 2006–07 | 6.0 |
| 2007–08 | 5.8 |
| 2008–09 | 5.2 |
| 2009–10 | 4.6 |
| 2010–11 | 4.5 |
| 2011–12 | 4.4 |
| 2012–13 | 4.1 |
| 2013–14 | 3.9 |
| 2014–15 | 3.7 |
| 2015–16 | 3.6 |
| 2016–17 | 3.5 |
| 2017–18 | 3.6 |
| 2018–19 | 3.6 |
| 2019–20 | 3.4 |
| 2020–21 | 3.0 |
| 2021–22 | 3.0 |
| 2022–23* | 3.3 |
*As of September 30, 2022.
Sources: Public Accounts of Ontario (1990–1991 to 2021–2022) and Ontario Financing Authority.
Chart 4.7: Comparison of Average Annual Ontario Borrowing Rates
| Year | 2022 Ontario Economic Outlook and Fiscal Review (%) | 2022 Budget (%) |
|---|---|---|
| 2021–22 | 2.11* | 2.11* |
| 2022–23 | 4.20 | 3.40 |
| 2023–24 | 4.50 | 3.60 |
| 2024–25 | 4.60 | 4.10 |
*Public Accounts of Ontario 2021–2022.
Source: Ontario Financing Authority.
Chart 4.8: Comparison of Interest on Debt Expense Forecast
| Year | 2022 Ontario Economic Outlook and Fiscal Review ($ Billions) | 2022 Budget ($ Billions) |
|---|---|---|
| 2021–22 | 12.6 * | 12.6* |
| 2022–23 | 13.6 | 13.5 |
| 2023–24 | 14.5 | 14.3 |
| 2024–25 | 14.9 | 14.9 |
Note: IOD forecast in 2024–25 as of the 2022 Budget was $14,862 million and $14,947 million as of the 2022 Ontario Economic Outlook and Fiscal Review.
*Public Accounts of Ontario 2021–2022.
Source: Ontario Financing Authority.
Chart 4.9: Weighted-Average Term of Borrowings
The average term of Ontario’s debt portfolio has been extended from 9.7 years in 2009–10 to 11.3 years in 2022–23. The weighted-average borrowing term for 2022–23 was 16.9 years as of October 14, 2022.
| Year | 2009–10 | 2010–11 | 2011–12 | 2012–13 | 2013–14 | 2014–15 | 2015–16 | 2016–17 | 2017–18 | 2018–19 | 2019–20 | 2020–21 | 2021–22 | 2022–23 |
|---|---|---|---|---|---|---|---|---|---|---|---|---|---|---|
| Weighted-Average Borrowing Term (Years) | 8.1 | 12.8 | 13.0 | 12.4 | 13.6 | 14.1 | 14.2 | 13.9 | 12.1 | 12.9 | 14.5 | 12.0 | 14.5 | 16.9 |
| Debt Portfolio Average Term (Years) | 9.7 | 10.0 | 10.1 | 10.1 | 10.4 | 10.7 | 10.9 | 10.9 | 10.7 | 10.7 | 10.9 | 10.8 | 10.9 | 11.3* |
*As of September 30, 2022.
Source: Ontario Financing Authority.
Chart 4.10: Average Unrestricted Liquid Reserve Levels
Average unrestricted liquid reserve levels are forecast to be $32.4 billion as of September 30, 2022.
| Year | Average Unrestricted Liquid Reserve Levels ($ billions) |
|---|---|
| 2009–10 | 14.4 |
| 2010–11 | 19.4 |
| 2011–12 | 20.2 |
| 2012–13 | 23.3 |
| 2013–14 | 24.9 |
| 2014–15 | 23.6 |
| 2015–16 | 21.7 |
| 2016–17 | 21.1 |
| 2017–18 | 30.1 |
| 2018–19 | 32.7 |
| 2019–20 | 32.3 |
| 2020–21 | 46.2 |
| 2021–22 | 47.2 |
| 2022–23* | 32.4 |
*As of September 30, 2022.
Source: Ontario Financing Authority.
Chart 4.11: Net Debt-to- GDP
Ontario’s net debt-to- GDP ratio is forecast at 38.4 per cent in 2022–23.
| Year | Net Debt-to- GDP (%) | Faster Growth Scenario (%) | Slower Growth Scenario (%) |
|---|---|---|---|
| 1990–91 | 13.4 | – | – |
| 1991–92 | 17.1 | – | – |
| 1992–93 | 21.1 | – | – |
| 1993–94 | 26.6 | – | – |
| 1994–95 | 28.3 | – | – |
| 1995–96 | 30.1 | – | – |
| 1996–97 | 31.2 | – | – |
| 1997–98 | 30.5 | – | – |
| 1998–99 | 29.4 | – | – |
| 1999–00 | 32.1 | – | – |
| 2000–01 | 29.3 | – | – |
| 2001–02 | 28.2 | – | – |
| 2002–03 | 26.8 | – | – |
| 2003–04 | 27.5 | – | – |
| 2004–05 | 26.8 | – | – |
| 2005–06 | 27.8 | – | – |
| 2006–07 | 27.1 | – | – |
| 2007–08 | 26.6 | – | – |
| 2008–09 | 27.8 | – | – |
| 2009–10 | 32.3 | – | – |
| 2010–11 | 34.5 | – | – |
| 2011–12 | 36.6 | – | – |
| 2012–13 | 38.2 | – | – |
| 2013–14 | 39.7 | – | – |
| 2014–15 | 40.5 | – | – |
| 2015–16 | 40.3 | – | – |
| 2016–17 | 39.7 | – | – |
| 2017–18 | 39.3 | – | – |
| 2018–19 | 39.4 | – | – |
| 2019–20 | 39.6 | – | – |
| 2020–21 | 43.1 | – | – |
| 2021–22 | 39.2 | 39.2 | 39.2 |
| 2022–23 | 38.4 | 37.8 | 38.7 |
| 2023–24 | 38.7 | 36.6 | 40.4 |
| 2024–25 | 38.3 | 35.2 | 40.8 |
Note: See Ontario’s Economic and Fiscal Outlook in Brief for details on the Faster Growth and Slower Growth Scenarios.
Sources: Statistics Canada and Ontario Ministry of Finance.
Chart 4.12: Net Debt-to-Revenue
Ontario’s net debt-to-revenue ratio is forecast to be 218 per cent in 2022–23.
| Year | Net Debt-to-Revenue Ratio (%) | Faster Growth Scenario (%) | Slower Growth Scenario (%) |
|---|---|---|---|
| 1990–91 | 78 | – | – |
| 1991–92 | 104 | – | – |
| 1992–93 | 126 | – | – |
| 1993–94 | 157 | – | – |
| 1994–95 | 168 | – | – |
| 1995–96 | 176 | – | – |
| 1996–97 | 187 | – | – |
| 1997–98 | 184 | – | – |
| 1998–99 | 182 | – | – |
| 1999–00 | 189 | – | – |
| 2000–01 | 183 | – | – |
| 2001–02 | 183 | – | – |
| 2002–03 | 177 | – | – |
| 2003–04 | 188 | – | – |
| 2004–05 | 170 | – | – |
| 2005–06 | 162 | – | – |
| 2006–07 | 153 | – | – |
| 2007–08 | 146 | – | – |
| 2008–09 | 164 | – | – |
| 2009–10 | 189 | – | – |
| 2010–11 | 192 | – | – |
| 2011–12 | 208 | – | – |
| 2012–13 | 216 | – | – |
| 2013–14 | 225 | – | – |
| 2014–15 | 234 | – | – |
| 2015–16 | 225 | – | – |
| 2016–17 | 223 | – | – |
| 2017–18 | 215 | – | – |
| 2018–19 | 220 | – | – |
| 2019–20 | 226 | – | – |
| 2020–21 | 227 | – | – |
| 2021–22 | 206 | 206 | 206 |
| 2022–23 | 218 | 214 | 221 |
| 2023–24 | 220 | 208 | 231 |
| 2024–25 | 214 | 195 | 230 |
Note: See Ontario’s Economic and Fiscal Outlook in Brief for details on the Faster Growth and Slower Growth Scenarios.
Sources: Public Accounts of Ontario (1990–1991 to 2021–2022) and Ontario Financing Authority.
Chart 4.13: Interest on Debt-to-Revenue
Ontario’s interest on debt-to-revenue ratio is forecast to be 7.3 per cent in 2022–23.
| Year | Interest on Debt-to-Revenue Ratio (%) | Faster Growth Scenario (%) | Slower Growth Scenario (%) |
|---|---|---|---|
| 1990–91 | 7.7 | – | – |
| 1991–92 | 8.8 | – | – |
| 1992–93 | 10.8 | – | – |
| 1993–94 | 13.9 | – | – |
| 1994–95 | 14.5 | – | – |
| 1995–96 | 14.6 | – | – |
| 1996–97 | 14.8 | – | – |
| 1997–98 | 14.2 | – | – |
| 1998–99 | 14.3 | – | – |
| 1999–00 | 15.5 | – | – |
| 2000–01 | 15.0 | – | – |
| 2001–02 | 14.2 | – | – |
| 2002–03 | 12.9 | – | – |
| 2003–04 | 12.9 | – | – |
| 2004–05 | 11.1 | – | – |
| 2005–06 | 9.7 | – | – |
| 2006–07 | 8.9 | – | – |
| 2007–08 | 8.4 | – | – |
| 2008–09 | 8.7 | – | – |
| 2009–10 | 8.9 | – | – |
| 2010–11 | 8.8 | – | – |
| 2011–12 | 9.1 | – | – |
| 2012–13 | 9.0 | – | – |
| 2013–14 | 9.1 | – | – |
| 2014–15 | 8.9 | – | – |
| 2015–16 | 8.5 | – | – |
| 2016–17 | 8.3 | – | – |
| 2017–18 | 7.9 | – | – |
| 2018–19 | 8.1 | – | – |
| 2019–20 | 8.0 | – | – |
| 2020–21 | 7.4 | – | – |
| 2021–22 | 6.8 | 6.8 | 6.8 |
| 2022–23 | 7.3 | 7.2 | 7.4 |
| 2023–24 | 7.5 | 7.1 | 7.9 |
| 2024–25 | 7.3 | 6.7 | 7.9 |
Note: See Ontario’s Economic and Fiscal Outlook in Brief for details on the Faster Growth and Slower Growth Scenarios. Sources: Public Accounts of Ontario (1990–1991 to 2021–2022) and Ontario Financing Authority.
Chart 4.14: Debt Maturities-to-Net Debt
Ontario’s debt maturities-to-net debt ratio is forecast to be 7.5 per cent in 2022–23.
| Year | Planning Projection (%) | Faster Growth Scenario (%) | Slower Growth Scenario (%) |
|---|---|---|---|
| 1991–92 | 1.3 | – | – |
| 1992–93 | 1.8 | – | – |
| 1993–94 | 1.7 | – | – |
| 1994–95 | 2.6 | – | – |
| 1995–96 | 2.1 | – | – |
| 1996–97 | 6.0 | – | – |
| 1997–98 | 6.4 | – | – |
| 1998–99 | 6.2 | – | – |
| 1999–00 | 6.8 | – | – |
| 2000–01 | 7.6 | – | – |
| 2001–02 | 7.7 | – | – |
| 2002–03 | 10.0 | – | – |
| 2003–04 | 8.1 | – | – |
| 2004–05 | 11.9 | – | – |
| 2005–06 | 13.8 | – | – |
| 2006–07 | 10.3 | – | – |
| 2007–08 | 9.9 | – | – |
| 2008–09 | 12.5 | – | – |
| 2009–10 | 7.7 | – | – |
| 2010–11 | 7.7 | – | – |
| 2011–12 | 5.8 | – | – |
| 2012–13 | 6.4 | – | – |
| 2013–14 | 9.0 | – | – |
| 2014–15 | 7.6 | – | – |
| 2015–16 | 7.1 | – | – |
| 2016–17 | 6.8 | – | – |
| 2017–18 | 5.5 | – | – |
| 2018–19 | 6.5 | – | – |
| 2019–20 | 7.8 | – | – |
| 2020–21 | 7.1 | – | – |
| 2021–22 | 6.6 | 6.6 | 6.6 |
| 2022–23 | 7.5 | 7.5 | 7.5 |
| 2023–24 | 7.3 | 7.5 | 7.2 |
| 2024–25 | 6.4 | 6.7 | 6.2 |
Note: See Ontario’s Economic and Fiscal Outlook in Brief for details on the Faster Growth and Slower Growth scenarios.
Sources: Public Accounts of Ontario (1990–1991 to 2021–2022) and Ontario Financing Authority.