Introduction — Ontario’s Plan to Eliminate Deficits and Invest in the Future
The government is continuing to build a stronger economy and lay the foundation for long-term prosperity through a responsible and flexible fiscal plan to respond to uncertainty and risks.
The government recognizes that there remains a high degree of economic uncertainty that could have a significant effect on the province. This is why the government is working to support a long-term plan that will ensure the province is in a strong position to manage risks in a challenging global economy, while investing to build a stronger Ontario. The government has also introduced targeted measures to help keep costs down for families and businesses as prices and interest rates continue to rise.
The 2022 Ontario Economic Outlook and Fiscal Review is reporting progress, with fiscal improvement in all years compared to the plan set out in the 2022 Budget. The government is committed to eliminating the province’s structural deficit in light of ongoing economic uncertainty and fiscal challenges. The government is also redoubling its efforts to bring Ontario’s finances back to balance while continuing to fund Ontario’s Plan to Build and critical government services such as health and education.
The Public Accounts of Ontario 2021–2022 reported a surplus of $2.1 billion in 2021–22, however this surplus is not indicative of fiscal outlook projections going forward, as the Public Accounts do not consider forward-looking factors, such as the impact of changes in the economic outlook or planned future spending decisions.
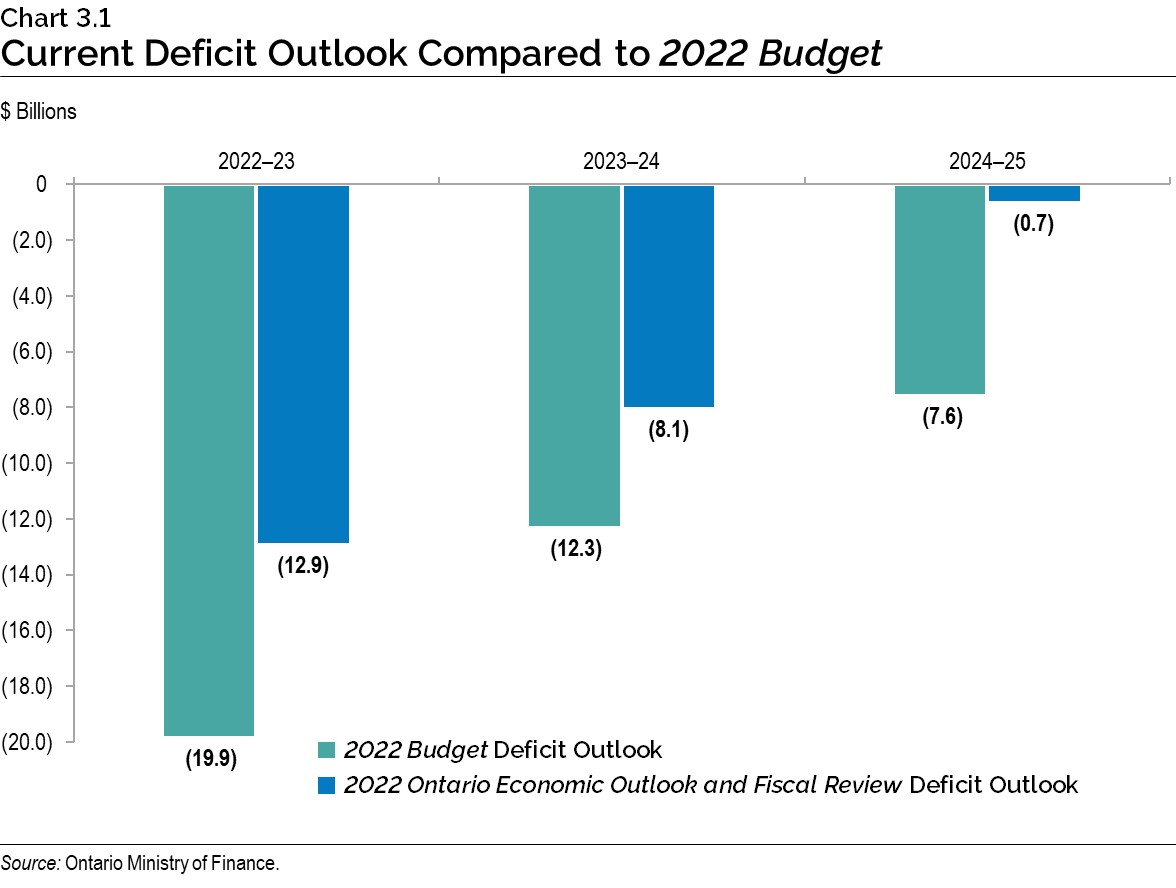
The government is now projecting a $12.9 billion deficit in 2022–23. Over the medium term, the government projects declining deficits of $8.1 billion in 2023–24 and $0.7 billion in 2024–25.
The net debt-to-gross domestic product (GDP) ratio is projected to be 38.4 per cent in 2022–23, 3.0 percentage points lower than the 41.4 per cent forecast presented in the 2022 Budget. This is down 0.8 percentage points since 2021–22. Over the medium-term outlook, the net debt-to-GDP ratio is also forecast to remain lower than the forecasts contained in the 2022 Budget.
| Actual 2021–22 |
Current Outlook 2022–23 |
Medium-Term Outlook 2023–24 |
Medium-Term Outlook 2024–25 |
|
|---|---|---|---|---|
| Revenue | 185.1 | 186.8 | 192.9 | 204.1 |
| Expense — Programs | 170.5 | 185.2 | 185.0 | 188.3 |
| Expense — Interest on Debt | 12.6 | 13.6 | 14.5 | 14.9 |
| Total Expense | 183.0 | 198.8 | 199.5 | 203.2 |
| Surplus/(Deficit) Before Reserve | 2.1 | (11.9) | (6.6) | 0.8 |
| Reserve | – | 1.0 | 1.5 | 1.5 |
| Surplus/(Deficit) | 2.1 | (12.9) | (8.1) | (0.7) |
| Net Debt as a Per Cent of GDP | 39.2% | 38.4% | 38.7% | 38.3% |
| Net Debt as a Per Cent of Revenue | 205.6% | 218.0% | 220.1% | 213.8% |
| Interest on Debt as Per Cent of Revenue | 6.8% | 7.3% | 7.5% | 7.3% |
Table 3.1 footnotes:
Notes: Numbers may not add due to rounding. Current and medium-term outlook primarily reflect information available as of September 30, 2022.
Sources: Ontario Treasury Board Secretariat and Ontario Ministry of Finance.
Key Changes in 2022–23 Since the 2022 Budget
Ontario’s 2022–23 deficit is projected to be $12.9 billion — an improvement of nearly $7 billion from the outlook published in the 2022 Budget.
Revenues in 2022–23 are projected to be $186.8 billion, $7.0 billion higher than forecast in the 2022 Budget. This increase is largely driven by higher-than-expected 2021 taxation revenues indicated by tax return processing and higher-than-projected nominal GDP and inflation in 2022. This forecast is based on information available to September 29, 2022. Tax return processing data from the Canada Revenue Agency for the 2021 tax year became available well after the fiscal year‑end, and additional new information for the 2021 tax year continues to be provided through the year. Information arriving subsequent to September 29, 2022 will be reflected in future fiscal updates.
Program expense is projected to be $185.2 billion, unchanged from the 2022 Budget forecast, with new initiatives funded from existing contingencies.
Ontario is forecast to pay $13.6 billion in interest costs in 2022–23, $0.1 billion higher than the forecast in the 2022 Budget.
The net debt-to-GDP ratio is now projected to be 38.4 per cent in 2022–23, 3.0 percentage points lower than the 41.4 per cent forecast in the 2022 Budget, and down 0.8 percentage points from 2021–22. The net debt-to-GDP ratio decreased due to lower than previously projected deficits and higher nominal GDP growth.
The 2022–23 outlook also maintains a $1.0 billion reserve, unchanged from the 2022 Budget, to protect the fiscal plan against unforeseen adverse changes in Ontario’s revenue and expense forecasts for the remainder of the fiscal year. This is part of the government’s flexible fiscal plan to respond to uncertainty and risks.
| 2022 Budget | Current Outlook | In-Year Change | |
|---|---|---|---|
| Revenue | 179.8 | 186.8 | 7.0 |
| Expense — Programs | 185.2 | 185.2 | – |
| Expense — Interest on Debt | 13.5 | 13.6 | 0.1 |
| Total Expense | 198.6 | 198.8 | 0.1 |
| Surplus/(Deficit) Before Reserve | (18.9) | (11.9) | 6.9 |
| Reserve | 1.0 | 1.0 | – |
| Surplus/(Deficit) | (19.9) | (12.9) | 6.9 |
Table 3.2 footnotes:
Note: Numbers may not add due to rounding.
Sources: Ontario Treasury Board Secretariat and Ontario Ministry of Finance.
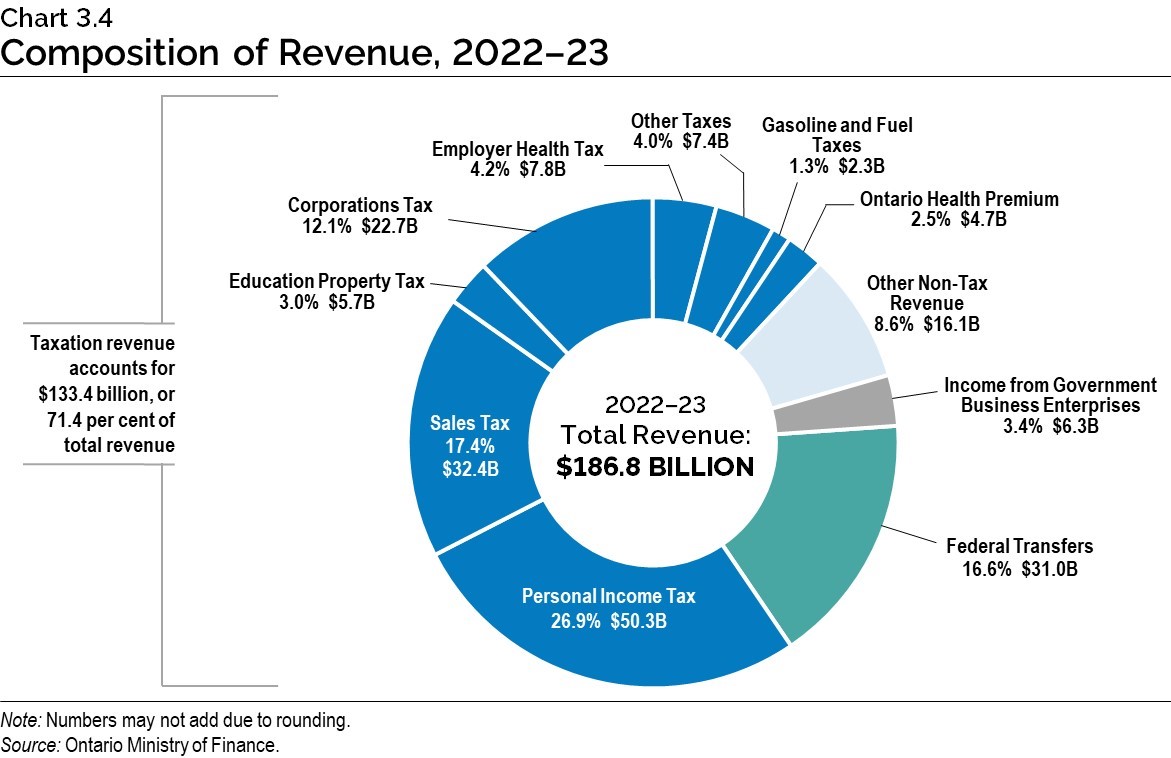
Revenue
The 2022–23 total revenue outlook is $186.8 billion, $7.0 billion higher than projected in the 2022 Budget and $5.8 billion higher than projected in the 2022–23 First Quarter Finances. The increase in the revenue forecast since the 2022–23 First Quarter Finances is mainly due to higher-than-expected 2021 taxation revenues, indicated by tax return processing information available in August for the last taxation year.
| 2022–23 | |
|---|---|
| 2022 Budget Total Revenue | 179,798 |
| Revenue Changes in the 2022–23 First Quarter Finances | 1,204 |
| Revenue Changes Since the 2022–23 First Quarter Finances — Personal Income Tax | 4,813 |
| Revenue Changes Since the 2022–23 First Quarter Finances — Corporations Tax | 2,512 |
| Revenue Changes Since the 2022–23 First Quarter Finances — Gasoline and Fuel Taxes | (444) |
| Revenue Changes Since the 2022–23 First Quarter Finances — Sales Tax | (446) |
| Revenue Changes Since the 2022–23 First Quarter Finances — Land Transfer Tax | (514) |
| Revenue Changes Since the 2022–23 First Quarter Finances — All Other Taxes | (89) |
| Total Taxation Revenue | 5,832 |
| Government of Canada Transfers | 8 |
| Government Business Enterprises | (20) |
| Total Revenue Changes Since the 2022–23 First Quarter Finances | 5,820 |
| Total Revenue Changes Since the 2022 Budget | 7,024 |
| 2022 Ontario Economic Outlook and Fiscal Review Total Revenue Outlook | 186,821 |
Table 3.3 footnotes:
Note: Numbers may not add due to rounding.
Source: Ontario Ministry of Finance.
Key projected changes in the revenue outlook compared with the 2022–23 First Quarter Finances forecast include:
- Personal Income Tax (PIT) revenue increased by $4,813 million mainly due to higher-than-expected revenues from the processing of 2021 tax returns and stronger growth in compensation of employees in 2022. Personal Income Tax revenue is projected to grow by $3,588 million, or 7.7 per cent, compared to 2021–22. Included in the PIT projection are unique factors such as the impact of Canada Recovery Benefit payments that have been deemed taxable by the federal government.
- Corporations Tax revenue increased by $2,512 million mainly due to higher-than-projected revenues from the processing of 2021 tax returns and stronger growth in net operating surplus of corporations in 2022. Corporations Tax revenue is projected to decline by $2,563 million, or 10.2 per cent, compared to 2021–22 mainly due to a one-time amount of $3.8 billion included in 2021–22 reflecting 2020 and 2021 tax returns processed after the finalization of the Public Accounts of Ontario 2020–2021.
- Gasoline and Fuel Taxes combined decreased by $444 million due to the proposed 12-month extension of the reduction to the Gasoline Tax by 5.7 cents per litre and Fuel Tax by 5.3 cents per litre and lower projected fuel consumption volumes. Gasoline Tax and Fuel Tax revenues are projected to decline by $625 million, or 21.0 per cent, compared to 2021–22 due to the reduction to the Gasoline Tax and Fuel Tax. See Annex: Details of Tax Measures and Other Legislative Initiatives for more information.
- Sales Tax revenue decreased by $446 million mainly due to a lower forecast for housing completions and household consumption spending in 2023. Sales Tax revenue is projected to grow by $2,081 million, or 6.8 per cent, compared to 2021–22 supported by strong 2022 household consumption growth and moderated by slower growth in housing completions.
- Land Transfer Tax revenue is lower by $514 million mainly due to a decline in projected home resales in 2022. Land Transfer Tax revenue is projected to decline by $1,442 million, or 24.8 per cent, compared to 2021–22 due to a decline in projected home resales in 2022.
- All Other Taxes combined decreased by $89 million, which is mainly due to lower-than-expected revenues from Tobacco Tax and Beer, Wine and Spirits Taxes. Revenue from All Other Taxes is projected to grow by $698 million, or 3.4 per cent, compared to 2021–22 mainly due to higher projected Employer Health Tax and Ontario Health Premium revenues, partially offset by lower projected Electricity Payments in Lieu of Taxes and Education Property Tax revenues.
- Government of Canada Transfers increased by $8 million, reflecting additional federal funding to support French-language infrastructure projects. Government of Canada Transfers are projected to grow by $436 million, or 1.4 per cent, compared to 2021–22 mainly reflecting higher federal funding under the Canada Health Transfer and Canada Social Transfer programs and funding for infrastructure projects, partially offset by a $2.5 billion reduction in one-time funding related to COVID‑19 from $3.7 billion in 2021–22 to $1.2 billion in 2022–23.
- Net income from Government Business Enterprises declined by $20 million mainly due to a decrease in projected Liquor Control Board of Ontario net income that is largely related to lower‑than-expected sales from rapid normalization of consumer purchasing patterns following the COVID‑19 pandemic and higher shipping costs, partially offset by higher projected net income from the Ontario Lottery and Gaming Corporation due to higher-than-expected casino revenues. Net income from Government Business Enterprises is projected to decline by $182 million, or 2.8 per cent, compared to 2021–22 mainly due to lower projected net income from Ontario Power Generation and Hydro One Limited. This is partially offset by higher projected net income from the Ontario Lottery and Gaming Corporation.
Expense
The 2022–23 total expense outlook is $198.8 billion, $120 million higher than the 2022 Budget and $15 million higher than the 2022–23 First Quarter Finances, due to increased interest on debt expense as a result of higher than projected interest rates.
The government is laying a strong fiscal foundation to support people and businesses, while continuing to invest in critical public services. In 2022–23, base program expense is projected to increase by $18.1 billion compared to 2021–22.
| 2022–23 | |
|---|---|
| 2022 Budget Total Expense | 198,648 |
| Total Expense Changes in the 2022–23 First Quarter Finances | 105 |
| Program Expense Changes Since the 2022–23 First Quarter Finances — Direct Supports to Parents | 365 |
| Program Expense Changes Since the 2022–23 First Quarter Finances — Support for Major Automotive Manufacturers | 213 |
| Program Expense Changes Since the 2022–23 First Quarter Finances — Ontario COVID‑19 Worker Income Protection Benefit Extension | 184 |
| Program Expense Changes Since the 2022–23 First Quarter Finances — Ontario Disability Support Program 5% Rate Increase | 146 |
| Program Expense Changes Since the 2022–23 First Quarter Finances — Ontario Guaranteed Annual Income System (GAINS) | 40 |
| Program Expense Changes Since the 2022–23 First Quarter Finances — Skills Development Fund | 30 |
| Program Expense Changes Since the 2022–23 First Quarter Finances — Social Services Relief Fund | 27 |
| Program Expense Changes Since the 2022–23 First Quarter Finances — Ontario Small Business Relief Grant | 18 |
| Program Expense Changes Since the 2022–23 First Quarter Finances — All Other Changes | 38 |
| Program Expense Changes Since the 2022–23 First Quarter Finances — Total New Allocated Spending | 1,062 |
| Program Expense Changes Since the 2022–23 First Quarter Finances — Drawdown of the Standard Contingency Fund | (1,062) |
| Total Program Expense Changes Since the 2022–23 First Quarter Finances | – |
| Interest on Debt Change Since the 2022–23 First Quarter Finances | 15 |
| Total Expense Changes Since the 2022–23 First Quarter Finances | 15 |
| Total Expense Changes Since the 2022 Budget | 120 |
| 2022 Ontario Economic Outlook and Fiscal Review Total Expense Outlook | 198,768 |
Table 3.4 footnotes:
Note: Numbers may not add due to rounding.
Sources: Ontario Treasury Board Secretariat and Ontario Ministry of Finance.
Since the release of the 2022–23 First Quarter Finances, the government has allocated $1.1 billion towards additional resources for students, workers and businesses, and for supporting the most vulnerable in a time of rising prices and interest rates. These investments were offset from the standard Contingency Fund. Key investments include:
- $365 million for direct payments to parents as part of Ontario’s Plan to Catch Up, with supports for student success such as tutoring or learning supplies and equipment;
- Up to $213 million in support to major automotive manufacturers who are making investments in the retooling of their assembly plants, maintaining and creating jobs, conducting research and development, and building towards the electrified future of Ontario’s automotive industry;
- $184 million made available for extending the Ontario COVID‑19 Worker Income Protection Benefit until March 31, 2023, to reimburse eligible employers for infectious disease emergency leave paid to employees;
- $146 million to increase the monthly core allowances for the Ontario Disability Support Program and the maximum monthly amount for the Assistance for Children with Severe Disabilities program by five per cent as of September 2022;
- $40 million for the Ontario Guaranteed Annual Income System program to provide low-income seniors with immediate help to manage costs;
- $30 million investment in the Skills Development Fund, bringing total funding to $145 million in 2022–23 for the latest round, to support priority infrastructure such as transit and health care projects and youth employment by hiring, training or retraining workers, including apprentices;
- An additional $27 million to help address key housing and homelessness pressures in the City of Toronto through the Social Services Relief Fund;
- $18 million in additional funding through the Ontario Small Business Relief Grant to extend the application deadlines of the time-limited COVID‑19 program to ensure all eligible small businesses impacted by safety measures taken in January 2022 could apply; and
- $38 million in all other changes including supports for tourism and cultural initiatives.
Interest on Debt expense is projected to be $13.6 billion, $15 million higher than the forecast in the 2022–23 First Quarter Finances and $120 million higher than forecast in the 2022 Budget.
Prudence and COVID‑19 Time-Limited Funding in 2022–23
The province continues to maintain a responsible and flexible fiscal plan to respond to uncertainty and risks. The Fiscal Sustainability, Transparency and Accountability Act, 2019 requires Ontario’s fiscal plan to incorporate prudence in the form of a reserve to protect the fiscal outlook against unforeseen adverse changes in the province’s revenue and expense, including those resulting from changes in Ontario’s economic performance. The 2022 Budget included a reserve of $1.0 billion in 2022–23, which has been maintained as part of the current fiscal outlook. In addition, the standard Contingency Fund is maintained to help mitigate expense risks. The remaining standard Contingency Fund is currently projected at $3.5 billion for 2022–23.
To maintain the flexibility necessary given ongoing uncertainty, the government had previously made available time-limited funding and extraordinary contingencies through the Time-Limited COVID‑19 Fund. For the 2022–23 fiscal year, the $2.8 billion Time-Limited COVID‑19 Fund has been fully allocated as of the 2022 Budget. Total COVID‑19 Time-Limited Funding has increased by $0.6 billion, offset through draws on the standard Contingency Fund, and is now projected to be $7.5 billion in 2022–23.
Medium-Term Fiscal Plan
The government is projecting deficits of $8.1 billion in 2023–24 and $0.7 billion in 2024–25. This represents an improvement of $4.3 billion in 2023–24 and $6.9 billion in 2024–25 since the 2022 Budget.
Over the medium term, revenue is forecast to increase from $186.8 billion in 2022–23 to $204.1 billion in 2024–25, while total expense is projected to increase from $198.8 billion to $203.2 billion over the same period.
Medium-Term Revenue Outlook
| Revenue | Actual 2021–22 |
Current Outlook 2022–23 |
Medium-Term Outlook 2023–24 |
Medium-Term Outlook 2024–25 |
|---|---|---|---|---|
| Personal Income Tax | 46.8 | 50.3 | 53.0 | 56.3 |
| Sales Tax | 30.4 | 32.4 | 33.4 | 35.0 |
| Corporations Tax | 25.2 | 22.7 | 22.9 | 24.0 |
| Ontario Health Premium | 4.4 | 4.7 | 4.9 | 5.1 |
| Education Property Tax | 5.7 | 5.7 | 5.6 | 5.6 |
| All Other Taxes | 19.2 | 17.6 | 17.6 | 19.9 |
| Total Taxation Revenue | 131.7 | 133.4 | 137.6 | 145.9 |
| Government of Canada | 30.6 | 31.0 | 32.0 | 33.7 |
| Income from Government Business Enterprises | 6.4 | 6.3 | 6.7 | 7.4 |
| Other Non-Tax Revenue | 16.3 | 16.1 | 16.6 | 17.0 |
| Total Revenue | 185.1 | 186.8 | 192.9 | 204.1 |
Table 3.5 footnotes:
Note: Numbers may not add due to rounding.
Source: Ontario Ministry of Finance.The taxation revenue outlook reflects the impact of finalized 2021–22 results and the updated economic growth outlook since the 2022 Budget. See Chapter 2: Economic Performance and Outlook for more details.
The primary driver of the forecast for Personal Income Tax (PIT) revenue is the outlook for growth in the compensation of employees. Between 2022–23 and 2024–25, PIT revenue is projected to grow at an average annual rate of 5.7 per cent.
The Sales Tax revenue projection is based primarily on the outlook for household consumption spending. Sales Tax revenue is projected to grow at an average annual rate of 3.8 per cent between 2022–23 and 2024–25.
The forecast for Corporations Tax revenue is driven by the projection for net operating surplus of corporations. Corporations Tax revenue is projected to grow at an average annual rate of 2.8 per cent between 2022–23 and 2024–25.
The Ontario Health Premium revenue forecast is based primarily on the outlook for growth in the compensation of employees. Ontario Health Premium revenue is projected to increase at an average annual rate of 4.2 per cent between 2022–23 and 2024–25.
Education Property Tax revenue is based primarily on the outlook for growth in the property assessment base resulting from new construction activities. Revenues are projected to remain relatively stable from 2022–23 to 2024–25, with assessment growth offset by the impact of previously announced measures, including the reduction in Business Education Tax (BET) rates.
Revenues from All Other Taxes are projected to increase at an average annual rate of 6.4 per cent between 2022–23 and 2024–25. This includes revenues from the Employer Health Tax; Land Transfer Tax; Beer, Wine and Spirits Taxes; and volume-based taxes such as the Gasoline Tax, Fuel Tax and Tobacco Tax.
The forecast for Government of Canada transfers is based on existing federal–provincial funding agreements and formulas. Federal transfers are projected to increase at an average annual rate of 4.3 per cent from 2022–23 to 2024–25, which reflect $1.2 billion in one-time funding related to COVID‑19 that ends in 2022–23, and approximately $6.6 billion in federal revenue between 2022–23 to 2024–25 to implement the Canada-wide Early Learning and Child Care Agreement.
The outlook for income from Government Business Enterprises (GBEs) is based on Ontario Ministry of Finance estimates for Hydro One Ltd. (Hydro One) and projections provided by Ontario Power Generation (OPG), the Ontario Cannabis Store (OCS), the Liquor Control Board of Ontario (LCBO) and the Ontario Lottery and Gaming Corporation (OLG). Net incomes of GBEs are projected to increase at an average annual rate of 9.0 per cent from 2022–23 to 2024–25. The strong growth mainly reflects increased returns from OLG stemming from investments in land-based gaming sites and COVID‑19 pandemic recovery, as well as growth in lottery and online offerings.
The forecast for Other Non-Tax Revenue is based on projections provided by government ministries and provincial agencies. The outlook for Other Non-Tax Revenue is projected to increase at an average annual rate of 2.7 per cent from 2022–23 to 2024–25 largely due to the expected increase in third-party revenues of hospitals, school boards and colleges that are reflected in Ontario’s financial statements.
Economic and Fiscal Outlook Scenarios
To illustrate the potential impacts of elevated economic uncertainty, the Ontario Ministry of Finance has developed two plausible alternative scenarios that the economy could take over the next several years. See Chapter 2: Economic Performance and Outlook for more details. Based on the two alternative nominal GDP economic scenarios, two taxation revenue scenarios were developed. The Faster Growth and Slower Growth scenarios each represent a potential path intended to illustrate a broader range of possible outcomes but should not be considered as the best case or the worst case.
| 2022–23p | 2023–24p | 2024–25p | |
|---|---|---|---|
| Faster Growth Scenario | 135.9 | 144.5 | 155.1 |
| Planning Projection | 133.4 | 137.6 | 145.9 |
| Slower Growth Scenario | 131.8 | 132.0 | 138.5 |
Table 3.6 footnotes:
p = Ontario Ministry of Finance Planning Projection based on external sources and alternative scenarios.
Note: Numbers may not add due to rounding.
Source: Ontario Ministry of Finance.
In the Faster Growth scenario, total taxation revenue is $9.2 billion higher in 2024–25 than the Planning Projection, while in the Slower Growth scenario, total taxation revenue is $7.4 billion lower.
In the event that the alternative economic scenarios materialize as opposed to the Planning Projection, Ontario’s fiscal plan would also change as a result.
Under the Faster Growth scenario, the deficit outlook may improve to $10.4 billion in 2022–23, $0.9 billion in 2023–24, and reach a surplus of $9.2 billion in 2024–25. However, if the Slower Growth scenario takes place instead, the deficit outlook may deteriorate to $14.6 billion in 2022– 23, $13.9 billion in 2023–24, and $8.5 billion in 2024–25.
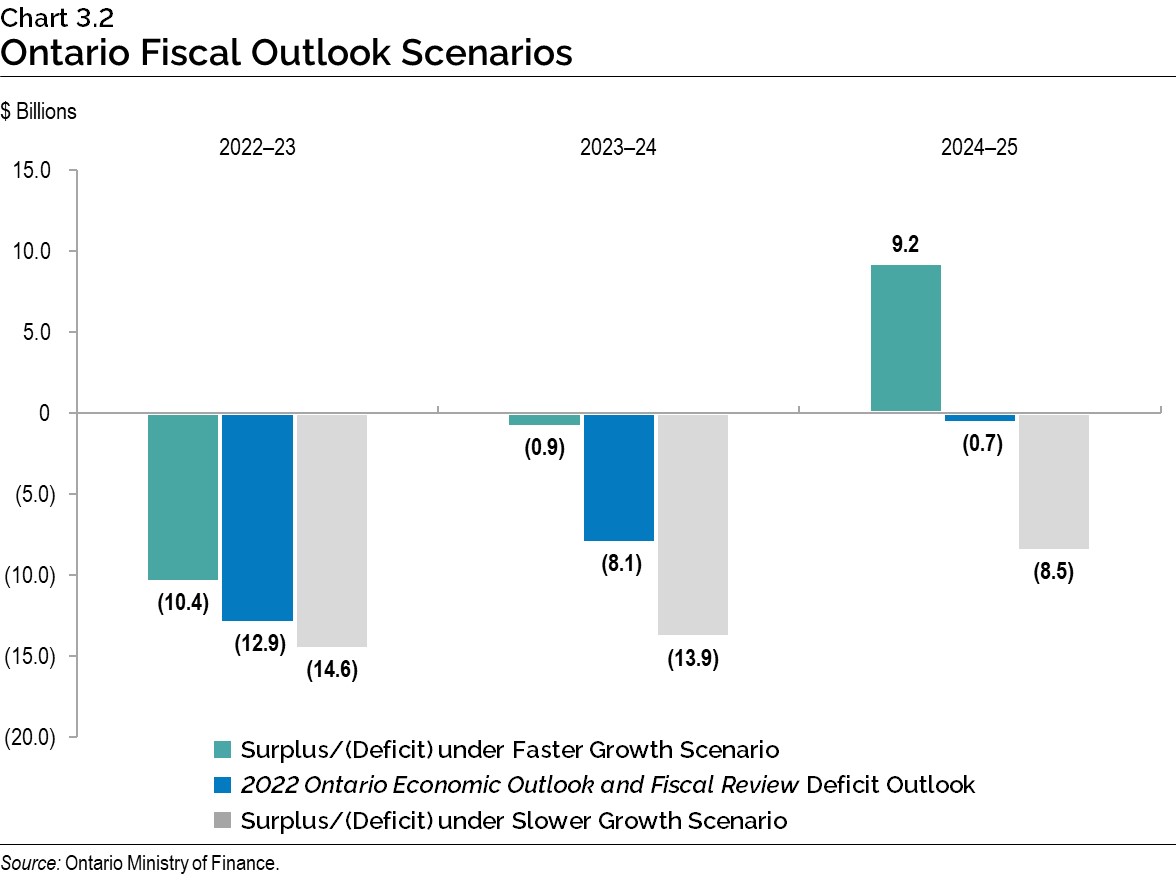
In these alternative outlook scenarios, program expenditures are assumed to be unchanged compared to the medium‐term expense outlook and only revenue and interest on debt are adjusted.
Medium-Term Expense Outlook
The total expense outlook is projected to grow from $198.8 billion in 2022–23 to $203.2 billion in 2024–25 as the government continues to invest in critical programs in health care, education, social services and skills training.
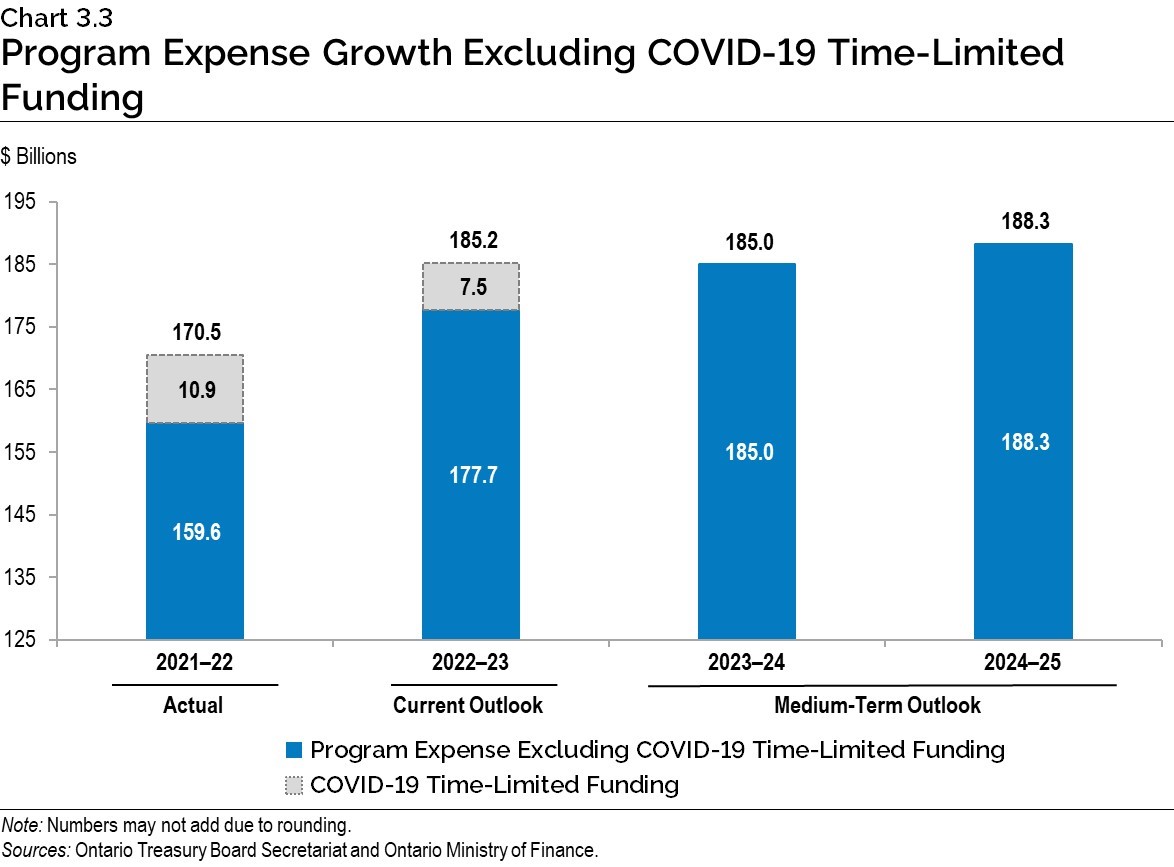
Ontario’s program expense outlook is projected to increase from $185.2 billion in 2022–23 to $188.3 billion in 2024–25 as COVID‑19 Time-Limited Funding of $7.5 billion is projected to be phased out by 2023–24. Base program expense is projected to increase by $10.6 billion over the same period.
| Actual 2021–22 |
Current Outlook 2022–23 |
Medium-Term Outlook 2023–24 |
Medium-Term Outlook 2024–25 |
|
|---|---|---|---|---|
| Base Programs1 — Health Sector | 69.6 | 75.2 | 77.8 | 78.3 |
| Base Programs2 — Education Sector3 | 28.8 | 32.4 | 34.2 | 35.1 |
| Base Programs4 — Postsecondary Education Sector | 10.5 | 10.8 | 11.2 | 11.4 |
| Base Programs5 — Children’s and Social Services Sector | 16.8 | 18.5 | 19.0 | 19.4 |
| Base Programs6 — Justice Sector | 4.7 | 5.3 | 5.1 | 5.1 |
| Base Programs7 — Other Programs | 29.2 | 35.5 | 37.6 | 38.9 |
| Total Base Programs | 159.6 | 177.7 | 185.0 | 188.3 |
| COVID‑19 Time-Limited Funding | 10.9 | 7.5 | – | – |
| Total Programs | 170.5 | 185.2 | 185.0 | 188.3 |
| Interest on Debt | 12.6 | 13.6 | 14.5 | 14.9 |
| Total Expense | 183.0 | 198.8 | 199.5 | 203.2 |
Table 3.7 footnotes:
[1], [2], [4], [5], [6], [7] For presentation purposes beginning in the 2021 Budget, one-time COVID‑19-related spending has been included within COVID‑19 Time-Limited Funding. The change in presentation does not impact ministry allocations or ministry structure(s) presented in the 2022–23 Expenditure Estimates.
[3] Excludes Teachers’ Pension Plan, which is included in Other Programs.
Note: Numbers may not add due to rounding.
Sources: Ontario Treasury Board Secretariat and Ontario Ministry of Finance.
The government has made substantial time-limited COVID‑19 investments, which are presented separately to transparently capture the temporary nature of these investments.
In addition to these temporary COVID‑19-related initiatives, the government is investing in critical public services and skills training as part of its plan to build a stronger Ontario. In 2022–23, base program expense is projected to increase by $18.1 billion compared to 2021–22, or 11.3 per cent, with an increase of $5.6 billion for health and $3.6 billion for education. Over the medium-term outlook, base program expense is projected to increase every year, growing at an average annual rate of 2.9 per cent from 2022–23 to 2024–25.
Highlights of changes to the program expense outlook over the medium term include the following:
- Base Health Sector expense is projected to increase from $75.2 billion in 2022–23 to $78.3 billion in 2024–25. The growth is primarily due to investments to:
- Expand home and community care services and improve quality of care;
- Support Ontario’s Long‐Term Care Staffing Plan, including an increase in the system-level average of daily direct care per resident to four hours by 2024–25;
- Implement a permanent wage enhancement to personal support workers who deliver publicly funded support services in home and community care, long-term care and hospitals; and
- Address growing demand for health care services.
- Base Education Sector expense is projected to increase from $32.4 billion in 2022–23 to $35.1 billion in 2024–25. Key investments include:
- Funding to support Ontario’s implementation of the Canada‐wide Early Learning and Child Care Agreement to increase access to high quality affordable child care, and put more money into parents’ pockets; and
- Funding to school boards to support student learning and success.
- Base Postsecondary Education Sector expense is projected to increase from $10.8 billion in 2022–23 to $11.4 billion in 2024–25. Key investments include:
- $142 million over three years to provide additional supports to postsecondary institutions delivering clinical education for nursing‐related programs and to expand medical school education;
- $61 million over three years for the Ontario Learn and Stay Grant to provide financial supports for approximately 2,500 eligible postsecondary students who enrol in priority programs such as Health Human Resources, in priority communities, and continue to work in underserved communities in the region where they studied after graduation; and
- Maintaining the financial sustainability of the Ontario Student Assistance Program (OSAP).
- Base Children’s and Social Services Sector expense is projected to increase from $18.5 billion in 2022–23 to $19.4 billion in 2024–25. Key investments include:
- $763 million over two years to annually adjust to inflation the core allowances for the Ontario Disability Support Program and the maximum monthly amount for the Assistance for Children with Severe Disabilities Program, starting in July 2023. This is in addition to the five per cent increase that took effect in September 2022. The government is also proposing to increase the amount that a person with a disability on the Ontario Disability Support Program can earn monthly without impacting the amount of support they receive. The monthly earnings exemption will change from $200 to $1,000.
- Base Justice Sector expense is projected to decrease from $5.3 billion in 2022–23 to $5.1 billion in 2024–25 primarily due to time-limited initiatives such as the Criminal Case Backlog Reduction Strategy, as well as revised implementation timelines for the Public Safety Radio Network project.
- Base Other Programs expense is projected to increase from $35.5 billion in 2022–23 to $38.9 billion in 2024–25. The changes over this period primarily reflect significant annual increases in the level of contingencies over the course of the outlook to reflect a cautious approach to planning as uncertainty increases over time. Other Programs spending has decreased since the 2022 Budget as a result of allocating funding from the Contingency Fund to key investments in various sectors, as part of the government’s flexible fiscal plan. Key Other Programs investments include:
- $2.8 billion over three years, beginning in 2022–23, as part of the government’s multi-year commitment to provide every community in Ontario with access to reliable high-speed internet by the end of 2025.
The total expense outlook includes Interest on Debt expense, which is projected to increase from $13.6 billion in 2022–23 to $14.9 billion in 2024–25, as a result of higher than projected interest rates since the 2022 Budget.
Prudence Built Into the Medium-Term Outlook
In keeping with sound fiscal practices, Ontario’s revenue outlook is based on prudent economic planning projections, as discussed in Chapter 2: Economic Performance and Outlook.
The government maintains a responsible and flexible fiscal plan to respond to uncertainty and risks. Ontario incorporates prudence in the form of a reserve to protect the fiscal outlook against unforeseen adverse changes in the province’s revenue and expense, including those resulting from changes in Ontario’s economic performance.
The reserve has been set at $1.5 billion in each of 2023–24 and 2024–25, unchanged from the 2022 Budget. In addition, standard Contingency Funds are maintained to help mitigate expense risks — for example, in cases where health and safety may be compromised, and which may otherwise adversely affect Ontario’s fiscal performance.
The government will work to preserve the fiscal flexibility necessary to respond to unforeseen events and support a long-term plan that will enhance transparency and accountability, invest in the future of Ontario, and help protect the province against potential economic challenges.
Transparency and Risks
The government is committed to being open and transparent about the state of Ontario’s finances. This principle is reflected in the Fiscal Sustainability, Transparency and Accountability Act, 2019, which stipulates that Ontario’s fiscal policy should be clearly articulated and information about it should be readily available to the public without charge.
While mid-year updates to the government’s finances are informed by the latest information available, key information still to be received over the remainder of the fiscal year may present further upside and downside risks, which could materially affect the fiscal outlook. Revenue could be affected by new information from the Canada Revenue Agency on tax return processing for previous taxation years, changes in the economic outlook and the evolution of private-sector economic forecasts which the province uses to develop its own revenue projections, while expenses could be impacted by changes in utilization of large demand-driven programs.
To ensure a reasonable and prudent economic forecast, the government’s key economic planning projections are set below the average of private‐sector forecasts in each year. For 2022, the planning assumptions are set 0.4 percentage points below the private‐sector average to reflect the elevated degree of uncertainty for this year.
While the planning assumptions for economic growth are reasonable and prudent, the Ontario Ministry of Finance has also developed Faster Growth and Slower Growth scenarios to provide greater transparency around Ontario’s economic outlook amid heightened economic uncertainty.
As a matter of transparent fiscal management, financial pressures are monitored throughout the fiscal year by the Ontario Treasury Board Secretariat, with the goal of ensuring that robust and prudent methodologies are used to develop forecasts. Other important risk management tools include closely tracking the pace of implementation of initiatives and proactively identifying emerging program and policy risks. Comprehensive analysis of known pressures informs the fiscal planning processes, including the development of plans to mitigate and manage fiscal pressures, as well as maintaining adequate contingencies as part of the medium-term fiscal projections in respect of the government’s flexible fiscal plan to respond to uncertainty and risks.
Effective federal–provincial fiscal transfers are a key factor in Ontario's long-term fiscal sustainability. Canada and Ontario worked well together to respond to COVID‑19, ensuring federal funding was timely and responsive to provincial needs. Over the next year, Ontario will be engaging with the federal government on a number of significant federal–provincial transfer agreements from health, to training, to infrastructure. As Canada emerges from the COVID‑19 pandemic there is an opportunity to focus on long-term arrangements, in order to create a principle-based transfer system, with agreements that are flexible, adequate, fair and respect provincial jurisdiction. Notably, this includes the Canada Health Transfer. Ontario is looking forward to working with provinces, territories and the federal government to secure an enhanced partnership that helps address the pressures facing the health system now, and provides a foundation for adequate long‑term funding.
In addition to the key demand sensitivities and economic risks to the fiscal plan, there are risks stemming from the government’s contingent liabilities. Whether future events will result in actual liabilities for the province is beyond the direct control of the government. For example, losses could result from legal settlements or a call on loan or funding guarantees. While a Contingency Fund is included in the fiscal plan to help mitigate the expense risks, until there exists certainty around the likelihood and costs of these future events, these risks are not included in the province’s fiscal plan. Provisions for losses that are likely to occur and can be reasonably estimated are expensed and reported as liabilities in Ontario’s financial statements. Any significant contingent liabilities related to the 2021–22 fiscal year have been disclosed as part of the Public Accounts of Ontario 2021–2022, released in September.
Details of Ontario’s Finances
| Actual 2019–20 |
Actual 2020–21 |
Actual 2021–22 |
Current Outlook 2022–23 |
|
|---|---|---|---|---|
| Taxation Revenue — Personal Income Tax | 37,743 | 40,333 | 46,750 | 50,338 |
| Taxation Revenue — Sales Taxes | 28,619 | 26,576 | 30,357 | 32,438 |
| Taxation Revenue — Corporations Tax | 15,414 | 17,775 | 25,227 | 22,665 |
| Taxation Revenue — Education Property Tax | 6,179 | 6,040 | 5,713 | 5,652 |
| Taxation Revenue — Employer Health Tax | 6,731 | 6,537 | 7,223 | 7,846 |
| Taxation Revenue — Ontario Health Premium | 4,059 | 4,330 | 4,414 | 4,715 |
| Taxation Revenue — Gasoline Tax | 2,783 | 1,898 | 2,202 | 1,740 |
| Taxation Revenue — Land Transfer Tax | 3,067 | 3,698 | 5,827 | 4,385 |
| Taxation Revenue — Tobacco Tax | 1,118 | 1,099 | 927 | 890 |
| Taxation Revenue — Fuel Tax | 807 | 686 | 771 | 608 |
| Taxation Revenue — Beer, Wine and Spirits Taxes | 582 | 624 | 624 | 612 |
| Taxation Revenue — Electricity Payments in Lieu of Taxes | 505 | 563 | 666 | 511 |
| Taxation Revenue — Ontario Portion of the Federal Cannabis Excise Duty | 48 | 106 | 215 | 215 |
| Taxation Revenue — Other Taxes | 623 | 619 | 759 | 799 |
| Taxation Revenue — Total | 108,278 | 110,884 | 131,675 | 133,414 |
| Government of Canada — Canada Health Transfer | 15,640 | 16,206 | 16,731 | 17,560 |
| Government of Canada — Canada Social Transfer | 5,650 | 5,815 | 6,003 | 6,191 |
| Government of Canada — Equalization | – | – | – | – |
| Government of Canada — Infrastructure Programs | 400 | 769 | 562 | 1,239 |
| Government of Canada — Labour Market Programs | 1,054 | 1,323 | 1,476 | 1,128 |
| Government of Canada — Social Housing Agreement | 484 | 338 | 305 | 263 |
| Government of Canada — Other Federal Payments | 1,756 | 9,014 | 5,091 | 4,183 |
| Government of Canada — Direct Transfers to Broader Public Sector Organizations | 414 | 459 | 439 | 479 |
| Government of Canada — Total | 25,398 | 33,924 | 30,607 | 31,043 |
| Income from Government Business Enterprises — Liquor Control Board of Ontario | 2,402 | 2,539 | 2,543 | 2,520 |
| Income from Government Business Enterprises — Ontario Power Generation Inc./Hydro One Ltd. | 1,167 | 2,044 | 2,151 | 1,186 |
| Income from Government Business Enterprises — Ontario Lottery and Gaming Corporation | 2,309 | 359 | 1,561 | 2,373 |
| Income from Government Business Enterprises — Ontario Cannabis Store | 19 | 67 | 186 | 180 |
| Income from Government Business Enterprises — Total | 5,897 | 5,009 | 6,441 | 6,259 |
| Other Non-Tax Revenue — Fees, Donations and Other Revenues from Hospitals, School Boards and Colleges | 9,281 | 7,790 | 9,688 | 9,365 |
| Other Non-Tax Revenue — Vehicle and Driver Registration Fees1 | 2,055 | 1,952 | 33 | 1,034 |
| Other Non-Tax Revenue — Miscellaneous Other Non-Tax Revenue | 1,222 | 1,857 | 2,625 | 1,169 |
| Other Non-Tax Revenue — Other Fees and Licences | 1,156 | 1,017 | 1,174 | 1,211 |
| Other Non-Tax Revenue — Sales and Rentals | 1,369 | 680 | 1,046 | 1,939 |
| Other Non-Tax Revenue — Reimbursements | 1,005 | 1,277 | 1,233 | 1,039 |
| Other Non-Tax Revenue — Royalties | 283 | 359 | 468 | 307 |
| Other Non-Tax Revenue — Power Supply Contract Recoveries | 122 | 116 | 67 | 42 |
| Other Non-Tax Revenue — Net Reduction of Power Purchase Contracts | 30 | 28 | 5 | – |
| Other Non-Tax Revenue — Total | 16,523 | 15,076 | 16,339 | 16,106 |
| Total Revenue | 156,096 | 164,893 | 185,062 | 186,821 |
Table 3.8 footnotes:
[1] Vehicle and Driver Registration Fees in 2021–22 reflects the elimination and rebate of eligible licence plate renewal fees paid since March 1, 2020.
Note: Numbers may not add due to rounding.
Source: Ontario Ministry of Finance.
| Ministry Expense | Actual 2019–20 |
Actual 2020–21 |
Actual 2021–22 |
Current Outlook 2022–23 |
|---|---|---|---|---|
| Agriculture, Food and Rural Affairs (Base) | 297 | 289 | 284 | 331.3 |
| Agriculture, Food and Rural Affairs — Federal–Provincial Infrastructure Programs2 | 94 | – | – | – |
| Agriculture, Food and Rural Affairs — Municipal Infrastructure Program Investments3 | 222 | – | – | – |
| Agriculture, Food and Rural Affairs — Demand-Driven Risk Management and Time-Limited Programs4 | 518 | 458 | 358 | 439.3 |
| Agriculture, Food and Rural Affairs — COVID‑19 Time-Limited Funding5 | – | 41 | 32 | 47.6 |
| Agriculture, Food and Rural Affairs (Total) | 1,130 | 788 | 674 | 818.1 |
| Attorney General (Base) | 1,684 | 1,524 | 1,623 | 1,783.7 |
| Attorney General — Statutory Appropriations — Crown Liability and Proceedings Act, 2019 | 192 | 60 | 49 | – |
| Attorney General — One-Time Accounting Adjustment for the Victim Fine Surcharges Program | – | 196 | – | – |
| Attorney General — COVID‑19 Time-Limited Funding6 | – | 71 | 145 | 52.0 |
| Attorney General (Total) | 1,876 | 1,851 | 1,817 | 1,835.7 |
| Board of Internal Economy (Base) | 257 | 248 | 283 | 278.2 |
| Board of Internal Economy — Provision for the Costs of General Election | – | – | – | 100.0 |
| Board of Internal Economy — COVID‑19 Time-Limited Funding7 | – | 0 | 2 | – |
| Board of Internal Economy (Total) | 257 | 248 | 284 | 378.2 |
| Children, Community and Social Services (Base) | 17,066 | 17,026 | 16,810 | 18,472.8 |
| Children, Community and Social Services — COVID‑19 Time-Limited Funding8 | – | 440 | 293 | 23.0 |
| Children, Community and Social Services (Total) | 17,066 | 17,466 | 17,104 | 18,495.8 |
| Citizenship and Multiculturalism (Base) | 11 | 14 | 24 | 52.6 |
| Citizenship and Multiculturalism — COVID‑19 Time-Limited Funding9 | – | – | 3 | 3.7 |
| Citizenship and Multiculturalism (Total) | 11 | 14 | 27 | 56.3 |
| Colleges and Universities (Base) | 9,220 | 8,767 | 9,539 | 9,439.4 |
| Colleges and Universities — Student Financial Assistance | 1,296 | 766 | 954 | 1,333.0 |
| Colleges and Universities — Time-Limited Infrastructure Funding Under the Strategic Investment Fund | 2 | – | – | – |
| Colleges and Universities — COVID‑19 Time-Limited Funding10 | – | 292 | 117 | 10.7 |
| Colleges and Universities (Total) | 10,519 | 9,826 | 10,610 | 10,783.1 |
| Economic Development, Job Creation and Trade (Base) | 315 | 391 | 474 | 429.8 |
| Economic Development, Job Creation and Trade — Time-Limited Investments | 263 | 187 | 157 | 647.7 |
| Economic Development, Job Creation and Trade — Bad Debt Expense | – | 211 | – | – |
| Economic Development, Job Creation and Trade — COVID‑19 Time-Limited Funding11 | – | 3,106 | 360 | 96.0 |
| Economic Development, Job Creation and Trade (Total) | 579 | 3,896 | 991 | 1,173.4 |
| Education (Base) | 30,177 | 28,390 | 28,837 | 32,439.0 |
| Education — Teachers’ Pension Plan | 1,570 | 1,607 | 1,610 | 1,630.0 |
| Education — COVID‑19 Time-Limited Funding12 | – | 2,885 | 1,060 | 968.6 |
| Education (Total) | 31,748 | 32,881 | 31,507 | 35,037.7 |
| Energy (Base)13 | 410 | 229 | 240 | 327.6 |
| Energy — Electricity Cost-Relief Programs | 5,484 | 5,539 | 6,313 | 6,273.7 |
| Energy — COVID‑19 Time-Limited Funding14 | – | 906 | 274 | – |
| Energy (Total) | 5,894 | 6,674 | 6,827 | 6,601.3 |
| Environment, Conservation and Parks (Base) | 612 | 632 | 688 | 711.9 |
| Environment, Conservation and Parks — Time-Limited Investments | 2 | – | – | – |
| Environment, Conservation and Parks — COVID‑19 Time-Limited Funding15 | – | 3 | 16 | 24.7 |
| Environment, Conservation and Parks (Total) | 614 | 636 | 704 | 736.6 |
| Executive Offices (Base) | 33 | 33 | 42 | 48.3 |
| Executive Offices — Time-Limited Assistance | – | 2 | – | – |
| Executive Offices — COVID‑19 Time-Limited Funding16 | – | 6 | 2 | – |
| Executive Offices (Total) | 33 | 41 | 44 | 48.3 |
| Finance (Base) | 819 | 739 | 799 | 978.1 |
| Finance — Investment Management Corporation of Ontario17 | 88 | 128 | 210 | 221.9 |
| Finance — Ontario Municipal Partnership Fund | 503 | 502 | 502 | 501.9 |
| Finance — Power Supply Contract Costs | 122 | 116 | 67 | 42.3 |
| Finance — Time-Limited COVID‑19 Fund18 | – | – | – | – |
| Finance — COVID‑19 Time-Limited Funding19 | – | 440 | 231 | – |
| Finance (Total) | 1,532 | 1,924 | 1,808 | 1,744.2 |
| Francophone Affairs (Base) | 5 | 5 | 7 | 7.4 |
| Francophone Affairs — Time-Limited Investments | – | – | – | 0.6 |
| Francophone Affairs — COVID‑19 Time-Limited Funding20 | – | 1 | 2 | – |
| Francophone Affairs (Total) | 5 | 6 | 9 | 7.9 |
| Government and Consumer Services (Base) | 677 | 623 | 692 | 835.8 |
| Government and Consumer Services — Realty | 924 | 1,099 | 1,156 | 1,184.5 |
| Government and Consumer Services — COVID‑19 Time-Limited Funding21 | – | 423 | 151 | 89.2 |
| Government and Consumer Services (Total) | 1,601 | 2,145 | 2,000 | 2,109.6 |
| Health (Total)22 | 59,293 | 59,879 | 64,270 | 68,414.4 |
| COVID‑19 Health Response23 | – | 5,082 | 6,167 | 4,739.6 |
| Heritage, Sport, Tourism and Culture Industries (Base) | 904 | 717 | 885 | 899.8 |
| Heritage, Sport, Tourism and Culture Industries — Ontario Cultural Media Tax Credits | 656 | 512 | 693 | 819.2 |
| Heritage, Sport, Tourism and Culture Industries — Ontario Cultural Media Tax Credits — Amounts Related to Prior Years | 80 | 65 | 84 | – |
| Heritage, Sport, Tourism and Culture Industries — COVID‑19 Time-Limited Funding24 | – | 120 | 257 | 200.0 |
| Heritage, Sport, Tourism and Culture Industries (Total) | 1,640 | 1,413 | 1,919 | 1,919.1 |
| Indigenous Affairs (Base) | 71 | 64 | 85 | 118.3 |
| Indigenous Affairs — One-Time Investments including Settlements | 16 | 149 | 152 | – |
| Indigenous Affairs — COVID‑19 Time-Limited Funding25 | – | 42 | 4 | – |
| Indigenous Affairs (Total) | 86 | 256 | 241 | 118.3 |
| Infrastructure (Base) | 81 | 154 | 177 | 981.5 |
| Infrastructure — Federal–Provincial Infrastructure Programs26 | 160 | 227 | 309 | 717.4 |
| Infrastructure — Waterfront Toronto Revitalization (Port Lands Flood Protection) | 116 | 103 | 156 | 25.0 |
| Infrastructure — Municipal Infrastructure Program Investments27 | – | 197 | 399 | 398.4 |
| Infrastructure — COVID‑19 Time-Limited Funding28 | – | 0 | 0 | – |
| Infrastructure (Total) | 358 | 682 | 1,041 | 2,122.3 |
| Labour, Training and Skills Development (Base) | 159 | 170 | 103 | 301.7 |
| Labour, Training and Skills Development — Training Tax Credits (Co-operative Education and Apprenticeship Training)29 | 152 | 98 | 105 | 92.0 |
| Labour, Training and Skills Development — Demand-Driven Employment and Training Programs | 922 | 1,142 | 923 | 1,156.6 |
| Labour, Training and Skills Development — COVID‑19 Time-Limited Funding30 | – | 33 | 794 | 469.0 |
| Labour, Training and Skills Development (Total) | 1,232 | 1,443 | 1,925 | 2,019.2 |
| Long-Term Care (Total)31 | 4,423 | 4,513 | 5,300 | 6,750.9 |
| Municipal Affairs and Housing (Base) | 540 | 485 | 486 | 562.4 |
| Municipal Affairs and Housing — Time-Limited Investments | 317 | 224 | 351 | 414.5 |
| Municipal Affairs and Housing — Social Housing Agreement — Payments to Service Managers32 | 341 | 313 | 281 | 210.3 |
| Municipal Affairs and Housing — COVID‑19 Time-Limited Funding33 | – | 2,707 | 330 | 156.3 |
| Municipal Affairs and Housing (Total) | 1,197 | 3,729 | 1,447 | 1,343.5 |
| Northern Development, Mines, Natural Resources and Forestry (Base)34 | 1,219 | 1,176 | 1,349 | 1,439.4 |
| Northern Development, Mines, Natural Resources and Forestry — Accounting Adjustments for Landfills/Contaminated Sites | – | 202 | 183 | – |
| Northern Development, Mines, Natural Resources and Forestry — Emergency Forest Firefighting | 136 | 115 | 237 | 100.0 |
| Northern Development, Mines, Natural Resources and Forestry — COVID‑19 Time-Limited Funding35 | – | 13 | 53 | – |
| Northern Development, Mines, Natural Resources and Forestry (Total) | 1,355 | 1,506 | 1,823 | 1,539.3 |
| Seniors and Accessibility (Base) | 63 | 65 | 83 | 203.1 |
| Seniors and Accessibility — Time-Limited Investments | – | – | – | 0.8 |
| Seniors and Accessibility — COVID‑19 Time-Limited Funding36 | – | 151 | 43 | 40.5 |
| Seniors and Accessibility (Total) | 63 | 216 | 127 | 244.4 |
| Solicitor General (Base) | 2,759 | 2,820 | 3,005 | 3,516.4 |
| Solicitor General — COVID‑19 Time-Limited Funding37 | – | 94 | 150 | 1.8 |
| Solicitor General (Total) | 2,759 | 2,914 | 3,155 | 3,518.2 |
| Transportation (Base)38 | 4,950 | 4,668 | 5,190 | 5,888.2 |
| Transportation — Federal–Provincial Infrastructure Programs | 188 | 449 | 231 | 720.7 |
| Transportation — COVID‑19 Time-Limited Funding39 | – | 2,188 | 369 | 585.0 |
| Transportation (Total) | 5,138 | 7,306 | 5,790 | 7,194.0 |
| Treasury Board Secretariat (Base) | 199 | 201 | 207 | 335.2 |
| Treasury Board Secretariat — Employee and Pensioner Benefits | 1,665 | 1,485 | 2,633 | 1,590.1 |
| Treasury Board Secretariat — Operating Contingency Fund | – | – | – | 3,263.8 |
| Treasury Board Secretariat — Capital Contingency Fund | – | – | – | 224.2 |
| Treasury Board Secretariat — COVID‑19 Time-Limited Funding40 | – | 3 | 2 | – |
| Treasury Board Secretariat (Total) | 1,864 | 1,689 | 2,842 | 5,413.3 |
| Interest on Debt41 | 12,495 | 12,274 | 12,558 | 13,605.0 |
| Total Expense | 164,768 | 181,297 | 183,011 | 198,767.7 |
Table 3.9 footnotes:
[1] The ministry structures have been retained from the 2022 Budget. The new government structure, reflecting the announcement of the Executive Council on June 24, 2022, will be reflected in future publications.
[2], [3], [26], [27] Municipal and Federal–Provincial Infrastructure Program delivery transferred from the Ontario Ministry of Agriculture, Food and Rural Affairs to the Ontario Ministry of Infrastructure in 2020–21.
[4] The 2019–20 amount includes an extraordinary production insurance payout of $175 million above annual forecast due to 2019 crop conditions.
[5], [6], [7], [8], [9], [10], [11], [12], [14], [15], [16], [18], [19], [20], [21], [24], [25], [28], [30], [33], [35], [36], [37], [39], [40] In the 2022 Budget, the government made available COVID‐19 Time‐Limited Funding. This funding continues to be presented separately in order to transparently capture the temporary nature of these investments.
[13], [34], [38] Ontario Northland Transportation Commission was transferred from the Ontario Ministry of Energy, Northern Development and Mines to the Ontario Ministry of Transportation beginning in 2020–21.
[17] Based on the requirements of Public Sector Accounting Standards, the government consolidates the Investment Management Corporation of Ontario into the Ontario Ministry of Finance.
[22] Includes accounting adjustments tied primarily to grants provided for infrastructure projects and other related investments.
[23] For presentation purposes in the 2022 Ontario Economic Outlook and Fiscal Review, time-limited COVID‑19-related spending has been included separately instead of within the Ministry of Health and Ministry of Long-Term Care. This change in presentation does not impact ministry allocations, which reflect the ministry structure(s) presented in the Public Accounts of Ontario 2021–2022 and the 2022–23 Expenditure Estimates.
[29] The Co-operative Education Tax Credit remains in effect. The Apprenticeship Training Tax Credit is eliminated for eligible apprenticeship programs that commenced on or after November 15, 2017. Amounts from 2019–20 to 2021–22 include tax credit amounts related to prior years.
[31] The Ontario Ministry of Long-Term Care total includes expenses incurred by Ontario Health for funding for long-term care. These amounts will be consolidated in the total expense of the Ontario Ministry of Health, including $4.5 billion for 2021–22 and $4.7 billion in 2022–23.
[32] The annual decline from 2019–20 to 2022–23 is mainly due to declining federal obligations, such as maturing mortgages, under the Social Housing Agreement.
[41] Interest on debt is net of interest capitalized during construction of tangible capital assets of $245 million in 2019–20, $230 million in 2020–21, $321 million in 2021–22, and $401 million in 2022–23.
Note: Numbers may not add due to rounding.
Sources: Ontario Treasury Board Secretariat and Ontario Ministry of Finance.
| Sector | Total Infrastructure Expenditures 2021–22 Actual1 |
2022–23 Current Outlook: Investment in Capital Assets2, 3 |
2022–23 Current Outlook: Transfers and Other Infrastructure Expenditures4 |
2022–23 Current Outlook: Total Infrastructure Expenditures |
|---|---|---|---|---|
| Transportation — Transit | 6,053 | 6,767 | 1,415 | 8,183 |
| Transportation — Provincial Highways | 2,624 | 2,778 | 240 | 3,018 |
| Transportation — Other Transportation, Property and Planning | 236 | 142 | 77 | 219 |
| Health — Hospitals | 2,937 | 3,022 | 3 | 3,025 |
| Health — Other Health | 243 | 53 | 162 | 215 |
| Education | 2,420 | 2,922 | 15 | 2,938 |
| Postsecondary Education — Colleges and Other | 494 | 395 | 75 | 470 |
| Postsecondary Education — Universities | 119 | – | 135 | 135 |
| Social | 361 | 20 | 299 | 319 |
| Justice | 452 | 822 | 26 | 847 |
| Other Sectors5 | 1,760 | 993 | 2,286 | 3,279 |
| Total Infrastructure Expenditures | 17,700 | 17,914 | 4,733 | 22,647 |
| Less: Other Partner Funding6 | 2,606 | 2,611 | – | 2,611 |
| Total7 | 15,094 | 15,303 | 4,733 | 20,035 |
Table 3.10 footnotes:
[1] Includes adjustments for the net book value of assets disposed during the year, as well as changes in valuation.
[2] Includes provincial investment in capital assets of $13.4 billion.
[3] Includes $401 million in interest capitalized during construction.
[4] Includes transfers to municipalities, universities and non-consolidated agencies.
[5] Includes broadband infrastructure, government administration, natural resources, and the culture and tourism industries.
[6] Other Partner Funding refers to third-party investments primarily in hospitals, colleges and schools.
[7] Includes Federal–Municipal contributions to provincial infrastructure investments.
Note: Numbers may not add due to rounding.
Source: Ontario Treasury Board Secretariat.
| 2013–14 | 2014–15 | 2015–16 | 2016–17 | 2017–18 | 2018–19 | 2019–20 | 2020–21 | Actual 2021–22 |
Current Outlook 2022–23 |
|
|---|---|---|---|---|---|---|---|---|---|---|
| Revenue | 122,955 | 126,152 | 136,148 | 140,734 | 150,594 | 153,700 | 156,096 | 164,893 | 185,062 | 186,821 |
| Expense — Programs | 123,330 | 126,199 | 129,905 | 131,460 | 142,363 | 148,751 | 152,273 | 169,023 | 170,453 | 185,163 |
| Expense — Interest on Debt3 | 11,155 | 11,221 | 11,589 | 11,709 | 11,903 | 12,384 | 12,495 | 12,274 | 12,558 | 13,605 |
| Total Expense | 134,485 | 137,420 | 141,494 | 143,169 | 154,266 | 161,135 | 164,768 | 181,297 | 183,011 | 198,768 |
| Reserve | – | – | – | – | – | – | – | – | – | 1,000 |
| Surplus/(Deficit) | (11,530) | (11,268) | (5,346) | (2,435) | (3,672) | (7,435) | (8,672) | (16,404) | 2,051 | (12,946) |
| Net Debt | 276,169 | 294,557 | 306,357 | 314,077 | 323,834 | 338,496 | 353,332 | 373,564 | 380,415 | 407,231 |
| Accumulated Deficit | 184,835 | 196,665 | 203,014 | 205,939 | 209,023 | 216,642 | 225,764 | 239,294 | 236,857 | 253,539 |
| Gross Domestic Product (GDP) at Market Prices | 696,192 | 727,042 | 760,435 | 790,749 | 824,979 | 860,104 | 892,226 | 866,940 | 970,041 | 1,059,684 |
| Primary Household Income | 473,807 | 490,423 | 512,570 | 520,486 | 541,501 | 567,484 | 592,605 | 590,677 | 638,541 | 691,806 |
| Population (000s) — July4 | 13,511 | 13,618 | 13,707 | 13,875 | 14,070 | 14,309 | 14,545 | 14,726 | 14,809 | 15,109 |
| Net Debt per Capita (dollars) | 20,441 | 21,631 | 22,350 | 22,636 | 23,016 | 23,657 | 24,293 | 25,368 | 25,688 | 26,952 |
| Household Income per Capita (dollars) | 35,069 | 36,014 | 37,394 | 37,511 | 38,486 | 39,660 | 40,744 | 40,111 | 43,118 | 45,786 |
| Net Debt as a Per Cent of Revenue | 224.6% | 233.5% | 225.0% | 223.2% | 215.0% | 220.2% | 226.4% | 226.5% | 205.6% | 218.0% |
| Interest on Debt as a Per Cent of Revenue | 9.1% | 8.9% | 8.5% | 8.3% | 7.9% | 8.1% | 8.0% | 7.4% | 6.8% | 7.3% |
| Net Debt as a Per Cent of GDP | 39.7% | 40.5% | 40.3% | 39.7% | 39.3% | 39.4% | 39.6% | 43.1% | 39.2% | 38.4% |
| Accumulated Deficit as a Per Cent of GDP | 26.5% | 27.1% | 26.7% | 26.0% | 25.3% | 25.2% | 25.3% | 27.6% | 24.4% | 23.9% |
Table 3.11 footnotes:
[1] Amounts reflect a change in pension expense that was calculated based on recommendations of the Independent Financial Commission of Inquiry, as described in Note 19 to the Consolidated Financial Statements, in Public Accounts of Ontario 2017–2018. Amounts for net debt and accumulated deficit also reflect this change.
[2] Revenues and expenses have been restated to reflect the change in presentation of third-party revenue for hospitals, school boards and colleges to be reported as revenue.This restatement is fiscally neutral.
[3] Interest on debt is net of interest capitalized during construction of tangible capital assets of $245 million in 2019–20, $230 million in 2020–21, $321 million in 2021–22, and $401 million in 2022–23.
[4] Population figures are for July 1 of the fiscal year indicated (i.e., for 2018–19, the population on July 1, 2018, is shown).
Note: Numbers may not add due to rounding.
Sources: Statistics Canada, Ontario Treasury Board Secretariat and Ontario Ministry of Finance.
Chart Descriptions
Chart 3.1: Current Deficit Outlook Compared to2022 Budget
The bar chart illustrates the deficit outlook presented in the 2022 Budget compared to the current outlook in the 2022 Ontario Economic Outlook and Fiscal Review. The 2022 Budget projected deficits of $19.9 billion in 2022–23, $12.3 billion in 2023–24, and $7.6 billion in 2024–25. With the release of the 2022 Ontario Economic Outlook and Fiscal Review the deficit projections have been revised to $12.9 billion in 2022–23, $8.1 billion in 2023–24, and $0.7 billion in 2024–25.
Source: Ontario Ministry of Finance.
Chart 3.2: Ontario Fiscal Outlook Scenarios
The bar chart illustrates the range of Ontario deficit outlooks based on the two alternative economic scenarios presented in Chapter 2: Economic Performance and Outlook. The 2022 Ontario Economic Outlook and Fiscal Review deficit outlook estimates the deficit to be $12.9 billion in 2022–23, $8.1 billion in 2023–24 and $0.7 billion in 2024–25. Under the Faster Growth scenario, the deficit is estimated to be a deficit of $10.4 billion in 2022–23, $0.9 billion in 2023–24, and reach a surplus of $9.2 billion in 2024–25. Under the Slower Growth scenario, the deficit is estimated to be $14.6 billion in 2022–23, $13.9 billion in 2023–24 and $8.5 billion in 2024–25.
Source: Ontario Ministry of Finance.
Chart 3.3: Program Expense Growth Excluding COVID‑19 Time-Limited Funding
The bar chart illustrates the growth in program expense excluding COVID‑19 Time-Limited Funding. For 2021–22, COVID‑19 Time-Limited Funding is $10.9 billion while base program expense is $159.6 billion. For 2022–23, COVID‑19 Time-Limited Funding is projected to be $7.5 billion while base program expense is projected to be $177.7 billion. In 2023–24 and 2024–25, COVID‑19 Time-Limited Funding is projected to be phased out while base program expense is projected to be $185.0 billion and $188.3 billion, respectively.
Total program expense was $170.5 billion in 2021–22 and is projected to be $185.2 billion in 2022–23, $185.0 billion in 2023–24 and $188.3 billion in 2024–25.
Note: Numbers may not add due to rounding.
Sources: Ontario Treasury Board Secretariat and Ontario Ministry of Finance.
Chart 3.4: Composition of Revenue, 2022–23
The pie chart shows the composition of Ontario’s revenue in 2022–23, which is projected to be $186.8 billion. The largest taxation revenue source is Personal Income Tax revenue at $50.3 billion, accounting for 26.9 per cent of total revenue. This is followed by Sales Tax at $32.4 billion, or 17.4 per cent of total revenue; and Corporations Tax at $22.7 billion, or 12.1 per cent of total revenue. Other components of taxation revenue include Education Property Tax at $5.7 billion, or 3.0 per cent of total revenue; Employer Health Tax at $7.8 billion, or 4.2 per cent; Gasoline Tax and Fuel Tax at $2.3 billion, or 1.3 per cent; the Ontario Health Premium at $4.7 billion, or 2.5 per cent; and Other Taxes at $7.4 billion, or 4.0 per cent of total revenue.
Total taxation revenue accounts for $133.4 billion, or 71.4 per cent of total revenue.
The other major non-taxation sources of revenue are Federal Transfers at $31.0 billion, or 16.6 per cent of total revenue; Income from Government Business Enterprises at $6.3 billion, or 3.4 per cent of total revenue; and various Other Non-Tax Revenue at $16.1 billion, or 8.6 per cent of total revenue.
Note: Numbers may not add due to rounding.
Source: Ontario Ministry of Finance.
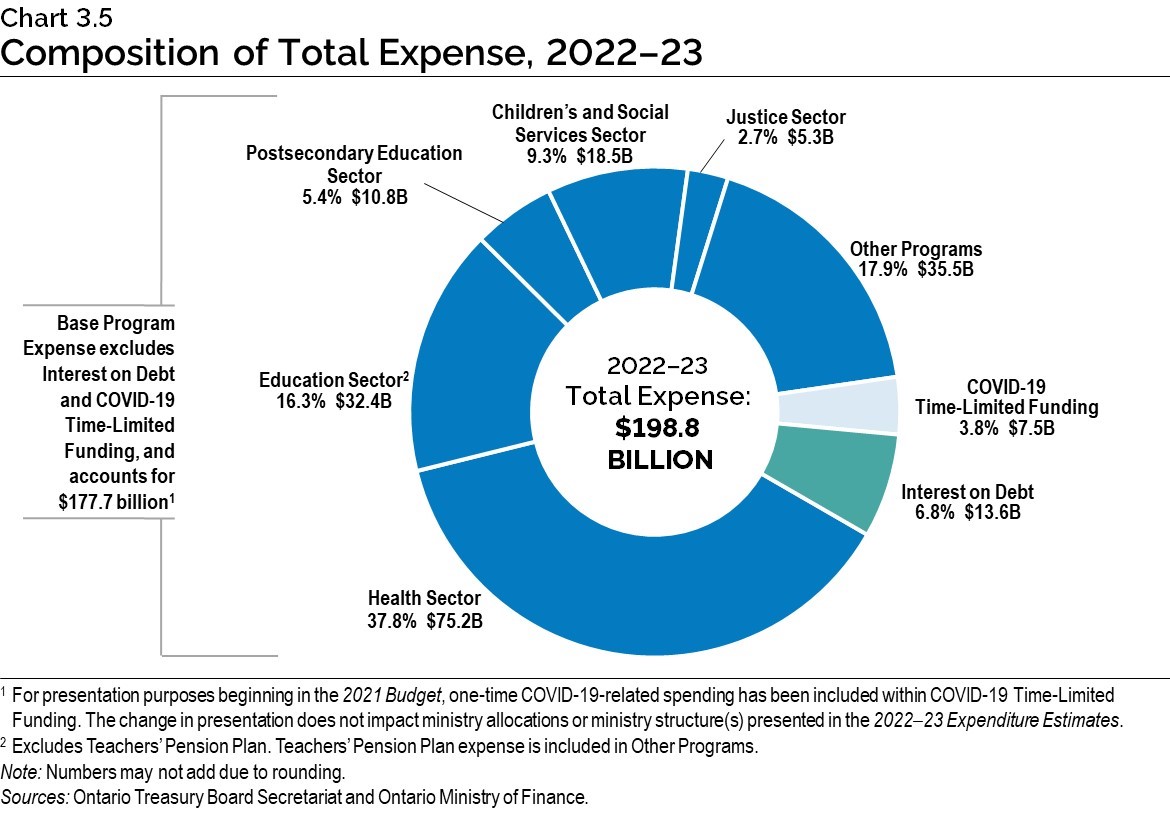
Chart 3.5: Composition of Total Expense, 2022–23
The pie chart shows the share of Ontario’s total expense and dollar amounts by sector in 2022–23.
Total expense in 2022–23 is projected to be $198.8 billion.
Base Program Expense excludes Interest on Debt and COVID 19 Time-Limited Funding, and accounts for $177.7 billion.1
The largest expense is the Health Sector at $75.2 billion, accounting for 37.8 per cent of total expense.
The remaining sectors of total expense include the Education Sector2 at $32.4 billion or 16.3 per cent; the Postsecondary Education Sector at $10.8 billion or 5.4 per cent; the Children’s and Social Services Sector at $18.5 billion or 9.3 per cent; the Justice Sector at $5.3 billion or 2.7 per cent; Other Programs at $35.5 billion or 17.9 per cent; and COVID‑19 Time-Limited Funding at $7.5 billion or 3.8 per cent. Interest on Debt, included as part of Total Expense, is $13.6 billion or 6.8 per cent.
[1] For presentation purposes beginning in the 2021 Budget, one-time COVID‑19 related spending has been included within COVID‑19 Time-Limited Funding. The change in presentation does not impact ministry allocations or ministry structure(s) to be presented in the 2022–23 Expenditure Estimates.
[2] Excludes the Teachers’ Pension Plan. Teachers’ Pension Plan expense is included in Other Programs.
Note: Numbers may not add due to rounding.
Sources: Ontario Treasury Board Secretariat and Ontario Ministry of Finance.