Introduction
Ontario’s economy has remained resilient and continued to grow in 2022 despite ongoing economic uncertainty. Ontario’s employment gains were robust in 2022, and the unemployment rate remains near historic lows.
Like the rest of the world, Ontario will be affected by short-term and long-term trends in the global economy, including geopolitical tensions such as Russia’s war in Ukraine, the reopening of China’s economy, the energy transition, and policies such as the United States’ Inflation Reduction Act.
Ontario’s real gross domestic product (GDP) is projected to increase by 0.2 per cent in 2023, 1.3 per cent in 2024, 2.5 per cent in 2025 and 2.4 per cent in 2026. For the purposes of prudent fiscal planning, these projections are slightly below the average of private-sector forecasts.
| 2021 | 2022 | 2023p | 2024p | 2025p | 2026p | |
|---|---|---|---|---|---|---|
| Real GDP Growth | 5.2 | 3.7e | 0.2 | 1.3 | 2.5 | 2.4 |
| Nominal GDP Growth | 10.3 | 9.4e | 2.8 | 3.6 | 4.6 | 4.5 |
| Employment Growth | 5.2 | 4.6 | 0.5 | 1.0 | 1.7 | 1.7 |
| CPI Inflation | 3.5 | 6.8 | 3.6 | 2.1 | 2.0 | 2.0 |
Table 2.1 footnotes:
e = estimate.
p = Ontario Ministry of Finance planning projection based on external sources as of January 30, 2023.
Sources: Statistics Canada and Ontario Ministry of Finance.

Revisions to the Outlook Since the 2022 Budget
Ontario’s real GDP grew by an estimated 3.7 per cent in 2022, in line with the projection in the 2022 Budget, while nominal GDP growth is estimated at 9.4 per cent, significantly higher than the 6.7 per cent 2022 Budget projection. In 2022, compensation of employees, the net operating surplus of corporations, household consumption and consumer prices all grew faster than initially projected.
The outlook has been revised compared to the projections in the 2022 Budget. Key changes since the 2022 Budget include:
- Weaker real and nominal GDP growth between 2023 and 2024, but stronger in 2025;
- Slower growth in nominal household consumption over the forecast period;
- Stronger employment growth in 2022, followed by slower growth in 2023 and 2024; and
- Weaker home resale market in 2023, followed by a strong rebound in 2024.
| 2022 — 2022 Budget |
2022 — 2023 Budget |
2023p — 2022 Budget |
2023p — 2023 Budget |
2024p — 2022 Budget |
2024p — 2023 Budget |
2025p — 2022 Budget |
2025p — 2023 Budget |
|
|---|---|---|---|---|---|---|---|---|
| Real Gross Domestic Product | 3.7 | 3.7e | 3.1 | 0.2 | 2.0 | 1.3 | 1.9 | 2.5 |
| Nominal Gross Domestic Product | 6.7 | 9.4e | 5.1 | 2.8 | 4.2 | 3.6 | 4.1 | 4.6 |
| Compensation of Employees | 5.6 | 9.0e | 4.6 | 5.1 | 4.6 | 4.2 | 4.1 | 4.5 |
| Net Operating Surplus — Corporations | 4.6 | 5.0e | 5.8 | (8.2) | 1.6 | (0.5) | 4.2 | 9.2 |
| Nominal Household Consumption | 8.8 | 12.6e | 6.3 | 5.1 | 4.7 | 4.1 | 4.6 | 4.3 |
| Other Economic Indicators — Employment | 3.9 | 4.6 | 2.0 | 0.5 | 1.7 | 1.0 | 1.2 | 1.7 |
| Other Economic Indicators — Job Creation (000s) | 287 | 338 | 153 | 39 | 133 | 78 | 95 | 133 |
| Other Economic Indicators — Unemployment Rate (Per Cent) | 6.1 | 5.6 | 5.7 | 6.4 | 5.6 | 6.6 | 5.5 | 6.3 |
| Other Economic Indicators — Consumer Price Index | 4.7 | 6.8 | 2.5 | 3.6 | 2.1 | 2.1 | 2.1 | 2.0 |
| Other Economic Indicators — Housing Starts (000s)1 | 86.9 | 96.1 | 84.0 | 80.3 | 87.3 | 79.3 | 87.8 | 82.7 |
| Other Economic Indicators — Home Resales | (11.3) | (32.3) | 1.5 | (8.9) | 1.2 | 21.0 | 1.2 | 1.2 |
| Other Economic Indicators — Home Resale Prices | 9.3 | 6.8 | 2.6 | (9.7) | 4.0 | 2.2 | 4.0 | 4.0 |
| Key External Variables — U.S. Real Gross Domestic Product | 3.7 | 2.1 | 2.6 | 0.5 | 2.1 | 1.2 | 2.0 | 2.1 |
| Key External Variables — WTI Crude Oil ($US per Barrel) | 82 | 95 | 75 | 83 | 67 | 80 | 68 | 79 |
| Key External Variables — Canadian Dollar (Cents US) | 79.5 | 76.8 | 79.5 | 74.4 | 79.2 | 76.5 | 80.0 | 77.6 |
| Key External Variables — Three-Month Treasury Bill Rate (Per Cent)2 | 0.9 | 2.3 | 1.7 | 4.3 | 2.0 | 3.3 | 2.1 | 2.5 |
| Key External Variables — 10-Year Government Bond Rate (Per Cent)3 | 2.0 | 2.8 | 2.5 | 3.1 | 2.8 | 3.1 | 2.9 | 3.1 |
Table 2.2 footnotes:
[1] Housing starts projection based on private-sector average as of January 30, 2023.
[2], [3] Government of Canada interest rates.
e = estimate.
p = Ontario Ministry of Finance planning projection based on external sources as of January 30, 2023.
Sources: Statistics Canada; Canada Mortgage and Housing Corporation; Canadian Real Estate Association; Bank of Canada; United States Bureau of Economic Analysis; Blue Chip Economic Indicators (October 2022 and January 2023); U.S. Energy Information Administration; and Ontario Ministry of Finance.
Recent Economic Performance
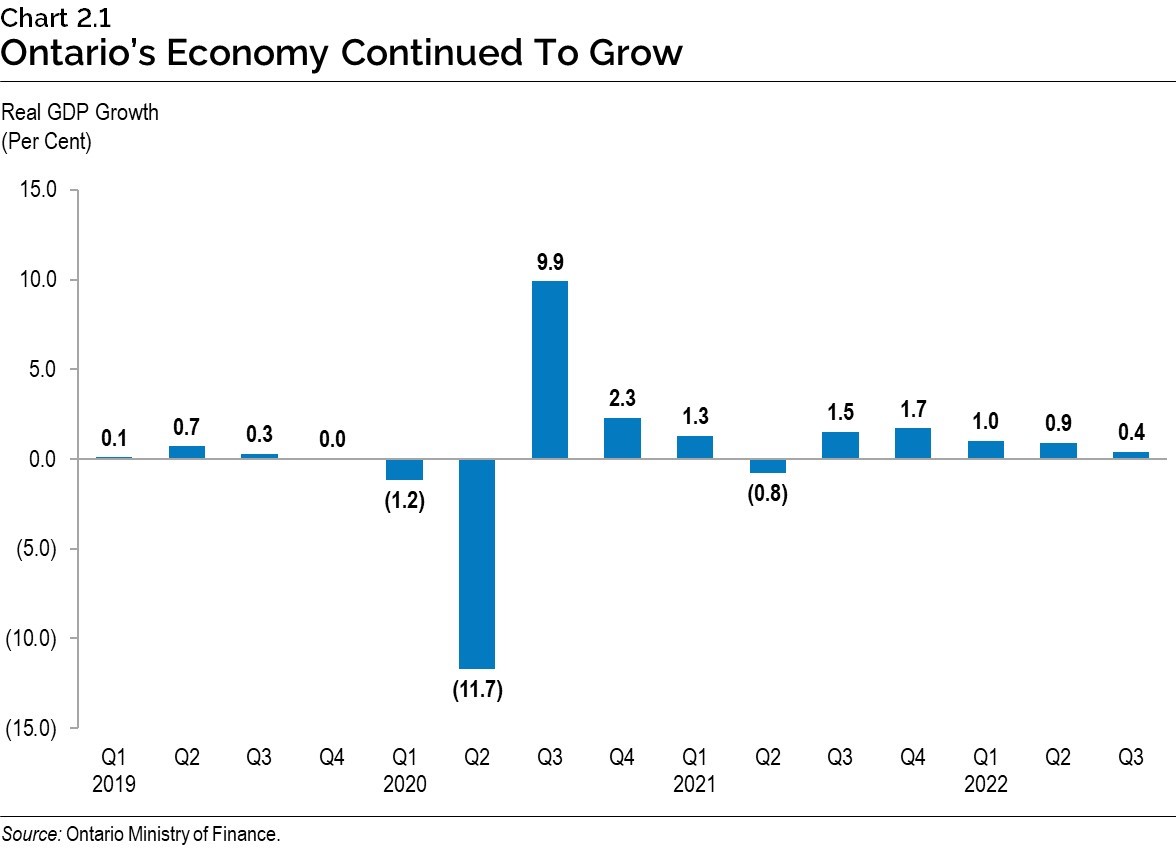
Ontario’s real GDP recorded its fifth consecutive increase in the third quarter of 2022, rising 0.4 per cent, following a 0.9 per cent increase in the second quarter. Real GDP exceeded the pre‑pandemic level by 4.0 per cent as of the third quarter of 2022.
While overall growth has been resilient, some interest rate-sensitive sectors such as consumer spending and housing investment have shown signs of slowing recently. Ontario’s real household spending declined 0.9 per cent in the third quarter of 2022. Real investment in residential structures declined 6.8 per cent in the third quarter of 2022, following a 10.4 per cent decline in the second quarter, coinciding with a slowing housing market. Business inventories reached a record level in the third quarter of 2022, which could be reduced over the next few quarters and weigh on GDP growth.
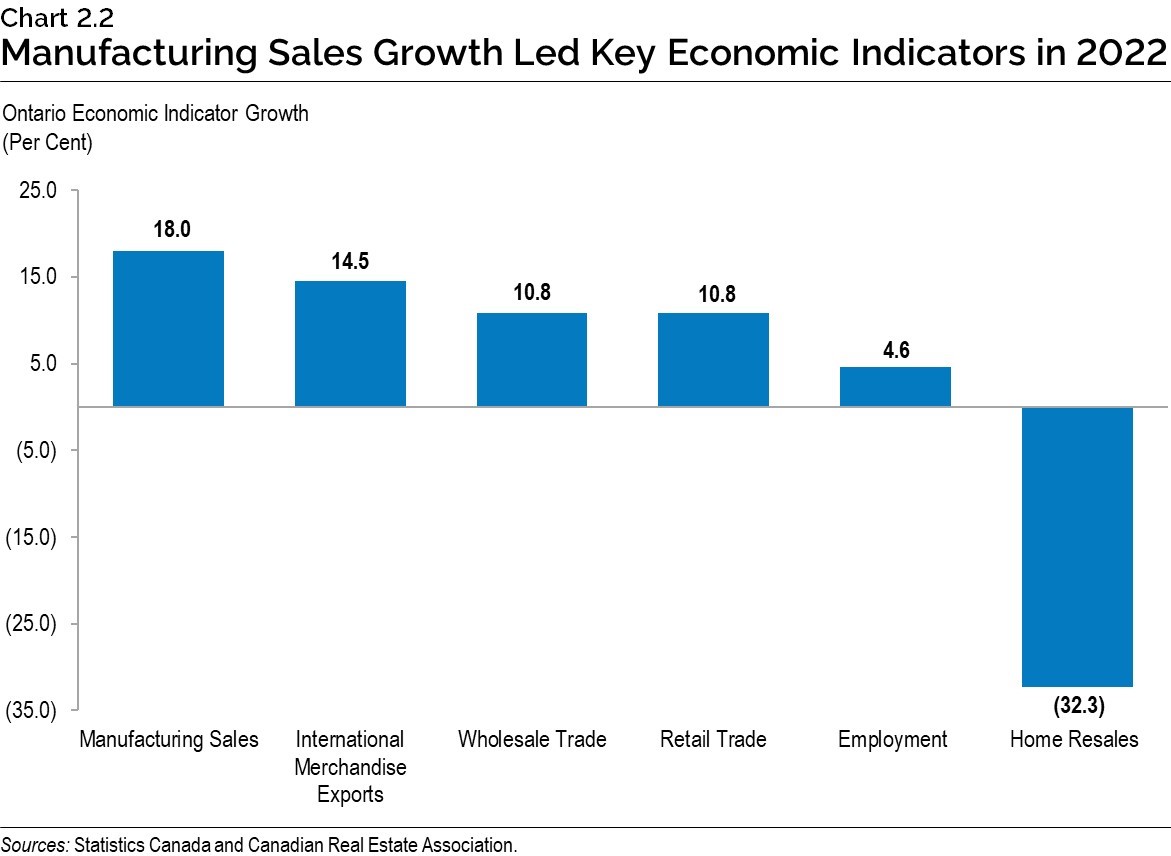
Other economic indicators performed well in 2022, including manufacturing sales, exports, wholesale and retail trade, and employment. Home resales were down due to rapidly rising interest rates as the Bank of Canada raised its policy interest rate from 0.25 per cent at the beginning of March 2022, to 4.50 per cent in January 2023.
Ontario Labour Market
Ontario is facing a tight labour market with a historically low unemployment rate coupled with high levels of employment. The province’s unemployment rate averaged 5.6 per cent in 2022, matching the pre-pandemic rates in 2018 and 2019, the lowest annual rate since the late 1980s. As of January 2023, Ontario’s unemployment rate was 5.2 per cent.
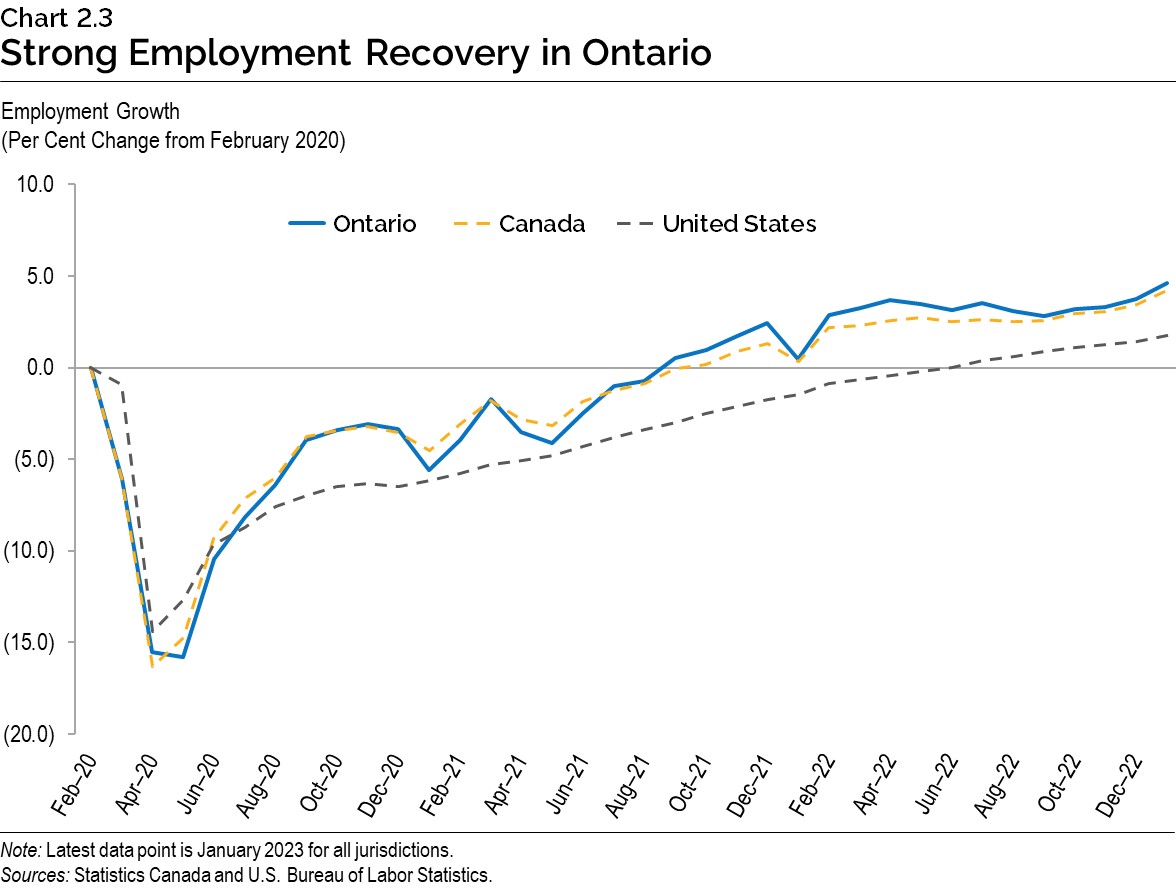
Ontario employment rose by 338,300 (+4.6 per cent) in 2022, following a gain of 367,400 (+5.2 per cent) net jobs in 2021, the two strongest years of job growth on record.1 The vast majority of net employment gains in the last two years were in full-time positions (81 per cent) and in the private sector (75 per cent). The pace of Ontario’s employment recovery has exceeded both Canada and the United States.
Inflation Moderating but Remains Elevated
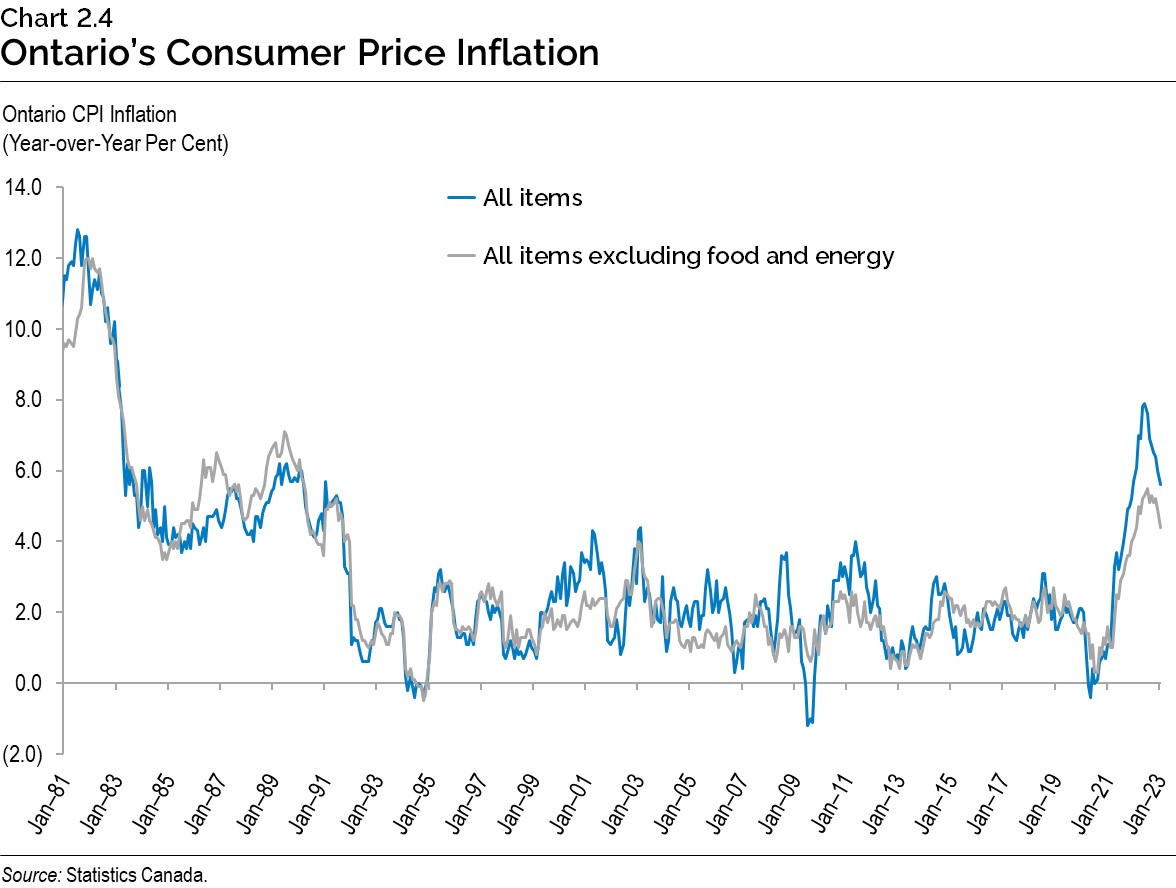
Like many other economies around the world, inflation in Ontario rose strongly in 2022, in part due to a rebound in demand, supply chain disruptions and higher commodity prices further exacerbated by Russia’s invasion of Ukraine. Over the last several months, inflation pressures have begun to ease, but remain elevated. Ontario’s Consumer Price Index (CPI) increased 5.6 per cent in January 2023, compared to a year earlier, moderating from a recent peak of 7.9 per cent in June 2022.
High energy prices have been persistent since early 2021, reaching a peak of 37.0 per cent year‑over-year in June 2022. Energy price inflation eased significantly to 9.0 per cent in January 2023 but remains high. Food price inflation has also been a major contributor to headline inflation, up 10.1 per cent in January 2023 compared to a year earlier. Excluding food and energy, inflation rose 4.4 per cent year-over-year in January 2023.
Economic Outlook
The Ontario Ministry of Finance regularly consults with private-sector economists and continually tracks their forecasts to inform the government’s planning assumptions.
Private-sector forecasters, on average, are projecting that Ontario’s real GDP will grow by 0.3 per cent in 2023, 1.4 per cent in 2024, 2.6 per cent in 2025 and 2.5 per cent in 2026. The Ontario Ministry of Finance’s real GDP projections are set below the average of private-sector forecasts in each year for prudent planning purposes. Three external economic experts reviewed the Ontario Ministry of Finance’s economic planning assumptions and found them to be reasonable.2
| 2023 | 2024 | 2025 | 2026 | |
|---|---|---|---|---|
| Scotiabank (December) | 0.5 | 1.6 | – | – |
| National Bank of Canada (December) | 0.6 | 1.6 | – | – |
| Royal Bank of Canada (December) | (0.1) | 1.1 | – | – |
| Quantitative Economic Decisions, Inc. (January) | 1.0 | 1.5 | 4.2 | 3.8 |
| TD Bank Group (January) | 0.3 | 0.2 | 1.4 | 1.7 |
| CIBC Capital Markets (January) | 0.2 | 0.6 | – | – |
| Desjardins Group (January) | 0.0 | 1.0 | 2.4 | 2.2 |
| Laurentian Bank Securities (January) | (0.2) | 1.5 | – | – |
| BMO Capital Markets (January) | 0.1 | 1.6 | – | – |
| University of Toronto (January) | 0.4 | 1.8 | 3.1 | 2.9 |
| Central 1 Credit Union (January) | 0.8 | 1.8 | 2.4 | – |
| The Conference Board of Canada (January) | 0.5 | 2.5 | 2.8 | 2.1 |
| Stokes Economics (January) | 0.3 | 1.6 | 2.1 | 2.4 |
| Private-Sector Survey Average | 0.3 | 1.4 | 2.6 | 2.5 |
| Ontario’s Planning Projection | 0.2 | 1.3 | 2.5 | 2.4 |
Table 2.3 footnotes:
Sources: Ontario Ministry of Finance Survey of Forecasters (January 30, 2023) and Ontario Ministry of Finance.
Private-sector forecasters, on average, are projecting that Ontario’s nominal GDP will grow by 2.9 per cent in 2023, 3.7 per cent in 2024, 4.7 per cent in 2025 and 4.6 per cent in 2026. The Ontario Ministry of Finance’s nominal GDP projections are set below the average of private-sector forecasts in each year for prudent planning purposes.
| 2023 | 2024 | 2025 | 2026 | |
|---|---|---|---|---|
| Scotiabank (December) | 3.6 | 4.1 | – | – |
| National Bank of Canada (December) | 1.3 | 3.8 | – | – |
| Royal Bank of Canada (December) | 2.3 | 3.5 | – | – |
| Quantitative Economic Decisions, Inc. (January) | 5.6 | 4.2 | 7.0 | 6.1 |
| TD Bank Group (January) | 2.5 | 2.6 | 3.4 | 3.7 |
| CIBC Capital Markets (January) | 1.6 | 2.8 | – | – |
| Desjardins Group (January) | 1.8 | 2.8 | – | – |
| Laurentian Bank Securities (January) | 3.4 | 3.8 | – | – |
| BMO Capital Markets (January) | 2.6 | 4.0 | – | – |
| University of Toronto (January) | 2.4 | 3.6 | 5.1 | 5.0 |
| Central 1 Credit Union (January) | 4.0 | 3.4 | 4.4 | – |
| The Conference Board of Canada (January) | 2.8 | 4.8 | 4.6 | 3.9 |
| Stokes Economics (January) | 4.0 | 4.3 | 3.9 | 4.1 |
| Private-Sector Survey Average | 2.9 | 3.7 | 4.7 | 4.6 |
| Ontario’s Planning Projection | 2.8 | 3.6 | 4.6 | 4.5 |
Table 2.4 footnotes:
Sources: Ontario Ministry of Finance Survey of Forecasters (January 30, 2023) and Ontario Ministry of Finance.
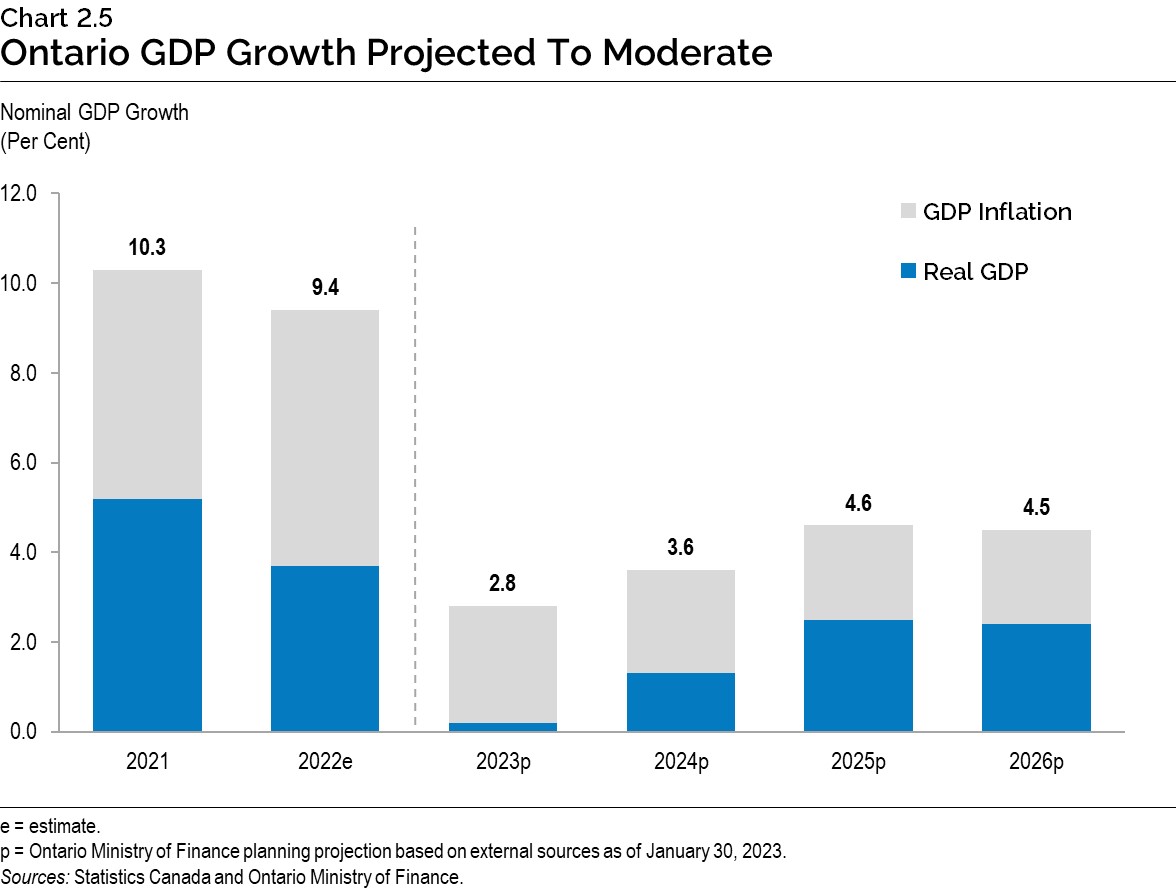
The Ontario Ministry of Finance estimates that Ontario nominal GDP increased by 9.4 per cent in 2022, largely reflecting continued elevated GDP inflation due to strong economy‐wide price increases amid supply constraints and strong demand. Nominal GDP growth is projected to moderate as inflation is forecast to slow.
Global Economic Environment
Global economic growth expectations have started to improve as the energy-price shock following Russia’s invasion of Ukraine has moderated, and China has begun to reopen its economy and ease public health measures. The International Monetary Fund projects global real GDP growth of 2.9 per cent in 2023, up from 2.7 per cent forecasted in October 2022, and 3.1 per cent in 2024, down slightly from growth of 3.2 per cent projected in October 2022.
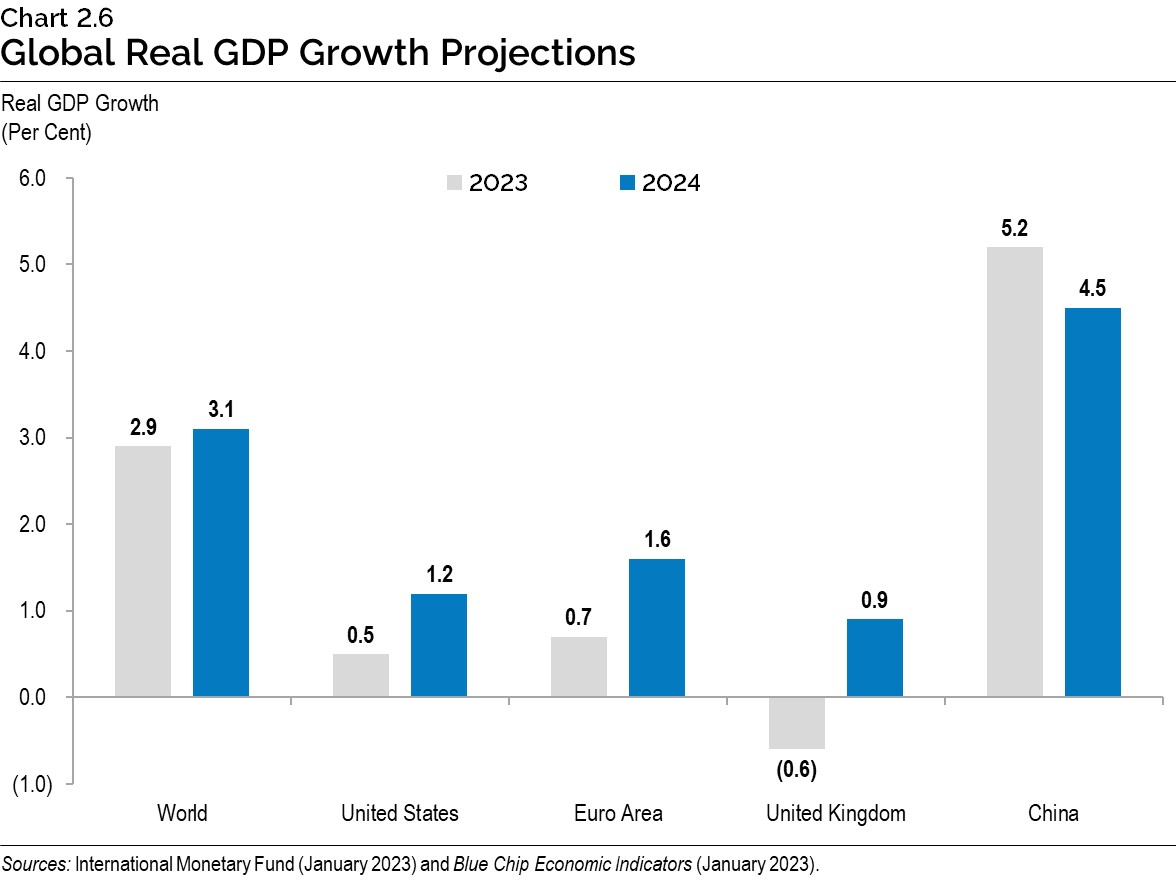
U.S. real GDP is projected to increase by 0.5 per cent in 2023 and 1.2 per cent in 2024. Euro area real GDP is projected to rise 0.7 per cent in 2023 and 1.6 per cent in 2024. China’s real GDP is forecast to rise 5.2 per cent in 2023 and 4.5 per cent in 2024.
| 2021 | 2022 | 2023p | 2024p | 2025p | 2026p | |
|---|---|---|---|---|---|---|
| World Real GDP Growth (Per Cent) | 6.2 | 3.4 | 2.9 | 3.1 | 3.4 | 3.3 |
| U.S. Real GDP Growth (Per Cent) | 5.9 | 2.1 | 0.5 | 1.2 | 2.1 | 2.1 |
| West Texas Intermediate (WTI) Crude Oil ($US per Barrel) | 68 | 95 | 83 | 80 | 79 | 79 |
| Canadian Dollar (Cents US) | 79.8 | 76.8 | 74.4 | 76.5 | 77.6 | 78.5 |
| Three-Month Treasury Bill Rate1 (Per Cent) | 0.1 | 2.3 | 4.3 | 3.3 | 2.5 | 2.4 |
| 10-Year Government Bond Rate2 (Per Cent) | 1.4 | 2.8 | 3.1 | 3.1 | 3.1 | 3.2 |
Table 2.5 footnotes:
[1], [2] Government of Canada interest rates.
p = Ontario Ministry of Finance planning projection based on external sources as of January 30, 2023.
Sources: International Monetary Fund World Economic Outlook (January 2023 and October 2022); U.S. Bureau of Economic Analysis; U.S. Energy Information Administration; Bank of Canada; Blue Chip Economic Indicators (January 2023 and October 2022); and Ontario Ministry of Finance Survey of Forecasters.
Financial Markets and Other External Factors
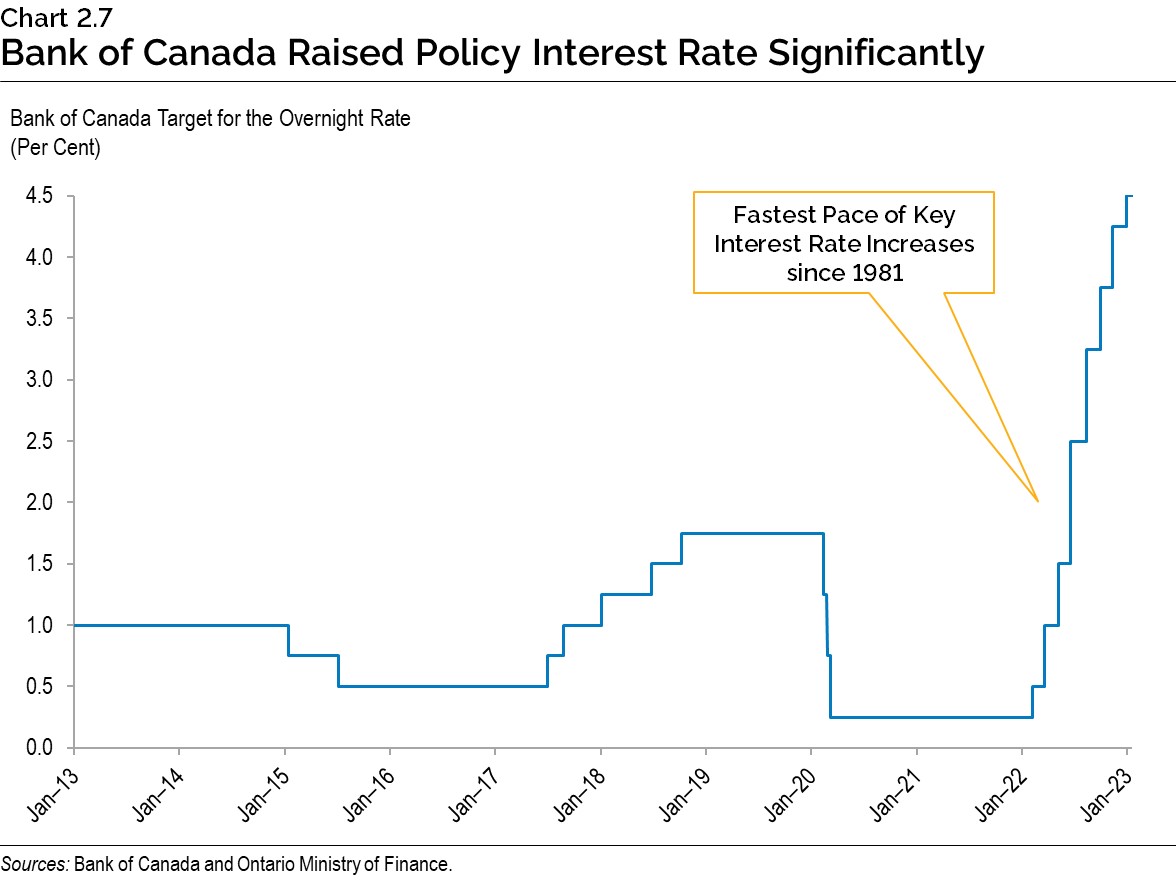
To help control elevated consumer price inflation, the Bank of Canada significantly raised its policy interest rate from 0.25 per cent at the beginning of March 2022 to 4.50 per cent in January 2023. The Bank of Canada has stated in January that it expects to leave the policy interest rate at this level while it assesses the cumulative impacts of its interest rate increases on the economy.
As inflation moderates further, the Bank is expected to eventually reduce policy interest rates, allowing for a decline in short-term interest rates. The Government of Canada three-month treasury bill rate rose from 0.1 per cent in 2021 to 2.3 per cent in 2022 and is expected to increase to 4.3 per cent in 2023 before moderating to 2.4 per cent by 2026. Similarly, the Government of Canada 10-year bond rate increased from 1.4 per cent in 2021 to 2.8 per cent in 2022 and is projected to rise to 3.1 per cent in 2023 and remain steady through 2026.
Energy prices are expected to moderate in 2023, as global economic growth slows, and remain steady as energy markets normalize over the projection period. he Canadian dollar is expected to average 74.4 cents US in 2023 and appreciate gradually over the projection period.
Details of Ontario’s Economic Outlook
The Ontario Ministry of Finance projects real GDP to rise by 0.2 per cent in 2023, 1.3 per cent in 2024, 2.5 per cent in 2025 and 2.4 per cent in 2026. Nominal GDP is projected to grow by 2.8 per cent in 2023 and accelerate to 3.6 per cent in 2024, 4.6 per cent in 2025 and 4.5 per cent in 2026.
| 2021 | 2022 | 2023p | 2024p | 2025p | 2026p | |
|---|---|---|---|---|---|---|
| Real Gross Domestic Product | 5.2 | 3.7e | 0.2 | 1.3 | 2.5 | 2.4 |
| Nominal Gross Domestic Product | 10.3 | 9.4e | 2.8 | 3.6 | 4.6 | 4.5 |
| Compensation of Employees | 9.2 | 9.0e | 5.1 | 4.2 | 4.5 | 4.2 |
| Net Operating Surplus — Corporations | 13.7 | 5.0e | (8.2) | (0.5) | 9.2 | 9.1 |
| Nominal Household Consumption | 7.3 | 12.6e | 5.1 | 4.1 | 4.3 | 4.2 |
| Other Economic Indicators — Employment | 5.2 | 4.6 | 0.5 | 1.0 | 1.7 | 1.7 |
| Other Economic Indicators — Job Creation (000s) | 367 | 338 | 39 | 78 | 133 | 136 |
| Other Economic Indicators — Unemployment Rate (Per Cent) | 8.1 | 5.6 | 6.4 | 6.6 | 6.3 | 6.3 |
| Other Economic Indicators — Consumer Price Index | 3.5 | 6.8 | 3.6 | 2.1 | 2.0 | 2.0 |
| Other Economic Indicators — Housing Starts (000s)1 | 99.6 | 96.1 | 80.3 | 79.3 | 82.7 | 83.2 |
| Other Economic Indicators — Home Resales | 18.5 | (32.3) | (8.9) | 21.0 | 1.2 | 1.2 |
| Other Economic Indicators — Home Resale Prices | 23.6 | 6.8 | (9.7) | 2.2 | 4.0 | 4.0 |
| Key External Variables — U.S. Real Gross Domestic Product | 5.9 | 2.1 | 0.5 | 1.2 | 2.1 | 2.1 |
| Key External Variables — WTI Crude Oil ($US per Barrel) | 68 | 95 | 83 | 80 | 79 | 79 |
| Key External Variables — Canadian Dollar (Cents US) | 79.8 | 76.8 | 74.4 | 76.5 | 77.6 | 78.5 |
| Key External Variables — Three-Month Treasury Bill Rate (Per Cent)2 | 0.1 | 2.3 | 4.3 | 3.3 | 2.5 | 2.4 |
| Key External Variables — 10-Year Government Bond Rate (Per Cent)3 | 1.4 | 2.8 | 3.1 | 3.1 | 3.1 | 3.2 |
Table 2.6 footnotes:
[1] Housing starts projection based on private-sector average as of January 30, 2023.
[2], [3] Government of Canada interest rates.
e = estimate.
p = Ontario Ministry of Finance planning projection based on external sources as of January 30, 2023.
Sources: Statistics Canada; Canada Mortgage and Housing Corporation; Canadian Real Estate Association; Bank of Canada; United States Bureau of Economic Analysis; Blue Chip Economic Indicators (January 2023 and October 2022); U.S. Energy Information Administration; and Ontario Ministry of Finance.
Employment, Incomes and Spending
Strong Ontario employment growth continued in 2022 and the unemployment rate averaged 5.6 per cent. In 2023, elevated inflation, high interest rates and economic uncertainty are forecast to contribute to slowing employment growth. Despite modestly rising employment in 2023, the unemployment rate is projected to rise to 6.4 per cent in 2023 as strong labour force growth is projected to continue.
Employment growth is forecast to strengthen to 1.5 per cent, on average annually, over 2024 to 2026. Rising employment growth is projected to lower the unemployment rate to 6.3 per cent in 2025 and 2026.
Slower employment growth and easing inflationary pressures are projected to moderate the growth in compensation of employees from 9.0 per cent in 2022 to 5.1 per cent in 2023. Compensation of employees is projected to grow 4.3 per cent, on average annually, over 2024 to 2026.
High debt servicing costs and elevated prices are projected to weigh on consumer spending in 2023. Nominal household consumption growth is projected to moderate from 12.6 per cent in 2022 to 5.1 per cent in 2023, reflecting both lower inflation and real growth. Nominal household consumption is projected to rise 4.2 per cent, on average annually, over the 2024 to 2026 period.
Consumer Price Inflation
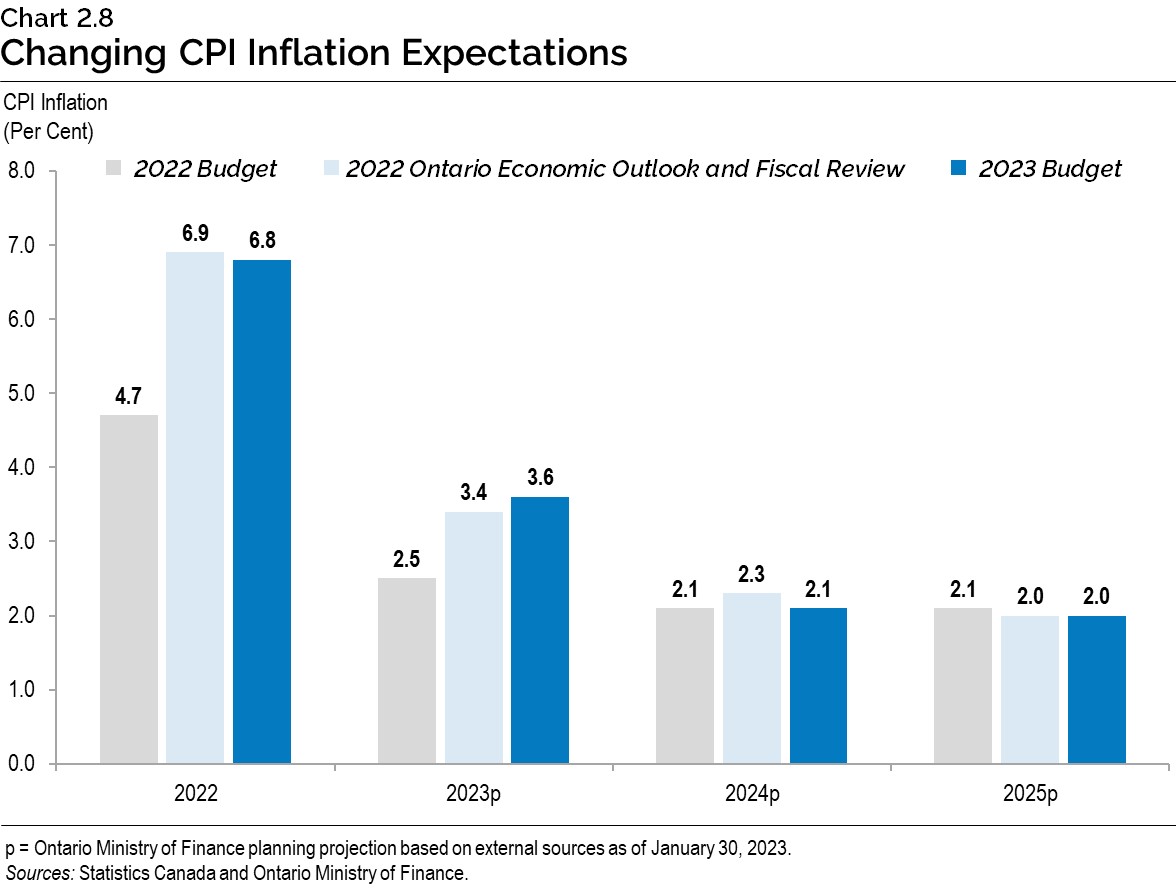
In early 2022, low interest rates, supply chain constraints and strong economic activity contributed to conditions that caused Ontario’s Consumer Price Index (CPI) to rise much more rapidly than expected. The impacts of the supply chain constraints were expected to be transitory by most private-sector forecasters. The 2022 Budget projected that Ontario CPI would rise 4.7 per cent in 2022, moderate to 2.5 per cent in 2023 and return close to the Bank of Canada’s 2 per cent inflation target by 2024.
By the time of the 2022 Ontario Economic and Fiscal Review, inflation had risen much more quickly than anticipated and was expected to remain elevated for a longer period. The 2022 Ontario Economic and Fiscal Review projected Ontario CPI would rise 6.9 per cent in 2022, 3.4 per cent in 2023 and 2.3 per cent in 2024.
The outlook for CPI inflation has changed only modestly since the 2022 Ontario Economic Outlook and Fiscal Review. For planning purposes, the Ontario Ministry of Finance is projecting CPI inflation to be 3.6 per cent in 2023 and moderate to 2.1 per cent in 2024 before converging to the Bank of Canada’s target rate of 2.0 per cent in 2025 and 2026.
The future trajectory of CPI inflation is uncertain and dependent on the path of the economy and central bank actions. Private-sector economists have a wide range of views, with forecasts for 2023 inflation ranging from 2.7 per cent to 5.5 per cent. The range of views narrows to between 1.5 per cent and 2.5 per cent in 2024 and to between 1.8 per cent and 2.1 per cent in 2025.
Housing
Ontario housing market activity continued to moderate through the end of 2022, as the market adjusted to rising interest rates. By January 2023, average home resale prices had declined by 21.3 per cent from their February 2022 peak, while the number of home resales was 43.4 per cent lower. For 2022, strong early momentum helped average home resale prices rise 6.8 per cent, following 23.6 per cent growth in 2021. The number of home resales was 32.3 per cent lower for 2022, following 18.5 per cent growth in 2021.
Housing market activity is expected to begin to stabilize over the outlook period. The number of Ontario home resales is expected to decline by 8.9 per cent in 2023. Home resales are expected to rebound 21.0 per cent in 2024, before returning to levels more consistent with fundamental drivers of housing demand, such as population growth, in 2025 and 2026. Average home prices are expected to decline 9.7 per cent in 2023, before prices stabilize and rise 2.2 per cent in 2024 and further rebound in 2025 and 2026. For details on the government’s plan to get 1.5 million homes built by 2031, see Chapter 1, Section B: Working for You.
Risks to the Outlook
Central banks in many jurisdictions, including the Bank of Canada, have tightened monetary policy to help control domestic price inflation. In recent months, headline rates of inflation have been trending downwards, led by lower energy and commodity prices. However, there is a risk that inflation, particularly in services-producing industries, may be more persistent. This could require continued tightening of monetary policy, especially if the Bank of Canada assesses that medium-term consumer and business inflation expectations are beginning to rise.
The U.S. labour market continues to perform well, despite significant monetary policy tightening by the U.S. Federal Reserve. There is a risk that there may be a more significant downturn in U.S. economic activity as the Federal Reserve works to bring U.S. consumer price inflation down. This poses a downside risk for the Ontario economy, particularly on the demand for Ontario exports.
International economic and geopolitical developments continue to pose significant risks to the Ontario economy. Developments related to Russia’s invasion of Ukraine continue to expose global commodity markets and supply chains to potential volatility. The recent easing of pandemic public health measures and the reopening of China’s economy are significant upside risks to global economic growth and to commodity prices.
Table 2.7 displays current estimates of the impact of sustained changes in key external factors on Ontario’s real GDP planning assumptions, assuming other external factors remain unchanged. The relatively wide range of estimated impacts reflects the uncertainty regarding how the economy could respond to these changes in external conditions.
| Change in Real GDP Growth First Year |
Change in Real GDP Growth Second Year |
|
|---|---|---|
| Canadian Dollar Appreciates by Five Cents US | (0.1) to (0.7) | (0.2) to (0.8) |
| Crude Oil Prices Increase by $10 US per Barrel | (0.1) to (0.3) | (0.1) to (0.3) |
| U.S. Real GDP Growth Increases by One Percentage Point | +0.2 to +0.6 | +0.3 to +0.7 |
| Canadian Interest Rates Increase by One Percentage Point | (0.1) to (0.5) | (0.2) to (0.6) |
Table 2.7 footnotes:
Source: Ontario Ministry of Finance.
Economic Outlook Scenarios
To provide more transparency about the province’s economic outlook amid the elevated degree of economic uncertainty, the Ontario Ministry of Finance has developed Faster Growth and Slower Growth scenarios. These alternative scenarios should not be considered the best case or the worst case but reasonable possible outcomes in this period of uncertainty.
| 2023p | 2024p | 2025p | 2026p | |
|---|---|---|---|---|
| Faster Growth Scenario | 1.3 | 2.0 | 2.8 | 2.7 |
| Planning Projection | 0.2 | 1.3 | 2.5 | 2.4 |
| Slower Growth Scenario | (0.7) | 0.8 | 2.4 | 2.3 |
Table 2.8 footnotes:
p = Ontario Ministry of Finance planning projection based on external sources and alternative scenarios.
Source: Ontario Ministry of Finance.
| 2023p | 2024p | 2025p | 2026p | |
|---|---|---|---|---|
| Faster Growth Scenario | 6.0 | 4.4 | 5.1 | 5.0 |
| Planning Projection | 2.8 | 3.6 | 4.6 | 4.5 |
| Slower Growth Scenario | 1.0 | 3.0 | 4.3 | 4.2 |
Table 2.9 footnotes:
p = Ontario Ministry of Finance planning projection based on external sources and alternative scenarios.
Source: Ontario Ministry of Finance.
By 2026, the level of real GDP in the Faster Growth scenario is 2.4 per cent higher than in the Planning Projection, while in the Slower Growth scenario, the level of real GDP is 1.6 per cent lower. By 2026, the level of nominal GDP in the Faster Growth scenario is 4.9 per cent higher than in the Planning Projection, while in the Slower Growth scenario, the level of nominal GDP is 2.9 per cent lower.
Transparent Reporting on the Economy
The Ontario Economic Accounts provide a comprehensive overall assessment of the performance of Ontario’s economy. Private-sector economists use this to assess the current state of the province’s economy and as a basis for updating their forecasts. The Ontario Economic Accounts inform the government’s economic and revenue forecasts, providing a key foundation for Ontario’s fiscal plan.
The Fiscal Sustainability, Transparency and Accountability Act, 2019 states that the quarterly Ontario Economic Accounts shall be released within 45 days after the Statistics Canada release of the National Income and Expenditure Accounts.
In compliance with the legislation, the quarterly Ontario Economic Accounts will be released according to the schedule outlined in Table 2.10.
| Reference Period | Expected Statistics Canada Release of National Income and Expenditure Accounts | Corresponding Deadline for Release of Ontario Economic Accounts |
|---|---|---|
| Fourth Quarter (October-December) 2022 |
February 28, 2023 | By April 14, 2023 |
| First Quarter (January-March) 2023 |
May 31, 2023 | By July 14, 2023 |
| Second Quarter (April-June) 2023 |
September 1, 2023 | By October 16, 2023 |
| Third Quarter (July-September) 2023 |
November 30, 2023 | By January 12, 2024 |
| Fourth Quarter (October-December) 2023 |
February 29, 2024 | By April 12, 2024 |
Table 2.10 footnotes:
Sources: Statistics Canada and Ontario Ministry of Finance.
Footnotes
[1] Statistics Canada Labour Force Survey employment data starts in 1976 for Ontario.
[2] The three experts are from the Policy and Economic Analysis Program at the University of Toronto; Quantitative Economic Decisions, Inc.; and Stokes Economic Consulting, Inc.
Chart Descriptions
Chart 2.1: Ontario’s Economy Continued To Grow
This bar chart illustrates the quarterly real gross domestic product growth in Ontario from the first quarter of 2019 to the third quarter of 2022. Real gross domestic product growth is as follows: 0.1 per cent in 2019Q1; 0.7 per cent in 2019Q2; 0.3 per cent in 2019Q3; 0.0 per cent in 2019Q4; −1.2 per cent in 2020Q1; −11.7 per cent in 2020Q2; 9.9 per cent in 2020Q3; 2.3 per cent in 2020Q4; 1.3 per cent in 2021Q1; −0.8 per cent in 2021Q2; 1.5 per cent in 2021Q3; 1.7 per cent in 2021Q4; 1.0 per cent in 2022Q1; 0.9 per cent in 2022Q2; and 0.4 per cent in 2022Q3.
Source: Ontario Ministry of Finance.
Chart 2.2: Manufacturing Sales Growth Led Key Economic Indicators in 2022
This bar chart shows the per cent change in key Ontario economic indicators in 2022. Changes are as follows: Manufacturing sales increased 18.0 per cent; International merchandise exports increased 14.5 per cent; Wholesale trade increased 10.8 per cent; Retail trade increased 10.8 per cent; Employment increased 4.6 per cent; and Home resales decreased 32.3 per cent.
Sources: Statistics Canada and Canadian Real Estate Association.
Chart 2.3: Strong Employment Recovery in Ontario
The chart shows employment growth for Ontario as the solid blue line, Canada as the dashed yellow line and the United States as the dashed gray line as a per cent change from the February 2020 employment level for each respective jurisdiction, from February 2020 to January 2023. Compared to the February 2020 level, Ontario’s employment declined to 15.8 per cent in May 2020 while Canada and U.S. employment declined to 16.3 per cent and 14.4 per cent, respectively, in April 2020. As of January 2023, Ontario and Canadian employment were higher than the February 2020 level, at 4.6 per cent and 4.2 per cent, respectively. Employment in the United States was 1.8 per cent higher in January 2023, compared to February 2020 levels.
Note: Latest data point is January 2023 for all jurisdictions.
Sources: Statistics Canada and U.S. Bureau of Labor Statistics.
Chart 2.4: Ontario’s Consumer Price Inflation
This line chart shows Ontario’s consumer price index (CPI) inflation in year-over-year per cent for all items (shown as a solid blue line) and all items excluding food and energy (shown as a solid gray line) from January 1981 to January 2023.
In January 2023, Ontario CPI inflation for all items was 5.6 per cent year-over-year, while CPI inflation for all items excluding food and energy was 4.4 per cent, year-over-year.
Source: Statistics Canada.
Chart 2.5: Ontario GDP Growth Projected To Moderate
The chart shows a stacked bar chart of nominal GDP growth for 2021 and 2022, and Ontario Ministry of Finance planning projections for 2023 to 2026. Nominal GDP growth was 10.3 per cent in 2021 and 9.4 per cent in 2022. Nominal GDP is forecast to grow 2.8 per cent in 2023, 3.6 per cent in 2024, 4.6 per cent in 2025 and 4.5 per cent in 2026.
Sources: Statistics Canada and Ontario Ministry of Finance.
Chart 2.6: Global Real GDP Growth Projections
This bar chart shows projected real GDP growth in per cent in 2023 and 2024 for the world economy, the United States, the Euro Area, the United Kingdom and China. Real GDP growth in 2023 and 2024 is projected to be 2.9 per cent and 3.1 per cent for the world economy; 0.5 per cent and 1.2 per cent in the United States; 0.7 per cent and 1.6 per cent in the Euro Area; −0.6 per cent and 0.9 per cent in the United Kingdom; and 5.2 per cent and 4.5 per cent in China.
Sources: International Monetary Fund (January 2023) and Blue Chip Economic Indicators (January 2023).
Chart 2.7: Bank of Canada Raised Policy Interest Rate Significantly
This line chart shows the Bank of Canada target for the overnight rate from January 2013 to January 2023. The Bank of Canada significantly raised its policy interest rate from 0.25 per cent in March 2022 to 4.50 per cent in January 2023. This is the fastest pace of key interest rate increases since 1981.
Sources: Bank of Canada and Ontario Ministry of Finance.
Chart 2.8: Changing CPI Inflation Expectations
This bar chart shows Consumer Price Index (CPI) annual inflation in per cent for 2022, and projected Ontario CPI inflation for 2023 through 2025 in the 2022 Budget, the 2022 Ontario Economic Outlook and Fiscal Review and in the 2023 Budget.
In the 2022 Budget, Ontario CPI inflation was projected to be 4.7 per cent in 2022, 2.5 per cent in 2023, 2.1 per cent in 2024 and 2.1 per cent in 2025. In the 2022 Ontario Economic Outlook and Fiscal Review, Ontario CPI inflation was projected to be 6.9 per cent in 2022, 3.4 per cent in 2023, 2.3 per cent in 2024 and 2.0 per cent in 2025. In the 2023 Budget, Ontario CPI inflation is 6.8 per cent for 2022 and projected to be 3.6 per cent in 2023, 2.1 per cent in 2024 and 2.0 per cent in 2025.
Sources: Statistics Canada and Ontario Ministry of Finance.
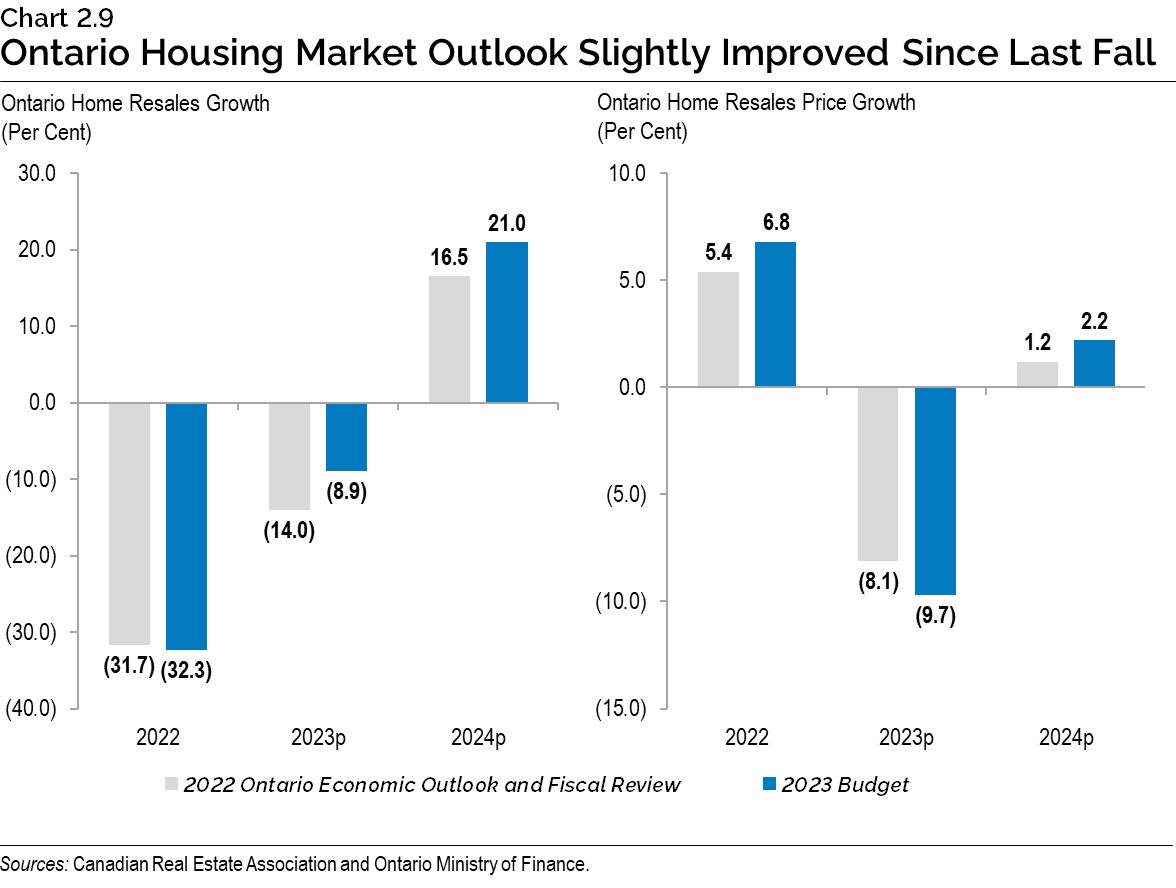
Chart 2.9: Ontario Housing Market Outlook Slightly Improved Since Last Fall
The first bar chart on the left shows projected Ontario home resales growth, in per cent, for 2022, 2023 and 2024, as presented in both the 2022 Ontario Economic Outlook and Fiscal Review and the 2023 Budget. Ontario home resales growth rates presented in the 2022 Ontario Economic Outlook and Fiscal Review and the 2023 Budget for the year 2022 were −31.7 per cent and −32.3 per cent, for the year 2023 were −14.0 per cent and −8.9 per cent, and for the year 2024 were 16.5 per cent and 21.0 per cent.
The second bar chart on the right shows projected Ontario home resales price growth, in per cent, for 2022, 2023 and 2024, as presented in both the 2022 Ontario Economic Outlook and Fiscal Review and the 2023 Budget. Ontario home resales price growth rates presented in the 2022 Ontario Economic Outlook and Fiscal Review and the 2023 Budget for the year 2022 were 5.4 per cent and 6.8 per cent, for the year 2023 were −8.1 per cent and −9.7 per cent and for the year 2024 were 1.2 per cent and 2.2 per cent.
Sources: Canadian Real Estate Association and Ontario Ministry of Finance.
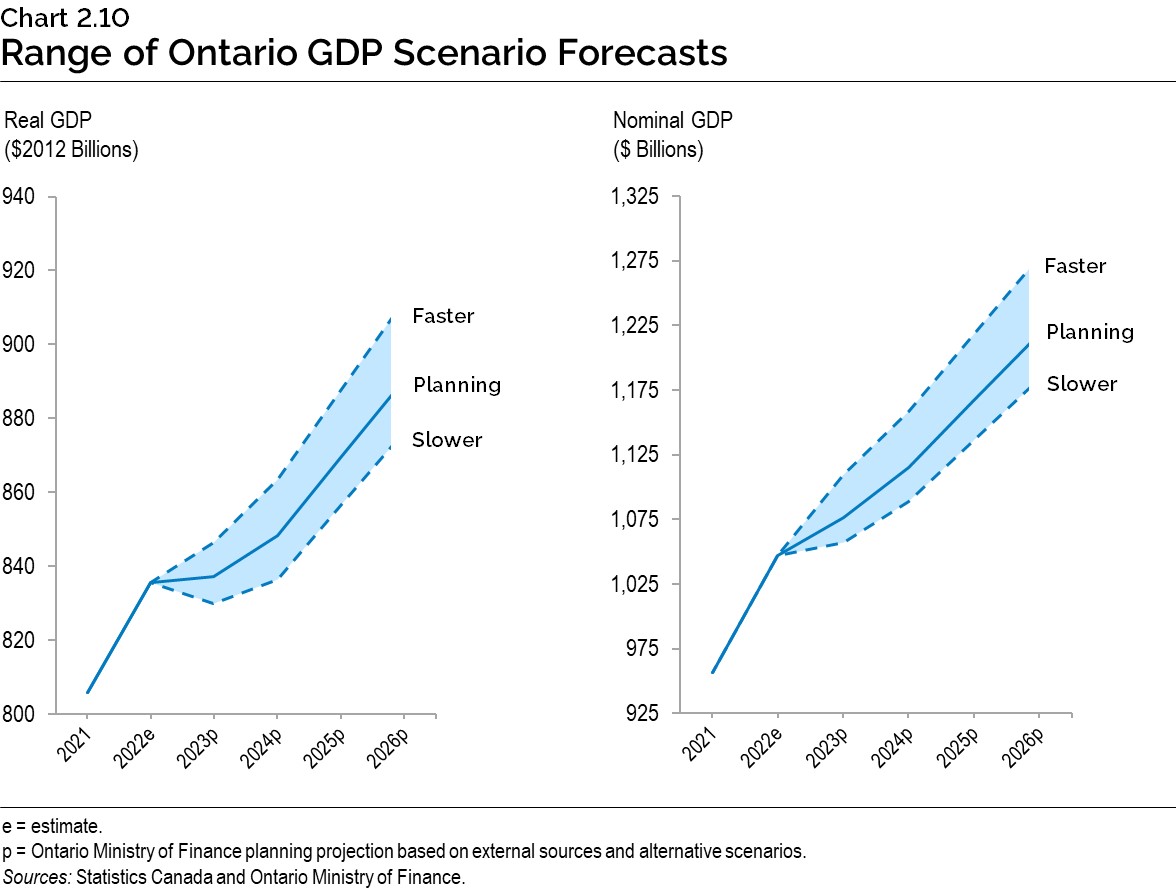
Chart 2.10: Range of Ontario GDP Scenario Forecasts
The line chart on the left shows Ontario real GDP in 2021, estimated real GDP in 2022 and the Ontario Ministry of Finance planning projection for real GDP for 2023 to 2026, in billions of 2012 dollars. Separate lines show the levels of real GDP in the Faster Growth and the Slower Growth scenarios for 2023 to 2026. Ontario real GDP was $806 billion in 2021 and is estimated to have been $836 billion in 2022. In the Planning Projection, Ontario real GDP is projected to rise from $837 billion in 2023 to $890 billion in 2026. In the Faster Growth scenario, Ontario real GDP is projected to rise from $846 billion in 2023 to $912 billion in 2026. In the Slower Growth scenario, Ontario real GDP is projected to rise from $830 billion in 2023 to $876 billion in 2026.
The line chart on the right shows Ontario nominal GDP in 2021, estimated nominal GDP in 2022 and the Ontario Ministry of Finance planning projection for nominal GDP for 2023 to 2026, in billions of dollars. Separate lines show the levels of nominal GDP in the Faster Growth and the Slower Growth scenarios for 2023 to 2026. Ontario nominal GDP was $957 billion in 2021 and is estimated to have been $1,047 billion in 2022. In the Planning Projection, Ontario nominal GDP is projected to rise from $1,076 billion in 2023 to $1,219 billion in 2026. In the Faster Growth scenario, Ontario nominal GDP is projected to rise from $1,110 billion in 2023 to $1,278 billion in 2026. In the Slower Growth scenario, Ontario nominal GDP is projected to rise from $1,057 billion in 2023 to $1,184 billion in 2026.
Sources: Statistics Canada and Ontario Ministry of Finance.