Introduction
Ontario has a path to balance. The government is on track to post a surplus in 2024–25, three years earlier than forecast in the 2022 Budget. While this is a positive update, significant economic and geopolitical uncertainty persists.
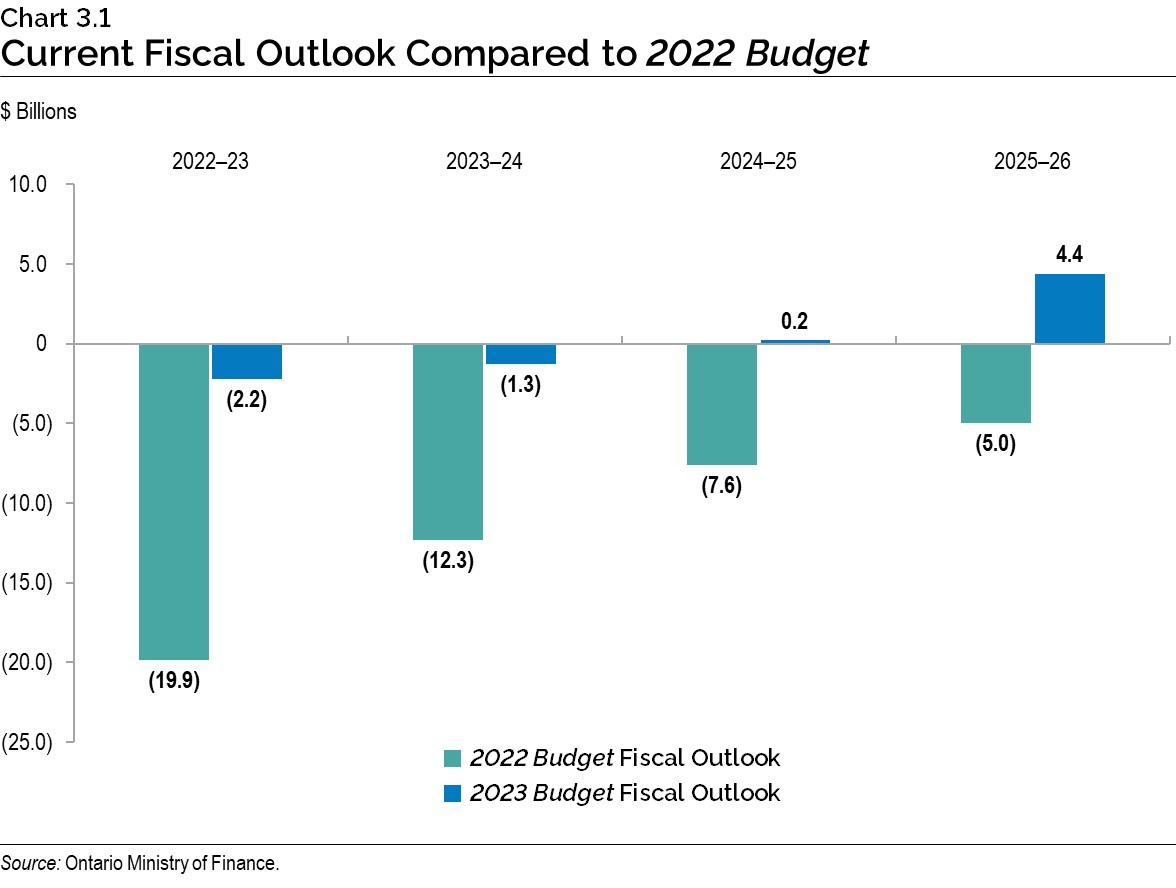
For 2022–23, the government is projecting a deficit of $2.2 billion. Over the medium term, the government is projecting a deficit of $1.3 billion in 2023–24, and surpluses of $0.2 billion in 2024–25 and $4.4 billion in 2025–26. This represents significant improvement compared to the outlook presented in the 2022 Budget.
Primarily due to lower than forecast deficits and higher nominal GDP growth, the net debt-to-GDP ratio is projected to be 37.8 per cent in 2022–23, 3.6 percentage points lower than the 41.4 per cent forecast presented in the 2022 Budget. Over the medium-term outlook, Ontario’s net debt-to-GDP ratio is now forecast to be 37.8 per cent in 2023–24, 37.7 per cent in 2024–25, and declining to 36.9 per cent in 2025–26.
| Actual 2021–22 |
Interim1 2022–23 |
Medium-Term Outlook 2023–24 |
Medium-Term Outlook 2024–25 |
Medium-Term Outlook 2025–26 |
|
|---|---|---|---|---|---|
| Revenue | 185.1 | 200.4 | 204.4 | 213.0 | 226.0 |
| Expense — Programs | 170.4 | 189.1 | 190.6 | 196.4 | 202.5 |
| Expense — Interest on Debt | 12.6 | 13.4 | 14.1 | 14.4 | 15.1 |
| Total Expense | 183.0 | 202.6 | 204.7 | 210.8 | 217.5 |
| Surplus/(Deficit) Before Reserve | 2.1 | (2.2) | (0.3) | 2.2 | 8.4 |
| Reserve | – | – | 1.0 | 2.0 | 4.0 |
| Surplus/(Deficit) | 2.1 | (2.2) | (1.3) | 0.2 | 4.4 |
| Net Debt as a Per Cent of GDP | 39.8% | 37.8% | 37.8% | 37.7% | 36.9% |
| Net Debt as a Per Cent of Revenue | 205.6% | 197.5% | 198.9% | 197.3% | 190.2% |
| Interest on Debt as a Per Cent of Revenue | 6.8% | 6.7% | 6.9% | 6.8% | 6.7% |
Table 3.1 footnotes:
[1] Interim represents the 2023 Budget projection for the 2022–23 fiscal year.
Notes: Numbers may not add due to rounding. Interim and medium-term outlook primarily reflect information available as of February 23, 2023.
Sources: Ontario Treasury Board Secretariat and Ontario Ministry of Finance.

2022–23 Interim1 Fiscal Performance
Ontario’s 2022–23 deficit is projected to be $2.2 billion — $17.7 billion lower than the outlook published in the 2022 Budget and $4.4 billion lower than the outlook published in the 2022–23 Third Quarter Finances.
The 2023 Budget is projecting revenues in 2022–23 to be $200.4 billion — $20.6 billion higher than forecast in the 2022 Budget. This increase is largely driven by higher taxation revenue as a result of higher tax assessments for 2021 and prior years, based on information received from the Canada Revenue Agency (CRA) since the release of the 2022 Budget.
Program expense is projected to be $189.1 billion — $4.0 billion higher than the 2022 Budget forecast.
Ontario is forecast to pay $13.4 billion in interest costs in 2022–23 — slightly lower than the forecast in the 2022 Budget mainly due to a lower borrowing program, despite higher interest rates. At 37.8 per cent, the net debt‐to‐GDP ratio in 2022–23 is forecast to be 3.6 percentage points lower than in the 2022 Budget, primarily as a result of lower than forecast deficits and higher nominal GDP growth.
The 2022 Budget also included a $1.0 billion reserve in 2022–23 to protect the fiscal plan against unforeseen adverse changes in Ontario’s revenue and expense forecasts. The reserve was not required at fiscal year-end and has been drawn down at interim, reducing the deficit further.
| 2022 Budget | Interim1 2022–23 |
In-Year Change |
|
|---|---|---|---|
| Revenue | 179,798 | 200,402 | 20,605 |
| Expense — Programs | 185,163 | 189,148 | 3,985 |
| Expense — Interest on Debt | 13,485 | 13,424 | (61) |
| Total Expense | 198,648 | 202,572 | 3,924 |
| Surplus/(Deficit) Before Reserve | (18,850) | (2,170) | 16,680 |
| Reserve | 1,000 | – | (1,000) |
| Surplus/(Deficit) | (19,850) | (2,170) | 17,680 |
Table 3.2 footnotes:
[1] Interim represents the 2023 Budget projection for the 2022–23 fiscal year.
Notes: Numbers may not add due to rounding. Interim and medium-term outlook primarily reflect information available as of February 23, 2023.
Sources: Ontario Treasury Board Secretariat and Ontario Ministry of Finance.
Interim Revenue Update
The 2022–23 total revenue outlook is $200.4 billion — $20.6 billion higher than projected in the 2022 Budget. Since the release of the 2022–23 Third Quarter Finances, total revenue has increased by $4.0 billion, due to higher projected taxation revenue, recognition of in-kind federal revenue associated with donated COVID‑19 supplies and other non-tax revenue.
| Interim1 2022–23 |
|
|---|---|
| 2022 Budget Total Revenue | 179,798 |
| Revenue Changes in the 2022–23 First Quarter Finances | 1,204 |
| Revenue Changes in the 2022 Ontario Economic Outlook and Fiscal Review | 5,820 |
| Revenue Changes in the 2022–23 Third Quarter Finances | 9,626 |
| Revenue Changes Since the 2022–23 Third Quarter Finances — Personal Income Tax | 2,050 |
| Revenue Changes Since the 2022–23 Third Quarter Finances — Corporations Tax | 303 |
| Revenue Changes Since the 2022–23 Third Quarter Finances — Gasoline Tax and Fuel Tax | 98 |
| Revenue Changes Since the 2022–23 Third Quarter Finances — Employer Health Tax | 90 |
| Revenue Changes Since the 2022–23 Third Quarter Finances — All Other Taxes | 18 |
| Revenue Changes Since the 2022–23 Third Quarter Finances — Total Taxation Revenue | 2,560 |
| Revenue Changes Since the 2022–23 Third Quarter Finances — Government of Canada Transfers | 422 |
| Revenue Changes Since the 2022–23 Third Quarter Finances — Other Non-Tax Revenue | 973 |
| Total Revenue Changes Since the 2022–23 Third Quarter Finances | 3,955 |
| Total Revenue Changes Since the 2022 Budget | 20,605 |
| 2023 Budget Total Revenue Outlook | 200,402 |
Table 3.3 footnotes:
[1] Interim represents the 2023 Budget projection for the 2022–23 fiscal year.
Notes: Numbers may not add due to rounding. Interim and medium-term outlook primarily reflect information available as of February 23, 2023.
Source: Ontario Ministry of Finance.
The forecast for Total Taxation Revenue has increased by $2,560 million compared to the 2022–23 Third Quarter Finances. Key changes in the taxation revenue outlook include:
- Personal Income Tax revenue increased by $2,050 million reflecting updates to capture the impact of recent stronger than expected income data as well as expectations for stronger employment and wages growth;
- Corporations Tax revenue increased by $303 million due to stronger than expected corporate performance;
- Gasoline Tax and Fuel Tax revenue increased by $98 million reflecting updated information from tax receipts in 2022–23;
- Employer Health Tax revenue increased by $90 million due to expectations for stronger employment and wages growth; and
- All Other Taxes combined increased by $18 million, mainly due to higher revenues from Tobacco Tax.
Government of Canada Transfers increased by $422 million, mainly due to the recognition of in-kind federal revenue associated with donated COVID‑19 supplies, partially offset by a reprofiling of funding under the Investing in Canada Infrastructure Program.
Other Non-Tax Revenues increased by $973 million largely due to higher third-party revenue from the Broader Public Sector and higher revenue from fees, licences and permits, royalties, and miscellaneous revenues reflecting continued recovery from the COVID‑19 pandemic.
Interim Expense Update
Since the release of the 2022 Budget, the government has made targeted investments throughout the fiscal year to continue to progress on Ontario’s Plan to Build while also investing in critical public services. The 2022–23 total expense outlook is $202.6 billion — $3.9 billion higher than the 2022 Budget.
Since the release of the 2022–23 Third Quarter Finances, the total program expense projection has increased by $0.6 billion, primarily due to additional other one-time expenses, partially offset by lower than projected ministry spending.
| Interim1 2022–23 |
|
|---|---|
| 2022 Budget Total Expense | 198,648 |
| Total Expense Changes in the 2022–23 First Quarter Finances | 105 |
| Total Expense Changes in the 2022 Ontario Economic Outlook and Fiscal Review | 15 |
| Total Expense Changes in the 2022–23 Third Quarter Finances | 3,229 |
| Program Expense Changes Since the 2022–23 Third Quarter Finances — Base Programs2 — Health Sector | (284) |
| Program Expense Changes Since the 2022–23 Third Quarter Finances — Base Programs3 — Education Sector4 | (47) |
| Program Expense Changes Since the 2022–23 Third Quarter Finances — Base Programs5 — Postsecondary Education Sector | (75) |
| Program Expense Changes Since the 2022–23 Third Quarter Finances — Base Programs6 — Children, Community and Social Services Sector | (92) |
| Program Expense Changes Since the 2022–23 Third Quarter Finances — Base Programs7 — Justice Sector | 313 |
| Program Expense Changes Since the 2022–23 Third Quarter Finances — Base Programs8 — Other Programs | (384) |
| Program Expense Changes Since the 2022–23 Third Quarter Finances — Total Base Programs Expense Changes Since the 2022–23 Third Quarter Finances | (570) |
| Program Expense Changes Since the 2022–23 Third Quarter Finances — COVID‑19 Time-Limited Funding | (86) |
| Program Expense Changes Since the 2022–23 Third Quarter Finances — Other One-Time Expenses | 1,250 |
| Total Program Expense Changes Since the 2022–23 Third Quarter Finances | 594 |
| Interest on Debt Change Since the 2022–23 Third Quarter Finances | (18) |
| Total Expense Changes Since the 2022–23 Third Quarter Finances | 576 |
| Total Expense Changes Since the 2022 Budget | 3,924 |
| 2023 Budget Total Expense Outlook | 202,572 |
Table 3.4 footnotes:
[1] Interim represents the 2023 Budget projection for the 2022–23 fiscal year.
[2], [3], [5], [6], [7], [8] For presentation purposes in the 2023 Budget, one-time COVID‑19-related spending in 2022–23 has been included within COVID‑19 Time-Limited Funding.
[4] Excludes Teachers’ Pension Plan. Teachers’ Pension Plan expense is included in Other Programs.
Notes: Numbers may not add due to rounding. Interim and medium-term outlook primarily reflect information available as of February 23, 2023.
Sources: Ontario Treasury Board Secretariat and Ontario Ministry of Finance.
The following program expense changes are projected since the release of the 2022–23 Third Quarter Finances:
- Health sector expense is projected to be $284 million lower, primarily due to delays in construction projects due to current market conditions, a decrease in Canadian Medical Protective Association fees, as well as lower forecasted expenses for demand-driven Ontario Public Drug Programs.
- Education sector expense is projected to be $47 million lower, primarily due to school boards experiencing lower than forecasted non‐government revenue and implementation timing of the Canada-wide Early Learning and Child Care Agreement, partially offset by increased school board spending, such as higher fuel costs for student transportation.
- Postsecondary Education sector expense is projected to be $75 million lower, mainly due to lower than expected demand for student financial assistance.
- Children, Community and Social Services sector expense is projected to be $92 million lower, primarily due to lower than expected demand for social assistance as a result of better than forecasted labour market conditions.
- Justice sector expense is projected to be $313 million higher, primarily due to investments related to essential service delivery within courts, corrections and policing.
- Other Programs expense is projected to be a net $384 million lower primarily due to the following key changes:
- $402 million in lower than forecasted spending for the Ministry of Energy, primarily due to lower costs of delivering electricity price relief programs, because of updated fuel forecasts and milder weather; and
- $121 million decrease in the Ministry of Transportation, primarily driven by timing changes in municipal transit infrastructure projects.
- COVID‑19 Time-Limited Funding expense is projected to be $86 million lower due to lower than required spending in various ministries.
Interest on debt expense is projected to be $18 million lower due to slightly lower borrowing costs than estimated in the 2022–23 Third Quarter Finances.
Prudence in 2022–23
The Contingency Fund is maintained to help mitigate expense risks that may adversely affect Ontario’s fiscal performance. For the remainder of 2022–23, the Contingency Fund has a current remaining balance of $1.75 billion, which is available to offset additional expenses that may materialize before the end of the fiscal year.
The 2022 Budget included a reserve of $1.0 billion in 2022–23, which was not required and has been drawn down at interim.
For the 2022–23 fiscal year, total COVID‐19 Time‐Limited Funding has decreased by $86 million since the 2022–23 Third Quarter Finances and is now projected to total $7.8 billion.
Medium-Term Fiscal Plan
The government is projecting a deficit of $1.3 billion in 2023–24, and surpluses of $0.2 billion in 2024–25 and $4.4 billion in 2025–26, a significant improvement from the 2022 Budget deficit outlook.
Medium-Term Revenue Outlook
Total revenue is projected to increase from $200.4 billion in 2022–23 to $226.0 billion in 2025–26, for an average annual growth rate of 4.1 per cent. Revenue growth reflects the Ontario Ministry of Finance’s outlook for economic growth, based on private-sector forecasts.
| Actual 2021–22 |
Interim1 2022–23 |
Medium-Term Outlook 2023–24 |
Medium-Term Outlook 2024–25 |
Medium-Term Outlook 2025–26 |
|
|---|---|---|---|---|---|
| Revenue — Personal Income Tax | 46.8 | 52.8 | 56.0 | 58.7 | 62.0 |
| Revenue — Sales Tax | 30.4 | 35.9 | 35.4 | 36.8 | 38.6 |
| Revenue — Corporations Tax | 25.2 | 27.9 | 24.7 | 25.9 | 28.2 |
| Revenue — Ontario Health Premium | 4.4 | 4.7 | 4.9 | 5.1 | 5.3 |
| Revenue — Education Property Tax | 5.7 | 5.8 | 5.7 | 5.7 | 5.8 |
| Revenue — All Other Taxes | 19.2 | 17.6 | 17.6 | 19.8 | 20.6 |
| Total Taxation Revenue | 131.7 | 144.7 | 144.2 | 152.1 | 160.4 |
| Government of Canada | 30.6 | 31.3 | 34.8 | 35.1 | 37.1 |
| Income from Government Business Enterprises | 6.4 | 6.5 | 6.3 | 6.7 | 8.5 |
| Other Non-Tax Revenue | 16.3 | 18.0 | 19.0 | 19.2 | 20.0 |
| Total Revenue | 185.1 | 200.4 | 204.4 | 213.0 | 226.0 |
Table 3.5 footnotes:
[1] Interim represents the 2023 Budget projection for the 2022–23 fiscal year.
Note: Numbers may not add due to rounding.
Source: Ontario Ministry of Finance.
The primary driver of the forecast for Personal Income Tax (PIT) revenues is the outlook for growth in compensation of employees. Personal Income Tax revenue is projected to grow at an average annual rate of 5.5 per cent between 2022–23 and 2025–26.
The forecast for Sales Tax (ST) revenue is driven by the projection for household consumption spending. Average growth in ST revenue is 2.4 per cent between 2022–23 and 2025–26.
The forecast for Corporations Tax (CT) revenue is driven by the projection for net operating surplus of corporations. While CT revenue is projected to decline by 11.7 per cent in 2023–24 due to a slowdown in economic activity, CT revenue is projected to grow at an average annual rate of 6.8 per cent between 2023–24 and 2025–26.
The primary driver of the forecast for Ontario Health Premium revenue is the outlook for growth in compensation of employees. Ontario Health Premium revenue is projected to grow at an average annual rate of 4.4 per cent between 2022–23 and 2025–26.
Education Property Tax revenue is based primarily on the outlook for growth in the property assessment base resulting from new construction activities. Revenues are projected to remain relatively stable over the term of the outlook, with assessment growth largely offset by the impact of previously announced measures, including the reduction in Business Education Tax (BET) rates.
Revenues from All Other Taxes are projected to increase at an average annual rate of 5.5 per cent between 2022–23 and 2025–26. This includes revenues from the Employer Health Tax; Land Transfer Tax; Beer, Wine and Spirits Taxes; and volume-based taxes such as the Gasoline Tax, Fuel Tax and Tobacco Tax.
The forecast for Government of Canada transfers is largely based on existing federal–provincial funding agreements and formulas. Federal one-time transfers related to COVID‑19 amounted to $1.7 billion in 2022–23. Federal transfers are projected to increase at an average annual rate of 5.9 per cent between 2022–23 and 2025–26, which includes an estimated $4.4 billion in new federal health funding over the medium term. The new federal health funding includes a one-time additional health care payment, time-limited funding for shared priorities and an enhancement of the Canada Health Transfer, in total representing an estimated $1.8 billion in 2023–24, $1.1 billion in 2024–25 and $1.5 billion in 2025–26.
The outlook for Income from Government Business Enterprises (GBEs) is based on Ontario Ministry of Finance estimates of net income for Hydro One Ltd. (Hydro One) and projections provided by Ontario Power Generation (OPG), the Ontario Cannabis Store (OCS), the Liquor Control Board of Ontario (LCBO), and the Ontario Lottery and Gaming Corporation (OLG). Net incomes of GBEs are projected to increase at an average annual rate of 9.4 per cent from 2022–23 to 2025–26. The strong growth mainly reflects the anticipated increase in net income from OLG, OPG and Hydro One.
The forecast for Other Non-Tax Revenue is based on projections provided by government ministries and agencies. The outlook for Other Non-Tax Revenue is projected to increase at an average annual rate of 3.6 per cent from 2022–23 to 2025–26 largely due to the increase in third‐party revenues from hospitals, school boards and colleges that are recognized in Ontario’s financial statements. It also reflects new revenue streams from newly consolidated agencies and higher revenue from existing ones, reflecting continued recovery from the COVID‑19 pandemic.
Risks to the Revenue Outlook
There are a variety of risks to the economic planning assumptions underlying the revenue forecast, as outlined in Chapter 2: Economic Performance and Outlook. Table 3.6 highlights some of the key risks and sensitivities to the 2023–24 revenue forecast that could arise from unexpected changes in economic conditions. These are only estimates; actual results can vary. The risks identified are based on factors that are considered to have the most material impact on the largest revenue sources.
| Economic Factors | Revenue Sources | 2023–24 Sensitivities |
|---|---|---|
| Nominal GDP | Total Taxation Revenue | $1,295 million revenue change for each percentage point change in nominal GDP growth. This can vary significantly, depending on the composition and source of changes in GDP growth. |
| Compensation of Employees | Personal Income Tax; Ontario Health Premium; and Employer Health Tax | $876 million revenue change for each percentage point change in growth in compensation of employees. |
| Household Consumption Expenditures | Sales Tax | $257 million revenue change for each percentage point change in growth of household consumption expenditures. |
| Net Operating Surplus of Corporations | Corporations Tax | $236 million revenue change for each percentage point change in growth in net operating surplus of corporations. |
| Housing Resales and Resale Prices | Land Transfer Tax | $42 million revenue change for each percentage point change in growth of either housing resales or resale prices. |
| Ontario Population Share | Canada Health Transfer | $49 million revenue change for each one-tenth of a percentage point change in Ontario’s population share. |
| Ontario Population Share | Canada Social Transfer | $16 million revenue change for each one-tenth of a percentage point change in Ontario’s population share. |
Table 3.6 footnotes:
Source: Ontario Ministry of Finance.
Revenue Outlook Scenarios
To illustrate the potential impacts of elevated economic uncertainty, the Ontario Ministry of Finance has developed two alternative scenarios that the economy could take over the next several years (see Chapter 2: Economic Performance and Outlook for more details). Based on the two alternative nominal GDP growth economic scenarios, two taxation revenue outlook scenarios were developed. The Faster Growth and Slower Growth scenarios each represent a potential path intended to illustrate a broader range of possible outcomes depending on the pace of economic growth, but neither should be considered as the best case or the worst case.
| 2023–24p | 2024–25p | 2025–26p | |
|---|---|---|---|
| Faster Growth Scenario | 149.8 | 160.3 | 171.1 |
| Planning Projection | 144.2 | 152.1 | 160.4 |
| Slower Growth Scenario | 140.6 | 146.3 | 152.8 |
Table 3.7 footnotes:
p = Ontario Ministry of Finance Planning Projection and alternative scenarios.
Note: Numbers may not add due to rounding.
Source: Ontario Ministry of Finance.
In the Faster Growth scenario, total taxation revenue over the medium term is $10.7 billion higher in 2025–26 than the Planning Projection, while in the Slower Growth scenario, total taxation revenue is $7.6 billion lower.
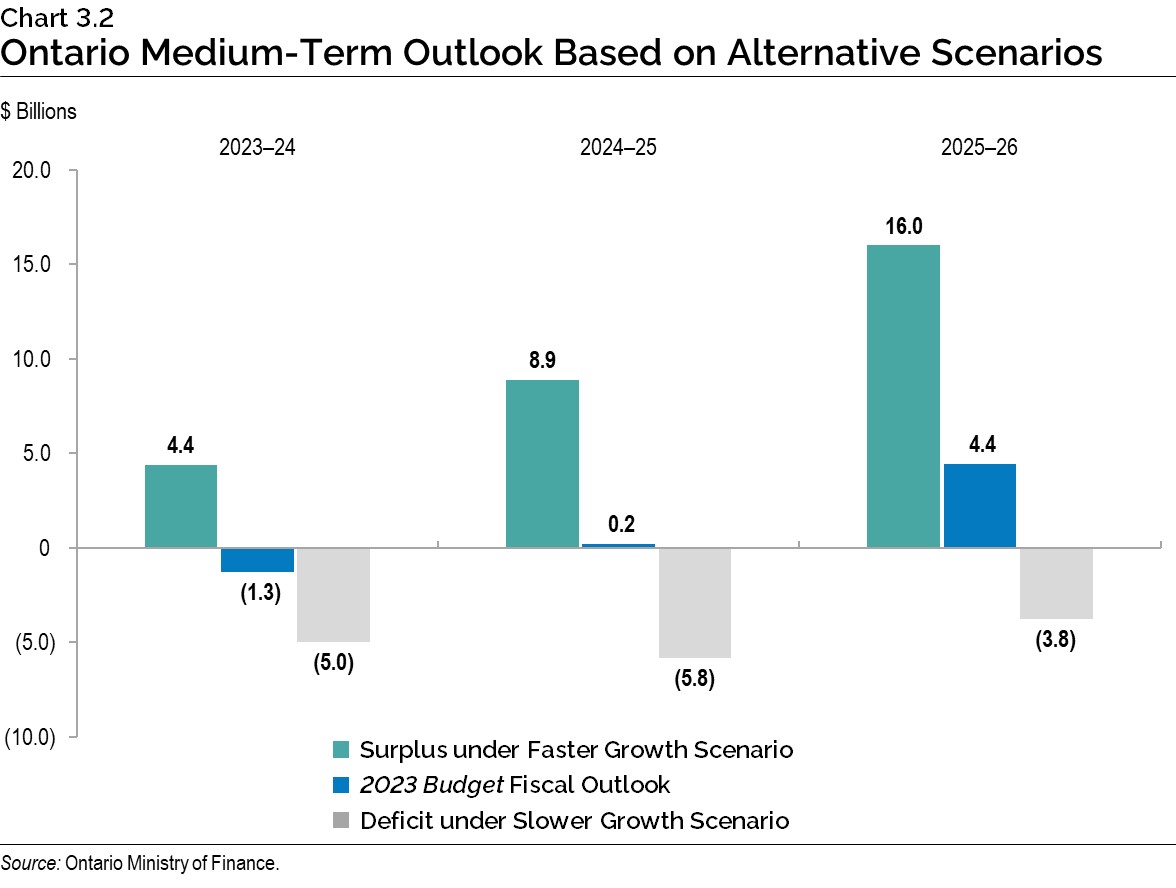
Under the Faster Growth scenario, the surplus outlook would improve to $4.4 billion in 2023–24, $8.9 billion in 2024–25 and $16.0 billion in 2025–26. However, if the Slower Growth scenario materializes, the deficit outlook would deteriorate to $5.0 billion in 2023–24, $5.8 billion in 2024–25 and $3.8 billion in 2025–26.
Note that in these alternative outlook scenarios, program expenses are assumed to be unchanged compared to the medium-term expense outlook and only revenue and interest on debt are adjusted.
Medium-Term Expense Outlook
The total expense outlook is projected to grow from $202.6 billion in 2022–23 to $217.5 billion in 2025–26.
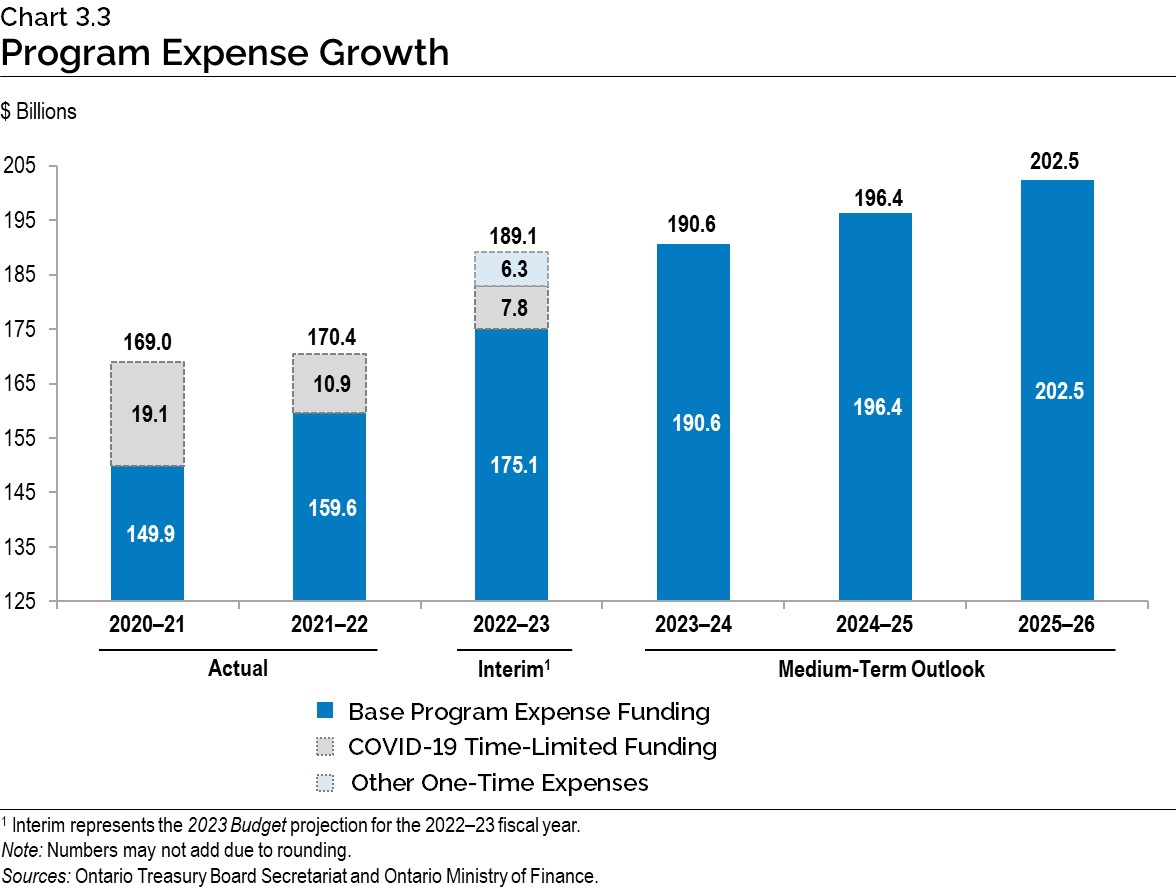
Total program expense is projected to grow from $189.1 billion in 2022–23 to $202.5 billion in 2025–26, representing an annual average increase of 2.3 per cent. Base program expense is projected to increase by $27.4 billion over the same period, representing an annual average increase of 5.0 per cent.
| Actual 2021–22 |
Interim1 2022–23 |
Medium-Term Outlook 2023–24 |
Medium-Term Outlook 2024–25 |
Medium-Term Outlook 2025–26 |
|
|---|---|---|---|---|---|
| Base Programs2 — Health Sector | 69.6 | 74.9 | 81.0 | 84.2 | 87.6 |
| Base Programs3 — Education Sector4 | 28.8 | 32.4 | 34.7 | 36.1 | 37.5 |
| Base Programs5 — Postsecondary Education Sector | 10.5 | 11.3 | 12.1 | 12.5 | 12.9 |
| Base Programs6 — Children, Community and Social Services Sector | 16.8 | 18.4 | 19.4 | 19.8 | 19.9 |
| Base Programs7 — Justice Sector | 4.7 | 5.5 | 5.4 | 5.4 | 5.3 |
| Base Programs8 — Other Programs | 29.2 | 32.6 | 38.1 | 38.4 | 39.3 |
| Total Base Programs | 159.6 | 175.1 | 190.6 | 196.4 | 202.5 |
| COVID‑19 Time-Limited Funding | 10.9 | 7.8 | – | – | – |
| Other One-Time Expenses | – | 6.3 | – | – | – |
| Total Programs | 170.4 | 189.1 | 190.6 | 196.4 | 202.5 |
| Interest on Debt | 12.6 | 13.4 | 14.1 | 14.4 | 15.1 |
| Total Expense | 183.0 | 202.6 | 204.7 | 210.8 | 217.5 |
Table 3.8 footnotes:
[1] Interim represents the 2023 Budget projection for the 2022–23 fiscal year.
[2], [3], [5], [6], [7], [8] For presentation purposes in the 2023 Budget, one-time COVID‑19-related spending in 2021–22 and 2022–23 has been included within COVID‑19 Time-Limited Funding.
[4] Excludes Teachers’ Pension Plan. Teachers’ Pension Plan expense is included in Other Programs.
Note: Numbers may not add due to rounding.
Sources: Ontario Treasury Board Secretariat and Ontario Ministry of Finance.
The government has made available COVID‑19 Time-Limited Funding during the pandemic, including $7.8 billion in 2022–23. This funding will no longer be reported separately, starting in
2023–24. Additionally, in 2022–23, there are other significant one-time expenses of $6.3 billion projected, including for costs associated with ongoing land and land-related claims with Indigenous communities, where Ontario is in active negotiations, or claims are accepted for negotiation or are under review1. These one-time expenses are broken out to provide greater transparency regarding their temporary nature.
In addition to these temporary initiatives, the government continues to invest in programs that serve the people of Ontario. Over the medium-term outlook, base program expense is projected to increase every year, growing at an average annual rate of 5.0 per cent from 2022–23 to 2025–26.
Highlights of the changes to the program expense outlook over the medium term include the following:
- Base Health sector expense is projected to increase from $74.9 billion in 2022–23 to $87.6 billion in 2025–26 — representing 5.4 per cent average annual growth over the period. The growth is primarily due to investments to:
- Address the growing demands in the health sector, including funding for hospitals and cancer treatment services to respond to Ontario’s aging and growing population, and provide stability;
- Support health human resources initiatives to optimize the existing workforce and recruit and retain health care providers;
- Enhance emergency health services by reducing wait times;
- Improve and reform the home and community care sector; and
- Support mental health and addictions services through the Roadmap to Wellness: A Plan to Build Ontario’s Mental Health and Addictions System.
- Base Education sector expense is projected to increase from $32.4 billion in 2022–23 to $37.5 billion in 2025–26 — representing 5.0 per cent average annual growth over the period. Key investments include:
- Helping students catch up on learning through reading and math programs and modernizing the school curriculum;
- Funding to support enrolment growth and commitments consistent with labour agreements reached; and
- Funding to continue the implementation of the Canada‐wide Early Learning and Child Care Agreement to reduce average out‐of‐pocket child care fees and enhance access to child care.
- Base Postsecondary Education sector expense is projected to increase from $11.3 billion in 2022–23 to $12.9 billion in 2025–26 — representing 4.5 per cent average annual growth over the period. This is mainly due to:
- Higher college sector spending from increased on-campus activities following the easing of public health restrictions;
- Investments of over $428 million to support Health Human Resources needs including clinical education for nursing‐related programs and expanding the number of medical school seats. The government is also providing supports through the Ontario Learn and Stay Grant; and
- Investments in research and innovation to support productivity and economic growth, such as for the Sudbury Neutrino Observatory (SNOLAB), creating a Centre for Analytics at the Ontario Brain Institute and expanding the McMaster Nuclear Reactor.
- Base Children, Community and Social Services sector expense is projected to increase from $18.4 billion in 2022–23 to $19.9 billion in 2025–26 — representing 2.7 per cent average annual growth over the period. This is mainly due to:
- $1.4 billion over three years to annually adjust to inflation the core allowances for the Ontario Disability Support Program and the maximum monthly amount for the Assistance for Children with Severe Disabilities Program, starting in July 2023; and
- $170 million over three years to support a new program for youth leaving the child welfare system aimed at improving their long-term outcomes and financial independence.
- Base Justice sector expense is projected to decrease from $5.5 billion in 2022–23 to $5.3 billion in 2025–26. This is primarily due to obligations under the Crown Liability and Proceedings Act, 2019 in 2022–23, which are recorded annually and are not included in forecasted expenses beyond 2022–23. The government continues to make investments in the Justice sector for key initiatives such as the Guns, Gangs and Violence Reduction Strategy in order to protect public safety.
- Base Other Programs expense is projected to increase from $32.6 billion in 2022–23 to $39.3 billion in 2025–26. Key changes include:
- $3.5 billion over three years, beginning in 2023–24, as part of the government’s multi-year commitment to improve access to high-speed internet for every community across Ontario by the end of 2025;
- $202 million per year starting in 2023–24 for the Homelessness Prevention Program and Indigenous Supportive Housing Program to help prevent and address homelessness;
- $224 million in 2023–24 to support the development and expansion of brick-and-mortar training centres to train more workers for careers in the skilled trades and other in-demand jobs through the Skills Development Fund — Capital Stream;
- $110 million over three years, beginning in 2023–24, to improve emergency readiness and enhance Ontario’s capacity to respond to emergencies; and
- Adequate Contingency Funds to help address emerging needs and risks through the medium-term planning horizon.
The total expense outlook includes Interest on Debt expense, which is projected to increase from $13.4 billion in 2022–23 to $15.1 billion in 2025–26.
Prudence Built into the Medium-Term Outlook
In keeping with sound fiscal planning practices, Ontario’s revenue outlook is based on prudent economic planning projections, as discussed in Chapter 2: Economic Performance and Outlook. Three external economic experts reviewed the Ontario Ministry of Finance’s economic assumptions and found them to be reasonable.2
Ontario incorporates prudence in the form of a reserve to protect the fiscal outlook against unforeseen adverse changes in the province’s revenue and expense, including those resulting from changes in Ontario’s economic performance. The reserve has been set at $1.0 billion in 2023–24, $2.0 billion in 2024–25 and $4.0 billion in 2025–26. These increases reflect Ontario’s commitment to maintaining a prudent and flexible fiscal plan that can respond to elevated economic uncertainty, notably higher levels of inflation and the impact of higher interest rates on the economy.
In addition, the Contingency Fund is maintained to help mitigate expense risks that may adversely affect Ontario’s fiscal performance. The Contingency Fund in 2023–24 is set at $4.0 billion, reflecting the government’s cautious, prudent and responsible fiscal planning.
Risks to the Expense Outlook
Table 3.9 provides a summary of key expense risks and sensitivities that could result from unexpected changes in economic conditions and program demands. A change in these factors could affect total expense and the public sector, causing variances in the overall fiscal forecast. These sensitivities illustrate possible effects on the government’s key programs and can vary, depending on the nature and composition of potential risks.
| Program/Sector | 2023–24 Assumption | 2023–24 Sensitivities |
|---|---|---|
| Hospital Costs (base)1 | Annual growth of 4.0 per cent | One per cent change in hospital costs: $238.3 million |
| COVID‑19 Testing | Cost per additional 10,000 diagnostic tests/day (lab processing) | Additional 10,000 COVID‑19 diagnostic tests: $0.52 million/day2 |
| Ontario Health Insurance Plan (OHIP) (base) | Annual growth of 5.3 per cent | One per cent change in OHIP expense: $182.0 million |
| Home Care3 | Approximately 36.8 million hours of personal support services | One per cent change in hours of personal support services: approximately $17.8 million |
| Home Care4 | Approximately 9.1 million nursing and therapy visits and 1.3 million nursing shifts | One per cent change in all nursing and therapy visits: approximately $11.2 million |
| Elementary and Secondary Schools | Approximately 2,037 million average daily pupil enrolment | One per cent enrolment change: approximately $175 million |
| Ontario Works | 235,777 average annual caseload | One per cent caseload change: approximately $28 million |
| Ontario Disability Support Program | 387,538 average annual caseload | One per cent caseload change: approximately $63 million |
| Interest on Debt | Average cost of borrowing in 2023–24 is forecast to be 4.60 per cent | In the first full year, the impact of a 100 basis-point change in borrowing rates: approximately $600 million |
Table 3.9 footnotes:
[1] Hospital costs are based on hospital operating transfer payments and exclude one-time funding for COVID‑19 and consolidations.
[2] Estimated cost per day is based on an average of $51.80 per test for tests conducted by the diagnostic lab network (lab processing only). Tests processed outside of the network are more expensive on a per-test basis.
[3], [4] Home Care statistics are based on a combination of 2021–22 and 2022–23 data and estimates.
Sources: Ontario Treasury Board Secretariat and Ontario Ministry of Finance.
Transparency and Risks
The government continues to be transparent about the state of Ontario’s finances. This principle is reflected in the Fiscal Sustainability, Transparency and Accountability Act, 2019, which stipulates that Ontario’s fiscal policy should be clearly articulated and information about it should be readily available to the public without charge.
To ensure a reasonable and prudent economic forecast, the government’s key economic planning projections are set below the average of private-sector forecasts in each year. While the planning assumptions for economic growth are reasonable and prudent, the Ontario Ministry of Finance has also developed Faster Growth and Slower Growth scenarios to provide greater transparency around the province’s economic outlook amid heightened economic uncertainty.
As a matter of transparent fiscal management, financial pressures are monitored throughout the fiscal year by the Ontario Treasury Board Secretariat, with the goal of ensuring that robust and prudent methodologies are used to develop forecasts. Other important risk management tools include closely tracking the pace of implementation of initiatives and proactively identifying emerging program and policy risks. Comprehensive analysis of known pressures informs the fiscal planning processes, including the development of plans to mitigate and manage fiscal pressures, as well as maintaining adequate contingencies as part of the medium-term fiscal projections.
In addition to the key demand sensitivities and economic risks to the fiscal plan, there are risks stemming from the government’s contingent liabilities. Whether future events will result in actual liabilities for the province is beyond the direct control of the government. For example, losses could result from legal settlements, a call on a loan, or funding guarantees. While a Contingency Fund is included in the fiscal plan to help mitigate expense risks, until there exists certainty around the likelihood and costs of these future events, these risks are not included in the province’s fiscal plan. Provisions for losses that are likely to occur and can be reasonably estimated are expensed and reported as liabilities in Ontario’s financial statements. Any significant contingent liabilities related to the 2022–23 fiscal year will be disclosed as part of the Public Accounts of Ontario 2022–2023, to be released later this year.
New Accounting Standards
The Public Sector Accounting Board (PSAB) has issued several changes to its standards for government financial reporting, including accounting for revenue, public–private partnerships, and purchased intangibles, which will impact the Public Accounts of Ontario 2023–2024. Where reasonably determinable, the government has included the estimated impact from the PSAB standards in this Budget.
Revenue
Section PS 3400, Revenue (PS 3400) provides guidance on the accounting and reporting for common types of revenue, except for government transfers, tax revenue, externally restricted revenues, investment income and income from government business enterprises/partnerships. It identifies two types of revenue transactions: exchange and non-exchange. Revenues from exchange transactions are recognized when or as the public-sector entities satisfy their performance obligation. In contrast, revenues from non-exchange transactions are recognized when the public-sector entities have authority to claim the revenue, and a past event giving rise to the claim has occurred. Previously, revenues were recognized in the fiscal year in which the events giving rise to the revenues occurred.
The adjustment on adoption of PS 3400 will have a favourable impact on both net debt and accumulated deficit for the province. Revenue streams requiring a change in the timing of revenue recognition have currently been identified and an estimate of the adjustment as a result of the transition to PS 3400 has been determined.
Public Private Partnerships
The Public Private Partnerships standard (PS 3160) provides guidance on the accounting and reporting for the assets procured via public private partnerships (P3), as well as any associated liabilities. P3s are arrangements where a private-sector partner is used to procure and finance infrastructure assets.
Ontario has identified and developed estimates for any P3 assets and liabilities that require recognition or measurement adjustments.
Purchased Intangible Assets
Amendments to Financial Statement Concepts (Section PS 1000) and Financial Statement Presentation (Section PS 1201) and new Public Sector Guideline (PSG) 8 (Purchased Intangible Assets) require purchased intangible assets to be capitalized. Purchased intangible assets are non-financial assets lacking physical substance that are purchased through an arm’s-length exchange transaction. The new requirements are being adopted by the province of Ontario on a prospective basis, meaning only intangible assets purchased on a go-forward basis are to be capitalized and amortized.
Details of Ontario’s Finances
| Actual 2020–21 |
Actual 2021–22 |
Interim1 2022–23 |
Plan 2023–24 |
|
|---|---|---|---|---|
| Taxation Revenue — Personal Income Tax | 40,333 | 46,750 | 52,841 | 55,982 |
| Taxation Revenue — Sales Taxes | 26,576 | 30,357 | 35,860 | 35,350 |
| Taxation Revenue — Corporations Tax | 17,775 | 25,227 | 27,928 | 24,668 |
| Taxation Revenue — Education Property Tax | 6,040 | 5,713 | 5,804 | 5,725 |
| Taxation Revenue — Employer Health Tax | 6,537 | 7,223 | 7,828 | 8,215 |
| Taxation Revenue — Ontario Health Premium | 4,330 | 4,414 | 4,663 | 4,896 |
| Taxation Revenue — Gasoline Tax | 1,898 | 2,202 | 2,030 | 2,222 |
| Taxation Revenue — Land Transfer Tax | 3,698 | 5,827 | 4,150 | 3,529 |
| Taxation Revenue — Tobacco Tax | 1,099 | 927 | 874 | 840 |
| Taxation Revenue — Fuel Tax | 686 | 771 | 586 | 635 |
| Taxation Revenue — Beer, Wine and Spirits Taxes | 624 | 624 | 626 | 617 |
| Taxation Revenue — Electricity Payments in Lieu of Taxes | 563 | 666 | 547 | 538 |
| Taxation Revenue — Ontario Portion of the Federal Cannabis Excise Duty | 106 | 215 | 253 | 269 |
| Taxation Revenue — Other Taxes | 619 | 759 | 665 | 735 |
| Taxation Revenue — Total | 110,884 | 131,675 | 144,657 | 144,222 |
| Government of Canada — Canada Health Transfer | 16,206 | 16,731 | 17,524 | 19,218 |
| Government of Canada — Canada Social Transfer | 5,815 | 6,003 | 6,178 | 6,384 |
| Government of Canada — Equalization | – | – | – | 421 |
| Government of Canada — Infrastructure Programs | 769 | 562 | 863 | 1,206 |
| Government of Canada — Labour Market Programs | 1,323 | 1,476 | 1,180 | 931 |
| Government of Canada — Social Housing Agreement | 338 | 305 | 263 | 218 |
| Government of Canada — Other Federal Payments | 9,014 | 5,091 | 4,728 | 5,996 |
| Government of Canada — Direct Transfers to Broader Public Sector Organizations | 459 | 439 | 522 | 470 |
| Government of Canada — Total | 33,924 | 30,607 | 31,259 | 34,844 |
| Income from Government Business Enterprises — Liquor Control Board of Ontario | 2,539 | 2,543 | 2,441 | 2,452 |
| Income from Government Business Enterprises — Ontario Power Generation Inc./Hydro One Ltd. | 2,044 | 2,151 | 1,460 | 1,126 |
| Income from Government Business Enterprises — Ontario Lottery and Gaming Corporation | 359 | 1,561 | 2,384 | 2,574 |
| Income from Government Business Enterprises — Ontario Cannabis Store | 67 | 186 | 225 | 194 |
| Income from Government Business Enterprises — Total | 5,009 | 6,441 | 6,510 | 6,345 |
| Other Non-Tax Revenue — Fees, Donations and Other Revenues from Hospitals, School Boards and Colleges | 7,790 | 9,688 | 10,385 | 11,104 |
| Other Non-Tax Revenue — Vehicle and Driver Registration Fees2 | 1,952 | 33 | 1,208 | 1,131 |
| Other Non-Tax Revenue — Miscellaneous Other Non-Tax Revenue | 1,857 | 2,625 | 1,900 | 1,943 |
| Other Non-Tax Revenue — Other Fees and Licences | 1,017 | 1,174 | 1,403 | 1,518 |
| Other Non-Tax Revenue — Sales and Rentals | 680 | 1,046 | 1,630 | 1,847 |
| Other Non-Tax Revenue — Reimbursements | 1,277 | 1,233 | 1,039 | 1,048 |
| Other Non-Tax Revenue — Royalties | 359 | 468 | 364 | 322 |
| Other Non-Tax Revenue — Power Supply Contract Recoveries | 116 | 67 | 46 | 43 |
| Other Non-Tax Revenue — Net Reduction of Power Purchase Contracts | 28 | 5 | – | – |
| Other Non-Tax Revenue — Other Non-Tax Revenue — Total | 15,076 | 16,339 | 17,976 | 18,956 |
| Total Revenue | 164,893 | 185,062 | 200,402 | 204,367 |
Table 3.10 footnotes:
[1] Interim represents the 2023 Budget projection for the 2022–23 fiscal year.
[2] Vehicle and Driver Registration Fees in 2021–22 reflect the elimination and rebate of eligible licence plate renewal fees paid since March 1, 2020.
Note: Numbers may not add due to rounding.
Source: Ontario Ministry of Finance.
| Ministry Expense | Actual 2020–21 |
Actual 2021–22 |
Interim3 2022–23 |
Plan 2023–24 |
|---|---|---|---|---|
| Agriculture, Food and Rural Affairs (Base) | 288 | 283 | 312 | 350.3 |
| Agriculture, Food and Rural Affairs — Demand-Driven Risk Management and Time-Limited Programs | 458 | 358 | 532 | 472.1 |
| Agriculture, Food and Rural Affairs — COVID‑19 Time-Limited Funding4 | 41 | 32 | 30 | – |
| Agriculture, Food and Rural Affairs (Total) | 787 | 674 | 874 | 822.4 |
| Attorney General (Base) | 1,523 | 1,622 | 1,869 | 1,919.2 |
| Attorney General — Statutory Appropriations — Crown Liability and Proceedings Act, 2019 | 60 | 49 | 101 | – |
| Attorney General — One-Time Accounting Adjustment for the Victim Fine Surcharges Program | 196 | – | – | – |
| Attorney General — COVID‑19 Time-Limited Funding5 | 71 | 145 | – | – |
| Attorney General (Total) | 1,850 | 1,816 | 1,970 | 1,919.2 |
| Board of Internal Economy (Base) | 248 | 283 | 305 | 304.8 |
| Board of Internal Economy — Provision for the Costs of General Election | – | – | 100 | – |
| Board of Internal Economy — COVID‑19 Time-Limited Funding6 | 0 | 2 | – | – |
| Board of Internal Economy (Total) | 248 | 284 | 405 | 304.8 |
| Children, Community and Social Services (Base) | 16,994 | 16,777 | 18,380 | 19,360.8 |
| Children, Community and Social Services — COVID‑19 Time-Limited Funding7 | 440 | 293 | 23 | – |
| Children, Community and Social Services (Total) | 17,433 | 17,071 | 18,403 | 19,360.8 |
| Citizenship and Multiculturalism (Base) | 23 | 33 | 58 | 64.1 |
| Citizenship and Multiculturalism - COVID‑19 Time—Limited Funding8 | – | 3 | 3 | – |
| Citizenship and Multiculturalism (Total) | 23 | 36 | 60 | 64.1 |
| Colleges and Universities (Base) | 8,767 | 9,539 | 10,243 | 10,757.2 |
| Colleges and Universities — Student Financial Assistance | 766 | 954 | 1,091 | 1,357.7 |
| Colleges and Universities — COVID‑19 Time-Limited Funding9 | 292 | 117 | 11 | – |
| Colleges and Universities (Total) | 9,826 | 10,610 | 11,345 | 12,114.8 |
| Economic Development, Job Creation and Trade (Base) | 162 | 164 | 165 | 188.9 |
| Economic Development, Job Creation and Trade — Tax Credits for Research and Development and Regional Investment10 | 218 | 304 | 321 | 299.2 |
| Economic Development, Job Creation and Trade — Ontario Made Manufacturing Investment Tax Credit | – | – | – | 215.0 |
| Economic Development, Job Creation and Trade — Time-Limited Investments | 187 | 157 | 503 | 606.8 |
| Economic Development, Job Creation and Trade — Bad Debt Expense | 211 | – | – | – |
| Economic Development, Job Creation and Trade — COVID‑19 Time-Limited Funding11 | 3,106 | 360 | 46 | – |
| Economic Development, Job Creation and Trade (Total) | 3,885 | 985 | 1,035 | 1,309.8 |
| Education (Base) | 28,389 | 28,837 | 32,394 | 34,712.1 |
| Education — Teachers’ Pension Plan | 1,607 | 1,610 | 1,662 | 1,711.0 |
| Education — COVID‑19 Time-Limited Funding12 | 2,885 | 1,060 | 969 | – |
| Education (Total) | 32,881 | 31,507 | 35,025 | 36,423.1 |
| Energy (Base) | 229 | 240 | 254 | 281.8 |
| Energy — Electricity Cost-Relief Programs | 5,539 | 6,313 | 5,946 | 6,516.8 |
| Energy — COVID‑19 Time-Limited Funding13 | 906 | 274 | – | – |
| Energy (Total) | 6,674 | 6,827 | 6,199 | 6,798.6 |
| Environment, Conservation and Parks (Base) | 632 | 687 | 725 | 782.6 |
| Environment, Conservation and Parks — COVID‑19 Time-Limited Funding14 | 3 | 16 | 17 | – |
| Environment, Conservation and Parks (Total) | 635 | 703 | 742 | 782.6 |
| Executive Offices (Base) | 45 | 49 | 55 | 60.8 |
| Executive Offices — Time-Limited Assistance | 2 | – | – | – |
| Executive Offices — COVID‑19 Time-Limited Funding15 | 6 | 2 | – | – |
| Executive Offices (Total) | 53 | 51 | 55 | 60.8 |
| Finance (Base) | 703 | 751 | 908 | 1,006.0 |
| Finance — Investment Management Corporation of Ontario16 | 128 | 210 | 259 | 298.8 |
| Finance — Ontario Municipal Partnership Fund | 502 | 502 | 502 | 501.9 |
| Finance — Temporary and Other Local Assistance | 21 | 21 | 21 | 81.0 |
| Finance — Power Supply Contract Costs | 116 | 67 | 46 | 42.9 |
| Finance — COVID‑19 Time-Limited Funding17 | 440 | 231 | – | – |
| Finance (Total) | 1,909 | 1,781 | 1,736 | 1,930.6 |
| Francophone Affairs (Base) | 5 | 7 | 7 | 7.7 |
| Francophone Affairs — Time-Limited Investments | – | – | 1 | – |
| Francophone Affairs — COVID‑19 Time-Limited Funding18 | 1 | 2 | – | – |
| Francophone Affairs (Total) | 6 | 9 | 8 | 7.7 |
| Health (Total)19 | 59,878 | 64,269 | 68,368 | 72,709.6 |
| COVID‑19 Health Response20 | 5,082 | 6,167 | 4,922 | – |
| Indigenous Affairs (Base) | 64 | 85 | 120 | 133.2 |
| Indigenous Affairs — One-Time Investments Including Settlements | 149 | 152 | 5,025 | – |
| Indigenous Affairs — COVID‑19 Time-Limited Funding21 | 42 | 4 | – | – |
| Indigenous Affairs (Total) | 256 | 241 | 5,145 | 133.2 |
| Infrastructure (Base) | 171 | 163 | 304 | 601.8 |
| Infrastructure — Federal–Provincial Infrastructure Programs | 161 | 267 | 365 | 492.2 |
| Infrastructure — Broadband | 67 | 75 | 179 | 783.2 |
| Infrastructure — Waterfront Toronto Revitalization (Port Lands Flood Protection) | 103 | 156 | 25 | – |
| Infrastructure — Municipal Infrastructure Program Investments | 197 | 399 | 396 | 398.4 |
| Infrastructure — Realty | 1,099 | 1,156 | 1,172 | 1,194.3 |
| Infrastructure — COVID‑19 Time-Limited Funding22 | 9 | 10 | – | – |
| Infrastructure (Total) | 1,807 | 2,226 | 2,442 | 3,469.8 |
| Labour, Immigration, Training and Skills Development (Base) | 170 | 102 | 243 | 236.4 |
| Labour, Immigration, Training and Skills Development — Training Tax Credits (Co-operative Education and Apprenticeship Training)23 | 98 | 105 | 68 | 93.5 |
| Labour, Immigration, Training and Skills Development — Demand-Driven Employment and Training Programs | 1,173 | 955 | 1,224 | 1,454.2 |
| Labour, Immigration, Training and Skills Development — COVID‑19 Time-Limited Funding24 | 33 | 794 | 475 | – |
| Labour, Immigration, Training and Skills Development (Total) | 1,473 | 1,957 | 2,009 | 1,784.1 |
| Long-Term Care (Total)25 | 4,514 | 5,300 | 6,513 | 8,299.7 |
| Mines (Base) | 85 | 135 | 163 | 172.3 |
| Mines — One-Time Accounting Adjustment for Contaminated Sites | – | 183 | 100 | – |
| Mines — COVID‑19 Time-Limited Funding26 | 0 | – | – | – |
| Mines (Total) | 86 | 318 | 263 | 172.3 |
| Municipal Affairs and Housing (Base) | 485 | 486 | 553 | 767.5 |
| Municipal Affairs and Housing — Time-Limited Investments | 224 | 351 | 415 | 480.0 |
| Municipal Affairs and Housing — Social Housing Agreement — Payments to Service Managers27 | 313 | 281 | 210 | 198.2 |
| Municipal Affairs and Housing — COVID‑19 Time-Limited Funding28 | 2,707 | 330 | 391 | – |
| Municipal Affairs and Housing (Total) | 3,729 | 1,447 | 1,570 | 1,445.6 |
| Natural Resources and Forestry (Base) | 505 | 607 | 612 | 688.3 |
| Natural Resources and Forestry — Emergency Forest Firefighting | 115 | 237 | 100 | 135.0 |
| Natural Resources and Forestry — One-Time Accounting Adjustment for Landfills | 202 | – | – | – |
| Natural Resources and Forestry — COVID‑19 Time-Limited Funding29 | 13 | 12 | – | – |
| Natural Resources and Forestry (Total) | 835 | 857 | 712 | 823.2 |
| Northern Development (Base) | 583 | 605 | 687 | 725.3 |
| Northern Development — COVID‑19 Time-Limited Funding30 | 0 | 41 | – | – |
| Northern Development (Total) | 583 | 646 | 687 | 725.3 |
| Public and Business Service Delivery (Base) | 549 | 629 | 1,211 | 1,130.6 |
| Public and Business Service Delivery — COVID‑19 Time-Limited Funding31 | 414 | 141 | 89 | – |
| Public and Business Service Delivery (Total) | 963 | 770 | 1,300 | 1,130.6 |
| Seniors and Accessibility (Base) | 55 | 53 | 63 | 64.9 |
| Seniors and Accessibility — Time-Limited Investments | – | – | 1 | – |
| Seniors and Accessibility — Seniors Tax Credits (Home Safety and Care at Home)32 | 10 | 30 | 164 | 120.0 |
| Seniors and Accessibility — COVID‑19 Time-Limited Funding33 | 151 | 43 | 15 | – |
| Seniors and Accessibility (Total) | 216 | 127 | 243 | 184.9 |
| Solicitor General (Base) | 2,807 | 2,981 | 3,529 | 3,431.1 |
| Solicitor General — COVID‑19 Time-Limited Funding34 | 94 | 150 | 2 | – |
| Solicitor General (Total) | 2,901 | 3,131 | 3,531 | 3,431.1 |
| Tourism, Culture and Sport (Base) | 691 | 858 | 843 | 840.2 |
| Tourism, Culture and Sport — Ontario Cultural Media Tax Credits | 512 | 693 | 833 | 906.1 |
| Tourism, Culture and Sport — Ontario Cultural Media Tax Credits — Amounts Related to Prior Years | 65 | 84 | 51 | – |
| Tourism, Culture and Sport — COVID‑19 Time-Limited Funding35 | 120 | 257 | 200 | – |
| Tourism, Culture and Sport (Total) | 1,388 | 1,893 | 1,927 | 1,746.3 |
| Transportation (Base) | 4,646 | 5,172 | 6,066 | 6,179.5 |
| Transportation — Federal–Provincial Infrastructure Programs | 449 | 231 | 353 | 729.2 |
| Transportation — COVID‑19 Time-Limited Funding36 | 2,188 | 369 | 585 | – |
| Transportation (Total) | 7,283 | 5,773 | 7,004 | 6,908.7 |
| Treasury Board Secretariat (Base) | 296 | 315 | 366 | 497.4 |
| Treasury Board Secretariat — Employee and Pensioner Benefits | 1,485 | 2,633 | 1,286 | 1,260.7 |
| Treasury Board Secretariat — One-Time Investments | – | – | 1,250 | – |
| Treasury Board Secretariat — Operating Contingency Fund | – | – | 1,653 | 3,893.7 |
| Treasury Board Secretariat — Capital Contingency Fund | – | – | 97 | 106.3 |
| Treasury Board Secretariat — COVID‑19 Time-Limited Funding37 | 3 | 2 | 1 | – |
| Treasury Board Secretariat (Total) | 1,784 | 2,950 | 4,654 | 5,758.1 |
| Interest on Debt38 | 12,308 | 12,587 | 13,424 | 14,058.0 |
| Total Expense | 181,297 | 183,011 | 202,572 | 204,680.0 |
Table 3.11 footnotes:
[1] Numbers reflect current ministry structure.
[2] Ministry expenses have been restated for reclassification and program transfer changes. These changes are fiscally neutral. The actual results are presented on a similar basis for consistency.
[3] Interim represents the 2023 Budget projection for the 2022–23 fiscal year.
[4], [5], [6], [7], [8], [9], [11], [12], [13], [14], [15], [17], [18], [21], [22], [24], [26], [28], [29], [30], [31], [33], [34], [35], [36], [37] In the 2021 Budget, the government made available COVID‐19 Time‐Limited Funding. This funding will no longer be reported separately, starting 2023–24.
[10] Includes the estimated cost of tax credit claims for the Ontario Innovation Tax Credit, Ontario Business-Research Institute Tax Credit and the Regional Opportunities Investment Tax Credit (ROITC). Figures from 2020–21 to 2022–23 include tax credit amounts related to prior years, except for the ROITC in 2020–21. $35 million in 2022–23 was previously shown under COVID‑19 Time-Limited Funding.
[16] Based on the requirements of Public Sector Accounting Standards, the government consolidates the Investment Management Corporation of Ontario into the Ontario Ministry of Finance.
[19] Includes accounting adjustments tied primarily to grants provided for infrastructure projects and other related investments.
[20] For presentation purposes in the 2023 Budget, Time-Limited COVID‑19-related health response spending has been included separately for 2020–21 to 2022–23, instead of within the Ontario Ministry of Health and Ontario Ministry of Long-Term Care.
[23] The Co-operative Education Tax Credit remains in effect. The Apprenticeship Training Tax Credit is eliminated for eligible apprenticeship programs that commenced on or after November 15, 2017. Amounts from 2020–21 to 2022–23 include tax credit amounts related to prior years.
[25] The Ontario Ministry of Long-Term Care total includes expenses incurred by Ontario Health for funding for long-term care. These amounts will be consolidated in the total expense of the Ontario Ministry of Health, including $4.5 billion for interim 2022–23 and $5.2 billion in 2023–24.
[27] The annual decline from 2020–21 to 2023–24 is mainly due to declining federal obligations, such as maturing mortgages, under the Social Housing Agreement.
[32] $25 million of Seniors Tax Credits in 2022–23 was previously shown under COVID‑19 Time-Limited Funding.
[38] Interest on debt is net of interest capitalized during construction of tangible capital assets of $321 million in 2021–22, $479 million in 2022–23 and $573 million in 2023–24.
Note: Numbers may not add due to rounding.
Sources: Ontario Treasury Board Secretariat and Ontario Ministry of Finance.
| Sector | Total Infrastructure Expenditures Interim1,2 2022–23 |
2023–24 Plan Investment in Capital Assets3 |
2023–24 Plan Transfers and Other Infrastructure Expenditures4 |
2023–24 Plan Total Infrastructure Expenditures |
|---|---|---|---|---|
| Transportation — Transit | 6,837 | 6,195 | 1,276 | 7,471 |
| Transportation — Provincial Highways | 2,790 | 3,098 | 95 | 3,193 |
| Transportation — Other Transportation, Property and Planning | 237 | 157 | 79 | 236 |
| Health — Hospitals | 3,186 | 3,348 | 1 | 3,349 |
| Health — Other Health | 406 | 77 | 504 | 581 |
| Education | 2,944 | 2,777 | 226 | 3,003 |
| Postsecondary Education — Colleges and Other | 894 | 614 | 90 | 705 |
| Postsecondary Education — Universities | 117 | – | 124 | 124 |
| Social | 342 | 32 | 337 | 369 |
| Justice | 516 | 790 | 11 | 801 |
| Other Sectors5 | 2,345 | 1,121 | 2,546 | 3,667 |
| Total Infrastructure Expenditures | 20,615 | 18,210 | 5,289 | 23,499 |
| Less: Other Partner Funding6 | 3,264 | 2,560 | 304 | 2,864 |
| Total7 | 17,351 | 15,650 | 4,985 | 20,635 |
Table 3.12 footnotes:
[1] Interim represents the 2023 Budget projection for the 2022–23 fiscal year.
[2] Includes provincial investment in capital assets of $11.9 billion.
[3] Includes $573 million in interest capitalized during construction.
[4] Includes transfers to municipalities, universities and non-consolidated agencies.
[5] Includes broadband infrastructure, government administration, natural resources, and the culture and tourism industries.
[6] Other Partner Funding refers to third-party investments primarily in hospitals, colleges and schools.
[7] Includes Federal–Municipal contributions to provincial infrastructure investments.
Note: Numbers may not add due to rounding.
Source: Ontario Treasury Board Secretariat.
| 2014–15 | 2015–16 | 2016–17 | 2017–18 | 2018–19 | 2019–20 | 2020–21 | Actual 2021–22 |
Interim5 2022–23 |
Plan 2023–24 |
|
|---|---|---|---|---|---|---|---|---|---|---|
| Revenue | 126,152 | 136,148 | 140,734 | 150,594 | 153,700 | 156,096 | 164,893 | 185,062 | 200,402 | 204,367 |
| Expense — Programs | 126,199 | 129,905 | 131,442 | 142,344 | 148,732 | 152,253 | 168,989 | 170,424 | 189,148 | 190,622 |
| Expense — Interest on Debt3 | 11,221 | 11,589 | 11,727 | 11,922 | 12,403 | 12,515 | 12,308 | 12,587 | 13,424 | 14,058 |
| Total Expense | 137,420 | 141,494 | 143,169 | 154,266 | 161,135 | 164,768 | 181,297 | 183,011 | 202,572 | 204,680 |
| Reserve | – | – | – | – | – | – | – | – | – | 1,000 |
| Surplus/(Deficit) | (11,268) | (5,346) | (2,435) | (3,672) | (7,435) | (8,672) | (16,404) | 2,051 | (2,170) | (1,313) |
| Net Debt | 294,557 | 306,357 | 314,077 | 323,834 | 338,496 | 353,332 | 373,564 | 380,415 | 395,785 | 406,411 |
| Accumulated Deficit | 196,665 | 203,014 | 205,939 | 209,023 | 216,642 | 225,764 | 239,294 | 236,857 | 242,763 | 243,438 |
| Gross Domestic Product (GDP) at Market Prices | 727,042 | 760,435 | 790,749 | 824,979 | 860,104 | 893,224 | 866,981 | 956,707 | 1,046,883 | 1,076,440 |
| Primary Household Income | 490,423 | 512,570 | 520,486 | 541,501 | 567,484 | 593,065 | 592,460 | 644,263 | 705,280 | 738,162 |
| Population (000s) — July4 | 13,618 | 13,707 | 13,875 | 14,070 | 14,309 | 14,545 | 14,726 | 14,809 | 15,109 | 15,366 |
| Net Debt per Capita (dollars) | 21,631 | 22,350 | 22,636 | 23,016 | 23,657 | 24,293 | 25,368 | 25,688 | 26,195 | 26,449 |
| Household Income per Capita (dollars) | 36,014 | 37,394 | 37,511 | 38,486 | 39,660 | 40,775 | 40,232 | 43,504 | 46,678 | 48,039 |
| Net Debt as a Per Cent of Revenue | 233.5% | 225.0% | 223.2% | 215.0% | 220.2% | 226.4% | 226.5% | 205.6% | 197.5% | 198.9% |
| Interest on Debt as a Per Cent of Revenue | 8.9% | 8.5% | 8.3% | 7.9% | 8.1% | 8.0% | 7.5% | 6.8% | 6.7% | 6.9% |
| Net Debt as a Per Cent of GDP | 40.5% | 40.3% | 39.7% | 39.3% | 39.4% | 39.6% | 43.1% | 39.8% | 37.8% | 37.8% |
| Accumulated Deficit as a Per Cent of GDP | 27.1% | 26.7% | 26.0% | 25.3% | 25.2% | 25.3% | 27.6% | 24.8% | 23.2% | 22.6% |
Table 3.13 footnotes:
[1] Amounts reflect a change in pension expense that was calculated based on recommendations of the Independent Financial Commission of Inquiry, as described in Note 19 to the Consolidated Financial Statements, in Public Accounts of Ontario 2017–2018. Amounts for net debt and accumulated deficit also reflect this change.
[2] Revenues and expenses have been restated to reflect the change in presentation of third-party revenue for hospitals, school boards and colleges to be reported as revenue.This restatement is fiscally neutral.
[3] Interest on debt is net of interest capitalized during construction of tangible capital assets of $321 million in 2021–22, $479 million in 2022–23 and $573 million in 2023–24.
[4] Population figures are for July 1 of the fiscal year indicated (i.e., for 2017–18, the population on July 1, 2017, is shown).
[5] Interim represents the 2023 Budget projection for the 2022–23 fiscal year.
Note: Numbers may not add due to rounding.
Sources: Statistics Canada, Ontario Treasury Board Secretariat, and Ontario Ministry of Finance.
Footnotes
[1] Potential liability for these claims is recorded if the settlement of the claim is assessed as likely and the amount of the settlement can be reasonably estimated.
[2] The three experts are from the Policy and Economic Analysis Program at the University of Toronto; Quantitative Economic Decisions, Inc.; and Stokes Economic Consulting, Inc.
Chart Descriptions
Chart 3.1: Current Fiscal Outlook Compared to 2022 Budget
The bar chart illustrates the fiscal outlook presented in the 2022 Budget compared to the current outlook in the 2023 Budget. The 2022 Budget projected deficits of $19.9 billion in 2022–23, $12.3 billion in 2023–24, $7.6 billion in 2024–25 and $5.0 billion in 2025–26. With the release of the 2023 Budget, the deficit projections have been revised to $2.2 billion in 2022–23, $1.3 billion in 2023–24, and surpluses of $0.2 billion in 2024–25 and $4.4 billion in 2025–26.
Source: Ontario Ministry of Finance.
Chart 3.2: Ontario Medium-Term Outlook Based on Alternative Scenarios
The bar chart illustrates the range of Ontario fiscal outlooks based on the two alternative economic scenarios presented in Chapter 2: Economic Performance and Outlook. The 2023 Budget outlook estimates the deficit to be $1.3 billion in 2023–24, a surplus of $0.2 billion in 2024–25 and a surplus of $4.4 billion in 2025–26. Under the Faster Growth scenario, the surplus outlook is estimated to be $4.4 billion in 2023–24, $8.9 billion in 2024–25 and $16.0 billion in 2025–26. Under the Slower Growth scenario, the deficit outlook is estimated to be $5.0 billion in 2023–24, $5.8 billion in 2024–25 and $3.8 billion in 2025–26.
Source: Ontario Ministry of Finance.
Chart 3.3: Program Expense Growth
The bar chart shows program expense growth from 2020–21 to 2025–26 excluding COVID‑19 Time-Limited Funding and Other One-Time Expenses. For 2020–21, base program expense, excluding COVID‑19 Time-Limited Funding and Other One-Time Expenses, is $149.9 billion, $159.6 billion in 2021–22, $175.1 billion in 2022–23, $190.6 billion in 2023–24, $196.4 billion in 2024–25 and $202.5 billion in 2025–26.
There are only three fiscal years from 2020–21 to 2022–23 where COVID‑19 Time-Limited Funding is included as part of total program expense. In 2020–21, COVID‑19 Time-Limited Funding of $19.1 billion increases total program expense to $169.0 billion. In 2021–22, COVID‑19 Time-Limited Funding of $10.9 billion increases total program expense to $170.4 billion. In 2022–23, COVID‑19 Time-Limited Funding of $7.8 billion as well as $6.3 billion for Other One-Time Expenses, increases total program expense to $189.1 billion.
Note: Numbers may not add due to rounding.
Sources: Ontario Treasury Board Secretariat and Ontario Ministry of Finance.
Chart 3.4: Additional Federal Health Funding to Ontario
This chart illustrates that the additional dollars Ontario is investing into health care in the 2023 Budget significantly exceed the new federal health funding. Ontario will receive a total of $4.4 billion in new federal health funding over three years: $1.8 billion in 2023–24, $1.1 billion in 2024–25 and $1.5 billion in 2025–26, while Ontario will make incremental health care investments of $15.3 billion over three years: $3.2 billion in 2023–24, $5.9 billion in 2024–25 and $6.2 billion in 2025–26.
Note: The new federal health funding includes a one-time additional health care payment, time-limited funding for shared priorities and an enhancement of the Canada Health Transfer. Funding under existing Canada–Ontario agreements is not included (i.e., 10-year agreement on shared health priorities, including Home and Community Care and Mental Health and Addictions). All federal health funding amounts are notional and estimated based on population and nominal GDP forecasts, which are subject to change.
Sources: Department of Finance Canada and Ontario Ministry of Finance.
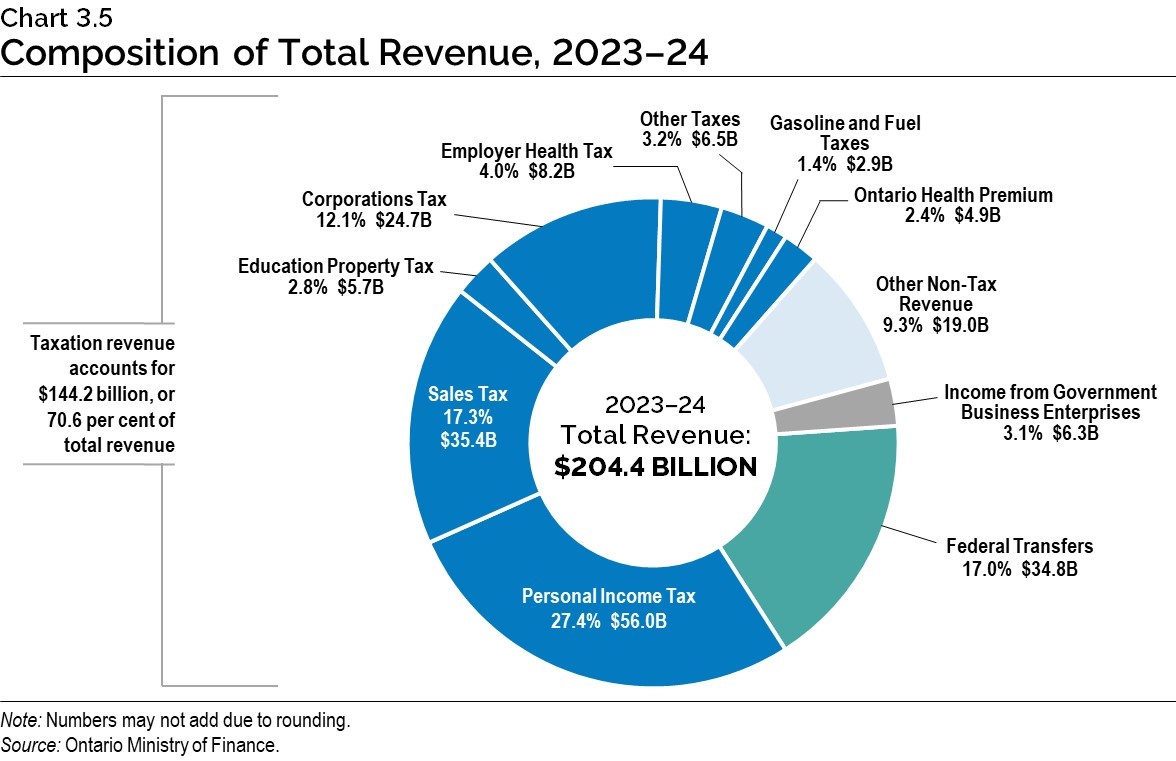
Chart 3.5: Composition of Total Revenue, 2023–24
The pie chart shows the composition of Ontario’s revenue in 2023–24, which is projected to be $204.4 billion. The largest taxation revenue source is Personal Income Tax revenue at $56.0 billion, accounting for 27.4 per cent of total revenue. This is followed by Sales Tax at $35.4 billion, or 17.3 per cent of total revenue; and Corporations Tax at $24.7 billion, or 12.1 per cent of total revenue. Other components of taxation revenue include Education Property Tax at $5.7 billion, or 2.8 per cent of total revenue; Employer Health Tax at $8.2 billion, or 4.0 per cent; Gasoline Tax and Fuel Tax at $2.9 billion, or 1.4 per cent; the Ontario Health Premium at $4.9 billion, or 2.4 per cent; and Other Taxes at $6.5 billion, or 3.2 per cent of total revenue.
Total taxation revenue accounts for $144.2 billion, or 70.6 per cent of total revenue.
The other major non-taxation sources of revenue are Federal Transfers of $34.8 billion, or 17.0 per cent of total revenue; Income from Government Business Enterprises at $6.3 billion, or 3.1 per cent of total revenue; and various Other Non-Tax Revenue at $19.0 billion, or 9.3 per cent of total revenue.
Note: Numbers may not add due to rounding.
Source: Ontario Ministry of Finance.
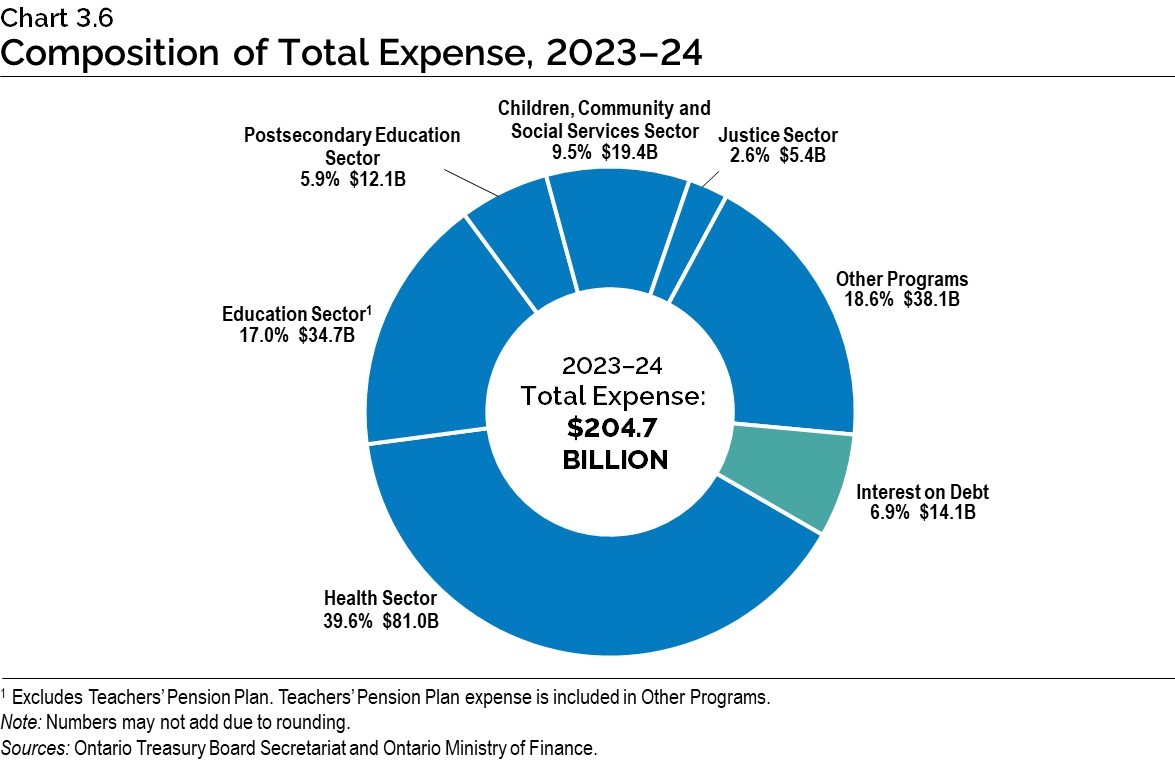
Chart 3.6: Composition of Total Expense, 2023–24
The pie chart shows the share of Ontario’s total expense and dollar amounts by sector in 2023–24.
Total expense in 2023–24 is projected to be $204.7 billion.
The largest expense is the Health Sector at $81.0 billion, accounting for 39.6 per cent of total expense.
The remaining sectors of total expense include the Education Sector* at $34.7 billion or 17.0 per cent; the Postsecondary Education Sector at $12.1 billion or 5.9 per cent; the Children, Community and Social Services Sector at $19.4 billion or 9.5 per cent; the Justice Sector at $5.4 billion or 2.6 per cent; Other Programs at $38.1 billion or 18.6 per cent; and Interest on Debt, included as part of Total Expense, is $14.1 billion or 6.9 per cent.
* Excludes the Teachers’ Pension Plan. Teachers’ Pension Plan expense is included in Other Programs.
Note: Numbers may not add due to rounding.
Sources: Ontario Treasury Board Secretariat and Ontario Ministry of Finance.