Introduction
As Ontario continues on its path to balance the budget, the borrowing program remains responsibly and prudently managed to minimize interest on debt (IOD) costs.
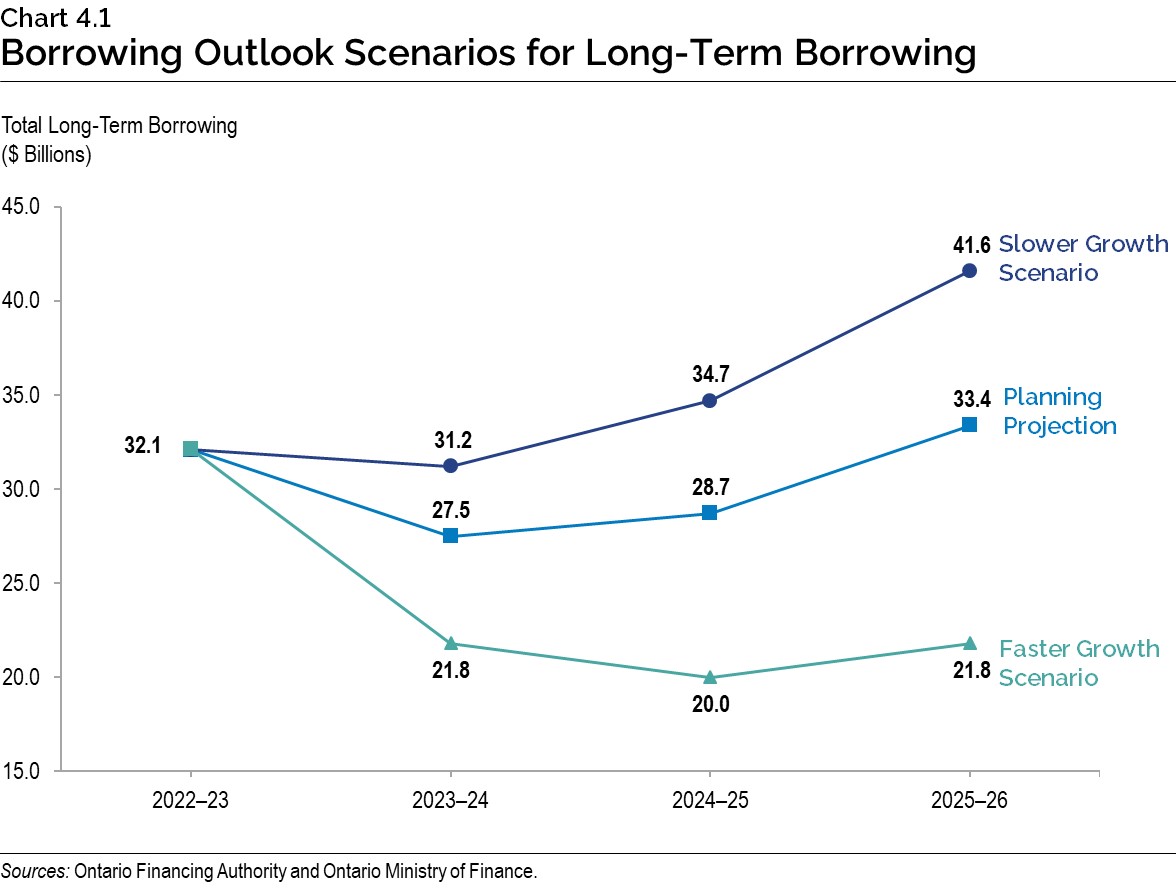
Ontario completed $32.1 billion in long-term borrowing in 2022–23. This is $9.3 billion lower than anticipated in the 2022 Budget forecast, as a result of lower than projected deficits. The 2023–24 and 2024–25 long-term public borrowing forecasts are $27.5 billion and $28.7 billion, a decrease of $17.1 billion and $10.2 billion from the 2022 Budget forecast, respectively.
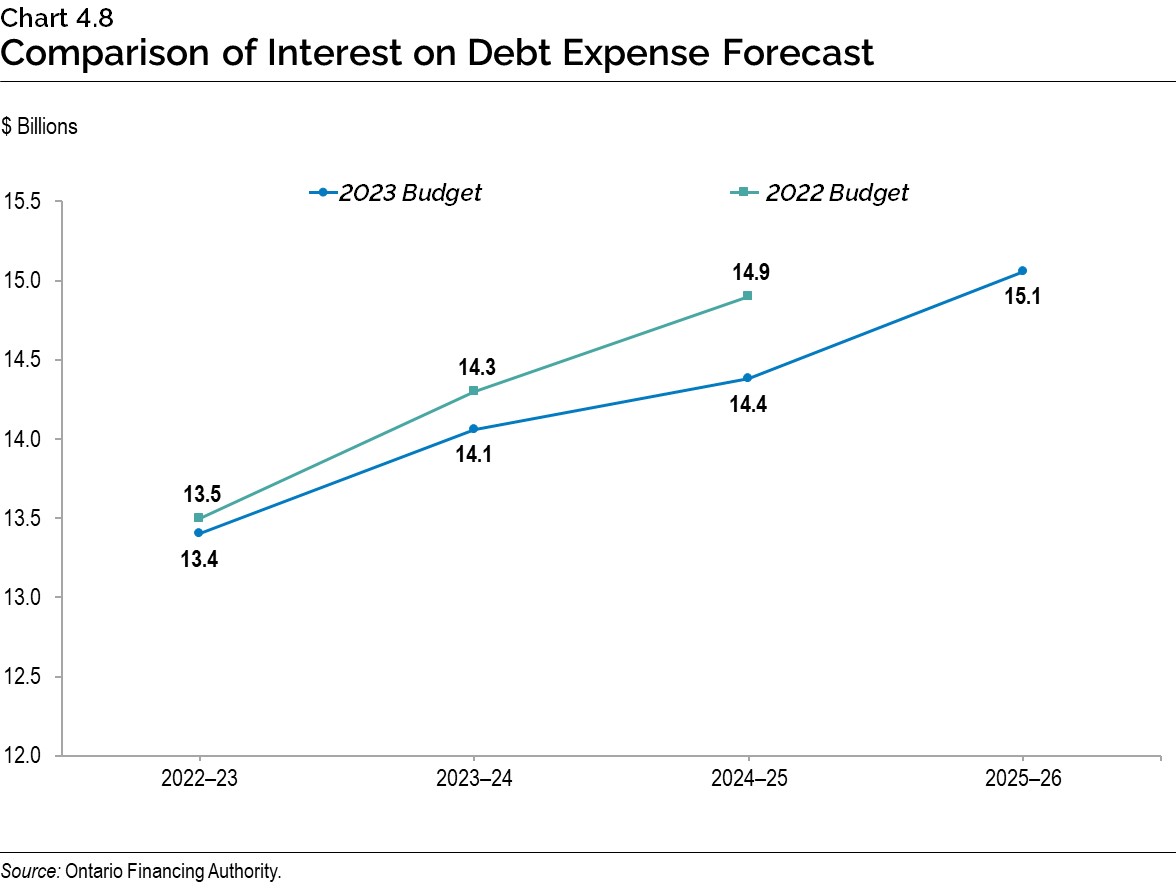
Ontario is forecast to pay $13.4 billion in interest costs in 2022–23, $14.1 billion in 2023–24 and $14.4 billion in 2024–25, down from the 2022 Budget forecasts of $13.5 billion, $14.3 billion and $14.9 billion, respectively. These lower interest costs total a cumulative savings of $0.8 billion over three years and are a result of smaller borrowing programs, partially offset by higher than projected interest rates.
Had the borrowing program stayed the same as in the 2022 Budget, given higher interest rates forecast today, interest on debt would have been $0.3 billion higher in 2022–23, $0.7 billion higher in 2023–24 and $0.7 billion higher in 2024–25.
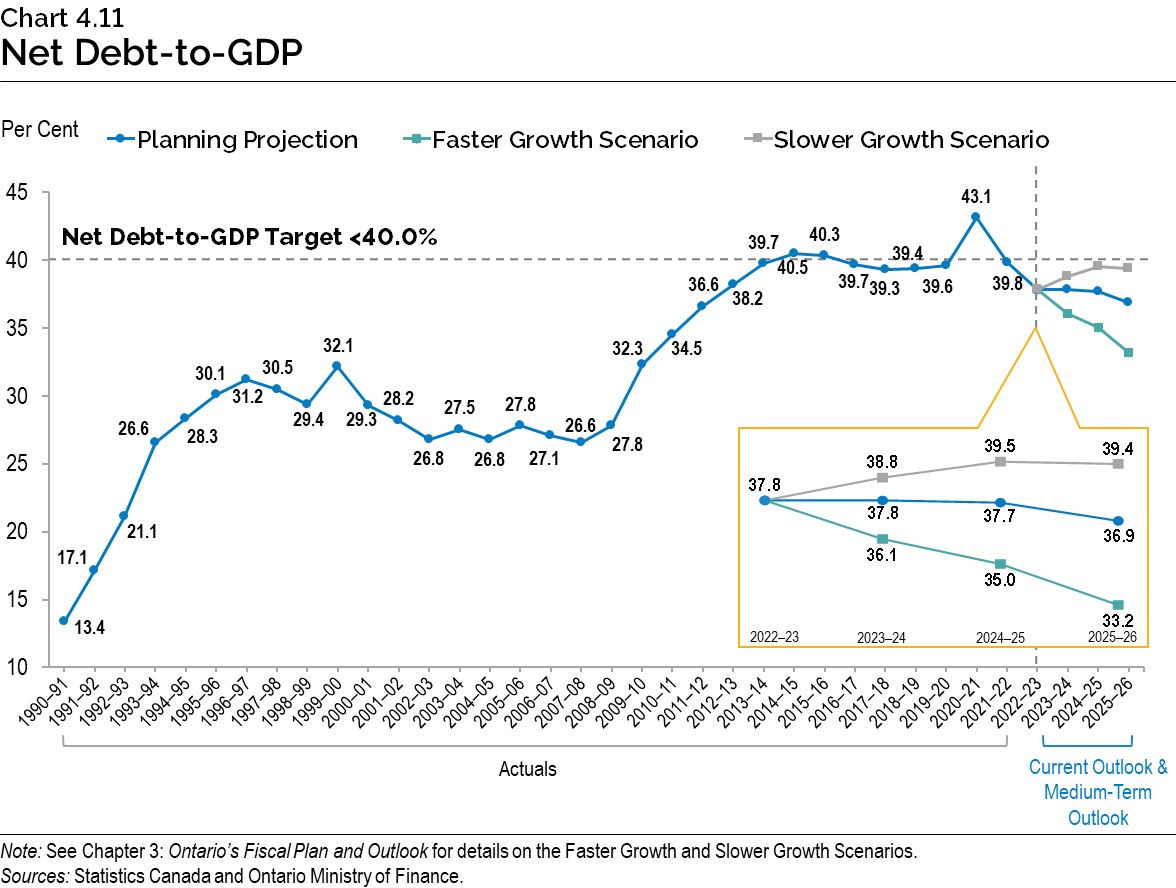
Ontario’s net debt-to-GDP ratio is now forecast to be 37.8 per cent in 2022–23 and 2023–24, and 37.7 per cent in 2024–25, down 3.6 percentage points for each fiscal year, respectively, from the forecasts of 41.4 per cent for 2022–23 and 2023–24, and 41.3 per cent for 2024–25 in the 2022 Budget.
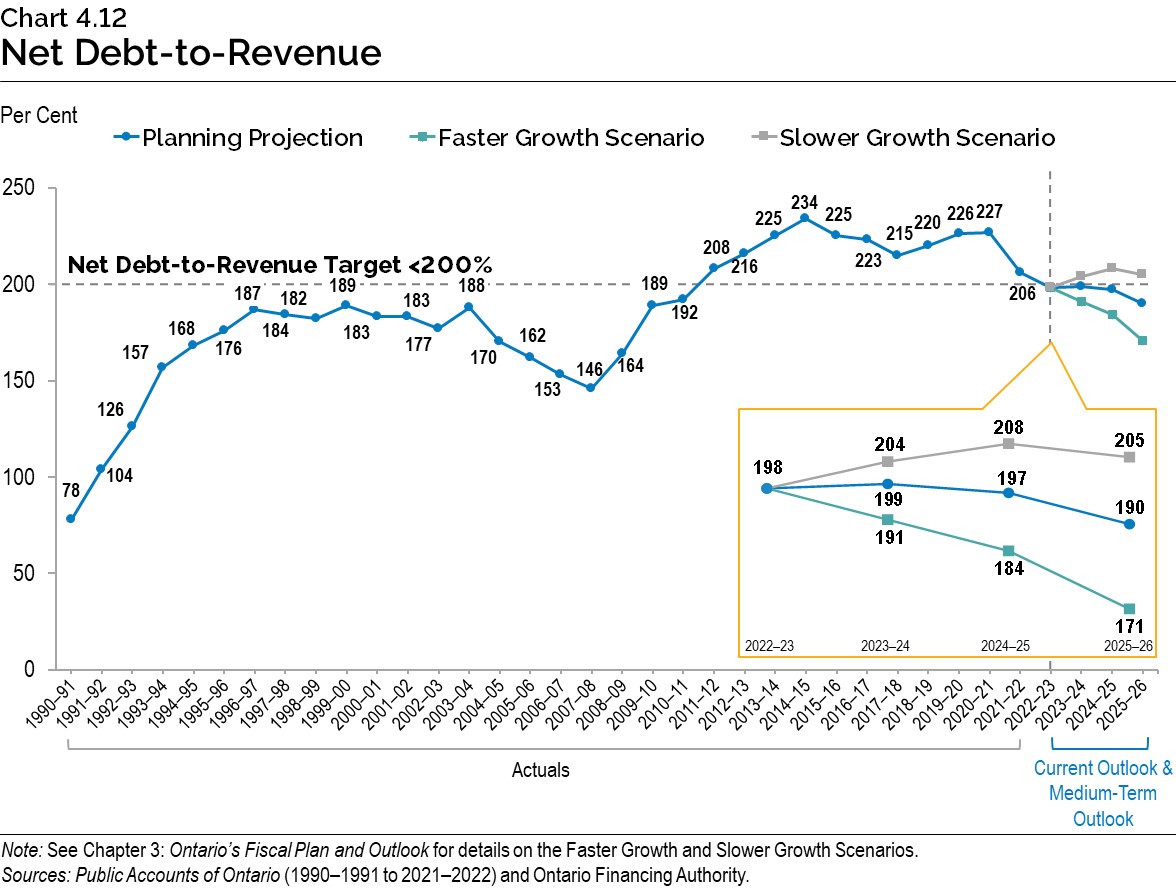
Ontario’s net debt-to-revenue is forecast to be 198 per cent in 2022–23, 199 per cent in
2023–24 and 197 per cent in 2024–25, a decrease of 40 percentage points for 2022–23 and 2023–24, and 41 percentage points for 2024–25, from the 2022 Budget forecast.
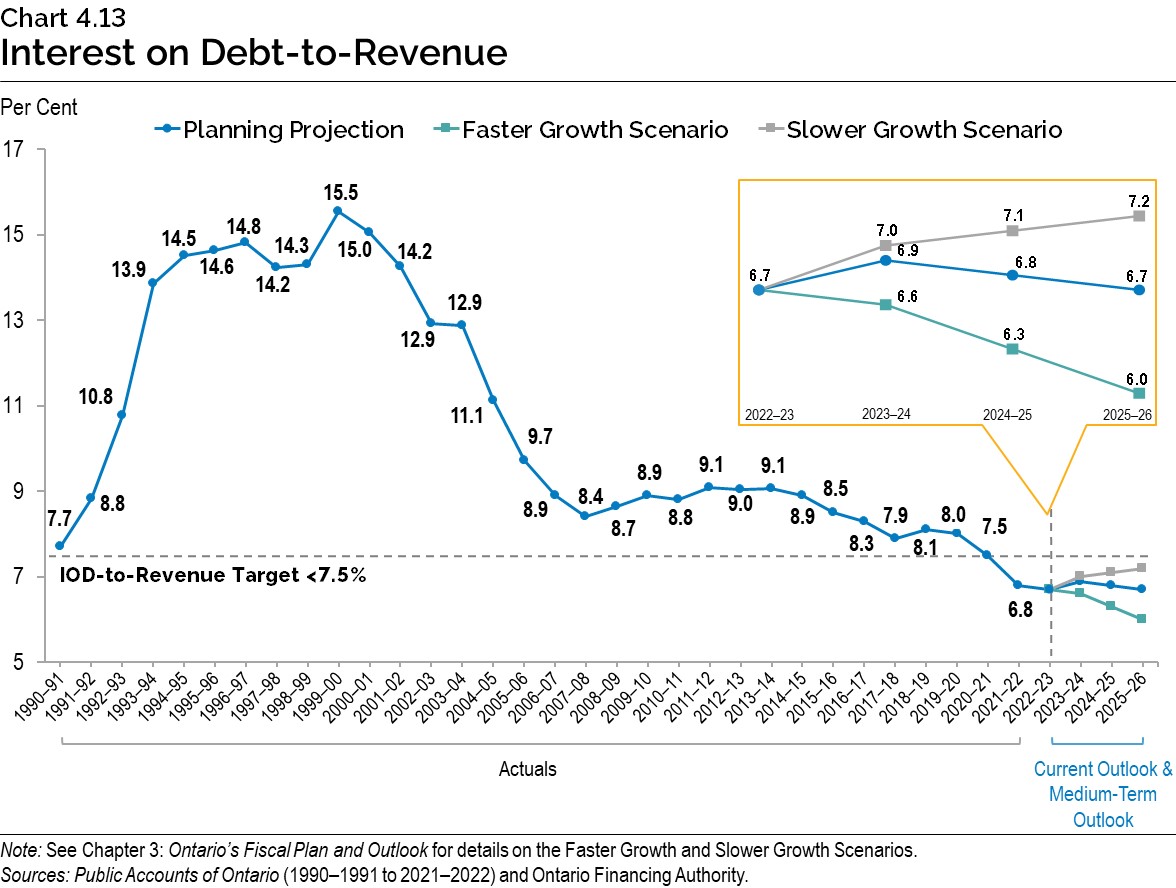
Ontario’s interest on debt-to-revenue is forecast to be 6.7 per cent in 2022–23, 6.9 per cent in 2023–24, and 6.8 per cent in 2024–25, a decrease of 0.8 percentage points, 0.7 percentage points, and 0.8 percentage points, respectively, from the 2022 Budget forecast.
Borrowing Program
Ontario’s borrowing program is primarily used to refinance maturing debt, make investments in capital assets and fund deficits, when applicable. Ontario will continue to finance most of its borrowing program in the long-term public markets in Canada and internationally.
| 2022–23 — 2022 Budget |
2022–23 — Change from 2022 Budget |
2022–23 — Interim1 2022–23 |
Medium-Term Outlook 2023–24 |
Medium-Term Outlook 2024–25 |
Medium-Term Outlook 2025–26 |
|
|---|---|---|---|---|---|---|
| Deficit/(Surplus) | 19.9 | (17.7) | 2.2 | 1.3 | (0.2) | (4.4) |
| Investment in Capital Assets | 13.4 | (1.5) | 11.9 | 13.6 | 18.6 | 18.8 |
| Non-Cash and Cash Timing Adjustments | (9.7) | (8.1) | (17.8) | (9.2) | (11.7) | (14.0) |
| Loans to Infrastructure Ontario | (0.1) | (0.1) | (0.2) | 0.1 | 0.1 | 0.2 |
| Other Net Loans/Investments | 0.7 | (0.8) | (0.1) | 0.1 | (1.0) | (0.2) |
| Debt Maturities/Redemptions | 30.5 | 0.0 | 30.6 | 31.2 | 27.9 | 33.1 |
| Total Funding Requirement | 54.7 | (28.1) | 26.6 | 37.0 | 33.7 | 33.4 |
| Decrease/(Increase) in Short-Term Borrowing | (3.0) | 4.3 | 1.3 | – | – | – |
| Increase/(Decrease) in Cash and Cash Equivalents | – | – | – | 5.0 | (5.0) | – |
| Pre-borrowing in 2021–22 for 2022–23 | (10.3) | – | (10.3) | – | – | – |
| Pre-borrowing for 2023–24 | – | 14.5 | 14.5 | (14.5) | – | – |
| Total Long-Term Borrowing | 41.5 | (9.3) | 32.1 | 27.5 | 28.7 | 33.4 |
Table 4.1 footnotes:
[1] Interim represents the 2023 Budget projection for the 2022–23 fiscal year.
Note: Numbers may not add due to rounding.
Source: Ontario Financing Authority.
Ontario’s long-term borrowing requirement for 2022–23 decreased by $9.3 billion from the 2022 Budget forecast. This is primarily due to the stronger financial results reported in the Public Accounts of Ontario 2021–2022, the lower than forecast deficit for 2022–23, and is partially offset by pre-borrowing for 2023–24. Ontario has completed long‑term borrowing for 2022–23 of $32.1 billion, including $14.5 billion in pre‑borrowing for 2023–24.
The 2022 Budget forecasted an increase of $3.0 billion in short-term borrowing in 2022–23 and 2023–24. However, the lower deficit allowed Ontario to decrease the amount outstanding in its short-term borrowing program by $1.3 billion in 2022–23 and to leave it unchanged in 2023–24. This resulted in a net $4.3 billion reduction in the short-term borrowing program in 2022–23 compared to the 2022 Budget forecast.
The total long-term borrowing requirements for 2022–23 through 2024–25 are now forecast to be a cumulative $36.6 billion lower than forecast in the medium-term outlook in the 2022 Budget. This includes a decrease of $17.1 billion for 2023–24 and $10.2 billion for 2024–25. Ontario’s cash balance will increase by $5.0 billion in 2023–24 in anticipation of the need to pay down large debt maturities in early 2024–25.
Had the borrowing program stayed the same as in the 2022 Budget, given higher interest rates forecast today, interest on debt would have been $0.3 billion higher in 2022–23, $0.7 billion higher in 2023–24 and $0.7 billion higher in 2024–25. Ontario’s annual long-term borrowing program in 2023–24 is forecast to be the lowest borrowing program since 2016–17.
In the event that alternative economic scenarios materialize, Ontario’s borrowing requirements in the next three years would also change (see Chapter 3: Ontario’s Fiscal Plan and Outlook for more details, and a description of the resulting alternative medium-term outlook scenarios). Under the Faster Growth scenario, long-term borrowing would decrease by a total of $26.0 billion over the three-year outlook period, while under the Slower Growth scenario, long‑term borrowing would increase by $17.9 billion over the same period.
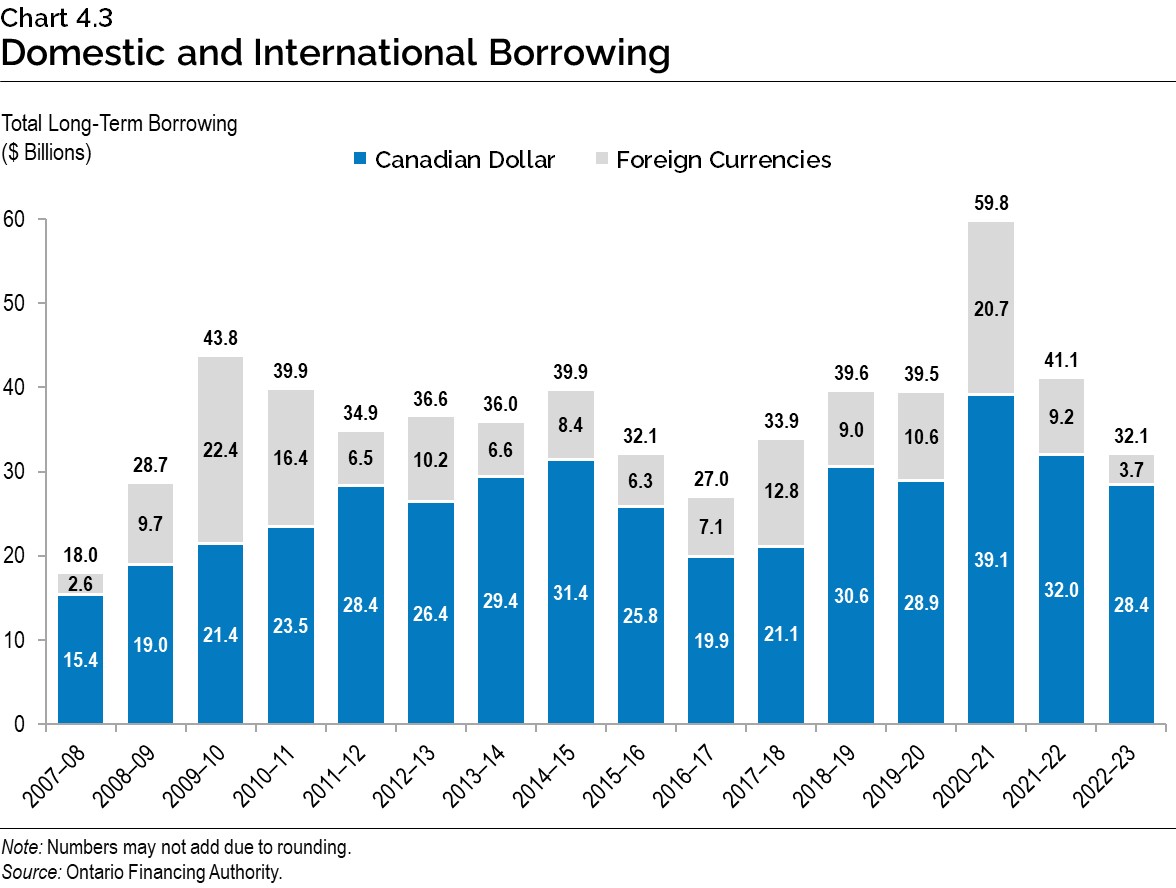
Approximately 88 per cent of 2022–23 borrowing was completed in Canadian dollars, primarily through 30 syndicated issues and two Green Bonds. This percentage is above Ontario’s target range for domestic borrowing of 65 to 80 per cent for the 2022–23 fiscal year. Based on the combined experience of the last five fiscal years, Ontario’s target range for domestic borrowing will be 75 to 90 per cent in 2023–24. Ontario will adjust, if necessary, in response to evolving investor demand in the Canadian dollar and foreign currency markets.
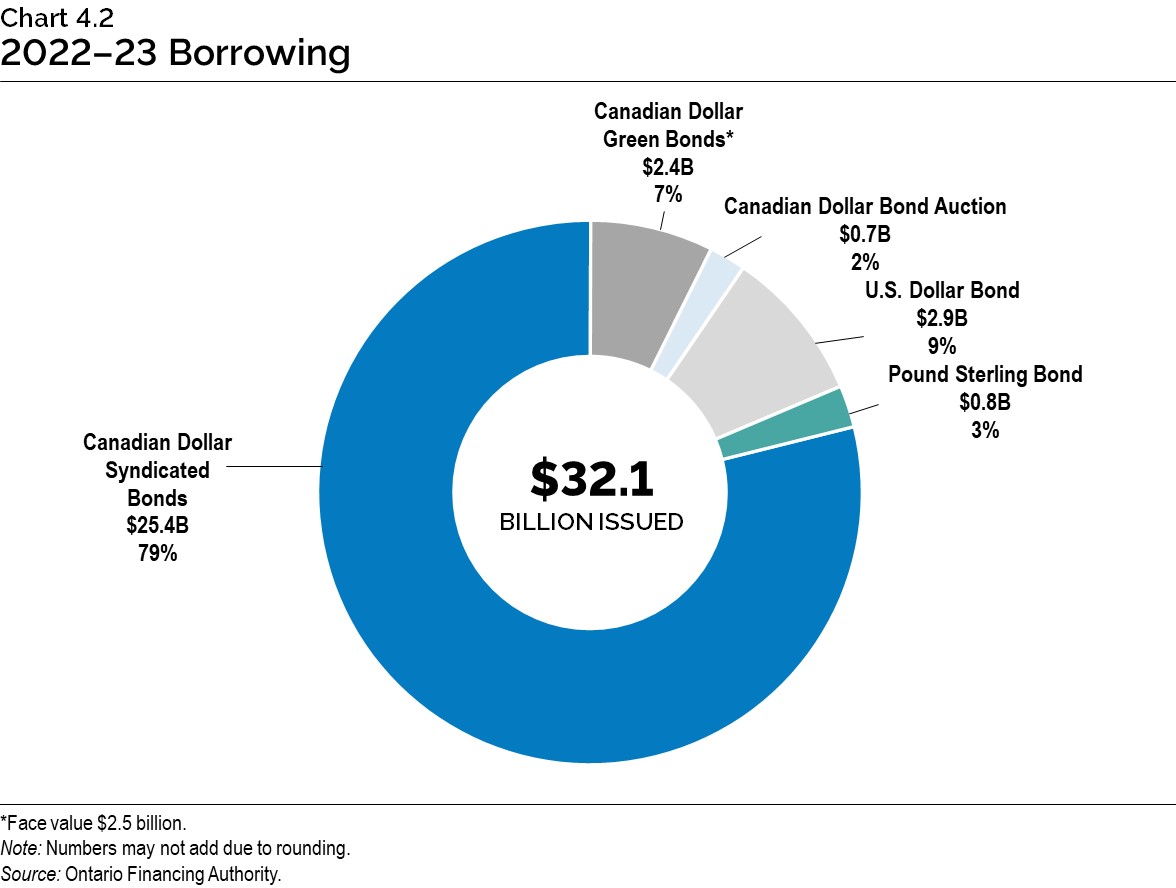
Foreign currency borrowing helps reduce Ontario’s overall borrowing costs by continuing to diversify Ontario’s investor base. This diversification ensures the government will continue to have access to capital even if domestic market conditions become challenging. Approximately $3.7 billion, or 12 per cent of this year’s long-term borrowing, was completed in foreign currencies, primarily in U.S. dollars.
Green Bond Program
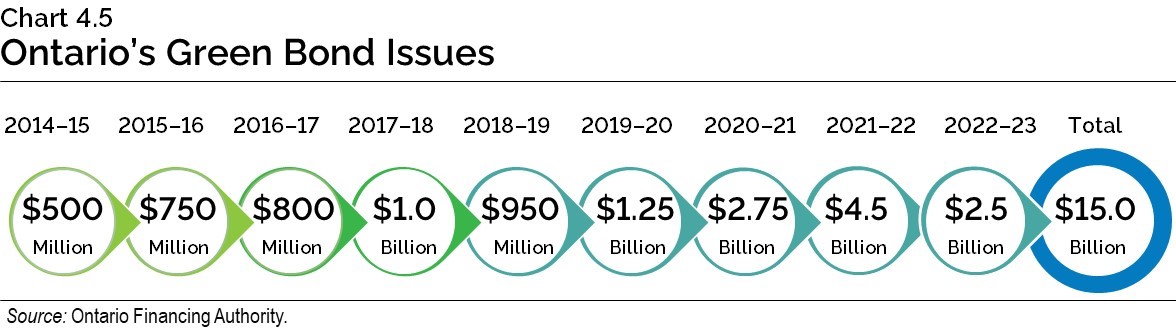
Green Bonds remain a core component of Ontario’s borrowing program and are an important tool to help finance public transit initiatives, extreme weather-resistant infrastructure, as well as energy efficiency and conservation projects. Ontario remains the largest issuer of Canadian dollar Green Bonds, totalling $15.0 billion issued since 2014–15, with $13.0 billion outstanding.
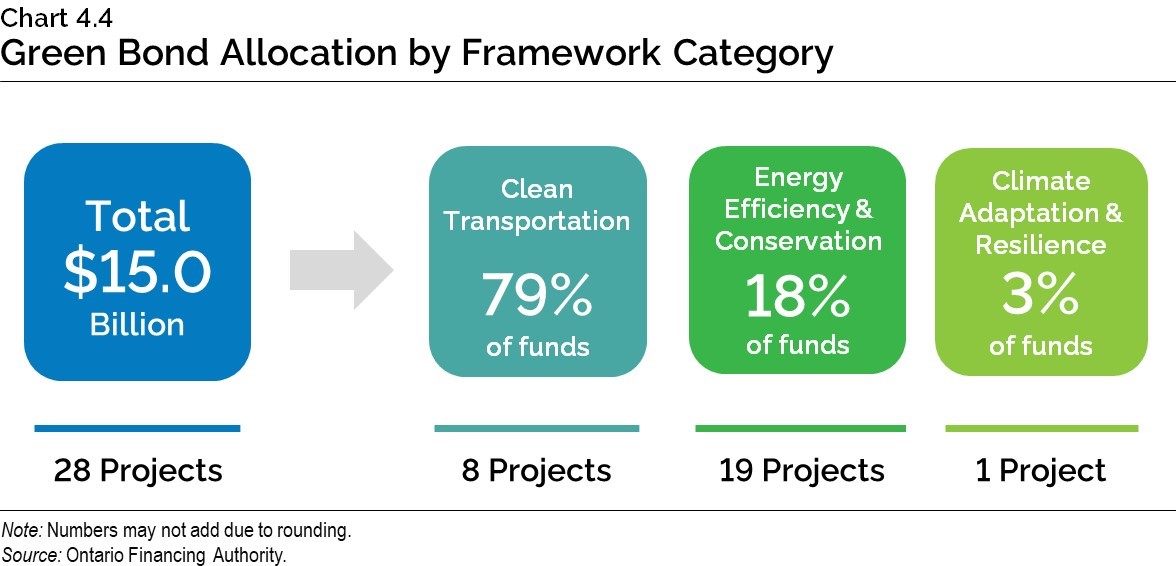
On February 28, 2023, Ontario issued its second Green Bond in 2022–23, and thirteenth Green Bond overall. This issue was for $1.5 billion and followed a $1.0 billion issue in October 2022. Five projects were selected to receive funding from the most recent Green Bond. This included four Clean Transportation projects and one project under the Energy Efficiency and Conservation framework category:
- GO Transit Expansion;
- Hazel McCallion Light Rail Transit;
- Ontario Line Subway;
- Scarborough Subway Extension; and
- Macdonald Block Reconstruction.
Ontario is updating its Green Bond Framework. The update will include better alignment of framework categories with the Green Bond Principles through standardized wording, as well as the expansion from green to sustainable to allow for a greater breadth of potential bond offerings in the future.
Ontario plans to continue its leadership in the Canadian dollar Green Bond market and, subject to market conditions, will issue multiple Green Bonds each fiscal year, including in 2023–24.

Cost of Debt
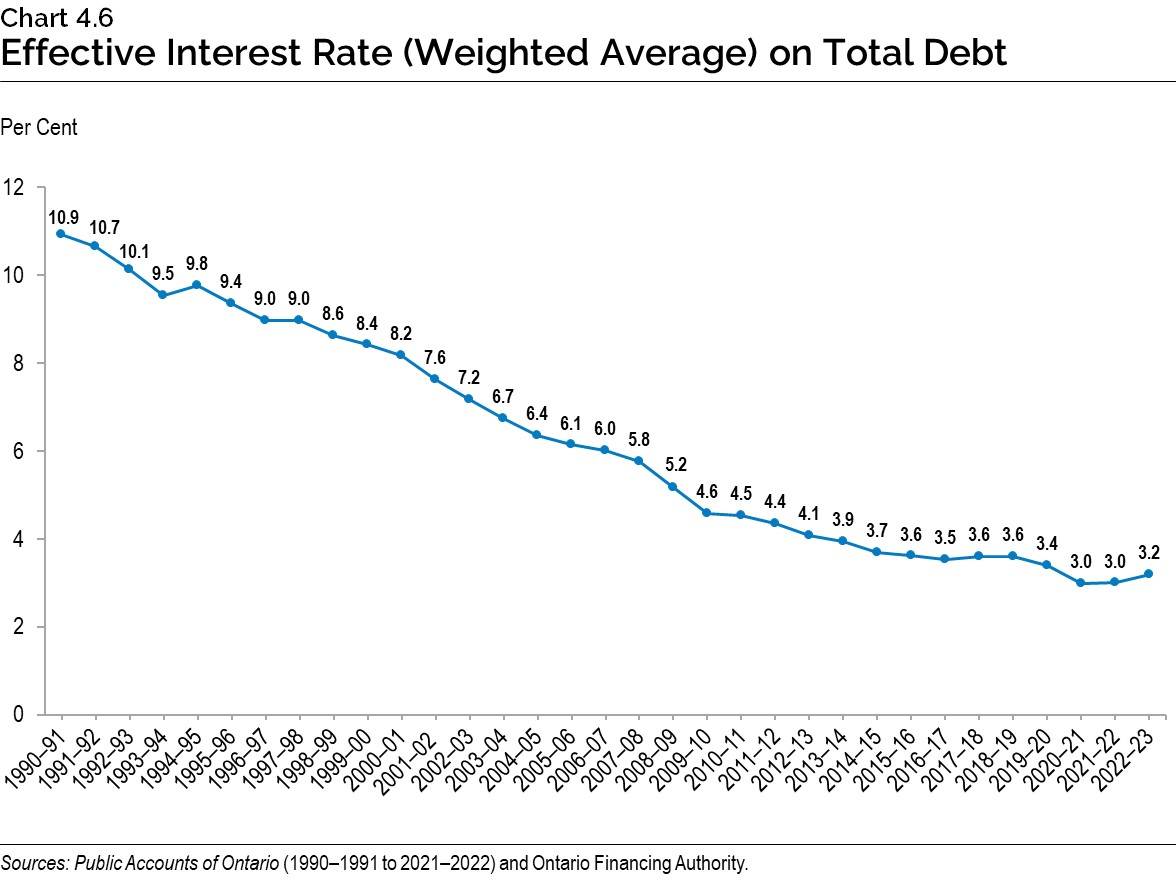
After a three-decade decline, interest rates have risen as central banks, including the Bank of Canada and the U.S. Federal Reserve, have raised overnight interest rates. This has impacted Ontario’s IOD costs. Chart 4.6 shows that while the effective interest rate has begun to rise, the interest rate on the total debt portfolio remains low in historical terms due to Ontario’s decision to lock in long-term rates and extend the term of its debt since the Global Financial Crisis in 2007–08.
The overall increase in interest rates has resulted in Ontario’s projected cost of borrowing in
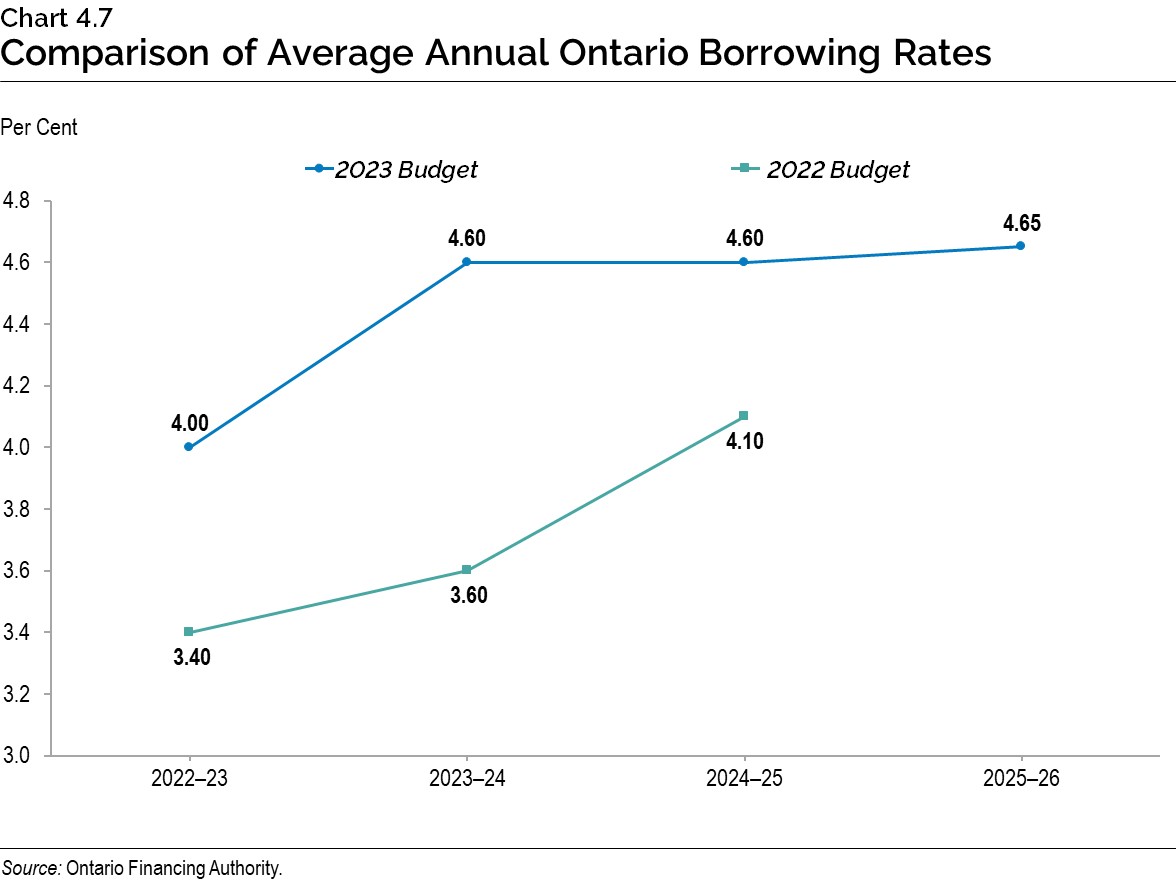
2022–23 going up by 60 basis points to 4.00 per cent from the 3.40 per cent forecast in the 2022 Budget. A one percentage point change in interest rates either up or down from the current interest rate forecast is estimated to have a corresponding change in Ontario’s borrowing costs of approximately $600 million in the first full year, if the size of the borrowing program remains unchanged from the current projection.
Chart 4.7 shows the average borrowing rates on debt issued in 2022–23 and the forecast used to estimate the future cost of borrowing or IOD expense.
Ontario is forecast to pay $13.4 billion in interest costs in 2022–23, $14.1 billion in 2023–24, and $14.4 billion in 2024-25, down from the 2022 Budget forecasts of $13.5 billion, $14.3 billion and $14.9 billion, respectively. These lower interest costs total a cumulative savings of $0.8 billion over three years and are a result of smaller borrowing programs, partially offset by higher than projected interest rates. IOD in 2025–26 is forecast to be $15.1 billion. IOD remains Ontario’s fourth-largest expense after health care, education and social services.
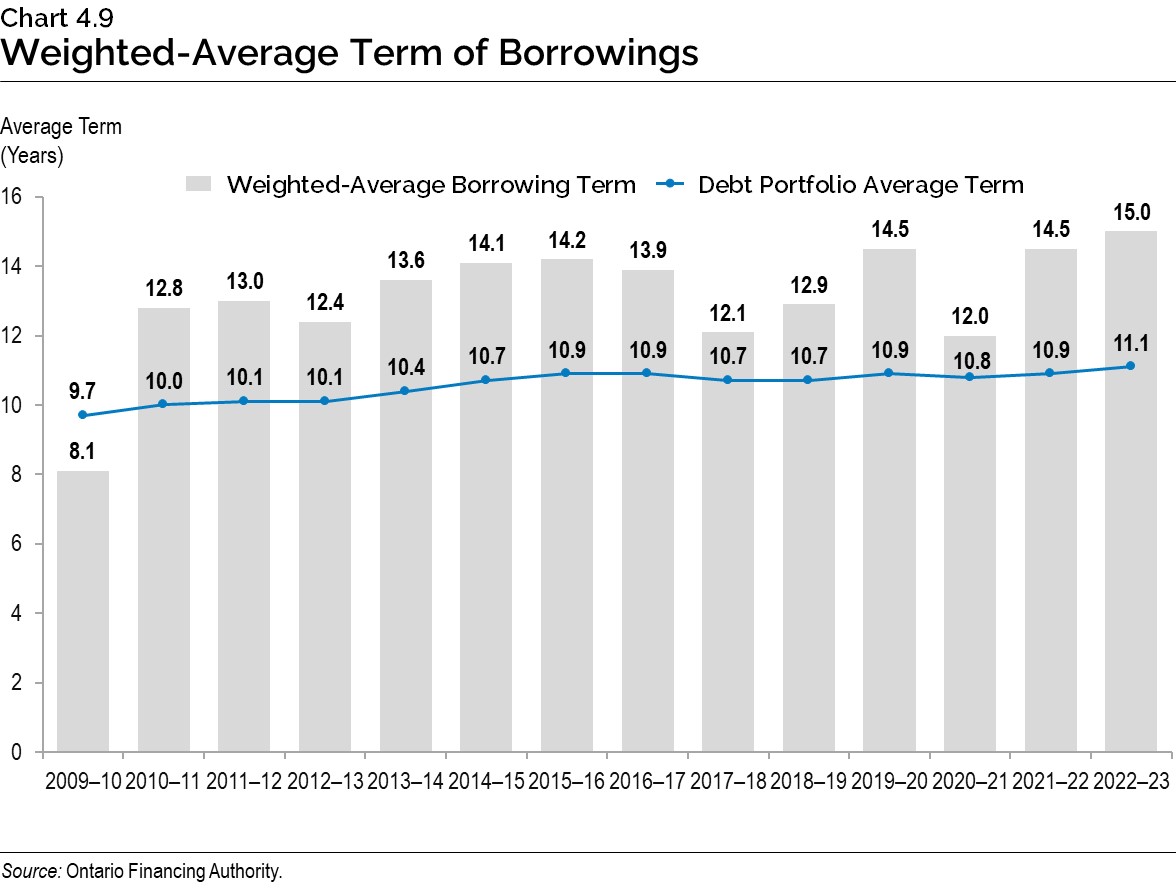
Term of Debt
Ontario has continued to extend the term of its debt, when investor demand allowed, to reduce refinancing risk on maturing debt. This also protects the IOD forecast in the long term, against further increases in interest rates. Ontario has issued $124.2 billion of bonds, or more than one‑quarter of total debt, with maturities of 30 years or longer since 2010–11. This includes $10.3 billion in 2022–23.
With interest rates rising but still low compared to the period preceding the Global Financial Crisis in 2007–08, and a large borrowing program and debt portfolio, the current plan is to maintain the term of Ontario’s debt at no lower than the level it has been at since 2014–15. The success Ontario has had in extending the term of its debt from the time of the Global Financial Crisis leaves it with flexibility going forward. The rise in long-term interest rates will continue to be monitored to determine whether a modest change to Ontario’s debt term strategy is appropriate in the future.
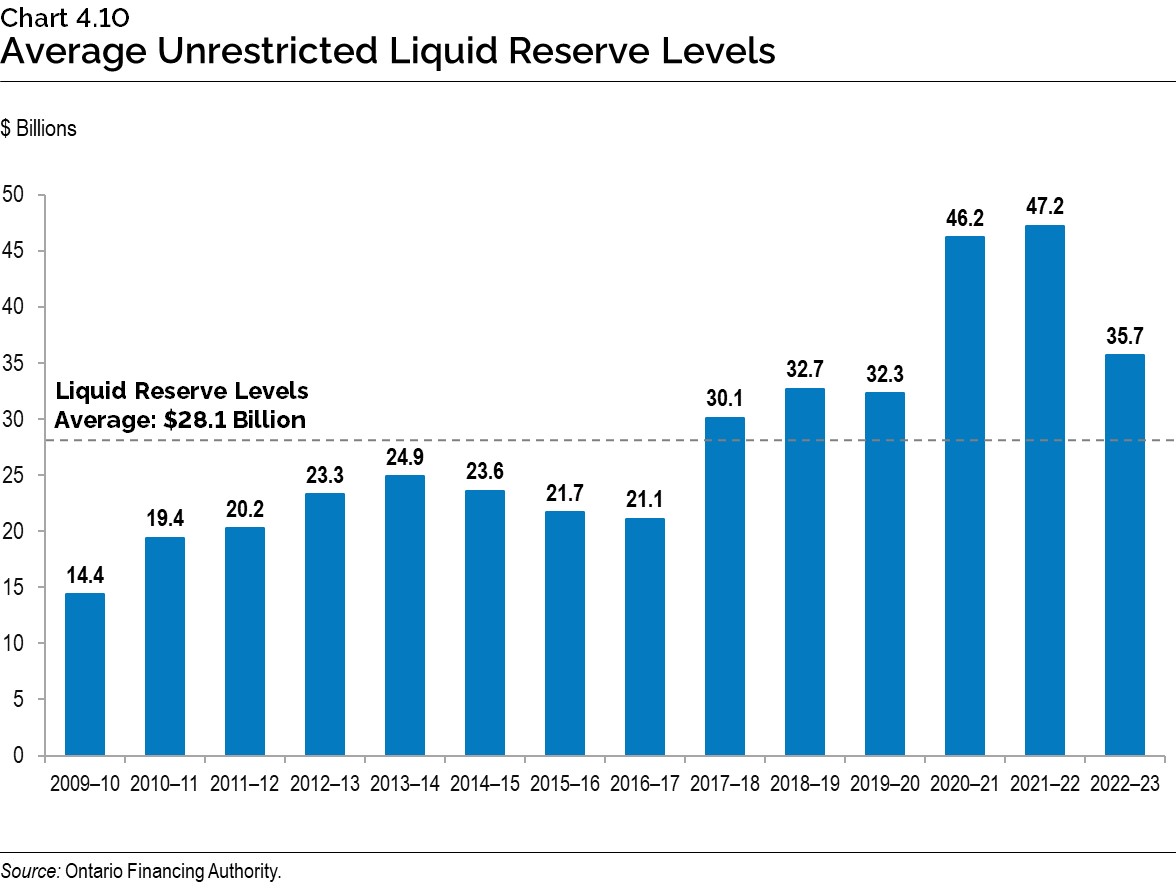
Ensuring Adequate Liquidity Levels
Ontario balances the objective of minimizing the cost of holding liquid reserves against the need to always have enough cash on hand to pay its bills, invest in capital assets, refinance maturing debt and pay interest.
With the onset of the COVID‑19 pandemic, Ontario had built larger cash reserves due to growth in the borrowing program. Starting in 2022–23, Ontario began to bring liquid reserves back to pre‑COVID‑19 pandemic levels, as shown in Chart 4.10. Cash reserves also allow the government to quickly respond to any unforeseen borrowing market, economic or geopolitical events.
Debt Burden Reduction Strategy
The government remains committed to reducing the debt burden and putting Ontario’s finances back on a more sustainable path. In addition to a path to balance by 2024–25, three years earlier than projected in the 2022 Budget, Ontario has made positive progress towards each of the existing targets in its debt burden reduction strategy. This progress has allowed Ontario to lower the targets from those set in the 2022 Budget.
Ontario’s 2022–23 net debt-to-GDP ratio is now forecast to be 37.8 per cent, a decrease of 3.6 percentage points from the forecasted 41.4 per cent in the 2022 Budget. This was due to lower than previously projected deficits and higher nominal GDP growth. This ratio measures the relationship between a government’s obligations and its ability to meet them, indicating the burden of government debt as a share of the economy. Ontario’s net debt-to-GDP is now forecast to be 37.8 per cent in 2023–24, 37.7 per cent in 2024–25 and 36.9 per cent in 2025–26. Over the medium-term outlook, the net debt‑to‑GDP ratio is forecast to remain below the new target of 40.0 per cent, down from the 2022 Budget target of 42.0 per cent.
The net debt‑to-revenue ratio is projected to be 198 per cent in 2022–23, 40 percentage points below the 238 per cent forecast in the 2022 Budget. This ratio is an indicator of how many years it would take to eliminate the debt if the Ontario government were to spend all its annual revenue on debt repayment. Over the medium-term outlook, this ratio is forecast to be 199 per cent in 2023–24, 197 per cent in 2024–25 and 190 per cent in 2025–26. Ontario’s new target for this ratio is to remain below 200 per cent, down from the 2022 Budget target of 250 per cent.
The IOD-to-revenue ratio is forecast to be 6.7 per cent in 2022–23, 0.8 percentage point lower than the 7.5 per cent forecast in the 2022 Budget. This ratio represents how much Ontario needs to spend on interest for every revenue dollar received. The new target for this ratio is to stay below 7.5 per cent, down from the 2022 Budget target of 8.0 per cent. Despite increases in deficits and borrowing requirements caused by the COVID‑19 pandemic, IOD-to-revenue over the medium term continues to remain lower than forecasted in the pre-pandemic 2019 Budget. This ratio is forecast to remain below the peak of 9.1 per cent reached last decade during the recovery from the Global Financial Crisis and is significantly lower than the levels in the early 1990s through to the mid‑2000s.
Consolidated Financial Tables
| Debt2 | 2018–19 | 2019–20 | 2020–21 | Actual 2021–22 |
Interim1 2022–23 |
Plan 2023–24 |
|---|---|---|---|---|---|---|
| Publicly Held Debt — Bonds3 | 334,940 | 349,088 | 382,169 | 400,182 | 403,644 | 401,121 |
| Publicly Held Debt — Treasury Bills | 17,546 | 19,175 | 24,097 | 22,301 | 22,276 | 22,276 |
| Publicly Held Debt — U.S. Commercial Paper4 | 3,863 | 3,891 | 0 | 1,735 | 460 | 460 |
| Publicly Held Debt — Infrastructure Ontario (IO)5 | 300 | 300 | 300 | 300 | 300 | 300 |
| Publicly Held Debt — Other | 292 | 264 | 250 | 231 | 217 | 202 |
| Total Publicly Held Debt | 356,941 | 372,718 | 406,816 | 424,749 | 426,897 | 424,359 |
| Non-Public Debt | 11,039 | 10,010 | 9,318 | 8,766 | 8,678 | 7,943 |
| Total Debt | 367,980 | 382,728 | 416,134 | 433,515 | 435,575 | 432,302 |
| Less: Holdings of Ontario Bonds and Treasury Bills | (13,716) | (9,938) | (11,122) | (7,098) | (6,407) | (42) |
| Revised Total Debt | 354,264 | 372,790 | 405,012 | 426,417 | 429,168 | 432,260 |
| Cash and Temporary Investments Excluding Broader Public Sector6 | (26,250) | (25,140) | (34,505) | (37,678) | (44,440) | (55,805) |
| Total Debt Net of Cash and Temporary Investments | 328,014 | 347,650 | 370,507 | 388,739 | 384,728 | 376,455 |
| Other Net (Assets)/Liabilities7 | (3,422) | (8,217) | (9,505) | (20,032) | (3,627) | 15,859 |
| Broader Public Sector Net Debt | 13,904 | 13,899 | 12,562 | 11,708 | 14,684 | 14,097 |
| Net Debt | 338,496 | 353,332 | 373,564 | 380,415 | 395,785 | 406,411 |
| Non-Financial Assets8 | (121,854) | (127,568) | (134,270) | (143,558) | (153,022) | (162,973) |
| Accumulated Deficit | 216,642 | 225,764 | 239,294 | 236,857 | 242,763 | 243,438 |
Table 4.3 footnotes:
[1] Interim represents the 2022 Budget projection for the 2022–23 fiscal year.
[2] Includes debt issued by Ontario and all government organizations, including the Ontario Electricity Financial Corporation (OEFC).
[3], [4] All balances are expressed in Canadian dollars. The balances above reflect the effect of related derivative contracts.
[5] IO’s debt is composed of Infrastructure Renewal Bonds. IO’s debt is not guaranteed by Ontario.
[6] Cash and temporary investments excludes any holdings in Ontario bonds and T-bills.
[7] Other Net (Assets)/Liabilities include accounts receivable, loans receivable, advances and investments in Government Business Enterprises (GBEs) offset by accounts payable, accrued liabilities, deferred revenue and capital contributions, pensions and other employee future benefits, and other liabilities.
[8] Non-financial assets include the tangible capital assets of Ontario, including the broader public sector.
Sources: Ontario Financing Authority and Ontario Ministry of Finance.
| 2023–24 | 2024–25 | 2025–26 | |
|---|---|---|---|
| Total Debt | 432,302 | 433,254 | 433,697 |
| Cash and Temporary Investments | (55,847) | (50,847) | (50,847) |
| Total Debt Net of Cash and Temporary Investments | 376,455 | 382,407 | 382,850 |
| Other Net (Assets)/Liabilities | 15,859 | 24,065 | 31,674 |
| Broader Public Sector Net Debt | 14,097 | 13,854 | 15,345 |
| Net Debt | 406,411 | 420,326 | 429,869 |
| Non-Financial Assets | (162,973) | (177,102) | (191,076) |
| Accumulated Deficit | 243,438 | 243,224 | 238,793 |
Table 4.4 footnotes:
Note: Numbers may not add due to rounding.
Source: Ontario Ministry of Finance.
Chart Descriptions
Chart 4.1: Borrowing Outlook Scenarios for Long-Term Borrowing
| Year | 2022–23 | 2023–24 | 2024–25 | 2025–26 |
|---|---|---|---|---|
| Planning Projection | $32.1 | $27.5 | $28.7 | $33.4 |
| Slower Growth Scenario | $32.1 | $31.2 | $34.7 | $41.6 |
| Faster Growth Scenario | $32.1 | $21.8 | $20.0 | $21.8 |
Sources: Ontario Financing Authority and Ontario Ministry of Finance.
Chart 4.2: 2022–23 Borrowing
Long-term public borrowing of $32.1 billion has been completed for fiscal year 2022–23. This consisted of $25.4 billion (79 per cent) of Canadian dollar syndicated bonds, $2.4 billion (7 per cent) of Canadian dollar Green Bonds*, $0.7 billion (2 per cent) in Canadian dollar bond auction, $2.9 billion (9 per cent) of U.S. dollar bond, and $0.8 billion (3 per cent) of pound sterling bond.
* Face value $2.5 billion.
Note: Numbers may not add due to rounding.
Source: Ontario Financing Authority.
Chart 4.3: Domestic and International Borrowing
Ontario’s total long-term borrowing completed in 2022–23 is $32.1 billion — $28.4 billion was borrowed in the Canadian dollar market and $3.7 billion was borrowed in foreign currencies.
| Year | Canadian Dollar ($ Billions) |
Foreign Currencies ($ Billions) |
Total ($ Billions) |
|---|---|---|---|
| 2007–08 | 15.4 | 2.6 | 18.0 |
| 2008–09 | 19.0 | 9.7 | 28.7 |
| 2009–10 | 21.4 | 22.4 | 43.8 |
| 2010–11 | 23.5 | 16.4 | 39.9 |
| 2011–12 | 28.4 | 6.5 | 34.9 |
| 2012–13 | 26.4 | 10.2 | 36.6 |
| 2013–14 | 29.4 | 6.6 | 36.0 |
| 2014–15 | 31.4 | 8.4 | 39.9 |
| 2015–16 | 25.8 | 6.3 | 32.1 |
| 2016–17 | 19.9 | 7.1 | 27.0 |
| 2017–18 | 21.1 | 12.8 | 33.9 |
| 2018–19 | 30.6 | 9.0 | 39.6 |
| 2019–20 | 28.9 | 10.6 | 39.5 |
| 2020–21 | 39.1 | 20.7 | 59.8 |
| 2021–22 | 32.0 | 9.2 | 41.1 |
| 2022–23 | 28.4 | 3.7 | 32.1 |
Note: Numbers may not add due to rounding.
Source: Ontario Financing Authority.
Chart 4.4: Green Bond Allocation by Framework Category
A total of $15.0 billion in Green Bond funding has provided funding for 28 projects. Eight of those projects are under the Clean Transportation framework category and have received 79 per cent of the funding. Nineteen projects are under the Energy Efficiency and Conservation category and have received 18 per cent of the funding. One project is under the Climate Adaptation and Resilience category and has received three per cent of the funding.
Note: Numbers may not add due to rounding.
Source: Ontario Financing Authority.
Chart 4.5: Ontario’s Green Bond Issues
Since 2014, Ontario has issued Green Bonds totalling $15.0 billion.
| Year | 2014–15 | 2015–16 | 2016–17 | 2017–18 | 2018–19 | 2019–20 | 2020–21 | 2021–22 | 2022–23 |
|---|---|---|---|---|---|---|---|---|---|
| Green Bond Issues ($) | $500 million | $750 million | $800 million | $1.0 billion | $950 million | $1.25 billion | $2.75 billion | $4.5 billion | $2.5 billion |
Source: Ontario Financing Authority.
Chart 4.6: Effective Interest Rate (Weighted Average) on Total Debt
As of March 31, 2023, the effective interest rate (calculated as a weighted average) for fiscal year-end is forecast to be 3.2 per cent on Ontario’s total debt.
| Year | Effective Interest Rate (%) |
|---|---|
| 1990–91 | 10.9 |
| 1991–92 | 10.7 |
| 1992–93 | 10.1 |
| 1993–94 | 9.5 |
| 1994–95 | 9.8 |
| 1995–96 | 9.4 |
| 1996–97 | 9.0 |
| 1997–98 | 9.0 |
| 1998–99 | 8.6 |
| 1999–00 | 8.4 |
| 2000–01 | 8.2 |
| 2001–02 | 7.6 |
| 2002–03 | 7.2 |
| 2003–04 | 6.7 |
| 2004–05 | 6.4 |
| 2005–06 | 6.1 |
| 2006–07 | 6.0 |
| 2007–08 | 5.8 |
| 2008–09 | 5.2 |
| 2009–10 | 4.6 |
| 2010–11 | 4.5 |
| 2011–12 | 4.4 |
| 2012–13 | 4.1 |
| 2013–14 | 3.9 |
| 2014–15 | 3.7 |
| 2015–16 | 3.6 |
| 2016–17 | 3.5 |
| 2017–18 | 3.6 |
| 2018–19 | 3.6 |
| 2019–20 | 3.4 |
| 2020–21 | 3.0 |
| 2021–22 | 3.0 |
| 2022–23 | 3.2 |
Sources: Public Accounts of Ontario (1990–1991 to 2021–2022) and Ontario Financing Authority.
Chart 4.7: Comparison of Average Annual Ontario Borrowing Rates
| Year | 2023 Budget (%) | 2022 Budget (%) |
|---|---|---|
| 2022–23 | 4.00 | 3.40 |
| 2023–24 | 4.60 | 3.60 |
| 2024–25 | 4.60 | 4.10 |
| 2025–26 | 4.65 | – |
Source: Ontario Financing Authority.
Chart 4.8: Comparison of Interest on Debt Expense Forecast
| Year | 2023 Budget ($ Billions) | 2022 Budget($ Billions) |
|---|---|---|
| 2022–23 | 13.4 | 13.5 |
| 2023–24 | 14.1 | 14.3 |
| 2024–25 | 14.4 | 14.9 |
| 2025–26 | 15.1 | – |
Source: Ontario Financing Authority.
Chart 4.9: Weighted-Average Term of Borrowings
The average term of Ontario’s debt portfolio has been extended from 9.7 years in 2009–10 to 11.1 years in 2022–23. The weighted-average borrowing term for 2022–23 was 15.0 years as of March 23, 2023.
| Year | 2009–10 | 2010–11 | 2011–12 | 2012–13 | 2013–14 | 2014–15 | 2015–16 | 2016–17 | 2017–18 | 2018–19 | 2019–20 | 2020–21 | 2021–22 | 2022–23 |
|---|---|---|---|---|---|---|---|---|---|---|---|---|---|---|
| Weighted-Average Borrowing Term (Years) | 8.1 | 12.8 | 13.0 | 12.4 | 13.6 | 14.1 | 14.2 | 13.9 | 12.1 | 12.9 | 14.5 | 12.0 | 14.5 | 15.0 |
| Debt Portfolio Average Term (Years) | 9.7 | 10.0 | 10.1 | 10.1 | 10.4 | 10.7 | 10.9 | 10.9 | 10.7 | 10.7 | 10.9 | 10.8 | 10.9 | 11.1 |
Source: Ontario Financing Authority.
Chart 4.10: Average Unrestricted Liquid Reserve Levels
Average unrestricted liquid reserve levels are forecast to be $35.7 billion as of March 31, 2023.
| Year | Average Unrestricted Liquid Reserve Levels ($ billions) |
|---|---|
| 2009–10 | 14.4 |
| 2010–11 | 19.4 |
| 2011–12 | 20.2 |
| 2012–13 | 23.3 |
| 2013–14 | 24.9 |
| 2014–15 | 23.6 |
| 2015–16 | 21.7 |
| 2016–17 | 21.1 |
| 2017–18 | 30.1 |
| 2018–19 | 32.7 |
| 2019–20 | 32.3 |
| 2020–21 | 46.2 |
| 2021–22 | 47.2 |
| 2022–23 | 35.7 |
Source: Ontario Financing Authority.
Debt Burden Reduction Strategy graphic:
- Net debt-to-GDP to stay below 40.0 per cent
- Net debt-to-revenue to be below 200 per cent
- IOD-to-revenue to stay below 7.5 per cent
Chart 4.11: Net Debt-to-GDP
Ontario’s net debt-to-GDP ratio is forecast at 37.8 per cent in 2022–23.
| Year | Planning Projection (%) | Faster Growth Scenario (%) | Slower Growth Scenario (%) |
|---|---|---|---|
| 1990–91 | 13.4 | – | – |
| 1991–92 | 17.1 | – | – |
| 1992–93 | 21.1 | – | – |
| 1993–94 | 26.6 | – | – |
| 1994–95 | 28.3 | – | – |
| 1995–96 | 30.1 | – | – |
| 1996–97 | 31.2 | – | – |
| 1997–98 | 30.5 | – | – |
| 1998–99 | 29.4 | – | – |
| 1999–00 | 32.1 | – | – |
| 2000–01 | 29.3 | – | – |
| 2001–02 | 28.2 | – | – |
| 2002–03 | 26.8 | – | – |
| 2003–04 | 27.5 | – | – |
| 2004–05 | 26.8 | – | – |
| 2005–06 | 27.8 | – | – |
| 2006–07 | 27.1 | – | – |
| 2007–08 | 26.6 | – | – |
| 2008–09 | 27.8 | – | – |
| 2009–10 | 32.3 | – | – |
| 2010–11 | 34.5 | – | – |
| 2011–12 | 36.6 | – | – |
| 2012–13 | 38.2 | – | – |
| 2013–14 | 39.7 | – | – |
| 2014–15 | 40.5 | – | – |
| 2015–16 | 40.3 | – | – |
| 2016–17 | 39.7 | – | – |
| 2017–18 | 39.3 | – | – |
| 2018–19 | 39.4 | – | – |
| 2019–20 | 39.6 | – | – |
| 2020–21 | 43.1 | – | – |
| 2021–22 | 39.8 | – | – |
| 2022–23 | 37.8 | – | – |
| 2023–24 | 37.8 | 36.1 | 38.8 |
| 2024–25 | 37.7 | 35.0 | 39.5 |
| 2025–26 | 36.9 | 33.2 | 39.4 |
Note: See Chapter 3: Ontario’s Fiscal Plan and Outlook for details on the Faster Growth and Slower Growth Scenarios.
Sources: Statistics Canada and Ontario Ministry of Finance.
Chart 4.12: Net Debt-to-Revenue
Ontario’s net debt-to-revenue ratio is forecast to be 198 per cent in 2022–23.
| Year | Planning Projection (%) | Faster Growth Scenario (%) | Slower Growth Scenario (%) |
|---|---|---|---|
| 1990–91 | 78 | – | – |
| 1991–92 | 104 | – | – |
| 1992–93 | 126 | – | – |
| 1993–94 | 157 | – | – |
| 1994–95 | 168 | – | – |
| 1995–96 | 176 | – | – |
| 1996–97 | 187 | – | – |
| 1997–98 | 184 | – | – |
| 1998–99 | 182 | – | – |
| 1999–00 | 189 | – | – |
| 2000–01 | 183 | – | – |
| 2001–02 | 183 | – | – |
| 2002–03 | 177 | – | – |
| 2003–04 | 188 | – | – |
| 2004–05 | 170 | – | – |
| 2005–06 | 162 | – | – |
| 2006–07 | 153 | – | – |
| 2007–08 | 146 | – | – |
| 2008–09 | 164 | – | – |
| 2009–10 | 189 | – | – |
| 2010–11 | 192 | – | – |
| 2011–12 | 208 | – | – |
| 2012–13 | 216 | – | – |
| 2013–14 | 225 | – | – |
| 2014–15 | 234 | – | – |
| 2015–16 | 225 | – | – |
| 2016–17 | 223 | – | – |
| 2017–18 | 215 | – | – |
| 2018–19 | 220 | – | – |
| 2019–20 | 226 | – | – |
| 2020–21 | 227 | – | – |
| 2021–22 | 206 | – | – |
| 2022–23 | 198 | – | – |
| 2023–24 | 199 | 191 | 204 |
| 2024–25 | 197 | 184 | 208 |
| 2025–26 | 190 | 171 | 205 |
Note: See Chapter 3: Ontario’s Fiscal Plan and Outlook for details on the Faster Growth and Slower Growth Scenarios.
Sources: Public Accounts of Ontario (1990–1991 to 2021–2022) and Ontario Financing Authority.
Chart 4.13: Interest on Debt-to-Revenue
Ontario’s interest on debt-to-revenue ratio is forecast to be 6.7 per cent in 2022–23.
| Year | Planning Projection (%) | Faster Growth Scenario (%) | Slower Growth Scenario (%) |
|---|---|---|---|
| 1990–91 | 7.7 | – | – |
| 1991–92 | 8.8 | – | – |
| 1992–93 | 10.8 | – | – |
| 1993–94 | 13.9 | – | – |
| 1994–95 | 14.5 | – | – |
| 1995–96 | 14.6 | – | – |
| 1996–97 | 14.8 | – | – |
| 1997–98 | 14.2 | – | – |
| 1998–99 | 14.3 | – | – |
| 1999–00 | 15.5 | – | – |
| 2000–01 | 15.0 | – | – |
| 2001–02 | 14.2 | – | – |
| 2002–03 | 12.9 | – | – |
| 2003–04 | 12.9 | – | – |
| 2004–05 | 11.1 | – | – |
| 2005–06 | 9.7 | – | – |
| 2006–07 | 8.9 | – | – |
| 2007–08 | 8.4 | – | – |
| 2008–09 | 8.7 | – | – |
| 2009–10 | 8.9 | – | – |
| 2010–11 | 8.8 | – | – |
| 2011–12 | 9.1 | – | – |
| 2012–13 | 9.0 | – | – |
| 2013–14 | 9.1 | – | – |
| 2014–15 | 8.9 | – | – |
| 2015–16 | 8.5 | – | – |
| 2016–17 | 8.3 | – | – |
| 2017–18 | 7.9 | – | – |
| 2018–19 | 8.1 | – | – |
| 2019–20 | 8.0 | – | – |
| 2020–21 | 7.5 | – | – |
| 2021–22 | 6.8 | – | – |
| 2022–23 | 6.7 | – | – |
| 2023–24 | 6.9 | 6.6 | 7.0 |
| 2024–25 | 6.8 | 6.3 | 7.1 |
| 2025–26 | 6.7 | 6.0 | 7.2 |
Note: See Chapter 3: Ontario’s Fiscal Plan and Outlook for details on the Faster Growth and Slower Growth Scenarios.
Sources: Public Accounts of Ontario (1990–1991 to 2021–2022) and Ontario Financing Authority.