Introduction
Ontario’s economy continues to be affected by heightened economic and geopolitical uncertainties and the impact of high interest rates and a slowing global economy. While Ontario’s economy has continued to grow in the first half of 2023, recently there have been signs of slowing in response to higher interest rates. Real GDP growth edged up 0.2 per cent in the second quarter, following growth of 0.8 per cent in the first quarter. Overall employment gains were strong in the first half of 2023 but have eased in recent months.
Ontario’s real GDP is projected to rise 1.1 per cent in 2023, 0.5 per cent in 2024, 2.0 per cent in 2025 and 2.8 per cent in 2026. Since the 2023 Budget, forecasts have been revised upwards for 2023 and lower for 2024 and 2025. For the purposes of prudent fiscal planning, these projections are set slightly below the average of private‐sector forecasts.
| 2022 | 2023p | 2024p | 2025p | 2026p | |
|---|---|---|---|---|---|
| Real GDP Growth | 3.7 | 1.1 | 0.5 | 2.0 | 2.8 |
| Nominal GDP Growth | 9.2 | 3.6 | 2.9 | 4.2 | 4.8 |
| Employment Growth | 4.6 | 2.3 | 0.8 | 1.5 | 1.9 |
| CPI Inflation | 6.8 | 3.7 | 2.5 | 2.1 | 2.0 |
Table 2.1 footnotes:
p = Ontario Ministry of Finance planning projection based on external sources as of September 29, 2023.
Sources: Statistics Canada and Ontario Ministry of Finance.
Revisions to the Outlook Since the 2023 Budget
The outlook over the 2023 to 2026 period has been revised compared to the projections in the 2023 Budget. Key changes since the 2023 Budget include:
- Stronger growth in both real and nominal GDP in 2023 and slower growth between 2024 and 2025, with growth strengthening in 2026;
- Stronger employment growth in 2023 followed by slower job creation in 2024 and 2025;
- Downward revisions to net operating surplus of corporations growth in all years; and
- Higher projected housing starts in all years and weaker home resales in 2023 and 2024, followed by a strong rebound in 2025.
| 2023p 2023 Budget |
2023p 2023 FES |
2024p 2023 Budget |
2024p 2023 FES |
2025p 2023 Budget |
2025p 2023 FES |
2026p 2023 Budget |
2026p 2023 FES |
|
|---|---|---|---|---|---|---|---|---|
| Real Gross Domestic Product | 0.2 | 1.1 | 1.3 | 0.5 | 2.5 | 2.0 | 2.4 | 2.8 |
| Nominal Gross Domestic Product | 2.8 | 3.6 | 3.6 | 2.9 | 4.6 | 4.2 | 4.5 | 4.8 |
| Compensation of Employees | 5.1 | 6.3 | 4.2 | 3.9 | 4.5 | 4.6 | 4.2 | 4.4 |
| Net Operating Surplus — Corporations | (8.2) | (9.2) | (0.5) | (3.1) | 9.2 | 4.9 | 9.1 | 7.5 |
| Nominal Household Consumption | 5.1 | 5.4 | 4.1 | 3.6 | 4.3 | 4.2 | 4.2 | 4.7 |
| Other Economic Indicators — Employment | 0.5 | 2.3 | 1.0 | 0.8 | 1.7 | 1.5 | 1.7 | 1.9 |
| Other Economic Indicators — Job Creation (000s) | 39 | 176 | 78 | 63 | 133 | 120 | 136 | 154 |
| Other Economic Indicators — Unemployment Rate (Per Cent) | 6.4 | 5.6 | 6.6 | 6.4 | 6.3 | 6.2 | 6.3 | 5.8 |
| Other Economic Indicators — Consumer Price Index | 3.6 | 3.7 | 2.1 | 2.5 | 2.0 | 2.1 | 2.0 | 2.0 |
| Other Economic Indicators — Housing Starts (000s)1 | 80.3 | 89.5 | 79.3 | 84.5 | 82.7 | 89.2 | 83.2 | 94.4 |
| Other Economic Indicators — Home Resales | (8.9) | (11.7) | 21.0 | 11.5 | 1.2 | 22.5 | 1.2 | 1.2 |
| Other Economic Indicators — Home Resale Prices | (9.7) | (4.6) | 2.2 | 1.3 | 4.0 | 3.6 | 4.0 | 4.0 |
| Key External Variables — U.S. Real Gross Domestic Product | 0.5 | 2.2 | 1.2 | 1.1 | 2.1 | 1.7 | 2.1 | 2.1 |
| Key External Variables — WTI Crude Oil ($US per Barrel) | 83 | 78 | 80 | 79 | 79 | 77 | 79 | 78 |
| Key External Variables — Canadian Dollar (Cents US) | 74.4 | 74.4 | 76.5 | 75.8 | 77.6 | 77.0 | 78.5 | 77.9 |
| Key External Variables — Three-Month Treasury Bill Rate2 | 4.3 | 4.8 | 3.3 | 4.4 | 2.5 | 2.9 | 2.4 | 2.6 |
| Key External Variables — 10-Year Government Bond Rate3 | 3.1 | 3.3 | 3.1 | 3.3 | 3.1 | 3.2 | 3.2 | 3.2 |
Table 2.2 footnotes:
p = Ontario Ministry of Finance planning projection based on external sources as of September 29, 2023.
[1] Housing starts projection based on private-sector average as of September 29, 2023.
[2], [3] Government of Canada interest rates (per cent).
Sources: Statistics Canada; Canada Mortgage and Housing Corporation; Canadian Real Estate Association; Bank of Canada; United States Bureau of Economic Analysis; Blue Chip Economic Indicators (October 2023); U.S. Energy Information Administration; and Ontario Ministry of Finance.
Recent Economic Performance
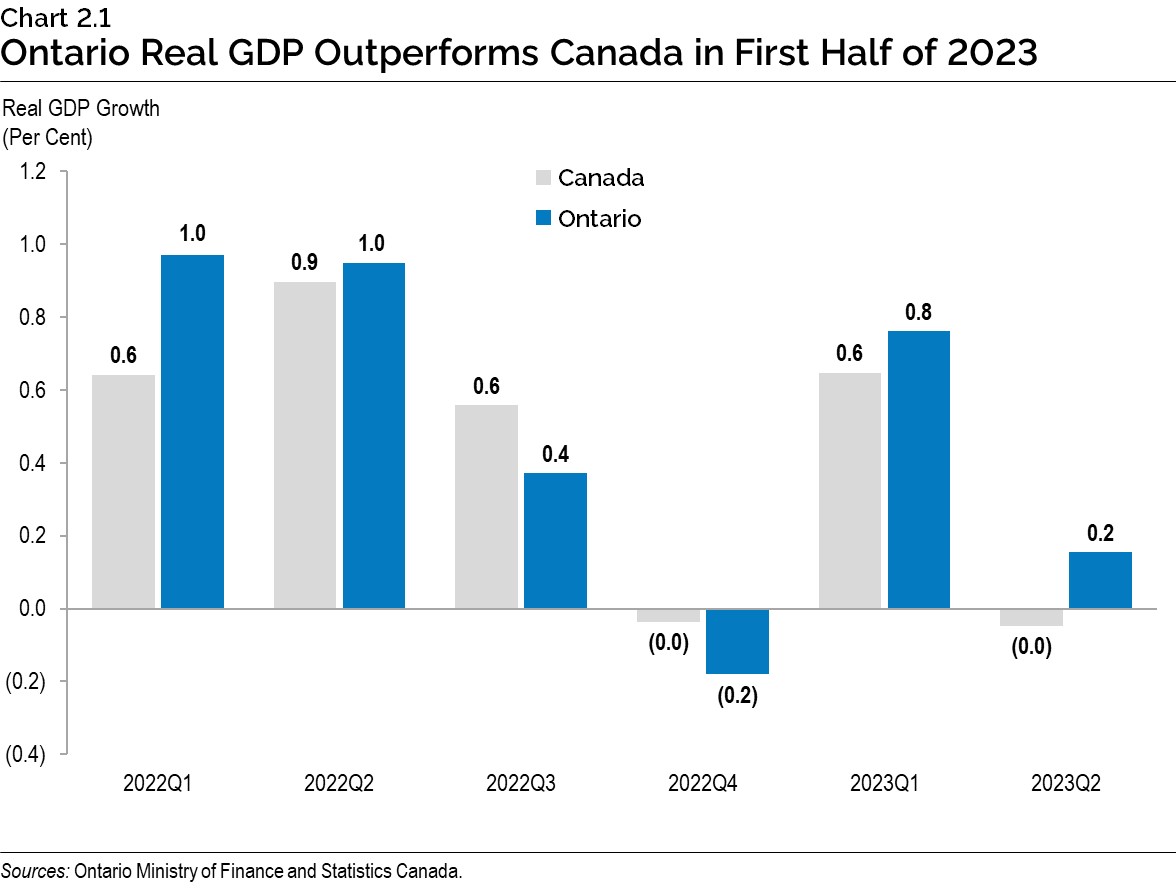
Real GDP growth in Ontario slightly outpaced Canada over the first half of 2023. Ontario real GDP advanced by 0.8 per cent in the first quarter of 2023, followed by a gain of 0.2 per cent in the second quarter. Growth has been supported by consumer spending and exports. As of the second quarter, Ontario’s real GDP was 4.9 per cent above the pre-COVID-19 pandemic level in 2019Q4.
Canada’s real GDP grew by 0.6 per cent in the first quarter of 2023 but declined slightly in the second quarter due to weak residential investment and slower household spending and export growth.
Ontario Labour Market
Over the first nine months of the year, employment in Ontario has increased by over 170,000, concentrated in full-time and private-sector positions. However, recently there has been a slowdown in employment growth, with an increase of 40,800 between May and September, compared to 132,500 over the first four months of the year.
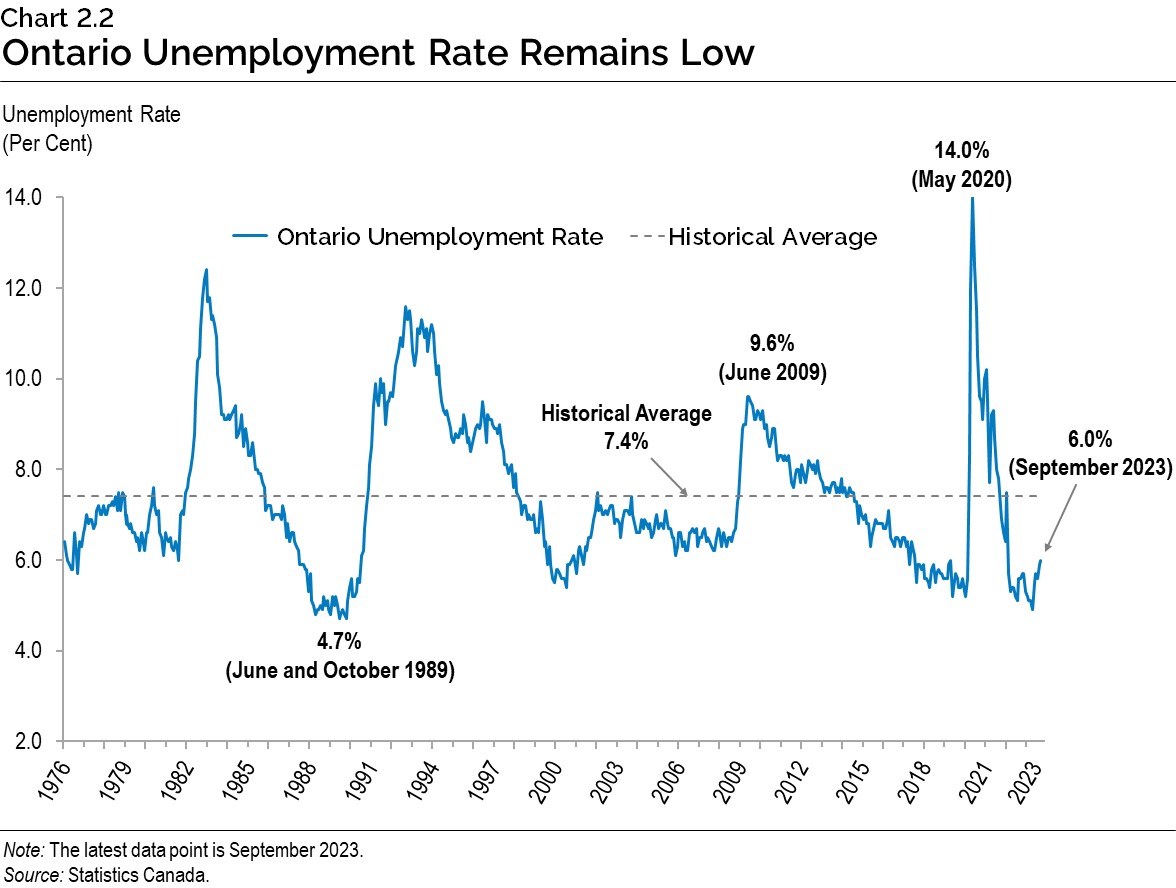
Ontario has an unemployment rate of 6.0 per cent as of September 2023, well below its long-term historical average of 7.4 per cent. However, the unemployment rate has risen by more than a percentage point from 4.9 per cent since April of this year. The rise in the unemployment rate reflects the recent slowdown in employment growth, as well as the continued expansion of the labour force, driven in part by strong underlying population growth.
Consumer Price Inflation
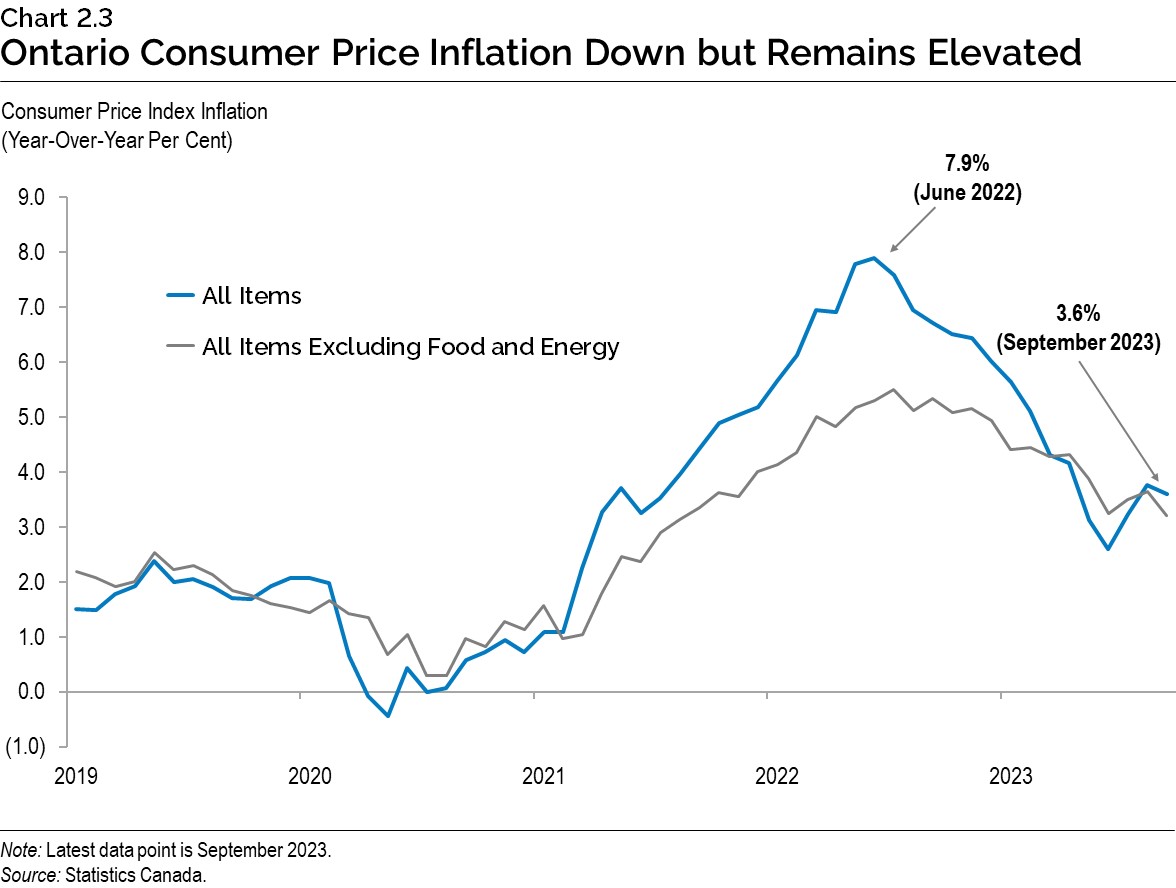
Ontario Consumer Price Index (CPI) inflation has eased significantly since reaching 7.9 per cent (year-over-year) in June 2022. However, inflation has accelerated in recent months, with headline inflation in Ontario rising from more than a two-year low of 2.6 per cent in June 2023 to 3.6 per cent in September. Ontario’s core inflation, which excludes volatile food and energy prices, was 3.2 per cent in September. This September data for core inflation matches the recent low of 3.2 per cent for this indicator in June 2023.
Economic Outlook
The Ontario Ministry of Finance regularly consults with private-sector economists and continually tracks their forecasts to inform the government’s planning assumptions.
Private-sector forecasters, on average, are projecting that Ontario’s real GDP will grow by 1.2 per cent in 2023, 0.6 per cent in 2024, 2.1 per cent in 2025 and 2.9 per cent in 2026. Since the 2023 Budget, forecasts have been revised upwards for 2023 and 2026 and downwards for 2024 and 2025. The Ontario Ministry of Finance’s real GDP projections continue to be set slightly below the average of private-sector forecasts in each year for prudent planning purposes.
| 2023 | 2024 | 2025 | 2026 | |
|---|---|---|---|---|
| Stokes Economics (August) | 0.9 | 0.6 | 2.4 | 3.0 |
| Royal Bank of Canada (September) | 1.1 | 0.2 | – | – |
| Scotiabank (September) | 1.3 | 0.8 | – | – |
| National Bank of Canada (September) | 1.0 | 0.1 | – | – |
| Laurentian Bank Securities (September) | 1.5 | 0.4 | – | – |
| TD Bank Group (September) | 1.1 | 0.4 | 1.5 | 1.8 |
| Desjardins Group (July) | 1.6 | 0.1 | – | – |
| BMO Capital Markets (September) | 1.2 | 0.5 | – | – |
| The Conference Board of Canada (August) | 1.3 | 1.0 | 2.7 | 2.3 |
| CIBC Capital Markets (September) | 1.2 | 0.3 | 2.0 | – |
| Central 1 Credit Union (September) | 1.1 | 1.1 | 1.8 | – |
| Quantitative Economic Decisions, Inc. (September) | 1.3 | 0.9 | 1.4 | 4.4 |
| University of Toronto (September) | 1.3 | 1.1 | 2.8 | 3.0 |
| Private-Sector Survey Average | 1.2 | 0.6 | 2.1 | 2.9 |
| Ontario’s Planning Assumption | 1.1 | 0.5 | 2.0 | 2.8 |
Table 2.3 footnotes:
Sources: Ontario Ministry of Finance Survey of Forecasters (September 29, 2023) and Ontario Ministry of Finance.
Private-sector forecasters, on average, are projecting that Ontario’s nominal GDP will grow by 3.7 per cent in 2023, 3.0 per cent in 2024, 4.3 per cent in 2025 and 4.9 per cent in 2026. The Ontario Ministry of Finance’s nominal GDP projections continue to be set slightly below the average of private-sector forecasts in each year for prudent planning purposes.
| 2023 | 2024 | 2025 | 2026 | |
|---|---|---|---|---|
| Stokes Economics (August) | 4.8 | 2.6 | 4.7 | 5.4 |
| Royal Bank of Canada (September) | 2.7 | 2.1 | – | – |
| Scotiabank (September) | 2.6 | 3.2 | – | – |
| National Bank of Canada (September) | 3.3 | 2.4 | – | – |
| Laurentian Bank Securities (September) | 4.1 | 2.9 | – | – |
| TD Bank Group (September) | 3.6 | 3.1 | 3.5 | 3.8 |
| Desjardins Group (July) | 2.7 | 1.4 | – | – |
| BMO Capital Markets (September) | 3.6 | 2.9 | – | – |
| The Conference Board of Canada (August) | 4.7 | 3.8 | 4.7 | 4.4 |
| CIBC Capital Markets (September) | 2.9 | 2.2 | 4.3 | – |
| Central 1 Credit Union (September) | 4.0 | 3.7 | 3.6 | – |
| Quantitative Economic Decisions, Inc. (September) | 5.7 | 4.9 | 4.1 | 5.8 |
| University of Toronto (September) | 3.9 | 3.9 | 5.0 | 5.1 |
| Private-Sector Survey Average | 3.7 | 3.0 | 4.3 | 4.9 |
| Ontario’s Planning Assumption | 3.6 | 2.9 | 4.2 | 4.8 |
Table 2.4 footnotes:
Sources: Ontario Ministry of Finance Survey of Forecasters (September 29, 2023) and Ontario Ministry of Finance.
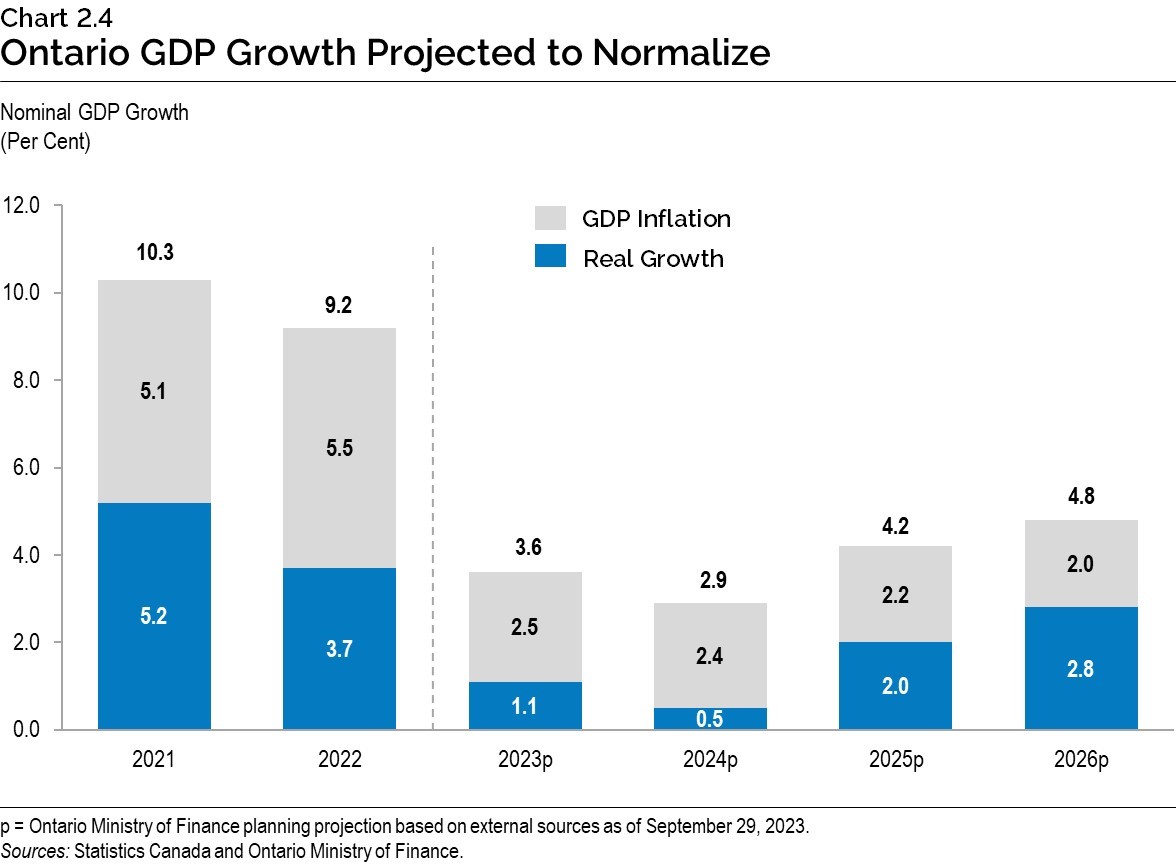
The Ontario Ministry of Finance is projecting that Ontario nominal GDP will rise by 3.6 per cent in 2023 and 2.9 per cent in 2024, reflecting a moderation in both real GDP growth as well as GDP inflation. Nominal GDP growth is projected to accelerate to 4.2 per cent in 2025 and 4.8 per cent in 2026, due largely to stronger growth in real GDP.
Global Economic Environment
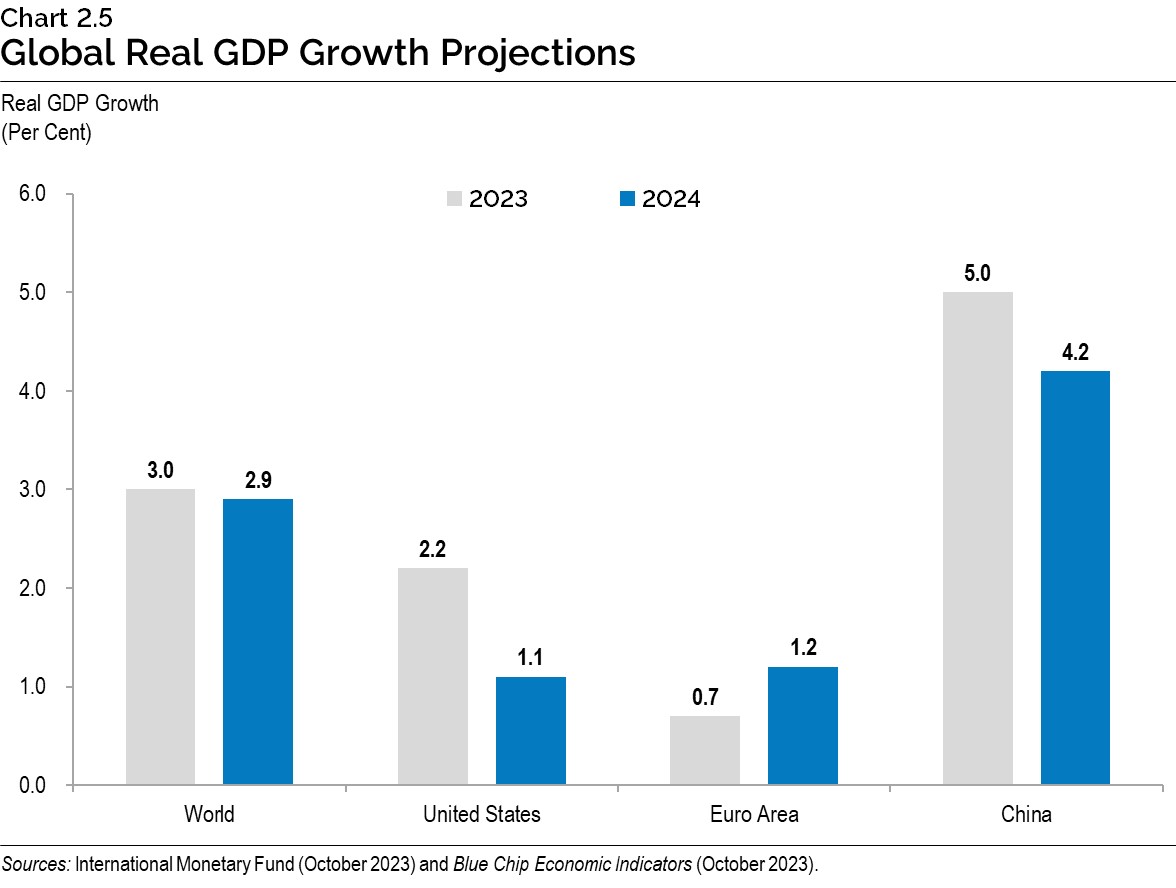
Global economic forecasts for 2024 continue to show growth moderating, as elevated inflation has prompted key central banks to further tighten monetary policy. The International Monetary Fund projects global real GDP growth of 3.0 per cent in 2023 and 2.9 per cent in 2024, compared to growth of 2.9 per cent in 2023 and 3.1 per cent in 2024 that was forecast in January.
United States real GDP is projected to increase by 2.2 per cent in 2023 and 1.1 per cent in 2024. Euro area real GDP is projected to rise 0.7 per cent in 2023 and 1.2 per cent in 2024. China’s real GDP is forecast to rise 5.0 per cent in 2023 and 4.2 per cent in 2024.
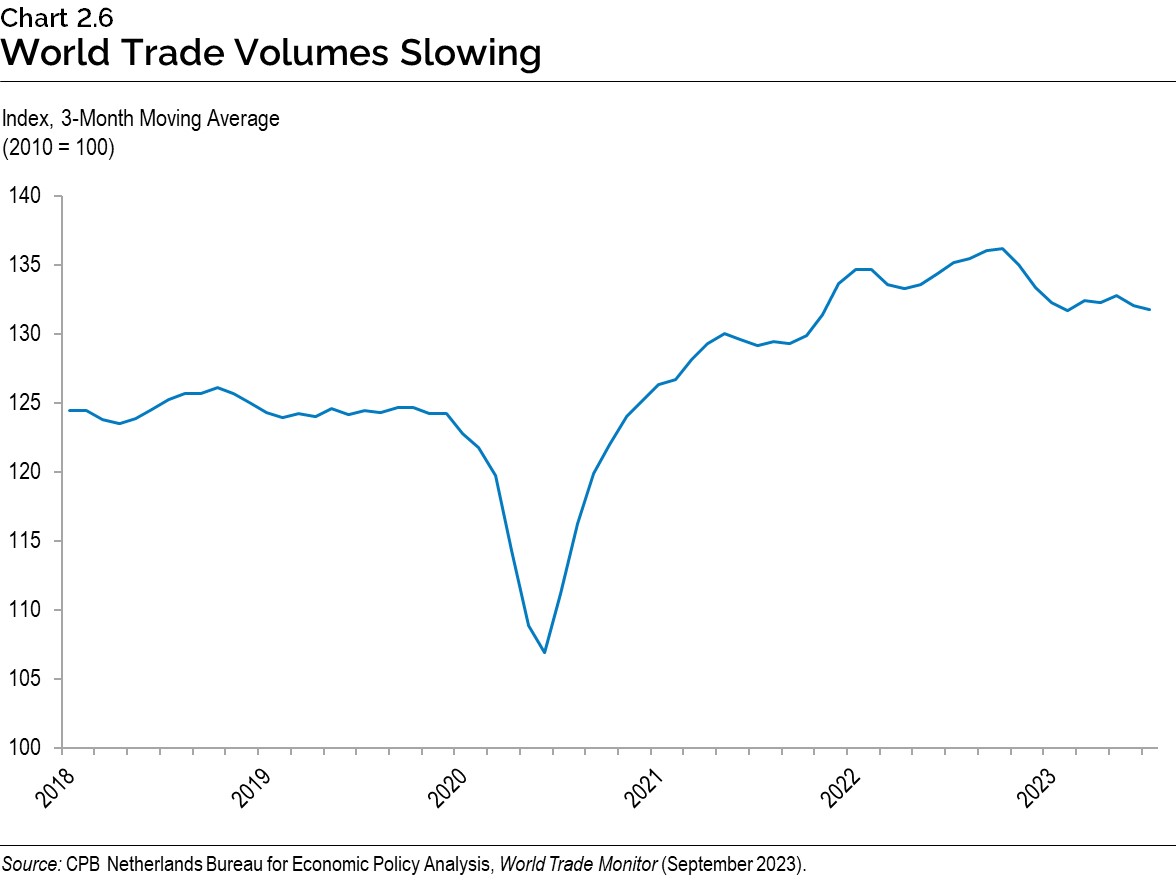
Global merchandise trade growth has recently slowed after a rapid recovery from pandemic-era lows. Recent data from the World Trade Monitor suggests that the volume of global trade peaked in late 2022 and has since been trending downwards, as a consequence of higher interest rates around the world suppressing demand.
Financial Markets and Other External Factors
Persistently elevated consumer price inflation in Canada prompted the Bank of Canada to raise its policy interest rate by an additional 0.5 percentage points since the time of the 2023 Budget. The Bank of Canada policy interest rate currently stands at 5.0 per cent, well above the 2.0 to 3.0 per cent range that the Bank considers its ‘neutral rate’ indicating restrictive monetary policy. The Bank of Canada expects inflation to return to target by the middle of 2025.
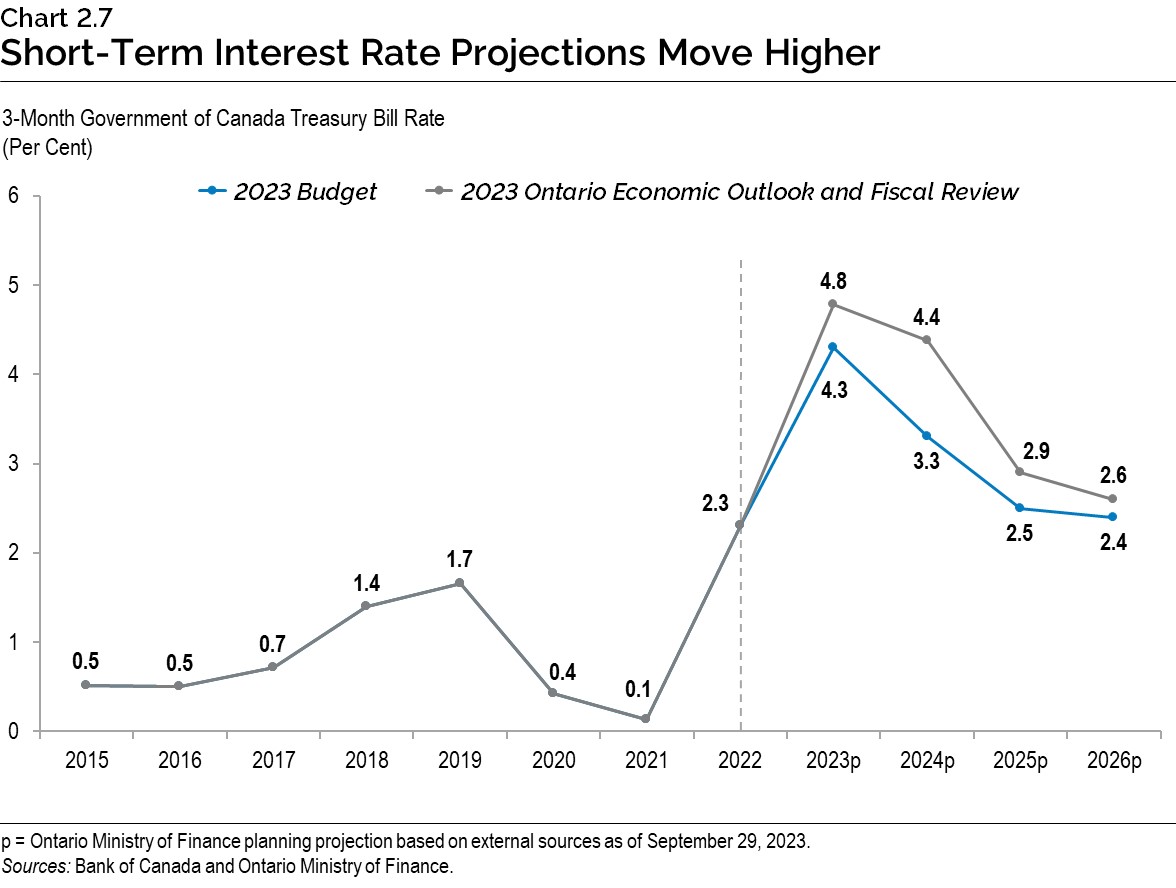
Compared to the 2023 Budget, interest rate projections have risen due to higher policy interest rates, as well as a rising likelihood that persistent inflation will prompt central banks to maintain tighter monetary policy for longer. The Government of Canada three-month treasury bill rate is expected to average 4.8 per cent in 2023, before moderating to 4.4 per cent in 2024, 2.9 per cent in 2025 and 2.6 per cent in 2026. Similarly, the Government of Canada 10-year bond rate is expected to average 3.3 per cent in 2023 and 2024 before moderating to an average of 3.2 per cent in 2025 and 2026.
Energy prices are expected to remain stable over the projection horizon, with WTI crude oil prices averaging US$78 per barrel from 2023 to 2026. The Canada-$US dollar exchange rate is expected to appreciate from an average of 74.4 cents $US in 2023 to 77.9 cents $US by 2026.
| 2022 | 2023p | 2024p | 2025p | 2026p | |
|---|---|---|---|---|---|
| World Real GDP Growth (Per Cent) | 3.5 | 3.0 | 2.9 | 3.2 | 3.2 |
| U.S. Real GDP Growth (Per Cent) | 1.9 | 2.2 | 1.1 | 1.7 | 2.1 |
| West Texas Intermediate (WTI) Crude Oil ($US per Barrel) | 95 | 78 | 79 | 77 | 78 |
| Canadian Dollar (Cents $US) | 76.8 | 74.4 | 75.8 | 77.0 | 77.9 |
| Three-Month Treasury Bill Rate1 (Per Cent) | 2.3 | 4.8 | 4.4 | 2.9 | 2.6 |
| 10-Year Government Bond Rate2 (Per Cent) | 2.8 | 3.3 | 3.3 | 3.2 | 3.2 |
Table 2.5 footnotes:
p = Ontario Ministry of Finance planning projection based on external sources as of September 29, 2023.
[1], [2] Government of Canada interest rates.
Sources: International Monetary Fund World Economic Outlook (October 2023); U.S. Bureau of Economic Analysis; U.S. Energy Information Administration; Bank of Canada; Blue Chip Economic Indicators (October 2023); and Ontario Ministry of Finance Survey of Forecasters.
Details of Ontario’s Economic Outlook
The Ontario Ministry of Finance projects that Ontario real GDP will grow by 1.1 per cent in 2023, 0.5 per cent in 2024, 2.0 per cent in 2025 and 2.8 per cent in 2026. Table 2.6 provides details of the Ontario Ministry of Finance’s economic outlook over the forecast period.
| 2022 | 2023p | 2024p | 2025p | 2026p | |
|---|---|---|---|---|---|
| Real Gross Domestic Product | 3.7 | 1.1 | 0.5 | 2.0 | 2.8 |
| Nominal Gross Domestic Product | 9.2 | 3.6 | 2.9 | 4.2 | 4.8 |
| Compensation of Employees | 9.0 | 6.3 | 3.9 | 4.6 | 4.4 |
| Net Operating Surplus — Corporations | 4.3 | (9.2) | (3.1) | 4.9 | 7.5 |
| Nominal Household Consumption | 12.6 | 5.4 | 3.6 | 4.2 | 4.7 |
| Other Economic Indicators — Employment | 4.6 | 2.3 | 0.8 | 1.5 | 1.9 |
| Other Economic Indicators — Job Creation (000s) | 338 | 176 | 63 | 120 | 154 |
| Other Economic Indicators — Unemployment Rate (Per Cent) | 5.6 | 5.6 | 6.4 | 6.2 | 5.8 |
| Other Economic Indicators — Consumer Price Index | 6.8 | 3.7 | 2.5 | 2.1 | 2.0 |
| Other Economic Indicators — Housing Starts (000s)1 | 96.1 | 89.5 | 84.5 | 89.2 | 94.4 |
| Other Economic Indicators — Home Resales | (32.2) | (11.7) | 11.5 | 22.5 | 1.2 |
| Other Economic Indicators — Home Resale Prices | 6.8 | (4.6) | 1.3 | 3.6 | 4.0 |
| Key External Variables — U.S. Real Gross Domestic Product | 1.9 | 2.2 | 1.1 | 1.7 | 2.1 |
| Key External Variables — WTI Crude Oil ($US per Barrel) | 95 | 78 | 79 | 77 | 78 |
| Key External Variables — Canadian Dollar (Cents US) | 76.8 | 74.4 | 75.8 | 77.0 | 77.9 |
| Key External Variables — Three-Month Treasury Bill Rate2 | 2.3 | 4.8 | 4.4 | 2.9 | 2.6 |
| Key External Variables — 10-Year Government Bond Rate3 | 2.8 | 3.3 | 3.3 | 3.2 | 3.2 |
Table 2.6 footnotes:
p = Ontario Ministry of Finance planning projection based on external sources as of September 29, 2023.
[1] Housing starts projection based on private-sector average as of September 29, 2023.
[2], [3] Government of Canada interest rates (per cent).
Sources: Statistics Canada; Canada Mortgage and Housing Corporation; Canadian Real Estate Association; Bank of Canada; United States Bureau of Economic Analysis; Blue Chip Economic Indicators (October 2023); U.S. Energy Information Administration; and Ontario Ministry of Finance.
Employment
Resilient economic activity in early 2023 was accompanied by strong employment growth. There were also large increases in the labour force, in part reflecting robust population growth. As economic activity is moderating amid high interest rates, employment growth is projected to ease over the second half of 2023 and into 2024.
Despite a slowing labour market in the second half of the year, Ontario employment is projected to rise 2.3 per cent in 2023, following robust growth of 5.2 per cent in 2021 and 4.6 per cent in 2022. The annual unemployment rate is projected to remain unchanged from 2022 at a near historic low of 5.6 per cent in 2023.
As employment gains moderate and strong demographic growth supports labour force gains, the unemployment rate is projected to rise to 6.4 per cent in 2024. Employment growth is forecast to pick up in 2025 and 2026, with average annual growth of 1.7 per cent, in line with average growth over the 2015 to 2019 period. The strengthening economy in 2025 and 2026 is expected to support an improvement in the unemployment rate to 5.8 per cent in 2026.
Household Consumption
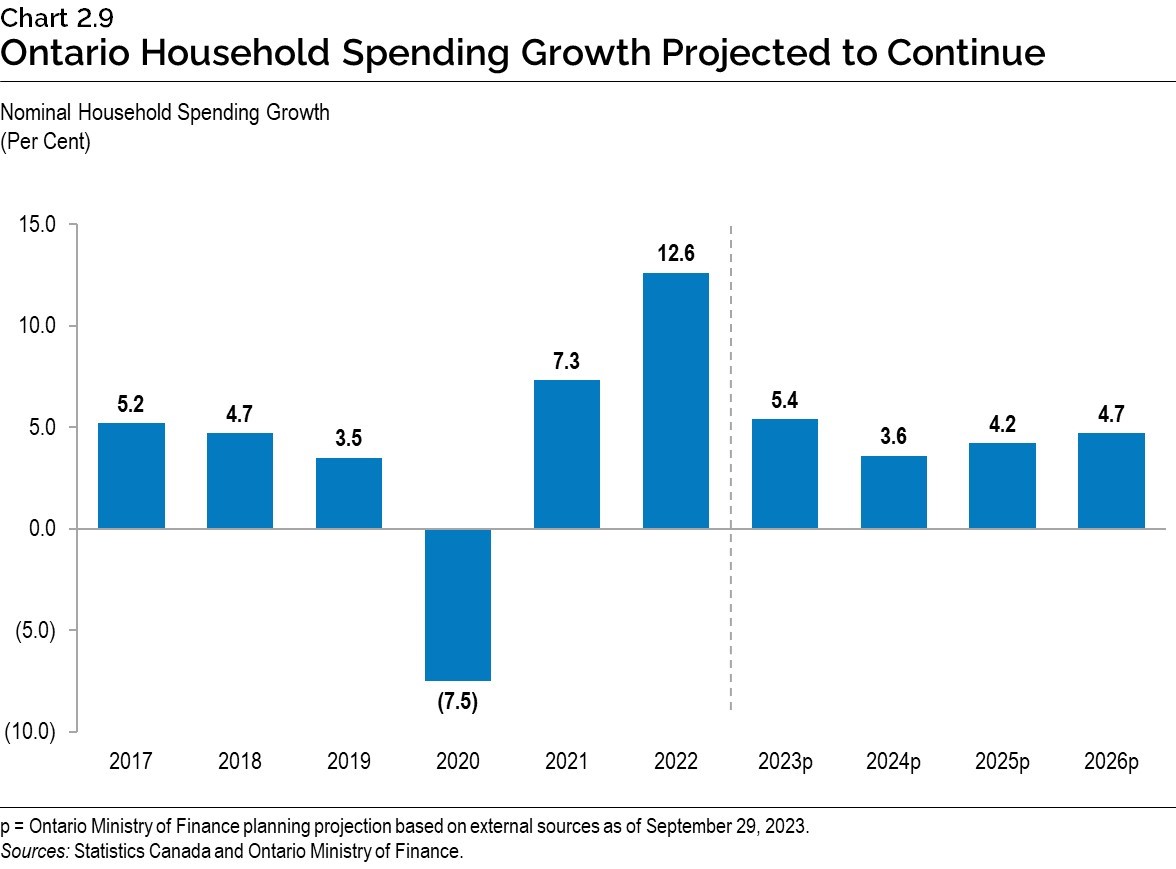
The solid labour market, pent-up demand and pandemic-related savings helped support household spending in the first half of 2023. Population gains have also contributed to household spending. Although population growth will continue to be a positive contributor to spending, the volume of spending per capita is projected to decline as income growth moderates and elevated prices and higher interest rates impact household budgets.
Nominal household spending is projected to grow by 5.4 per cent in 2023, down from 12.6 per cent in 2022. Nominal household spending growth is projected to moderate to 3.6 per cent in 2024, and then rise by an annual average growth of 4.4 per cent over the 2025 to 2026 period.
Consumer Price Inflation
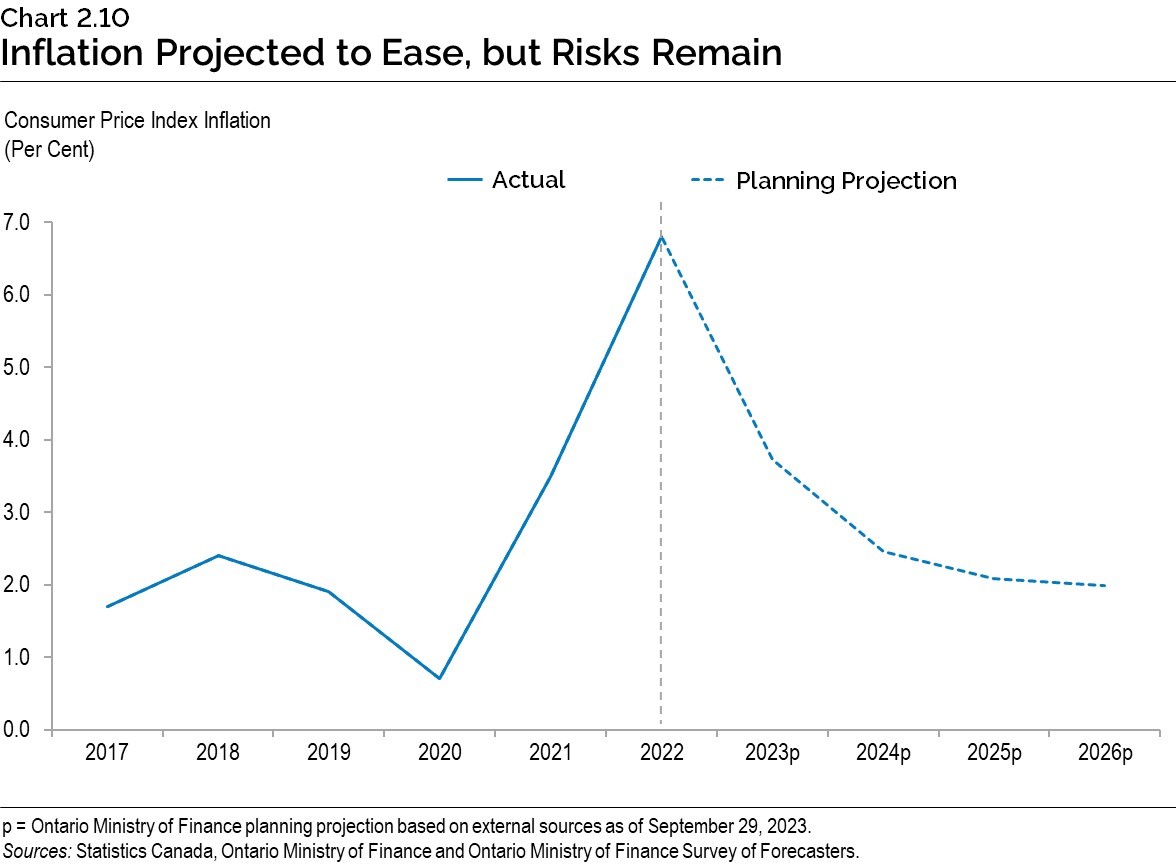
Slower economic growth is projected to contribute to moderating growth in Ontario’s CPI over the projection period. For planning purposes, the Ontario Ministry of Finance is projecting CPI inflation to be 3.7 per cent in 2023 and to moderate to 2.5 per cent in 2024 before reaching close to 2.0 per cent in 2025. Private‐sector economists have a wide range of views. The range of forecasts narrows for 2025 and all inflation forecasts are near 2.0 per cent in 2026.
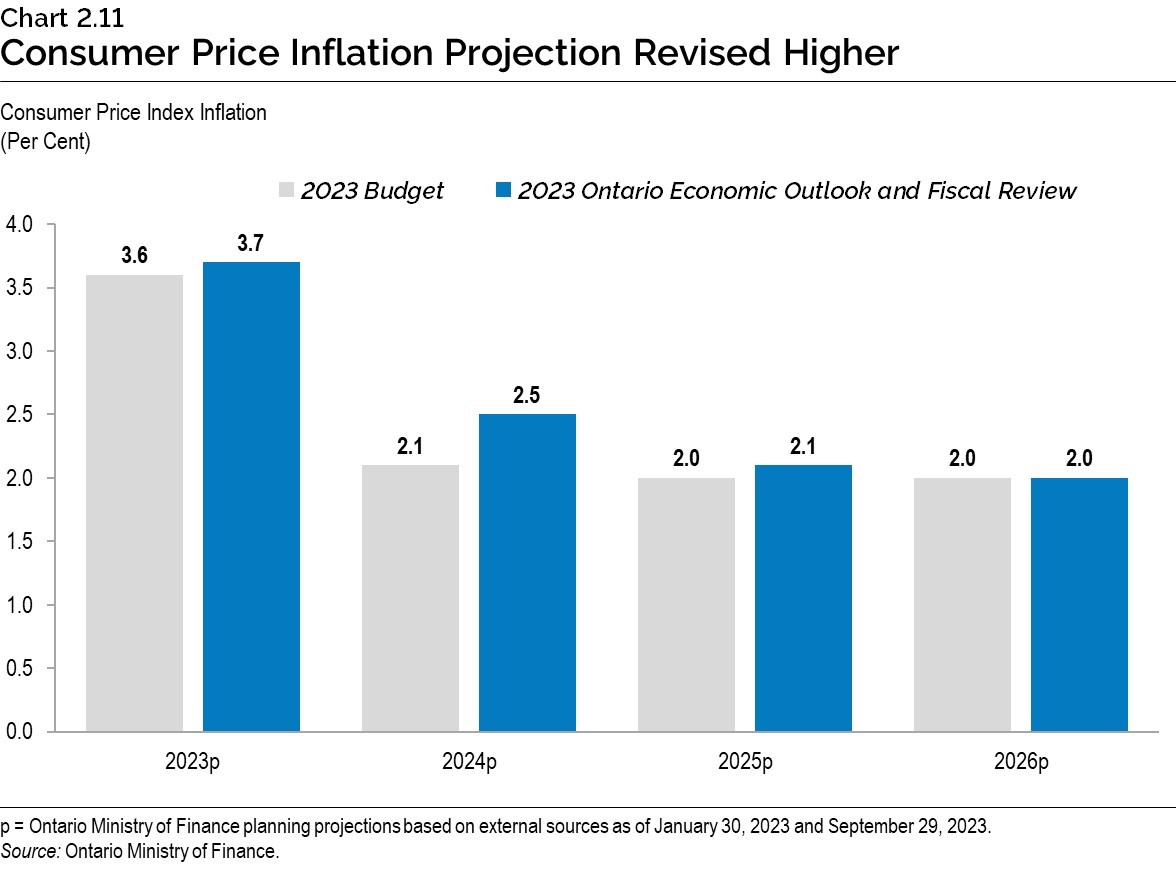
There are significant upside and downside risks around inflation. Consumer price inflation has been more persistent compared to expectations at the time of the 2023 Budget, leading to upward revisions to forecasts as well as contributing to continued Bank of Canada interest rate increases.
Housing
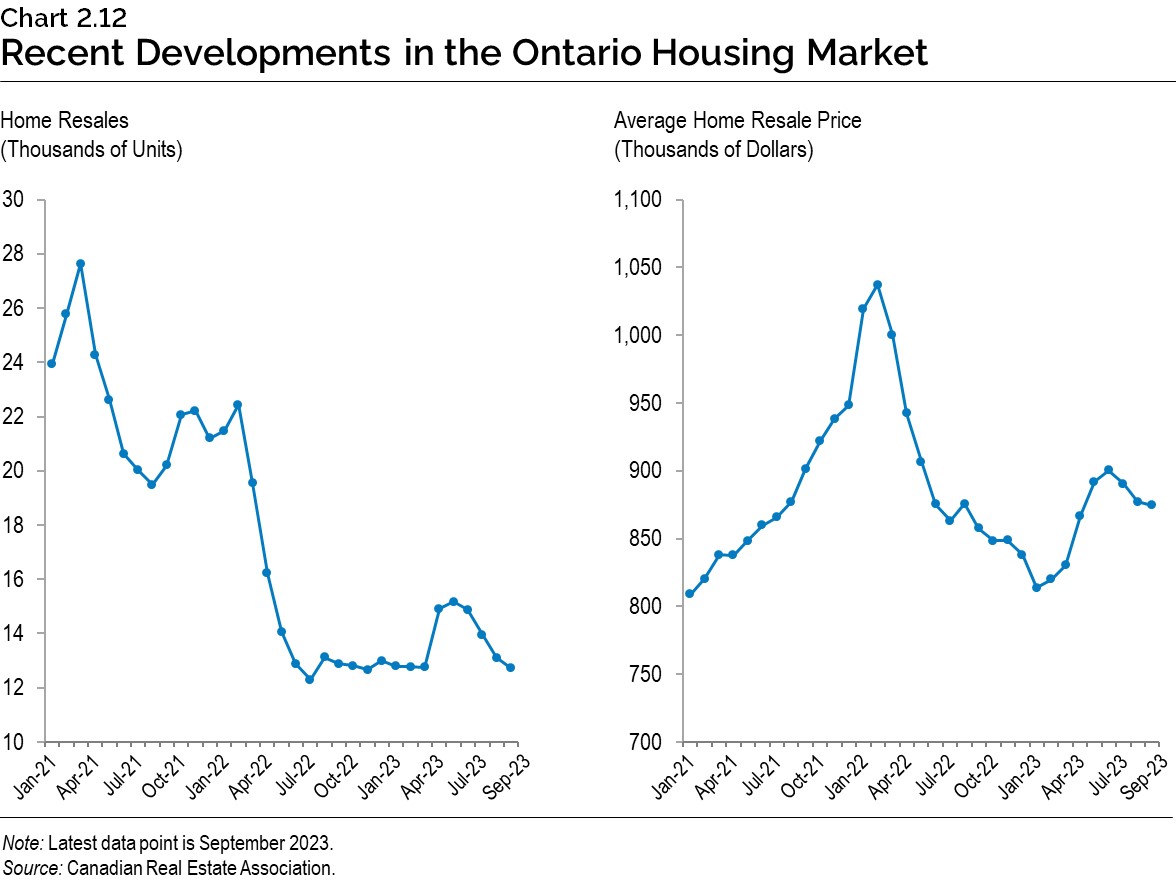
High interest rates continue to impact home resale activity in Ontario, as buyers and sellers adjust to rate increases by the Bank of Canada. Home resale volumes briefly strengthened in the spring following expectations that the Bank of Canada would leave interest rates on hold. However, continued interest rate increases since June contributed to a subsequent moderation in resale volumes, which by September were 16.2 per cent below the recent peak in May. The average home resale price edged up briefly, followed by a further moderation. In September, Ontario home resale prices were 2.9 per cent below the recent peak in June.
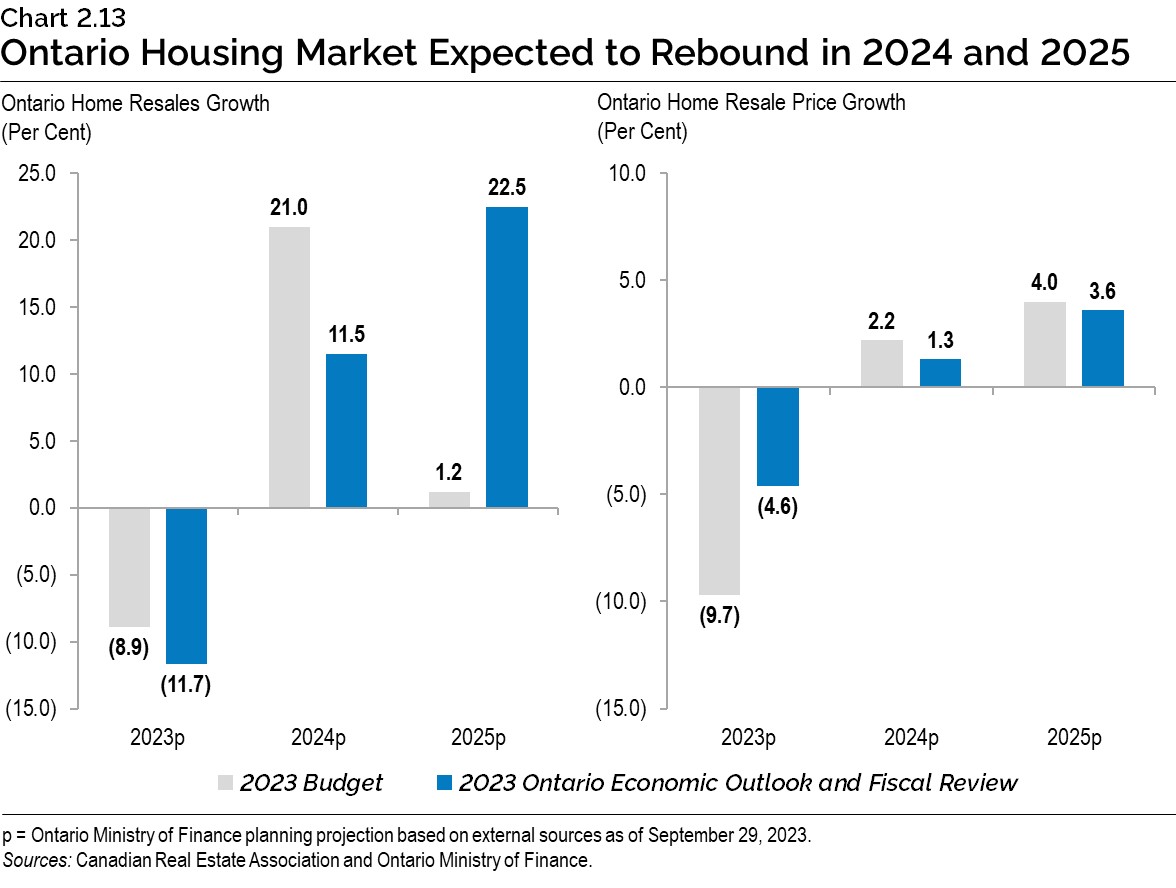
Going forward, home resales and prices are expected to rise in 2024 and 2025, supported by strong demographic demand and a more supportive interest rate environment. Home resales are expected to contract 11.7 per cent in 2023 before growing strongly by 11.5 per cent in 2024 and 22.5 per cent in 2025. The average home resale price is expected to contract 4.6 per cent in 2023, and grow 1.3 per cent in 2024 and 3.6 per cent in 2025.
Despite a challenging interest rate environment, the outlook for housing construction has improved in every year of the outlook since the 2023 Budget. As set out in Table 2.2, housing starts are projected to be 89,500 in 2023 and 84,500 in 2024, compared to the 2023 Budget projection of 80,300 in 2023 and 79,300 in 2024. Housing starts are expected to strengthen to 89,200 in 2025 and 94,400 in 2026. These projections, which are based on private-sector forecasts, underscore why the government has outlined its plan to build more homes, bringing home ownership within reach for more people.
Risks to the Outlook
Consumer price inflation has eased from its peak in many jurisdictions due to improvements in supply-side factors as well as tighter monetary policy on the part of major central banks. However, consumer price inflation remains above the targets of most central banks. Considerable uncertainty remains regarding the future path of inflation. A slower-than-expected return to central bank inflation targets could lead to further increases in interest rates or elevated interest rates for longer. This could pose significant downside risks to growth in many jurisdictions, including Canada.
The U.S. economy has proven resilient and continued to create jobs with low unemployment rates, despite aggressive policy rate increases from the Federal Reserve. However, elevated levels of federal debt alongside high and rising interest rates pose risks to the U.S. economy.
Other global developments continue to pose risks for Ontario. In recent months, a concerted effort to reduce oil supply by members of OPEC+, a group of major oil exporters, has led to steady increases in oil prices. High oil prices increase costs for businesses and consumers in Ontario. Conflicts around the world could continue to disrupt the supply of key commodities and further elevate risks. After a brief period of rebound in the first half of this year, China’s economic growth has slowed in recent months, posing downward risks to global growth.
Table 2.7 displays current estimates of the impact of sustained changes in key external factors on Ontario’s real GDP planning assumptions, assuming other external factors are unchanged. The relatively wide range of estimated impacts reflects the uncertainty regarding how the economy could respond to these changes in external conditions.
| Change in Real GDP Growth First Year |
Change in Real GDP Growth Second Year |
|
|---|---|---|
| Canadian Dollar Appreciates by Five Cents US | (0.1) to (0.7) | (0.2) to (0.8) |
| Crude Oil Prices Increase by $10 US per Barrel | (0.1) to (0.3) | (0.1) to (0.3) |
| U.S. Real GDP Growth Increases by One Percentage Point | +0.2 to +0.6 | +0.3 to +0.7 |
| Canadian Interest Rates Increase by One Percentage Point | (0.1) to (0.5) | (0.2) to (0.6) |
Table 2.7 footnotes:
Source: Ontario Ministry of Finance.
Economic Outlook Scenarios
To provide more transparency about the province’s economic outlook amid the elevated degree of economic uncertainty, the Ontario Ministry of Finance has developed Faster Growth and Slower Growth scenarios. These alternative scenarios should not be considered the best case or the worst case, but reasonable possible outcomes in this period of uncertainty.
| 2023p | 2024p | 2025p | 2026p | |
|---|---|---|---|---|
| Faster Growth Scenario | 1.7 | 2.1 | 2.3 | 3.1 |
| Planning Projection | 1.1 | 0.5 | 2.0 | 2.8 |
| Slower Growth Scenario | 0.7 | (0.9) | 1.9 | 2.7 |
Table 2.8 footnotes:
p = Ontario Ministry of Finance planning projection based on external sources and alternative scenarios.
Source: Ontario Ministry of Finance.
| 2023p | 2024p | 2025p | 2026p | |
|---|---|---|---|---|
| Faster Growth Scenario | 4.5 | 5.3 | 4.7 | 5.3 |
| Planning Projection | 3.6 | 2.9 | 4.2 | 4.8 |
| Slower Growth Scenario | 2.9 | 0.7 | 3.9 | 4.5 |
Table 2.9 footnotes:
p = Ontario Ministry of Finance planning projection based on external sources and alternative scenarios.
Source: Ontario Ministry of Finance.
By 2026, the level of real GDP in the Faster Growth scenario is 2.8 per cent higher than in the Planning Projection, while in the Slower Growth scenario, the level of real GDP is 2.0 per cent lower. By 2026, the level of nominal GDP in the Faster Growth scenario is 4.2 per cent higher than in the Planning Projection, while in the Slower Growth scenario, the level of nominal GDP is 3.4 per cent lower.
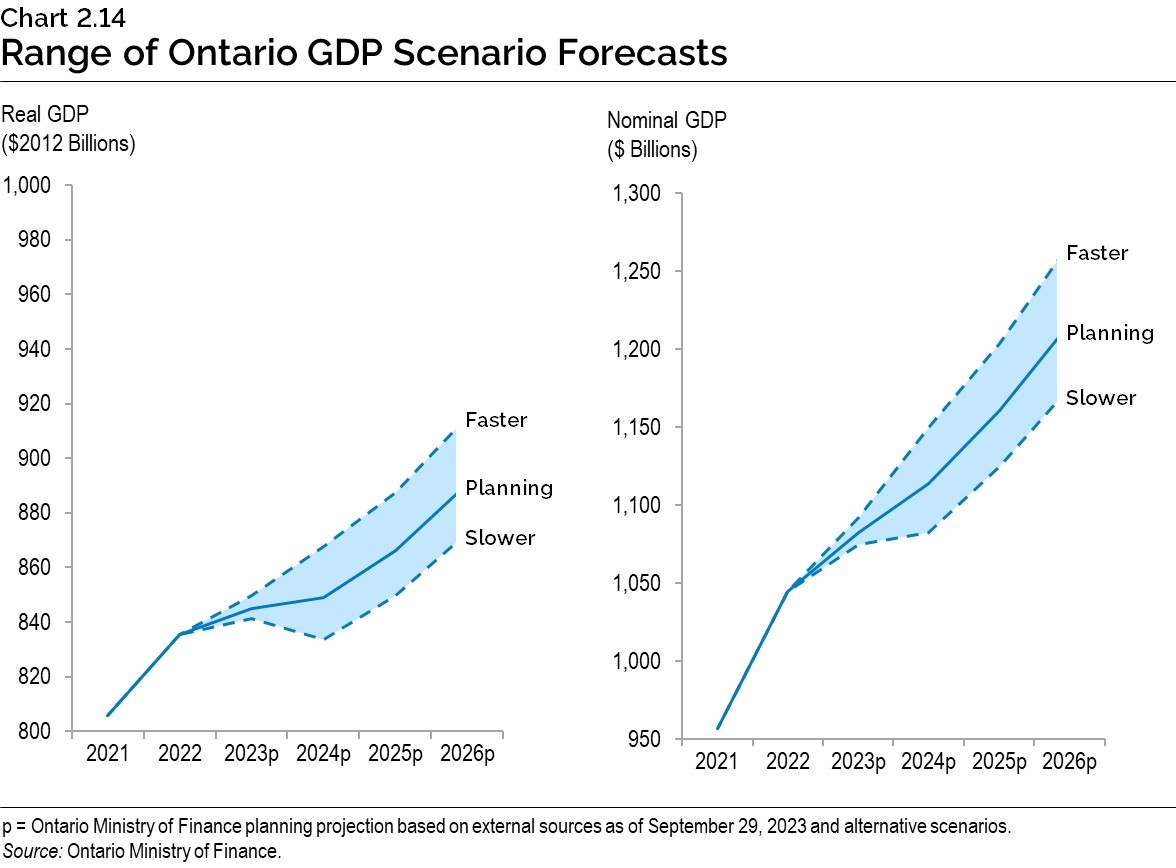
Chart Descriptions
Chart 2.1: Ontario Real GDP Outperforms Canada in the First Half of 2023
This bar chart illustrates quarterly real gross domestic product growth from the first quarter of 2022 to the second quarter of 2023 for Ontario and Canada. Real gross domestic product growth for Ontario is as follows: 1.0 per cent in 2022Q1; 1.0 per cent in 2022Q2; 0.4 per cent in 2022Q3; ‑0.2 per cent in 2022Q4; 0.8 per cent in 2023Q1 and 0.2 per cent in 2023Q2. Real gross domestic product growth for Canada is as follows: 0.6 per cent in 2022Q1; 0.9 per cent in 2022Q2; 0.6 per cent in 2022Q3; -0.0 per cent in 2022Q4; 0.6 per cent in 2023Q1 and -0.0 per cent in 2023Q2.
Sources: Ontario Ministry of Finance and Statistics Canada.
Chart 2.2: Ontario Unemployment Rate Remains Low
This line chart illustrates Ontario’s unemployment rate from January 1976 to September 2023. Ontario’s unemployment rate is represented as the solid blue line, and the historical average unemployment rate for Ontario is represented as the dashed black line. The historical average unemployment rate, which is the average of all observations dating back to January 1976, was 7.4 per cent as of September 2023. The Ontario unemployment rate was 6.0 per cent as of September 2023, which was the fifth consecutive monthly increase following a near all-time record low of 4.9 per cent in April 2023. Other labels on this chart are as follows, starting from the leftmost label: all-time record low unemployment rate of 4.7 per cent, recorded in both June and October of 1989; the peak unemployment rate during the 2008–2009 Global Financial Recession, which reached 9.6 per cent in June 2009; and the peak unemployment rate during the COVID-19 pandemic of 14.0 per cent, which was also the all-time record high, in May 2020.
Source: Statistics Canada.
Chart 2.3: Ontario Consumer Price Inflation Down but Remains Elevated
This line chart illustrates the year-over-year per cent change in the monthly Ontario Consumer Price Index (CPI). The solid blue line represents all items CPI inflation and the solid gray line represents Ontario CPI inflation excluding volatile food and energy components. Ontario headline CPI inflation reached a recent peak of 7.9 per cent in June 2022 and has followed a downward trend since that time. Ontario CPI inflation eased to 3.6 per cent in September 2023 following two consecutive months of acceleration. Similarly, Ontario inflation excluding food and energy eased to 3.2 per cent in September 2023, declining from the recent peak of 5.5 per cent in July 2022. Data labels on the chart are as follows: September 2023 all-items inflation of 3.6 per cent, chart all-items peak of 7.9 per cent in June 2022.
Source: Statistics Canada.
Chart 2.4: Ontario GDP Growth Projected to Normalize
The bar chart shows Ontario real and nominal GDP growth rates from 2021 to 2026. The difference between the nominal growth rate and real growth rate is the GDP inflation for each year.
Ontario nominal GDP growth was 10.3 per cent in 2021, 9.2 per cent in 2022 and is projected to be 3.6 per cent in 2023, 2.9 per cent in 2024, 4.2 per cent in 2025 and 4.8 per cent in 2026.
Ontario real GDP growth was 5.2 per cent in 2021, 3.7 per cent in 2022 and is projected to be 1.1 per cent in 2023, 0.5 per cent in 2024, 2.0 per cent in 2025 and 2.8 per cent in 2026.
Sources: Statistics Canada and Ontario Ministry of Finance.
Chart 2.5: Global Real GDP Growth Projections
This bar chart shows projected real GDP growth in per cent for 2023 and 2024 for the world economy, the United States, the Euro area and China. Real GDP growth in 2023 and 2024 is projected to be: 3.0 per cent and 2.9 per cent for the world economy; 2.2 per cent and 1.1 per cent in the United States; 0.7 per cent and 1.2 per cent in the Euro area; and 5.0 per cent and 4.2 per cent in China.
Sources: International Monetary Fund (October2023) and Blue Chip Economic Indicators (October 2023).
Chart 2.6: World Trade Volumes Slowing
This line chart shows the three-month moving average of an index of world trade volumes from January 2018 to July 2023. The line is relatively flat from January 2018 to December 2019. From December 2019 to June 2020, the index declined by 14.0 per cent. The index subsequently increased by 27.4 per cent between June 2020 and October 2022. The index then declined 3.3 per cent between October 2022 and July 2023.
Source: CPB Netherlands Bureau for Economic Policy Analysis World Trade Monitor (September 2023).
Chart 2.7: Short-Term Interest Rate Projections Move Higher
This line chart shows the three-month Government of Canada treasury bill rate in per cent from 2015 to 2022 and projections from 2023 to 2026. The rate averaged 0.5 per cent in 2015 and 2016, 0.7 per cent in 2017, 1.4 per cent in 2018, 1.7 per cent in 2019, 0.4 per cent in 2020, 0.1 per cent in 2021 and 2.3 per cent in 2022.
The 2023 Ontario Economic Outlook and Fiscal Review projects the rate to be 4.8 per cent in 2023, 4.4 per cent in 2024, 2.9 per cent in 2025 and 2.6 per cent in 2026. These projections compare to the 2023 Budget projections of 4.3 per cent in 2023, 3.3 per cent in 2024, 2.5 per cent in 2025 and 2.4 per cent in 2026.
Sources: Bank of Canada and Ontario Ministry of Finance.
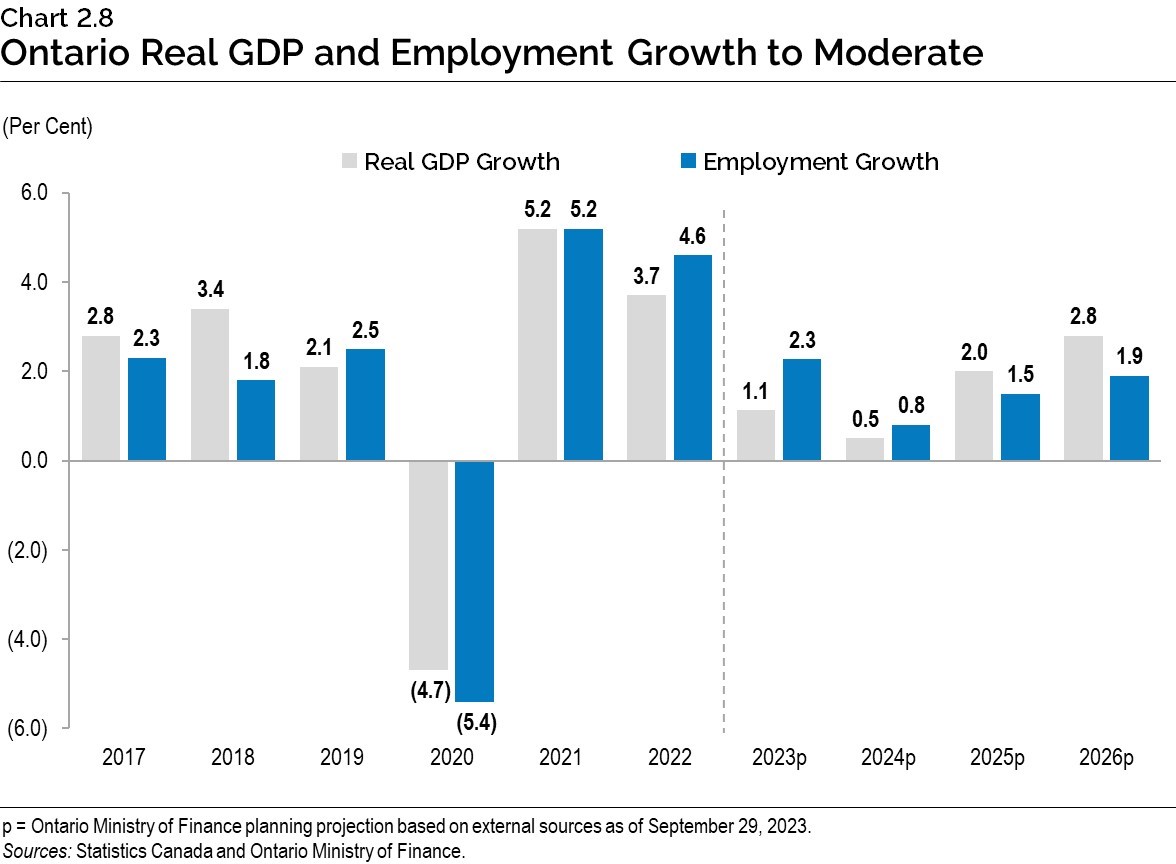
Chart 2.8: Ontario Real GDP and Employment Growth to Moderate
The bar chart shows real GDP and employment growth from 2017 to 2022 and Ontario Ministry of Finance planning projections for 2023 to 2026.
The largest declines were in 2020, with real GDP declining 4.7 per cent and employment decreasing by 5.4 per cent. Then in 2021, both real GDP and employment grew by 5.2 per cent.
Real GDP is forecast to grow 1.1 per cent in 2023, 0.5 per cent in 2024, 2.0 per cent in 2025 and 2.8 per cent in 2026. Employment is forecast to grow 2.3 per cent in 2023, 0.8 per cent in 2024, 1.5 per cent in 2025 and 1.9 per cent in 2026.
Sources: Statistics Canada and Ontario Ministry of Finance.
Chart 2.9: Ontario Household Spending Growth Projected to Continue
The bar chart shows nominal household spending growth from 2017 to 2022 and Ontario Ministry of Finance planning projections for 2023 to 2026.
The largest decline was in 2020, with spending down 7.5 per cent, then rebounding by 7.3 per cent in 2021 and 12.6 per cent in 2022.
Nominal household spending is projected to grow 5.4 per cent in 2023, 3.6 per cent in 2024, 4.2 per cent in 2025 and 4.7 per cent in 2026.
Sources: Statistics Canada and Ontario Ministry of Finance.
Chart 2.10: Inflation Projected to Ease, but Risks Remain
This line chart shows Ontario Consumer Price Index (CPI) annual inflation in per cent from 2017 to 2022, as well as projected Ontario CPI inflation for 2023 through 2026.
Ontario CPI inflation was near 2.0 per cent between 2017 and 2019, before slowing to 0.7 per cent in 2020. Inflation increased to 6.8 per cent in 2022.
Ontario CPI inflation is projected to be 3.7 per cent in 2023, 2.5 per cent in 2024, 2.1 per cent in 2025 and 2.0 per cent 2026.
The shaded area on the chart shows the range of private-sector forecasts for Ontario CPI inflation for 2023 through 2026. Private-sector forecasts range from 2.0 per cent to 3.8 per cent in 2024, 1.8 per cent to 2.6 per cent in 2025 and 1.8 per cent to 2.2 per cent in 2026.
Sources: Statistics Canada, Ontario Ministry of Finance and Ontario Ministry of Finance Survey of Forecasters.
Chart 2.11: Consumer Price Inflation Projection Revised Higher
This bar chart shows the planning projections for Consumer Price Index (CPI) annual inflation for 2023 through 2026 in the 2023 Economic Outlook and Fiscal Review as well as in the 2023 Budget.
In the 2023 Budget, Ontario CPI inflation was projected to be 3.6 per cent in 2023, 2.1 per cent in 2024, 2.0 per cent in 2025 and 2.0 per cent in 2026. In the 2023 Ontario Economic Outlook and Fiscal Review, Ontario CPI inflation is projected to be 3.7 per cent in 2023, 2.5 per cent in 2024, 2.1 per cent in 2025 and 2.0 per cent in 2026.
Sources: Statistics Canada and Ontario Ministry of Finance.
Chart 2.12: Recent Developments in the Ontario Housing Market
The left line chart shows monthly Ontario Home Resales from January 2021 to September 2023. Ontario Home Resales were 23,944 units in January 2021 and reached a high of 27,638 units in March 2021 before declining to an average of 12,796 in the second half of 2022. Home resales averaged 12,767 in the first quarter of 2023, increased to 15,177 units in May before declining to 12,720 units in September.
The right line chart shows the monthly Ontario Average Home Resale Price from January 2021 to September 2023. The Average Home Resale Price was $808,814 in January 2021 and increased to a peak of $1,037,102 in February 2022 before declining to $813,567 in January 2023. Since then, the Average Home Resale Price increased to $900,345 in June 2023 before easing to $874,579 in September.
Source: Canadian Real Estate Association.
Chart 2.13: Ontario Housing Market Expected to Rebound in 2024 and 2025
The left bar chart compares the projected growth in Ontario Home Resales between the 2023 Budget and the 2023 Ontario Economic Outlook and Fiscal Review. Ontario Home Resales were projected to decline 8.9 per cent in 2023 and grow 21.0 per cent in 2024 and 1.2 per cent in 2025 in the 2023 Budget. They are projected to decline 11.7 per cent in 2023 and grow 11.5 per cent in 2024 and 22.5 per cent in 2025 in the 2023 Ontario Economic Outlook and Fiscal Review.
The right bar chart compares the projected growth in the Ontario Average Home Resale Price between the 2023 Budget and the 2023 Ontario Economic Outlook and Fiscal Review. The Ontario Average Home Resale price was projected to decline 9.7 per cent in 2023 and grow 2.2 per cent in 2024 and 4.0 per cent in 2025 in the 2023 Budget. It is projected to decline 4.6 per cent in 2023 and grow 1.3 per cent in 2024 and 3.6 per cent in 2025 in the 2023 Ontario Economic Outlook and Fiscal Review.
Sources: Canadian Real Estate Association and Ontario Ministry of Finance.
Chart 2.14: Range of Ontario GDP Scenario Forecasts
The line chart on the left shows Ontario real GDP for 2021 to 2022 and the Ontario Ministry of Finance planning projection for real GDP for 2023 to 2026, in billions of 2012 dollars. Separate lines show the levels of real GDP in the Faster Growth and the Slower Growth scenarios for 2023 to 2026. Ontario real GDP was $835 billion in 2022. In the Planning Projection, Ontario real GDP is projected to rise from $845 billion in 2023 to $890 billion in 2026. In the Faster Growth scenario, Ontario real GDP is projected to rise from $850 billion in 2023 to $915 billion in 2026. In the Slower Growth scenario, Ontario real GDP is projected to rise from $841 billion in 2023 to $873 billion in 2026.
The line chart on the right shows Ontario nominal GDP for 2021 to 2022 and the Ontario Ministry of Finance planning projection for nominal GDP for 2023 to 2026, in billions of dollars. Separate lines show the levels of nominal GDP in the Faster Growth and the Slower Growth scenarios for 2023 to 2026. Ontario nominal GDP was $1,045 billion in 2022. In the Planning Projection, Ontario nominal GDP is projected to rise from $1,082 billion in 2023 to $1,216 billion in 2026. In the Faster Growth scenario, Ontario nominal GDP is projected to rise from $1,092 billion in 2023 to $1,267 billion in 2026. In the Slower Growth scenario, Ontario nominal GDP is projected to rise from $1,075 billion in 2023 to $1,175 billion in 2026.
Source: Ontario Ministry of Finance.