Introduction
In spite of economic uncertainty and risk, Ontario remains committed to balancing the budget. The 2023 Ontario Economic Outlook and Fiscal Review is projecting a deficit of $5.6 billion in 2023–24. Over the medium term, the government projects a deficit of $5.3 billion in 2024–25 and a surplus of $0.5 billion in 2025–26.
The net debt-to-gross domestic product (GDP) ratio is projected to be 38.4 per cent in 2023–24, 0.1 percentage point higher since 2022–23.
| Actual 2022–23 |
Current Outlook 2023–24 |
Medium-Term Outlook 2024–25 |
Medium-Term Outlook 2025–26 |
|
|---|---|---|---|---|
| Revenue | 192.9 | 201.8 | 206.7 | 220.0 |
| Expense — Programs | 186.4 | 193.0 | 196.2 | 202.3 |
| Expense — Interest on Debt | 12.4 | 13.4 | 14.3 | 15.2 |
| Total Expense | 198.8 | 206.4 | 210.5 | 217.5 |
| Surplus/(Deficit) Before Reserve | (5.9) | (4.6) | (3.8) | 2.5 |
| Reserve | – | 1.0 | 1.5 | 2.0 |
| Surplus/(Deficit) | (5.9) | (5.6) | (5.3) | 0.5 |
| Net Debt as a Per Cent of GDP | 38.3% | 38.4% | 39.1% | 38.7% |
| Net Debt as a Per Cent of Revenue | 207.6% | 206.2% | 210.8% | 204.2% |
| Interest on Debt as Per Cent of Revenue | 6.4% | 6.7% | 6.9% | 6.9% |
Table 3.1 footnotes:
Notes: Numbers may not add due to rounding. Current and medium-term outlook primarily reflect information available as of September 29, 2023.
Sources: Ontario Treasury Board Secretariat and Ontario Ministry of Finance.
Key Changes in 2023–24 Since the 2023 Budget
Ontario’s 2023–24 deficit is projected to be $5.6 billion — a deterioration of $4.3 billion from the outlook published in the 2023 Budget. This reflects updated economic and revenue information and higher contingencies to mitigate near-term risks.
Revenues in 2023–24 are projected to be $201.8 billion, $2.6 billion lower than forecast in the 2023 Budget. This decrease is largely driven by lower-than-expected taxation revenue. This forecast is based on information available to September 29, 2023.
Program expense is projected to be $193.0 billion, $2.3 billion higher than the forecast in the 2023 Budget, primarily due to the replenishment of the Contingency Fund to add greater flexibility to the fiscal plan.
Ontario is forecast to pay $13.4 billion in interest costs in 2023–24, $0.6 billion lower than the forecast in the 2023 Budget.
The net debt-to-GDP ratio is now projected to be 38.4 per cent in 2023–24, 0.6 percentage points higher than the 37.8 per cent forecast in the 2023 Budget. The net debt-to-GDP ratio increased mainly due to higher than previously projected deficits.
The 2023–24 outlook also maintains a $1.0 billion reserve, unchanged from the 2023 Budget, to protect the fiscal plan against unforeseen adverse changes in Ontario’s revenue and expense forecasts for the remainder of the fiscal year. This is part of the government’s flexible fiscal plan to respond to uncertainty and risks.
| 2023 Budget | Current Outlook | In-Year Change | |
|---|---|---|---|
| Revenue | 204.4 | 201.8 | (2.6) |
| Expense — Programs | 190.6 | 193.0 | 2.3 |
| Expense — Interest on Debt | 14.1 | 13.4 | (0.6) |
| Total Expense | 204.7 | 206.4 | 1.7 |
| Surplus/(Deficit) Before Reserve | (0.3) | (4.6) | (4.3) |
| Reserve | 1.0 | 1.0 | – |
| Surplus/(Deficit) | (1.3) | (5.6) | (4.3) |
Table 3.2 footnotes:
Note: Numbers may not add due to rounding.
Sources: Ontario Treasury Board Secretariat and Ontario Ministry of Finance.
Revenue
The 2023–24 total revenue outlook is $201.8 billion, $2.6 billion lower than projected in the 2023 Budget and the 2023–24 First Quarter Finances. The decrease in the revenue forecast in 2023–24 is mainly due to lower taxation revenues, partially offset by higher Government of Canada Transfers and net income from Government Business Enterprises.
| 2023–24 | |
|---|---|
| 2023 Budget Total Revenue | 204,367 |
| Revenue Changes in the 2023–24 First Quarter Finances | 0.2 |
| Revenue Changes Since the 2023–24 First Quarter Finances — Sales Tax | 2,380 |
| Revenue Changes Since the 2023–24 First Quarter Finances — Corporations Tax | 1,350 |
| Revenue Changes Since the 2023–24 First Quarter Finances — Land Transfer Tax | 329 |
| Revenue Changes Since the 2023–24 First Quarter Finances — Gasoline Tax and Fuel Tax | (429) |
| Revenue Changes Since the 2023–24 First Quarter Finances — Personal Income Tax | (6,588) |
| Revenue Changes Since the 2023–24 First Quarter Finances — All Other Taxes | (51) |
| Revenue Changes Since the 2023–24 First Quarter Finances — Total Taxation Revenue | (3,009) |
| Revenue Changes Since the 2023–24 First Quarter Finances — Government of Canada Transfers | 242 |
| Revenue Changes Since the 2023–24 First Quarter Finances — Government Business Enterprises | 447 |
| Revenue Changes Since the 2023–24 First Quarter Finances — Other Non-Tax Revenue | (246) |
| Total Revenue Changes Since the 2023–24 First Quarter Finances | (2,566) |
| Total Revenue Changes Since the 2023 Budget | (2,566) |
| 2023 Ontario Economic Outlook and Fiscal Review Total Revenue Outlook | 201,802 |
Table 3.3 footnotes:
Note: Numbers may not add due to rounding.
Source: Ontario Ministry of Finance.
Key changes in the revenue outlook compared with the 2023–24 First Quarter Finances forecast include:
- Sales Tax revenue projections increased by $2,380 million mainly due to new information from the federal government suggesting higher Harmonized Sales Tax (HST) collected in 2022, which increased the base upon which the outlook is derived.
- Corporations Tax revenue projections increased by $1,350 million mainly due to higher-than-expected corporate profitability in the first half of 2023.
- Land Transfer Tax revenue projections are higher by $329 million mainly reflecting a smaller-than-expected decline in home resale prices in 2023.
- Gasoline Tax and Fuel Tax projections combined decreased by $429 million due to the proposed 6‐month extension of the reduction to the Gasoline Tax by 5.7 cents per litre and Fuel Tax by 5.3 cents per litre and lower projected fuel consumption volumes. See Annex: Details of Tax Measures and Other Legislative Initiatives for further information.
- Personal Income Tax revenue projections decreased by $6,588 million, mainly due to lower‐than‐expected revenues from the processing of 2022 and prior years’ tax returns, partially offset by stronger growth in compensation of employees in 2023.
- Projections for All Other Taxes combined decreased by $51 million, which is mainly due to lower-than-expected revenues from the Ontario Health Premium and the Beer, Wine and Spirits Taxes, partially offset by higher projected revenues from Employer Health Tax and the Ontario Portion of the Federal Cannabis Excise Duty.
- Government of Canada Transfers projections increased by $242 million, mainly reflecting additional federal investments in the Labour Market Transfer Agreements.
- Net income from Government Business Enterprises projections increased by $447 million, mainly due to higher revenue forecasts for Ontario Power Generation (OPG) from the Ontario Nuclear Funds. This also reflects iGaming Ontario (iGO) revenue consolidated as a Government Business Enterprise (GBE) in the Public Accounts of Ontario 2022–2023.
- Other Non-Tax Revenues projections combined are lower by $246 million mainly due to the reclassification of revenues for iGO from Non-Tax Revenue to a GBE in the Public Accounts of Ontario 2022–2023. It also reflects lower revenue due to the fare integration of public transit between neighbouring transit systems.
Expense
The 2023–24 total expense outlook is projected to be $206.4 billion, $1.7 billion higher than both the 2023 Budget and the 2023–24 First Quarter Finances. New investments are primarily offset by the Contingency Fund and include supports for home and community care, municipalities and housing.
| 2023–24 | |
|---|---|
| 2023 Budget Total Expense | 204,680 |
| Total Expense Changes in the 2023–24 First Quarter Finances | 0.2 |
| Program Expense Changes Since the 2023–24 First Quarter Finances — Home and Community Care Modernization Plan | 180 |
| Program Expense Changes Since the 2023–24 First Quarter Finances — Addressing Homelessness for Asylum Claimants | 42 |
| Program Expense Changes Since the 2023–24 First Quarter Finances — Expanding the Basic Constable Training Program | 15 |
| Program Expense Changes Since the 2023–24 First Quarter Finances — Wheatley Supports | 8 |
| Program Expense Changes Since the 2023–24 First Quarter Finances — Resources for the Landlord and Tenant Board | 6 |
| Program Expense Changes Since the 2023–24 First Quarter Finances — Fare and Service Integration | 3 |
| Program Expense Changes Since the 2023–24 First Quarter Finances — All Other Changes | (76) |
| Program Expense Changes Since the 2023–24 First Quarter Finances — Total New Allocated Spending | 179 |
| Program Expense Changes Since the 2023–24 First Quarter Finances — Top-Up of the Contingency Fund | 2,500 |
| Program Expense Changes Since the 2023–24 First Quarter Finances — Drawdown of the Contingency Fund | (336) |
| Total Program Expense Changes Since the 2023–24 First Quarter Finances | 2,343 |
| Interest on Debt Change Since the 2023–24 First Quarter Finances | (609) |
| Total Expense Changes Since the 2023–24 First Quarter Finances | 1,734 |
| Total Expense Changes Since the 2023 Budget | 1,734 |
| 2023 Ontario Economic Outlook and Fiscal Review Total Expense Outlook | 206,414 |
Table 3.4 footnotes:
Note: Numbers may not add due to rounding.
Sources: Ontario Treasury Board Secretariat and Ontario Ministry of Finance.
Key investments since the 2023–24 First Quarter Finances include:
- $180 million to support stabilization and expansion in the home and community care sectors as part of the government’s $569 million planned investment in 2023–24, to get more people connected to care in the comfort of their own home and community;
- $42 million to support the City of Toronto and other impacted municipalities across the province through the Canada-Ontario Housing Benefit to provide urgent assistance to a rapidly growing number of asylum claimants and other at-risk populations;
- $15 million to recruit and train more police officers by removing tuition fees for the Basic Constable Training program at the Ontario Police College and increasing the number of recruits that can be trained each year;
- $8 million to support the Municipality of Chatham-Kent with ongoing emergency management, investigation and community recovery expenses related to the Wheatley explosion in August 2021;
- $6 million to increase resources at the Landlord and Tenant Board to improve service standards and reduce the time it takes for applications and decisions. These resources include 45 adjudicators plus five operational staff, more than doubling the number of full-time adjudicators at the Landlord and Tenant Board;
- $3 million for GO Transit fare and service integration including co-fare discounts and increased PRESTO discounts for youth and postsecondary students; and
- A decrease of $76 million, primarily due to an accounting reclassification for iGaming Ontario as a Government Business Enterprise, partially offset by economic development support initiatives.
Additionally, the Contingency Fund has been increased by an additional $2.5 billion to support greater flexibility in the fiscal plan to help protect against unforeseen changes and mitigate expense risks.
Interest on Debt expense is projected to be $13.4 billion, $0.6 billion lower than the forecast in the 2023–24 First Quarter Finances and the 2023 Budget.
Prudence in 2023–24
The Ontario government continues to maintain a responsible and flexible fiscal plan to respond to uncertainty and risks. The Fiscal Sustainability, Transparency and Accountability Act, 2019 requires Ontario’s fiscal plan to incorporate prudence in the form of a reserve to protect the fiscal outlook against unforeseen adverse changes in the province’s revenue and expense, including those resulting from changes in Ontario’s economic performance. The 2023 Budget included a reserve of $1.0 billion in 2023–24, which has been maintained as part of the current fiscal outlook. In addition, the Contingency Fund is maintained to help mitigate expense risks. For 2023–24, after a $2.5 billion top-up in the 2023 Ontario Economic Outlook and Fiscal Review, the Contingency Fund has a projected balance of $5.4 billion.
Medium-Term Fiscal Plan
The government is projecting deficits of $5.6 billion in 2023–24 and $5.3 billion in 2024–25 followed by a surplus of $0.5 billion in 2025–26. This reflects updated economic and revenue information and higher contingencies to mitigate near-term risks in 2023–24, and slower economic growth projections in 2024 and 2025.
Over the medium term, revenue is forecast to increase from $201.8 billion in 2023–24 to $220.0 billion in 2025–26, while total expense is projected to increase from $206.4 billion to $217.5 billion over the same period.
Medium-Term Revenue Outlook
| Actual 2022–23 |
Current Outlook 2023–24 |
Medium-Term Outlook 2024–25 |
Medium-Term Outlook 2025–26 |
|
|---|---|---|---|---|
| Revenue — Personal Income Tax | 44.2 | 49.4 | 51.2 | 54.3 |
| Revenue — Sales Tax | 36.1 | 37.7 | 38.7 | 40.7 |
| Revenue — Corporations Tax | 27.8 | 26.0 | 25.8 | 27.4 |
| Revenue — Ontario Health Premium | 4.4 | 4.8 | 5.0 | 5.2 |
| Revenue — Education Property Tax | 6.0 | 5.7 | 5.8 | 5.8 |
| Revenue — All Other Taxes | 18.0 | 17.5 | 19.4 | 21.5 |
| Total Taxation Revenue | 136.5 | 141.2 | 145.8 | 154.8 |
| Government of Canada | 31.3 | 35.1 | 35.4 | 37.0 |
| Income from Government Business Enterprises | 6.1 | 6.8 | 6.5 | 8.4 |
| Other Non-Tax Revenue | 19.0 | 18.7 | 19.0 | 19.8 |
| Total Revenue | 192.9 | 201.8 | 206.7 | 220.0 |
Table 3.5 footnotes:
Note: Numbers may not add due to rounding.
Source: Ontario Ministry of Finance.
The taxation revenue outlook reflects the impact of finalized 2022–23 results and the updated economic growth outlook since the 2023 Budget. See Chapter 2: Economic Performance and Outlook for further details.
The primary driver of the forecast for Personal Income Tax (PIT) revenue is the outlook for growth in the compensation of employees. Between 2023–24 and 2025–26, PIT revenue is projected to grow at an average annual rate of 4.8 per cent.
The Sales Tax revenue projection is based primarily on the outlook for household consumption spending. Sales Tax revenue is projected to grow at an average annual rate of 3.8 per cent between 2023–24 and 2025–26.
The forecast for Corporations Tax revenue is mainly driven by projections of net operating surplus. Corporations Tax revenue is projected to grow at an average annual rate of 2.7 per cent between 2023–24 and 2025–26.
The Ontario Health Premium revenue forecast is based primarily on the outlook for growth in the compensation of employees. Ontario Health Premium revenue is projected to increase at an average annual rate of 4.0 per cent between 2023–24 and 2025–26.
Education Property Tax revenue is based primarily on the outlook for growth in the property assessment base resulting from new construction activities. Revenues are projected to remain relatively stable over the term of the outlook.
Revenues from All Other Taxes are projected to increase at an average annual rate of 10.7 per cent between 2023–24 and 2025–26. This includes revenues from all other taxes including the Employer Health Tax; Land Transfer Tax (LTT); Beer, Wine and Spirits Taxes; and volume-based taxes such as the Gasoline Tax, the Fuel Tax and the Tobacco Tax. The strong average annual growth mainly reflects higher LTT arising from a projected recovery in the housing market by 2025–26, and the impact of the temporary reduction to the Gasoline Tax by 5.7 cents per litre and Fuel Tax by 5.3 cents per litre. Excluding LTT and Gasoline and Fuel Taxes, All Other Taxes are projected to increase at an average annual rate of 3.7 per cent between 2023–24 and 2025–26.
The forecast for Government of Canada transfers is based on existing federal–provincial funding agreements and formulas. Federal transfers are projected to increase at an average annual rate of 2.7 per cent from 2023–24 to 2025–26.
The outlook for income from Government Business Enterprises (GBEs) is based on Ontario Ministry of Finance estimates for Hydro One Ltd. (Hydro One) and projections provided by Ontario Power Generation (OPG), the Ontario Cannabis Store (OCS), the Liquor Control Board of Ontario (LCBO), the Ontario Lottery and Gaming Corporation (OLG) and iGaming Ontario (iGO). Net incomes of GBEs are projected to increase at an average annual rate of 11.0 per cent from 2023–24 to 2025–26.
The forecast for Other Non-Tax Revenue is based on projections provided by government ministries and provincial agencies. The outlook for Other Non-Tax Revenue is projected to increase at an average annual rate of 2.8 per cent from 2023–24 to 2025–26.
Economic and Fiscal Outlook Scenarios
To illustrate the potential impacts of elevated economic uncertainty, the Ontario Ministry of Finance has developed two plausible alternative scenarios that the economy could take over the next several years. See Chapter 2: Economic Performance and Outlook for further details.
Based on the two alternative nominal GDP economic scenarios, two taxation revenue scenarios were developed. The Faster Growth and Slower Growth scenarios each represent a potential path intended to illustrate a broader range of possible outcomes but should not be considered as the best case or the worst case.
In the Faster Growth scenario, total taxation revenue is $9.4 billion higher in 2025–26 than the Planning Projection, while in the Slower Growth scenario, total taxation revenue is $8.1 billion lower.
| 2023–24p | 2024–25p | 2025–26p | |
|---|---|---|---|
| Faster Growth Scenario | 143.5 | 152.8 | 164.2 |
| Planning Projection | 141.2 | 145.8 | 154.8 |
| Slower Growth Scenario | 139.2 | 139.5 | 146.7 |
Table 3.6 footnotes:
p = Ontario Ministry of Finance Planning Projection based on external sources and alternative scenarios.
Note: Numbers may not add due to rounding.
Source: Ontario Ministry of Finance.
In the event that the alternative economic scenarios materialize as opposed to the Planning Projection, Ontario’s fiscal plan would also change as a result.
Under the Faster Growth scenario, the deficit outlook may improve to $3.3 billion in 2023–24, and reach surpluses of $1.9 billion in 2024–25 and $10.5 billion in 2025–26. However, if the Slower Growth scenario takes place instead, the deficit outlook may deteriorate to $7.7 billion in 2023–24, $11.9 billion in 2024–25, and $8.3 billion in 2025–26.
In these alternative outlook scenarios, program expenditures are assumed to be unchanged compared to the medium‐term expense outlook, and only revenue and interest on debt are adjusted.
Medium-Term Expense Outlook
The total expense outlook is projected to grow from $206.4 billion in 2023–24 to $217.5 billion in 2025–26 as the government continues to invest in health, education and infrastructure.
Ontario’s program expense outlook is projected to increase from $193.0 billion in 2023–24 to $202.3 billion in 2025–26.
| Actual 2022–23 |
Current Outlook 2023–24 |
Medium-Term Outlook 2024–25 |
Medium-Term Outlook 2025–26 |
|
|---|---|---|---|---|
| Base Programs1 — Health Sector | 75.1 | 81.2 | 84.2 | 87.6 |
| Base Programs2 — Education Sector3 | 33.6 | 34.7 | 36.4 | 37.5 |
| Base Programs4 — Postsecondary Education Sector | 11.6 | 12.1 | 12.5 | 13.0 |
| Base Programs5 — Children, Community and Social Services Sector | 18.1 | 19.4 | 19.9 | 19.9 |
| Base Programs6 — Justice Sector | 5.3 | 5.5 | 5.3 | 5.2 |
| Base Programs7 — Other Programs | 30.1 | 40.1 | 37.8 | 39.1 |
| Total Base Programs | 173.8 | 193.0 | 196.2 | 202.3 |
| COVID-19 Time-Limited Funding | 6.3 | – | – | – |
| Other One-Time Expenses | 6.3 | – | – | – |
| Total Programs | 186.4 | 193.0 | 196.2 | 202.3 |
| Interest on Debt | 12.4 | 13.4 | 14.3 | 15.2 |
| Total Expense | 198.8 | 206.4 | 210.5 | 217.5 |
Table 3.7 footnotes:
[1], [2], [4], [5], [6], [7] For presentation purposes in the 2023 Ontario Economic Outlook and Fiscal Review, one-time COVID-19-related spending in 2022–23 has been included within COVID-19 Time-Limited Funding. This funding will no longer be reported separately, starting in 2023–24.
[3] Excludes Teachers’ Pension Plan. Teachers’ Pension Plan expense is included in Other Programs.
Note: Numbers may not add due to rounding.
Sources: Ontario Treasury Board Secretariat and Ontario Ministry of Finance.
The government is continuing to make key investments in health, education and other critical public services as part of its plan to build a stronger Ontario. In 2023–24, program expense is projected to increase by $6.6 billion compared to 2022–23, or 3.5 per cent. Over the medium-term outlook, program expense is projected to increase every year, growing at an average annual rate of 2.4 per cent from 2023–24 to 2025–26.
Highlights of changes to the program expense outlook over the medium term include the following:
- Health Sector expense is projected to increase from $81.2 billion in 2023–24 to $87.6 billion in 2025–26. The growth is primarily due to investments to:
- Address the growing demands in the health sector, including funding for hospitals and cancer treatment services to respond to Ontario’s aging and growing population, and provide stability;
- Enhance pediatric care to better connect children and youth to surgeries, diagnostic imaging, emergency care and mental health services;
- Support Health Human Resources initiatives to optimize the existing workforce and recruit and retain health care providers;
- Enhance emergency health services by reducing wait times;
- Improve and expand the home and community care sector; and
- Support mental health and addictions services through the Roadmap to Wellness: A Plan to Build Ontario’s Mental Health and Addictions System.
- Education Sector expense is projected to increase from $34.7 billion in 2023–24 to $37.5 billion in 2025–26. Key investments include:
- Supports to school boards for student learning and success, including funding for reading and math programs;
- Funding to address enrolment growth and commitments consistent with labour agreements reached; and
- Continued implementation of the Canada‐wide Early Learning and Child Care Agreement to increase access to high quality affordable child care while reducing average out‐of‐pocket child care fees.
- Postsecondary Education Sector expense is projected to increase from $12.1 billion in 2023–24 to $13.0 billion in 2025–26. This is mainly due to:
- Higher college sector spending due to increasing enrolment; and
- Investments of over $428 million to support Health Human Resources initiatives, including the expansion of medical school seats and the Ontario Learn and Stay Grant where students in targeted nursing, paramedic and medical laboratory technologist programs study and work in underserviced communities.
- Children, Community and Social Services Sector expense is projected to increase from $19.4 billion in 2023–24 to $19.9 billion in 2025–26, primarily due to the July 1, 2023, adjustment for inflation in the monthly core allowance rates for the Ontario Disability Support Program and the maximum monthly amount for the Assistance for Children with Severe Disabilities Program.
- Justice Sector expense is projected to decrease from $5.5 billion in 2023–24 to $5.2 billion in 2025–26. Investments in this sector include funding provided in 2023–24 for frontline operations of the Ontario Provincial Police (OPP), additional funding for the First Nations and Inuit Policing Program, as well as investments to help police identify and dismantle organized auto theft crime, strengthen the province’s bail system and ensure that offenders comply with their bail conditions.
- Other Programs expense is projected to decrease from $40.1 billion in 2023–24 to $39.1 billion in 2025–26. The changes over this period primarily reflect a $2.5 billion top-up in the Contingency Fund in 2023–24 to support greater flexibility in the fiscal plan to help protect against unforeseen changes and mitigate expense risks. Key Other Programs investments include:
- $3.5 billion over three years, beginning in 2023–24, as part of the government’s multi-year commitment to improve access to high-speed internet for every community across Ontario by the end of 2025;
- $224 million in 2023–24 to support the development and expansion of brick-and-mortar training centres to train more workers for careers in the skilled trades and other in‐demand jobs through the Skills Development Fund Capital Stream; and
- $110 million over three years, beginning in 2023–24, to improve emergency readiness and enhance Ontario’s capacity to respond to emergencies.
The total expense outlook includes Interest on Debt expense, which is projected to increase from $13.4 billion in 2023–24 to $15.2 billion in 2025–26.
Prudence Built Into the Medium-Term Outlook
In keeping with sound fiscal practices, Ontario’s revenue outlook is based on prudent economic planning projections, as discussed in Chapter 2: Economic Performance and Outlook.
The government maintains a responsible and flexible fiscal plan to respond to uncertainty and risks. Ontario incorporates prudence in the form of a reserve to protect the fiscal outlook against unforeseen adverse changes in the province’s revenue and expense, including those resulting from changes in Ontario’s economic performance.
The reserve has been set at $1.5 billion in 2024–25 and $2.0 billion 2025–26, down from the levels in the 2023 Budget of $2.0 billion and $4.0 billion, respectively. In addition, the Contingency Fund is maintained to help mitigate expense risks — for example, in cases where health and safety may be compromised, and which may otherwise adversely affect Ontario’s fiscal performance.
The government will work to preserve the fiscal flexibility necessary to respond to unforeseen events and support a long-term plan that will enhance transparency and accountability, invest in the future of Ontario, and help protect the province against potential economic challenges.
Transparency and Risks
The government is committed to being open and transparent about the state of Ontario’s finances. This principle is reflected in the Fiscal Sustainability, Transparency and Accountability Act, 2019, which stipulates that Ontario’s fiscal policy should be clearly articulated and information about it should be readily available to the public without charge.
While mid-year updates to the government’s finances are informed by the latest information available, key information still to be received over the remainder of the fiscal year may present further upside and downside risks, which could materially affect the fiscal outlook. Revenue could be affected by new information from the Canada Revenue Agency on tax return processing for 2023 and previous taxation years, changes in the economic outlook and the evolution of private-sector economic forecasts, which the province uses to develop its own revenue projections, while expenses could be impacted by changes in utilization of large demand-driven programs.
To ensure a reasonable and prudent economic forecast, the government’s key economic planning projections are set below the average of private‐sector forecasts in each year. For 2023 onwards, the planning assumptions are set 0.1 percentage points below the private‐sector average to reflect the elevated degree of uncertainty over the outlook.
While the planning assumptions for economic growth are reasonable and prudent, the Ontario Ministry of Finance has also developed Faster Growth and Slower Growth scenarios to provide greater transparency around Ontario’s economic and fiscal outlook amid heightened economic uncertainty.
As a matter of transparent fiscal management, financial pressures are monitored throughout the fiscal year by the Ontario Treasury Board Secretariat, with the goal of ensuring that robust and prudent methodologies are used to develop forecasts. Other important risk management tools include closely tracking the pace of implementation of initiatives and proactively identifying emerging program and policy risks. Comprehensive analysis of known pressures informs the fiscal planning processes, including the development of plans to mitigate and manage fiscal pressures, as well as maintaining adequate contingencies as part of the medium-term fiscal projections in respect of the government’s flexible fiscal plan to respond to uncertainty and risks.
In addition to the key demand sensitivities and economic risks to the fiscal plan, there are risks stemming from the government’s contingent liabilities. Whether future events will result in actual liabilities for the province is beyond the direct control of the government. For example, losses could result from legal settlements or a call on loan or funding guarantees. While a Contingency Fund is included in the fiscal plan to help mitigate the expense risks, until there exists certainty around the likelihood and costs of these future events, these risks are not included in the province’s fiscal plan. Provisions for losses that are likely to occur and can be reasonably estimated are expensed and reported as liabilities in Ontario’s financial statements. Any significant contingent liabilities related to the 2022–23 fiscal year have been disclosed as part of the Public Accounts of Ontario 2022–2023, released in September.
Details of Ontario’s Finances
| Actual 2020–21 |
Actual 2021–22 |
Actual 2022–23 |
Current Outlook 2023–24 |
|
|---|---|---|---|---|
| Taxation Revenue — Personal Income Tax | 40,333 | 46,750 | 44,209 | 49,394 |
| Taxation Revenue — Sales Taxes | 26,576 | 30,357 | 36,092 | 37,730 |
| Taxation Revenue — Corporations Tax | 17,775 | 25,227 | 27,791 | 26,018 |
| Taxation Revenue — Education Property Tax | 6,040 | 5,713 | 5,991 | 5,741 |
| Taxation Revenue — Employer Health Tax | 6,537 | 7,223 | 7,797 | 8,276 |
| Taxation Revenue — Ontario Health Premium | 4,330 | 4,414 | 4,445 | 4,794 |
| Taxation Revenue — Gasoline Tax | 1,898 | 2,202 | 2,103 | 1,923 |
| Taxation Revenue — Land Transfer Tax | 3,698 | 5,827 | 4,443 | 3,858 |
| Taxation Revenue — Tobacco Tax | 1,099 | 927 | 864 | 830 |
| Taxation Revenue — Fuel Tax | 686 | 771 | 571 | 505 |
| Taxation Revenue — Beer, Wine and Spirits Taxes | 624 | 624 | 600 | 579 |
| Taxation Revenue — Electricity Payments in Lieu of Taxes | 563 | 666 | 674 | 538 |
| Taxation Revenue — Ontario Portion of the Federal Cannabis Excise Duty | 106 | 215 | 310 | 330 |
| Taxation Revenue — Other Taxes | 619 | 759 | 627 | 696 |
| Taxation Revenue — Total | 110,884 | 131,675 | 136,518 | 141,213 |
| Government of Canada — Canada Health Transfer | 16,206 | 16,731 | 17,525 | 19,226 |
| Government of Canada — Canada Social Transfer | 5,815 | 6,003 | 6,178 | 6,386 |
| Government of Canada — Equalization | – | – | – | 421 |
| Government of Canada — Infrastructure Programs | 769 | 562 | 769 | 1,206 |
| Government of Canada — Labour Market Programs | 1,323 | 1,476 | 1,181 | 1,161 |
| Government of Canada — Social Housing Agreement | 338 | 305 | 263 | 218 |
| Government of Canada — Other Federal Payments | 9,014 | 5,091 | 4,817 | 5,997 |
| Government of Canada — Direct Transfers to Broader Public Sector Organizations | 459 | 439 | 530 | 470 |
| Government of Canada — Total | 33,924 | 30,607 | 31,264 | 35,086 |
| Income from Government Business Enterprises — Liquor Control Board of Ontario | 2,539 | 2,543 | 2,457 | 2,458 |
| Income from Government Business Enterprises — Ontario Power Generation Inc./Hydro One Ltd. | 2,044 | 2,151 | 850 | 1,486 |
| Income from Government Business Enterprises — Ontario Lottery and Gaming Corporation | 359 | 1,561 | 2,505 | 2,490 |
| Income from Government Business Enterprises — Ontario Cannabis Store | 67 | 186 | 234 | 223 |
| Income from Government Business Enterprises — iGaming Ontario | – | – | 87 | 136 |
| Income from Government Business Enterprises — Total | 5,009 | 6,441 | 6,133 | 6,792 |
| Other Non-Tax Revenue — Fees, Donations and Other Revenues from Broader Public Sector Organizations | 7,790 | 9,688 | 11,492 | 11,104 |
| Other Non-Tax Revenue — Vehicle and Driver Registration Fees1 | 1,952 | 33 | 1,251 | 1,114 |
| Other Non-Tax Revenue — Miscellaneous Other Non-Tax Revenue | 1,860 | 2,628 | 2,149 | 1,755 |
| Other Non-Tax Revenue — Other Fees and Licences | 1,092 | 1,237 | 1,438 | 1,518 |
| Other Non-Tax Revenue — Sales and Rentals | 680 | 1,046 | 1,227 | 1,799 |
| Other Non-Tax Revenue — Reimbursements | 1,277 | 1,233 | 1,031 | 1,055 |
| Other Non-Tax Revenue — Royalties | 359 | 468 | 335 | 322 |
| Other Non-Tax Revenue — Power Supply Contract Recoveries | 116 | 67 | 48 | 43 |
| Other Non-Tax Revenue — Net Reduction of Power Purchase Contracts | 28 | 5 | – | – |
| Other Non-Tax Revenue — Total | 15,153 | 16,405 | 18,972 | 18,710 |
| Total Revenue | 164,970 | 185,128 | 192,887 | 201,802 |
Table 3.8 footnotes:
[1] Vehicle and Driver Registration Fees in 2022–23 reflects the elimination and rebate of eligible licence plate renewal fees paid since March 1, 2021.
Note: Numbers may not add due to rounding.
Source: Ontario Ministry of Finance.
| Ministry Expense | Actual 2020–21 |
Actual 2021–22 |
Actual 2022–23 |
Current Outlook 2023–24 |
|---|---|---|---|---|
| Agriculture, Food and Rural Affairs (Base) | 288 | 284 | 300 | 361.4 |
| Agriculture, Food and Rural Affairs - Demand-Driven Risk Management and Time-Limited Programs | 458 | 358 | 502 | 472.1 |
| Agriculture, Food and Rural Affairs - COVID-19 Time-Limited Funding3 | 41 | 32 | 30 | – |
| Agriculture, Food and Rural Affairs (Total) | 787 | 674 | 832 | 833.6 |
| Attorney General (Base) | 1,523 | 1,622 | 1,813 | 1,838.7 |
| Attorney General - Statutory Appropriations — Crown Liability and Proceedings Act, 2019 | 60 | 49 | 79 | – |
| Attorney General - One-Time Accounting Adjustment for the Victim Fine Surcharge Program | 196 | – | – | – |
| Attorney General - COVID-19 Time-Limited Funding3 | 71 | 145 | 31 | – |
| Attorney General (Total) | 1,850 | 1,816 | 1,923 | 1,838.7 |
| Board of Internal Economy (Base) | 248 | 283 | 392 | 304.8 |
| Board of Internal Economy - COVID-19 Time-Limited Funding3 | 0 | 2 | 0 | – |
| Board of Internal Economy (Total) | 248 | 284 | 392 | 304.8 |
| Children, Community and Social Services (Base) | 16,994 | 16,777 | 18,054 | 19,394.0 |
| Children, Community and Social Services - COVID-19 Time-Limited Funding3 | 440 | 293 | 48 | – |
| Children, Community and Social Services (Total) | 17,433 | 17,071 | 18,102 | 19,394.0 |
| Citizenship and Multiculturalism (Base) | 23 | 33 | 54 | 67.7 |
| Citizenship and Multiculturalism - COVID-19 Time-Limited Funding3 | – | 3 | 2 | – |
| Citizenship and Multiculturalism (Total) | 23 | 36 | 56 | 67.7 |
| Colleges and Universities (Base) | 8,767 | 9,542 | 10,583 | 10,758.4 |
| Colleges and Universities - Student Financial Assistance | 766 | 954 | 1,019 | 1,357.7 |
| Colleges and Universities - COVID-19 Time-Limited Funding3 | 292 | 117 | 32 | – |
| Colleges and Universities (Total) | 9,826 | 10,614 | 11,634 | 12,116.1 |
| Economic Development, Job Creation and Trade (Base) | 162 | 164 | 167 | 188.8 |
| Economic Development, Job Creation and Trade - Tax Credits for Research and Development and Regional Investment4 | 218 | 304 | 321 | 299.2 |
| Economic Development, Job Creation and Trade - Ontario Made Manufacturing Investment Tax Credit | – | – | – | 215.0 |
| Economic Development, Job Creation and Trade - Time-Limited Investments | 187 | 157 | 540 | 977.2 |
| Economic Development, Job Creation and Trade - Bad Debt Expense | 211 | – | – | – |
| Economic Development, Job Creation and Trade - COVID-19 Time-Limited Funding3 | 3,106 | 360 | 46 | – |
| Economic Development, Job Creation and Trade (Total) | 3,885 | 985 | 1,074 | 1,680.2 |
| Education (Base) | 28,389 | 28,893 | 33,623 | 34,714.1 |
| Education - Teachers’ Pension Plan | 1,607 | 1,610 | 1,661 | 1,711.0 |
| Education - COVID-19 Time-Limited Funding3 | 2,885 | 1,060 | 918 | – |
| Education (Total) | 32,881 | 31,563 | 36,202 | 36,425.1 |
| Energy (Base) | 229 | 240 | 254 | 284.8 |
| Energy - Electricity Cost-Relief Programs | 5,539 | 6,313 | 5,844 | 6,514.2 |
| Energy - COVID-19 Time-Limited Funding3 | 906 | 274 | 2 | – |
| Energy (Total) | 6,674 | 6,827 | 6,100 | 6,799.0 |
| Environment, Conservation and Parks (Base) | 632 | 687 | 727 | 785.7 |
| Environment, Conservation and Parks - COVID-19 Time-Limited Funding3 | 3 | 16 | 17 | – |
| Environment, Conservation and Parks (Total) | 635 | 703 | 743 | 785.7 |
| Executive Offices (Base) | 45 | 49 | 55 | 66.2 |
| Executive Offices - Time-Limited Assistance | 2 | – | – | – |
| Executive Offices - COVID-19 Time-Limited Funding3 | 6 | 2 | 0 | – |
| Executive Offices (Total) | 53 | 51 | 55 | 66.2 |
| Finance (Base) | 678 | 759 | 799 | 893.9 |
| Finance - Investment Management Corporation of Ontario5 | 128 | 210 | 245 | 298.8 |
| Finance - Ontario Municipal Partnership Fund | 502 | 502 | 501 | 501.9 |
| Finance - Temporary and Other Local Assistance | 21 | 21 | 21 | 81.0 |
| Finance - Power Supply Contract Costs | 116 | 67 | 48 | 42.9 |
| Finance - Time-Limited Investments | – | – | 174 | 118.9 |
| Finance - COVID-19 Time-Limited Funding3 | 440 | 231 | 0 | – |
| Finance (Total) | 1,884 | 1,789 | 1,789 | 1,937.4 |
| Francophone Affairs (Base) | 5 | 7 | 7 | 7.9 |
| Francophone Affairs - Time-Limited Investments | – | – | 1 | – |
| Francophone Affairs - COVID-19 Time-Limited Funding3 | 1 | 2 | – | – |
| Francophone Affairs (Total) | 6 | 9 | 8 | 7.9 |
| Health (Total)6 | 59,878 | 64,286 | 68,843 | 72,868.9 |
| COVID-19 Health Response7 | 5,082 | 6,167 | 3,331 | – |
| Indigenous Affairs (Base) | 64 | 85 | 111 | 136.0 |
| Indigenous Affairs - One-Time Investments Including Settlements | 149 | 152 | 6,273 | – |
| Indigenous Affairs - COVID-19 Time-Limited Funding3 | 42 | 4 | 1 | – |
| Indigenous Affairs (Total) | 256 | 241 | 6,384 | 136.0 |
| Infrastructure (Base) | 171 | 167 | 266 | 657.3 |
| Infrastructure - Federal–Provincial Infrastructure Programs | 161 | 267 | 379 | 491.6 |
| Infrastructure - Broadband | 67 | 75 | 148 | 783.2 |
| Infrastructure - Waterfront Toronto Revitalization (Port Lands Flood Protection) | 103 | 156 | 25 | 25.0 |
| Infrastructure - Municipal Infrastructure Program Investments | 197 | 399 | 396 | 397.0 |
| Infrastructure - Realty | 1,099 | 1,156 | 1,095 | 1,195.2 |
| Infrastructure - COVID-19 Time-Limited Funding3 | 9 | 10 | 24 | – |
| Infrastructure (Total) | 1,807 | 2,230 | 2,332 | 3,549.4 |
| Labour, Immigration, Training and Skills Development (Base) | 170 | 102 | 202 | 241.0 |
| Labour, Immigration, Training and Skills Development - Training Tax Credits (Co-operative Education and Apprenticeship Training)8 | 98 | 105 | 86 | 93.5 |
| Labour, Immigration, Training and Skills Development - Demand-Driven Employment and Training Programs | 1,173 | 955 | 1,206 | 1,454.2 |
| Labour, Immigration, Training and Skills Development - COVID-19 Time-Limited Funding3 | 33 | 794 | 310 | – |
| Labour, Immigration, Training and Skills Development (Total) | 1,473 | 1,957 | 1,803 | 1,788.6 |
| Long-Term Care (Total)9 | 4,514 | 5,300 | 6,304 | 8,306.4 |
| Mines (Base) | 85 | 135 | 147 | 184.8 |
| Mines - One-Time Accounting Adjustment for Contaminated Sites | – | 183 | 86 | – |
| Mines - COVID-19 Time-Limited Funding3 | 0 | – | – | – |
| Mines (Total) | 86 | 318 | 233 | 184.8 |
| Municipal Affairs and Housing (Base) | 485 | 486 | 564 | 771.2 |
| Municipal Affairs and Housing - Time-Limited Investments | 224 | 351 | 404 | 546.1 |
| Municipal Affairs and Housing - Social Housing Agreement — Payments to Service Managers10 | 313 | 281 | 206 | 198.2 |
| Municipal Affairs and Housing - COVID-19 Time-Limited Funding3 | 2,707 | 330 | 390 | – |
| Municipal Affairs and Housing (Total) | 3,729 | 1,447 | 1,563 | 1,515.5 |
| Natural Resources and Forestry (Base) | 505 | 607 | 615 | 700.0 |
| Natural Resources and Forestry - Emergency Forest Firefighting | 115 | 237 | 95 | 135.0 |
| Natural Resources and Forestry - One-Time Accounting Adjustment for Landfills | 202 | – | – | – |
| Natural Resources and Forestry - COVID-19 Time-Limited Funding3 | 13 | 12 | 2 | – |
| Natural Resources and Forestry (Total) | 835 | 857 | 712 | 834.9 |
| Northern Development (Base) | 583 | 605 | 661 | 725.6 |
| Northern Development - COVID-19 Time-Limited Funding3 | 0 | 41 | – | – |
| Northern Development (Total) | 583 | 646 | 661 | 725.6 |
| Public and Business Service Delivery (Base) | 549 | 629 | 1,038 | 1,144.1 |
| Public and Business Service Delivery - COVID-19 Time-Limited Funding3 | 414 | 141 | 201 | – |
| Public and Business Service Delivery (Total) | 963 | 770 | 1,239 | 1,144.1 |
| Seniors and Accessibility (Base) | 55 | 53 | 63 | 66.4 |
| Seniors and Accessibility - Seniors Tax Credits (Home Safety and Care at Home) | 10 | 30 | 164 | 120.0 |
| Seniors and Accessibility - COVID-19 Time-Limited Funding3 | 151 | 43 | 11 | – |
| Seniors and Accessibility (Total) | 216 | 127 | 237 | 186.4 |
| Solicitor General (Base) | 2,807 | 2,981 | 3,375 | 3,613.4 |
| Solicitor General - COVID-19 Time-Limited Funding3 | 94 | 150 | 96 | – |
| Solicitor General (Total) | 2,901 | 3,131 | 3,472 | 3,613.4 |
| Tourism, Culture and Sport (Base) | 691 | 858 | 836 | 849.2 |
| Tourism, Culture and Sport - Ontario Cultural Media Tax Credits | 512 | 693 | 833 | 906.1 |
| Tourism, Culture and Sport - Ontario Cultural Media Tax Credits — Amounts Related to Prior Years | 65 | 84 | 51 | – |
| Tourism, Culture and Sport - COVID-19 Time-Limited Funding3 | 120 | 257 | 200 | – |
| Tourism, Culture and Sport (Total) | 1,388 | 1,893 | 1,921 | 1,755.3 |
| Transportation (Base) | 4,646 | 5,180 | 5,794 | 6,186.3 |
| Transportation - Federal–Provincial Infrastructure Programs | 449 | 231 | 230 | 729.2 |
| Transportation - COVID-19 Time-Limited Funding3 | 2,188 | 369 | 609 | – |
| Transportation (Total) | 7,283 | 5,780 | 6,632 | 6,915.5 |
| Treasury Board Secretariat (Base) | 296 | 315 | 607 | 525.3 |
| Treasury Board Secretariat - Employee and Pensioner Benefits | 1,485 | 2,633 | 1,178 | 1,260.7 |
| Treasury Board Secretariat - Operating Contingency Fund | – | – | – | 5,340.5 |
| Treasury Board Secretariat - Capital Contingency Fund | – | – | – | 57.2 |
| Treasury Board Secretariat - COVID-19 Time-Limited Funding3 | 3 | 2 | 0 | – |
| Treasury Board Secretariat (Total) | 1,784 | 2,950 | 1,785 | 7,183.6 |
| Interest on Debt11 | 12,296 | 12,583 | 12,389 | 13,449.0 |
| Total Expense | 181,260 | 183,103 | 198,750 | 206,413.8 |
Table 3.9 footnotes:
[1] Numbers reflect current ministry structure.
[2] Ministry expenses have been restated for reclassification and program transfer changes. These changes are fiscally neutral. The actual results are presented on a similar basis for consistency.
[3] COVID‐19 Time‐Limited Funding is no longer being reported separately, starting in 2023–24.
[4] Includes the estimated cost of tax credit claims for the Ontario Innovation Tax Credit, Ontario Business-Research Institute Tax Credit and the Regional Opportunities Investment Tax Credit (ROITC). Figures from 2020–21 to 2022–23 include tax credit amounts related to prior years, except for the ROITC in 2020–21.
[5] Based on the requirements of Public Sector Accounting Standards, the province consolidates the financial results of the Investment Management Corporation of Ontario.
[6] Includes accounting adjustments tied primarily to grants provided for infrastructure projects and other related investments.
[7] For presentation purposes in the 2023 Ontario Economic Outlook and Fiscal Review, Time-Limited COVID-19-related health response spending has been included separately for 2020–21 to 2022–23, instead of within the Ontario Ministry of Health and Ontario Ministry of Long-Term Care.
[8] The Co-operative Education Tax Credit remains in effect. The Apprenticeship Training Tax Credit was eliminated for eligible apprenticeship programs that commenced on or after November 15, 2017. Amounts from 2020–21 to 2022–23 include tax credit amounts related to prior years, however a decrease in costs of $18 million for the Apprenticeship Training Tax Credit in 2022–23 was reported separately as revenue.
[9] The Ontario Ministry of Long-Term Care total includes expenses incurred by Ontario Health for funding for long-term care. These amounts will be consolidated in the total expense of the Ontario Ministry of Health, including $4.7 billion for 2022–23 actuals and $5.2 billion in 2023–24.
[10] The annual decline from 2020–21 to 2023–24 is mainly due to declining federal obligations, such as maturing mortgages, under the Social Housing Agreement.
[11] Interest on debt is net of interest capitalized during construction of tangible capital assets of $230 million in 2020–21, $321 million in 2021–22, $694 million in 2022–23 and $573 million in 2023–24.
Note: Numbers may not add due to rounding.
Sources: Ontario Treasury Board Secretariat and Ontario Ministry of Finance.
| Sector | Total Infrastructure Expenditures 2022–23 Actual1 |
2023–24 Current Outlook Investment in Capital Assets2,3 |
2023–24 Current Outlook Transfers and Other Infrastructure Expenditures4 |
2023–24 Current Outlook Total Infrastructure Expenditures |
|---|---|---|---|---|
| Transportation — Transit | 6,670 | 6,195 | 1,276 | 7,471 |
| Transportation — Provincial Highways | 2,505 | 3,098 | 95 | 3,193 |
| Transportation — Other Transportation, Property and Planning | 283 | 157 | 79 | 236 |
| Health — Hospitals | 2,799 | 3,348 | 1 | 3,349 |
| Health — Other Health | 287 | 77 | 496 | 573 |
| Education | 2,886 | 2,777 | 226 | 3,003 |
| Postsecondary Education — Colleges and Other | 628 | 614 | 90 | 705 |
| Postsecondary Education — Universities | 169 | – | 124 | 124 |
| Social | 619 | 32 | 361 | 394 |
| Justice | (262) | 824 | 27 | 851 |
| Other Sectors5 | 2,647 | 1,121 | 2,517 | 3,638 |
| Total Infrastructure Expenditures | 19,230 | 18,243 | 5,293 | 23,536 |
| Less: Other Partner Funding6 | 2,932 | 2,560 | 304 | 2,864 |
| Total7 | 16,298 | 15,683 | 4,989 | 20,672 |
Table 3.10 footnotes:
[1] Includes adjustments for the net book value of assets disposed during the year, as well as changes in valuation.
[2] Includes provincial investment in capital assets of $13.6 billion.
[3] Includes $573 million in interest capitalized during construction.
[4] Includes transfers to municipalities, universities and non-consolidated agencies.
[5] Includes broadband infrastructure, government administration, natural resources, and the culture and tourism industries.
[6] Other Partner Funding refers to third-party investments primarily in hospitals, colleges and schools.
[7] Includes federal–municipal contributions to provincial infrastructure investments.
Note: Numbers may not add due to rounding.
Source: Ontario Treasury Board Secretariat.
| 2014–15 | 2015–16 | 2016–17 | 2017–18 | 2018–19 | 2019–20 | 2020–21 | 2021–22 | Actual 2022–23 |
Current Outlook 2023–24 |
|
|---|---|---|---|---|---|---|---|---|---|---|
| Revenue | 126,152 | 136,148 | 140,734 | 150,696 | 153,804 | 156,167 | 164,970 | 185,128 | 192,887 | 201,802 |
| Expense — Programs | 126,199 | 129,905 | 131,442 | 142,464 | 148,747 | 152,265 | 168,964 | 170,520 | 186,361 | 192,965 |
| Expense — Interest on Debt3 | 11,221 | 11,589 | 11,727 | 11,912 | 12,385 | 12,497 | 12,296 | 12,583 | 12,389 | 13,449 |
| Total Expense | 137,420 | 141,494 | 143,169 | 154,375 | 161,132 | 164,762 | 181,260 | 183,103 | 198,750 | 206,414 |
| Reserve | – | – | – | – | – | – | – | – | – | 1,000 |
| Surplus/(Deficit) | (11,268) | (5,346) | (2,435) | (3,679) | (7,328) | (8,595) | (16,290) | 2,025 | (5,863) | (5,612) |
| Net Debt | 294,557 | 306,357 | 314,077 | 323,068 | 337,623 | 352,382 | 372,501 | 382,842 | 400,484 | 416,079 |
| Accumulated Deficit | 196,665 | 203,014 | 205,939 | 208,257 | 215,770 | 224,814 | 238,231 | 238,160 | 246,804 | 252,416 |
| Gross Domestic Product (GDP) at Market Prices | 727,042 | 760,435 | 790,749 | 824,979 | 860,104 | 893,224 | 866,981 | 956,707 | 1,044,670 | 1,082,387 |
| Primary Household Income | 490,423 | 512,570 | 520,486 | 541,501 | 567,484 | 593,065 | 592,460 | 644,263 | 704,510 | 748,190 |
| Population (000s) — July4 | 13,618 | 13,709 | 13,877 | 14,078 | 14,327 | 14,574 | 14,762 | 14,842 | 15,145 | 15,608 |
| Net Debt per Capita (dollars) | 21,630 | 22,347 | 22,634 | 22,948 | 23,566 | 24,180 | 25,234 | 25,794 | 26,443 | 26,657 |
| Household Income per Capita (dollars) | 36,013 | 37,389 | 37,508 | 38,463 | 39,610 | 40,695 | 40,135 | 43,407 | 46,518 | 47,935 |
| Net Debt as a Per Cent of Revenue | 233.5% | 225.0% | 223.2% | 214.4% | 219.5% | 225.6% | 225.8% | 206.8% | 207.6% | 206.2% |
| Interest on Debt as a Per Cent of Revenue | 8.9% | 8.5% | 8.3% | 7.9% | 8.1% | 8.0% | 7.5% | 6.8% | 6.4% | 6.7% |
| Net Debt as a Per Cent of GDP | 40.5% | 40.3% | 39.7% | 39.2% | 39.3% | 39.5% | 43.0% | 40.0% | 38.3% | 38.4% |
| Accumulated Deficit as a Per Cent of GDP | 27.1% | 26.7% | 26.0% | 25.2% | 25.1% | 25.2% | 27.5% | 24.9% | 23.6% | 23.3% |
Table 3.11 footnotes:
[1] Amounts reflect a change in pension expense that was calculated based on recommendations of the Independent Financial Commission of Inquiry, as described in Note 19 to the Consolidated Financial Statements, in Public Accounts of Ontario 2017–2018. Amounts for net debt and accumulated deficit also reflect this change.
[2] Revenues and expenses have been restated to reflect the change in presentation of third-party revenue from Broader Public Sector organizations to be reported as revenue.This restatement is fiscally neutral.
[3] Interest on debt is net of interest capitalized during construction of tangible capital assets of $230 million in 2020–21, $321 million in 2021–22, $694 million in 2022–23, and $573 million in 2023–24.
[4] Population figures are for July 1 of the fiscal year indicated (i.e., for 2023–24, the population on July 1, 2023, is shown).
Note: Numbers may not add due to rounding.
Sources: Statistics Canada; Ontario Treasury Board Secretariat; and Ontario Ministry of Finance.
Chart Descriptions
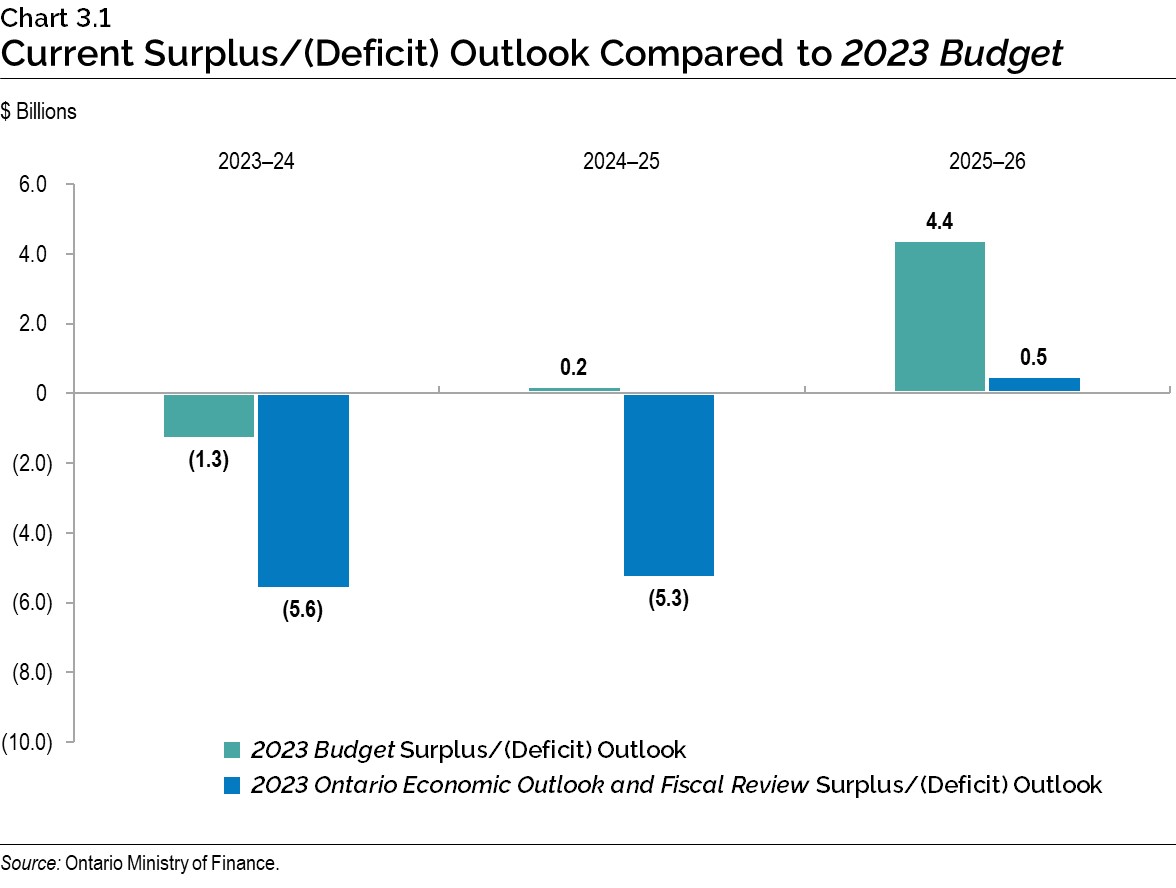
Chart 3.1: Current Surplus/(Deficit) Outlook Compared to 2023 Budget
The bar chart illustrates the deficit outlook presented in the 2023 Budget compared to the current outlook in the 2023 Ontario Economic Outlook and Fiscal Review. The 2023 Budget projected a deficit of $1.3 billion in 2023–24 and surpluses of $0.2 billion in 2024–25 and $4.4 billion in 2025–26. With the release of the 2023 Ontario Economic Outlook and Fiscal Review, the projections have been revised to deficits of $5.6 billion in 2023–24 and $5.3 billion in 2024–25, before reaching a surplus of $0.5 billion in 2025–26.
Source: Ontario Ministry of Finance.
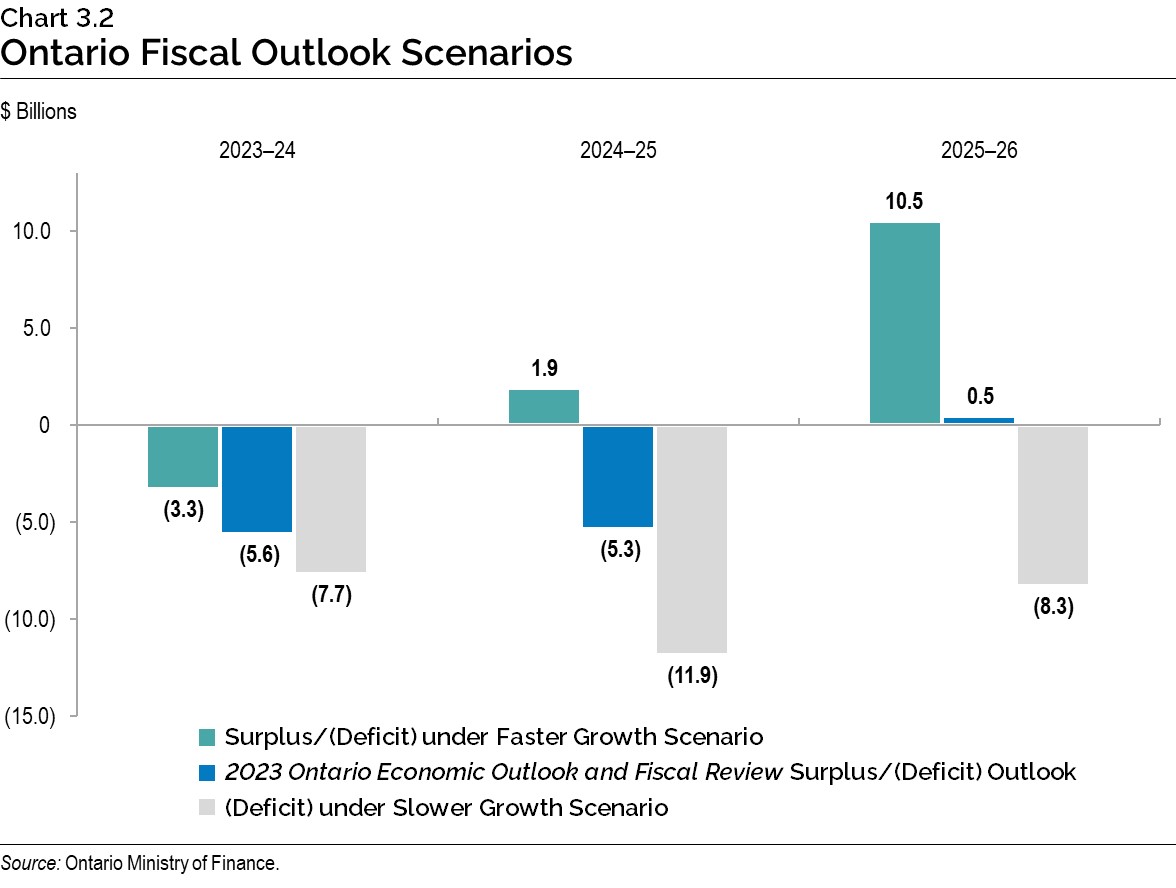
Chart 3.2: Ontario Fiscal Outlook Scenarios
The bar chart illustrates the range of Ontario deficit outlooks based on the two alternative economic scenarios presented in Chapter 2: Economic Performance and Outlook. The 2023 Ontario Economic Outlook and Fiscal Review fiscal outlook estimates the deficits to be $5.6 billion in 2023–24 and $5.3 billion in 2024–25, before reaching a surplus of $0.5 billion in 2025–26. Under the Faster Growth scenario, the deficit is estimated to be $3.3 billion in 2023–24, followed by surpluses of $1.9 billion in 2024–25 and $10.5 billion in 2025–26. Under the Slower Growth scenario, the deficits are estimated to be $7.7 billion in 2023–24, $11.9 billion in 2024–25 and $8.3 billion in 2025–26.
Source: Ontario Ministry of Finance.
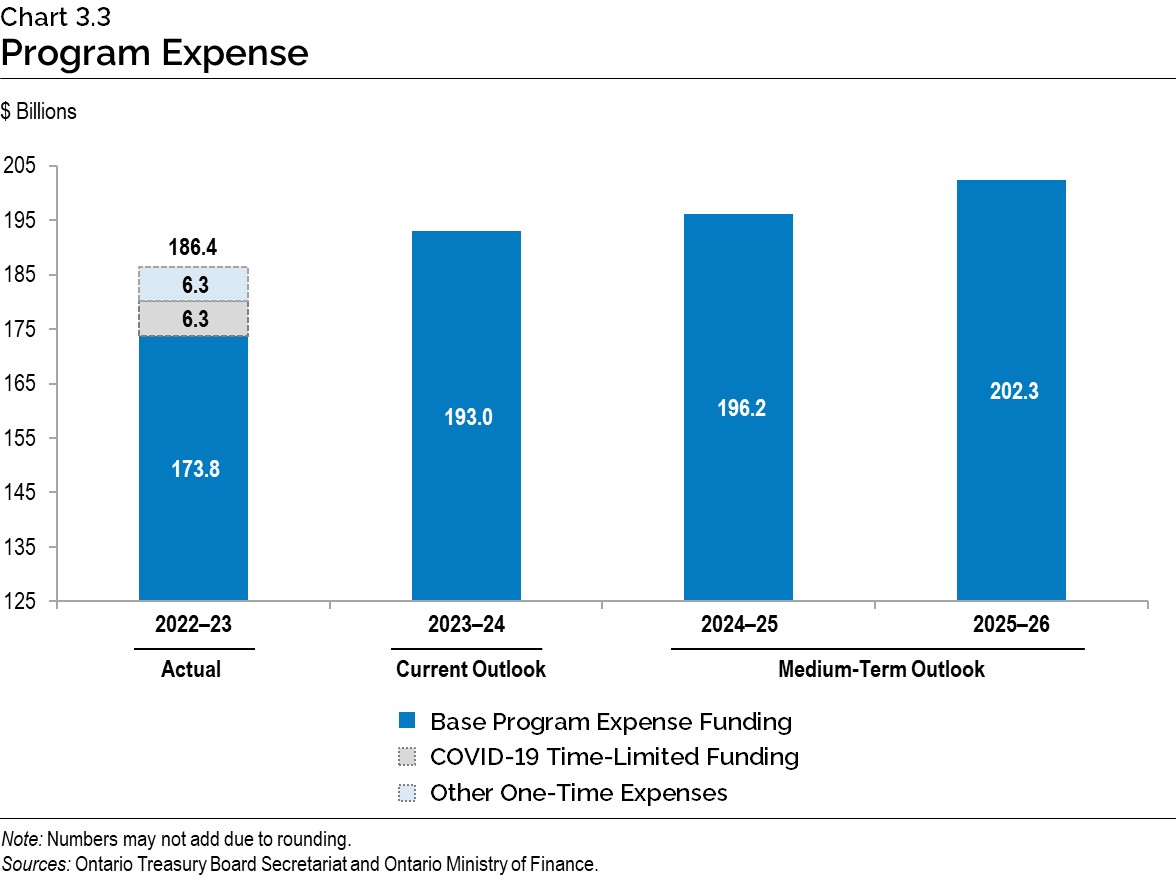
Chart 3.3: Program Expense
The bar chart illustrates the growth in program expense. For 2022–23, total program expense includes COVID-19 Time-Limited Funding of $6.3 billion and Other One-Time Expenses of $6.3 billion. Base program expense for 2022–23 is $173.8 billion.
Total program expense was $186.4 billion in 2022–23 and is projected to be $193.0 billion in
2023–24, $196.2 billion in 2024–25 and $202.3 billion in 2025–26.
Note: Numbers may not add due to rounding.
Sources: Ontario Treasury Board Secretariat and Ontario Ministry of Finance.
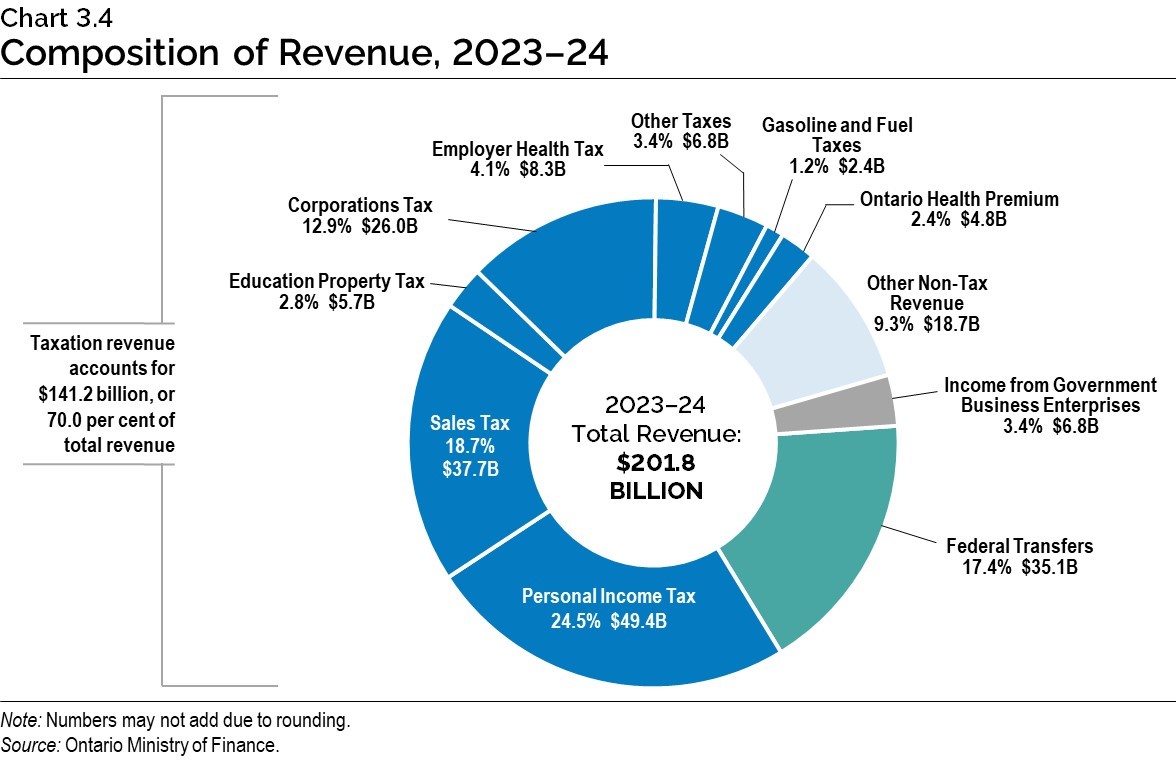
Chart 3.4: Composition of Revenue, 2023–24
The pie chart shows the composition of Ontario’s revenue in 2023–24, which is projected to be $201.8 billion. The largest taxation revenue source is Personal Income Tax revenue at $49.4 billion, accounting for 24.5 per cent of total revenue. This is followed by Sales Tax at $37.7 billion, or 18.7 per cent of total revenue; and Corporations Tax at $26.0 billion, or 12.9 per cent of total revenue. Other components of taxation revenue include Education Property Tax at $5.7 billion, or 2.8 per cent of total revenue; Employer Health Tax at $8.3 billion, or 4.1 per cent; Gasoline Tax and Fuel Tax at $2.4 billion, or 1.2 per cent; the Ontario Health Premium at $4.8 billion, or 2.4 per cent; and Other Taxes at $6.8 billion, or 3.4 per cent of total revenue.
Total taxation revenue accounts for $141.2 billion, or 70.0 per cent of total revenue.
The other major non-taxation sources of revenue are Federal Transfers at $35.1 billion, or
17.4 per cent of total revenue; Income from Government Business Enterprises at $6.8 billion, or
3.4 per cent of total revenue; and various Other Non-Tax Revenue at $18.7 billion, or 9.3 per cent of total revenue.
Note: Numbers may not add due to rounding.
Source: Ontario Ministry of Finance.
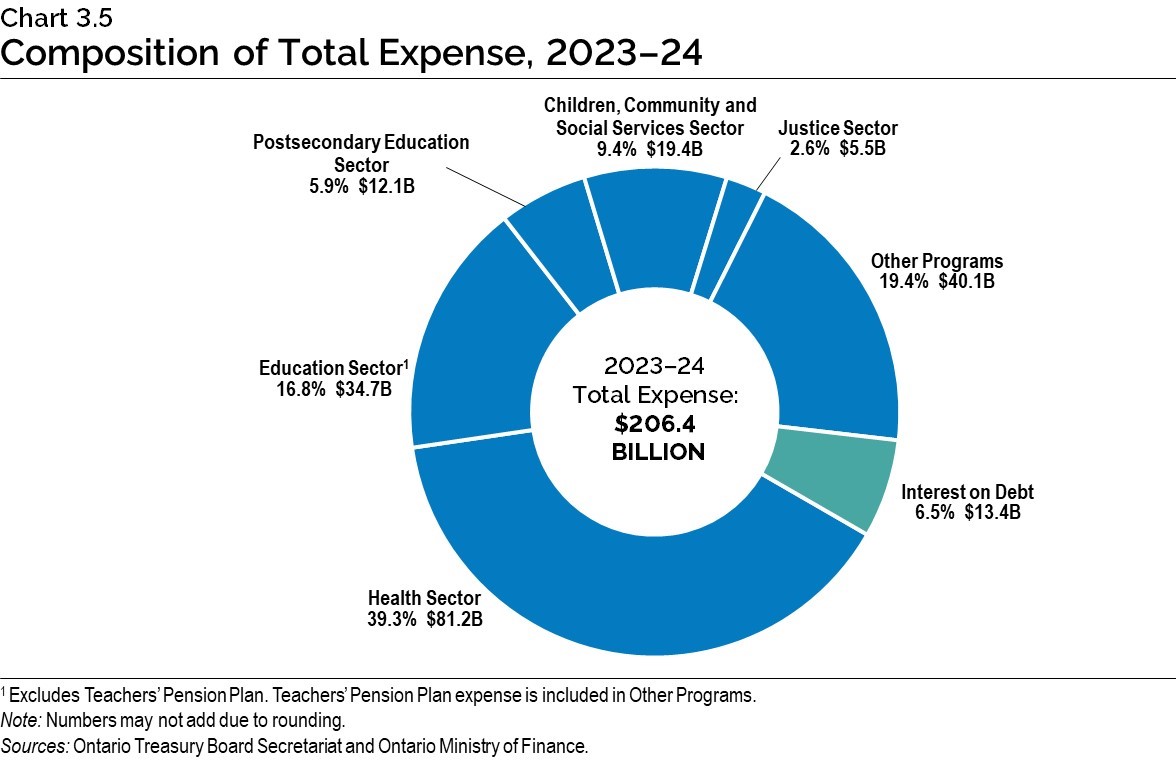
Chart 3.5: Composition of Total Expense, 2023–24
The pie chart shows the share of Ontario’s total expense and dollar amounts by sector in 2023–24.
Total expense in 2023–24 is projected to be $206.4 billion.
The largest expense is the Health Sector at $81.2 billion, accounting for 39.3 per cent of total expense.
The remaining sectors of total expense include the Education Sector1 at $34.7 billion or 16.8 per cent; the Postsecondary Education Sector at $12.1 billion or 5.9 per cent; the Children, Community and Social Services Sector at $19.4 billion or 9.4 per cent; the Justice Sector at $5.5 billion or 2.6 per cent; and Other Programs at $40.1 billion or 19.4 per cent. Interest on Debt, included as part of total expense, is $13.4 billion or 6.5 per cent.
[1] Excludes the Teachers’ Pension Plan. Teachers’ Pension Plan expense is included in Other Programs.
Note: Numbers may not add due to rounding.
Sources: Ontario Treasury Board Secretariat and Ontario Ministry of Finance.