Introduction
Ontario conducts its borrowing program responsibly and prudently to minimize interest on debt (IOD) costs.
Ontario’s forecast total long-term borrowing program in 2023–24 has increased compared with the forecast from the 2023 Budget. About 43 per cent, or $15.0 billion, of this year’s $34.7 billion current long-term borrowing requirement has been completed to date.
Ontario’s net debt-to-GDP ratio is now forecast to be 38.4 per cent in 2023–24, compared with the forecast of 37.8 per cent in the 2023 Budget.
Ontario’s net debt-to-revenue is now forecast to be 206 per cent in 2023–24, compared with the forecast of 199 per cent in the 2023 Budget.
Ontario is forecast to pay $13.4 billion in interest costs in 2023–24, $0.6 billion lower than the 2023 Budget forecast, due to lower borrowing costs in 2022–23 which have carried forward. Ontario’s 2023–24 interest on debt-to-revenue is forecast to be 6.7 per cent, a decrease of 0.2 percentage points from the 2023 Budget forecast of 6.9 per cent.
Borrowing Program
Ontario’s borrowing program is primarily used to refinance maturing debt, make investments in capital assets and fund deficits. Ontario will continue to finance most of its borrowing program in the long-term public markets in Canada and internationally.
Ontario’s long-term borrowing requirement for 2023–24 increased by $7.2 billion from the 2023 Budget forecast. This is primarily due to higher than previously forecasted deficits in 2022–23 and 2023–24.
| 2023 Budget | In-Year Change | Current Outlook 2023–24 |
Medium-Term Outlook 2024–25 |
Medium-Term Outlook 2025–26 |
|
|---|---|---|---|---|---|
| Deficit/(Surplus) | 1.3 | 4.3 | 5.6 | 5.3 | (0.5) |
| Investment in Capital Assets | 13.6 | 0.0 | 13.6 | 18.7 | 19.0 |
| Non-Cash and Cash Timing Adjustments | (9.2) | 7.9 | (1.3) | (11.2) | (12.0) |
| Loans to Infrastructure Ontario | 0.1 | – | 0.1 | 0.1 | 0.2 |
| Other Net Loans/Investments | 0.1 | (0.0) | 0.1 | (1.0) | (0.2) |
| Debt Maturities/Redemptions | 31.2 | (0.0) | 31.2 | 28.0 | 33.1 |
| Total Funding Requirement | 37.0 | 12.2 | 49.2 | 39.9 | 39.5 |
| Decrease/(Increase) in Short-Term Borrowing | – | – | – | (2.5) | (2.5) |
| Increase/(Decrease) in Cash and Cash Equivalents | 5.0 | (5.0) | – | – | – |
| Pre-borrowing in 2022–23 for 2023–24 | (14.5) | – | (14.5) | – | – |
| Total Long-Term Borrowing | 27.5 | 7.2 | 34.7 | 37.4 | 37.0 |
Table 4.1 footnotes:
Note: Numbers may not add due to rounding.
Source: Ontario Financing Authority.
As of October 12, 2023, $15.0 billion, or 43 per cent of this year’s long-term public borrowing has been completed.
Over the three-year outlook period, total long-term borrowing is now forecast to be $19.6 billion higher than forecast in the 2023 Budget. This is primarily due to higher deficit and lower surplus forecasts over the medium-term outlook.
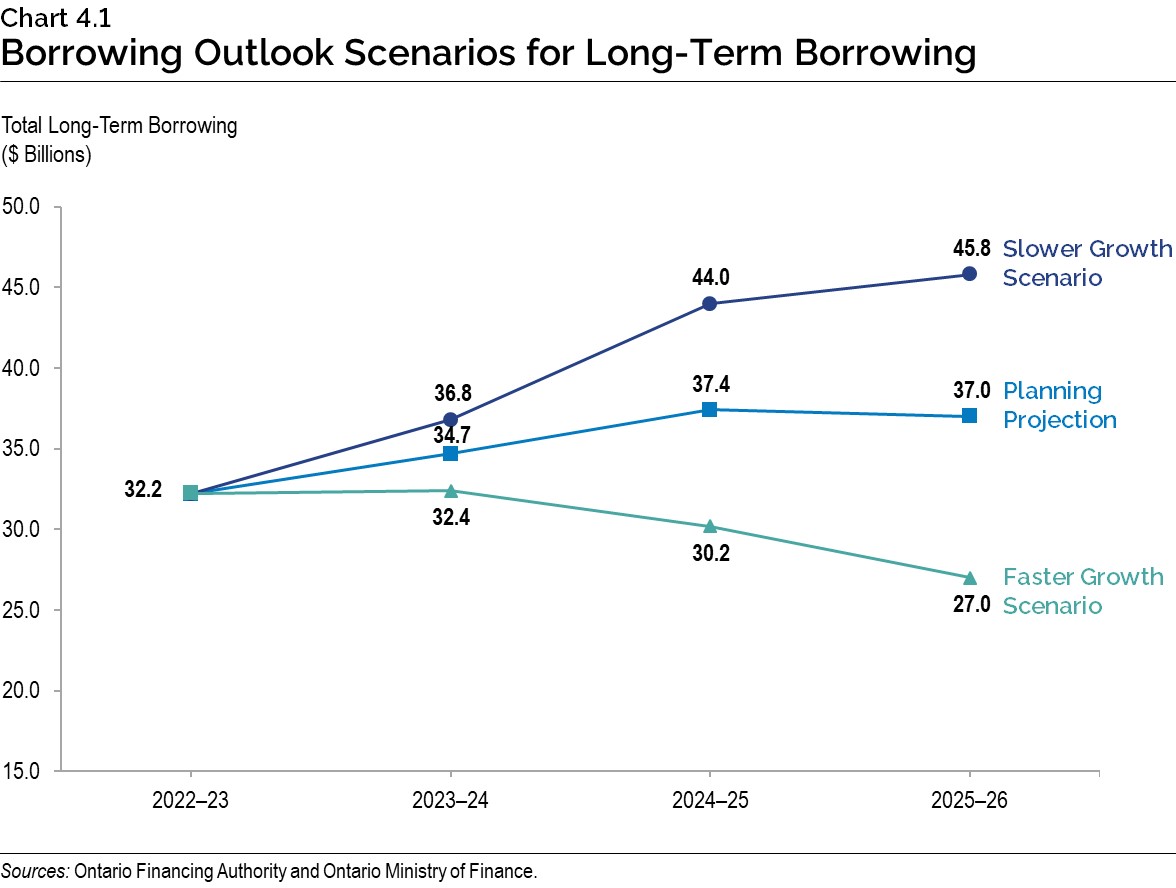
In the event that alternative economic scenarios materialize, Ontario’s borrowing requirements in the next three years would also change (see Chapter 3: A Strong Foundation for the Next Generation: Ontario’s Fiscal Plan and Outlook for further details, and a description of the resulting alternative medium-term outlook scenarios). Under the Faster Growth scenario, long-term borrowing would decrease by $19.6 billion over the three-year outlook period, while under the Slower Growth scenario, long‑term borrowing would increase by $17.3 billion over the same period.
Almost all borrowing completed so far for fiscal year 2023–24 was in Canadian dollars, primarily through 19 syndicated issues. Ontario has not accessed its core foreign currency markets of US dollars and Euros for more than a year and a half, due to the cost effectiveness of borrowing in the Canadian domestic market. However, Ontario expects to access its core foreign currency markets to fund a significant portion of the increase in the 2023–24 long-term borrowing program from the 2023 Budget forecast.
Ontario’s target range for domestic borrowing remains unchanged at 75 to 90 per cent of borrowing completed for the 2023–24 fiscal year. This range will be further adjusted, if necessary, in response to the increased long-term borrowing requirement and evolving investor demand in the Canadian dollar and foreign currency debt markets.
Foreign currency borrowing helps reduce Ontario’s overall borrowing costs by continuing to diversify Ontario’s investor base. This diversification ensures the government will continue to have access to capital, even if domestic market conditions become challenging.
Green Bond Program
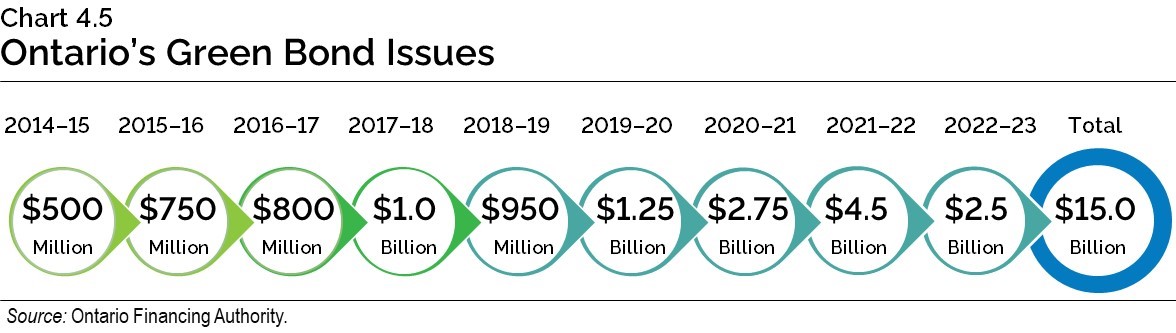
Green Bonds remain a core component of Ontario’s borrowing program and are an important tool to help finance public transit initiatives, extreme weather-resistant infrastructure, as well as energy efficiency and conservation projects. Ontario remains the largest issuer of Canadian dollar Green Bonds, totalling $15.0 billion issued since 2014‑15, with $13.0 billion outstanding.
Ontario is updating its Green Bond Framework. The update includes better alignment of framework categories with the Green Bond Principles through standardized wording, as well as the expansion from green to sustainable to allow for a greater breadth of potential bond offerings in the future.
Ontario plans to continue its leadership in the Canadian dollar Green Bond market and, subject to market conditions, will issue multiple Green Bonds each fiscal year, including in 2023–24.
Cost of Debt
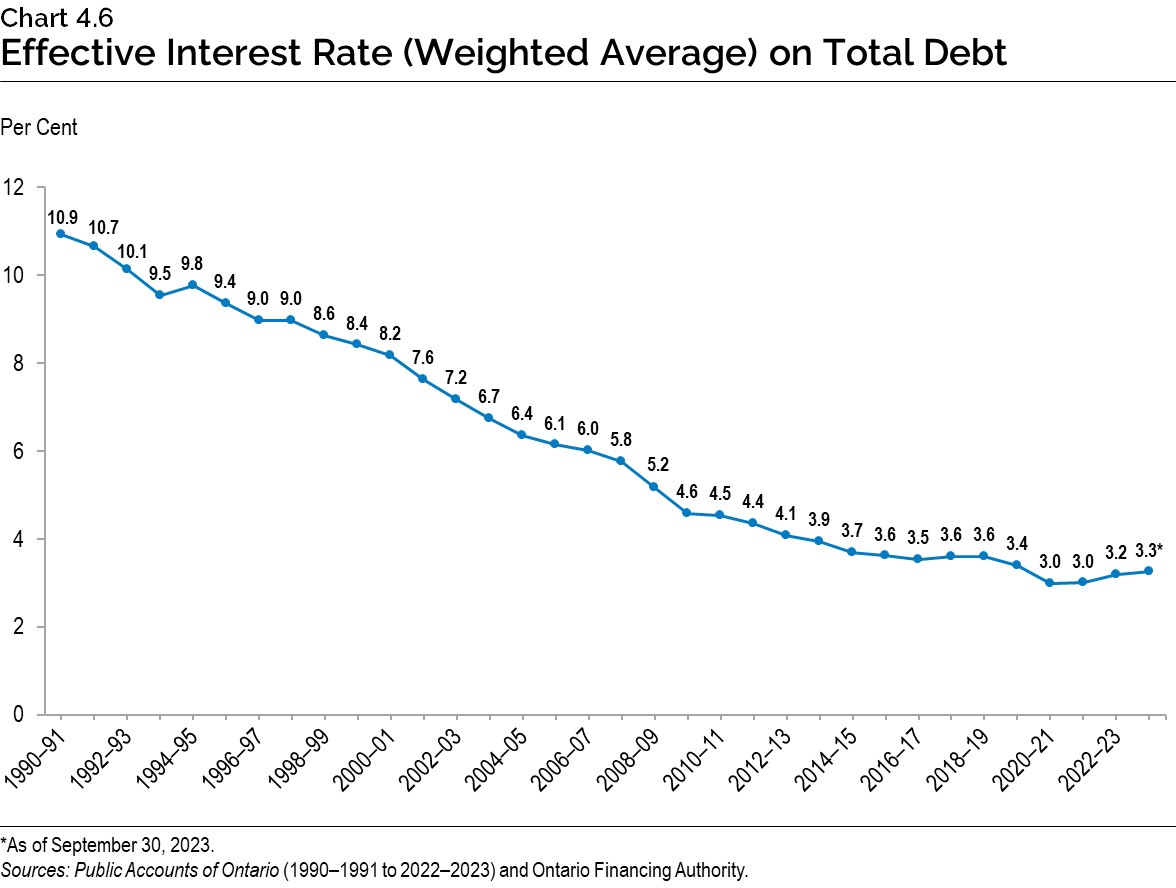
After a three-decade decline, interest rates have risen as central banks, including the Bank of Canada and the U.S. Federal Reserve, have raised overnight interest rates. This has impacted Ontario’s IOD costs. Chart 4.6 shows that while the effective interest rate has begun to rise, the interest rate on the total debt portfolio remains low in historical terms due to Ontario’s decision to lock in long-term rates and extend the term of its debt since the Global Financial Crisis in 2007–08.
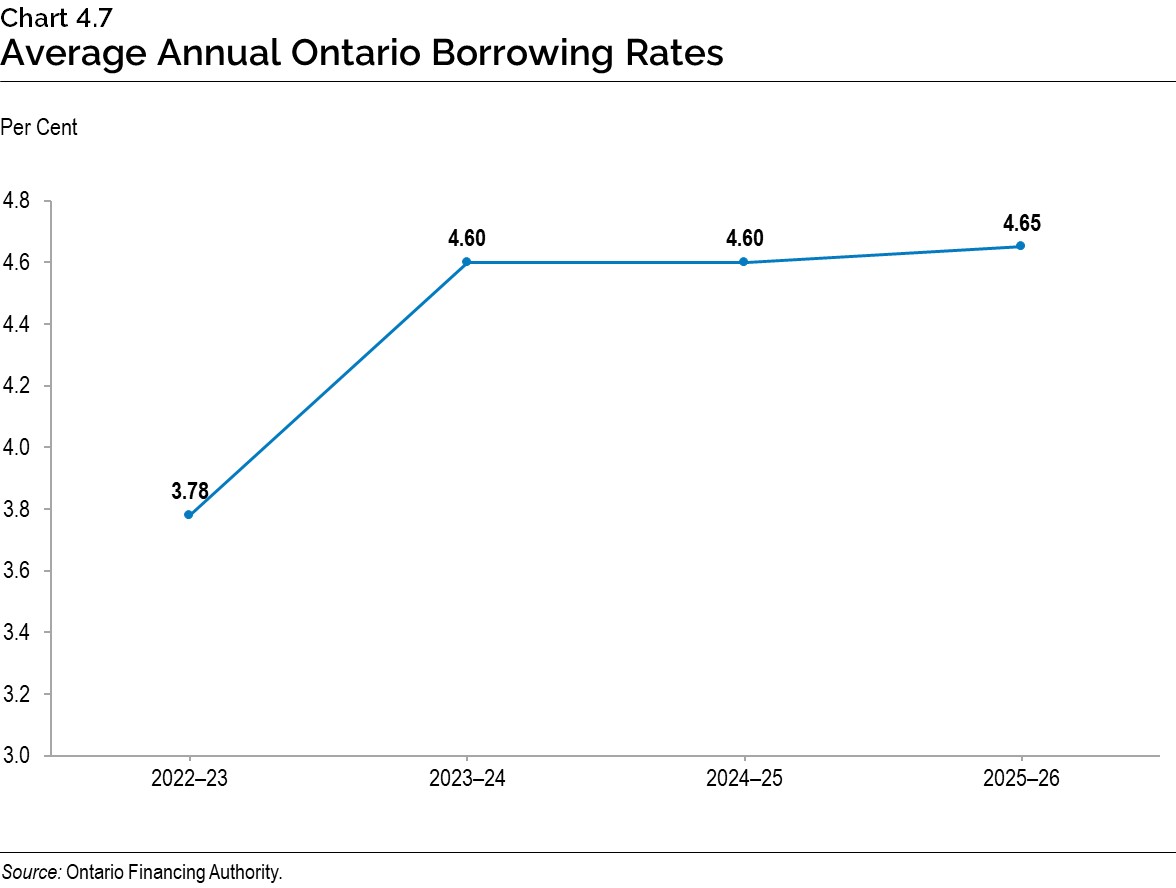
Despite the further increases to the overnight rate since the 2023 Budget, Ontario’s cost of borrowing for 2023–24 remains at 4.60 per cent, as long-term rates have remained within the range forecasted in the 2023 Budget. A one percentage point change in interest rates either up or down from the current interest rate forecast is estimated to have a corresponding change in Ontario’s borrowing costs of approximately $700 million in the first full year.
Chart 4.7 shows the average borrowing rates on debt issued in 2022–23 and the forecast used to estimate the future cost of borrowing or IOD expense for the remainder of 2023–24 and the medium-term outlook. The average borrowing rates remain unchanged from the 2023 Budget forecast.
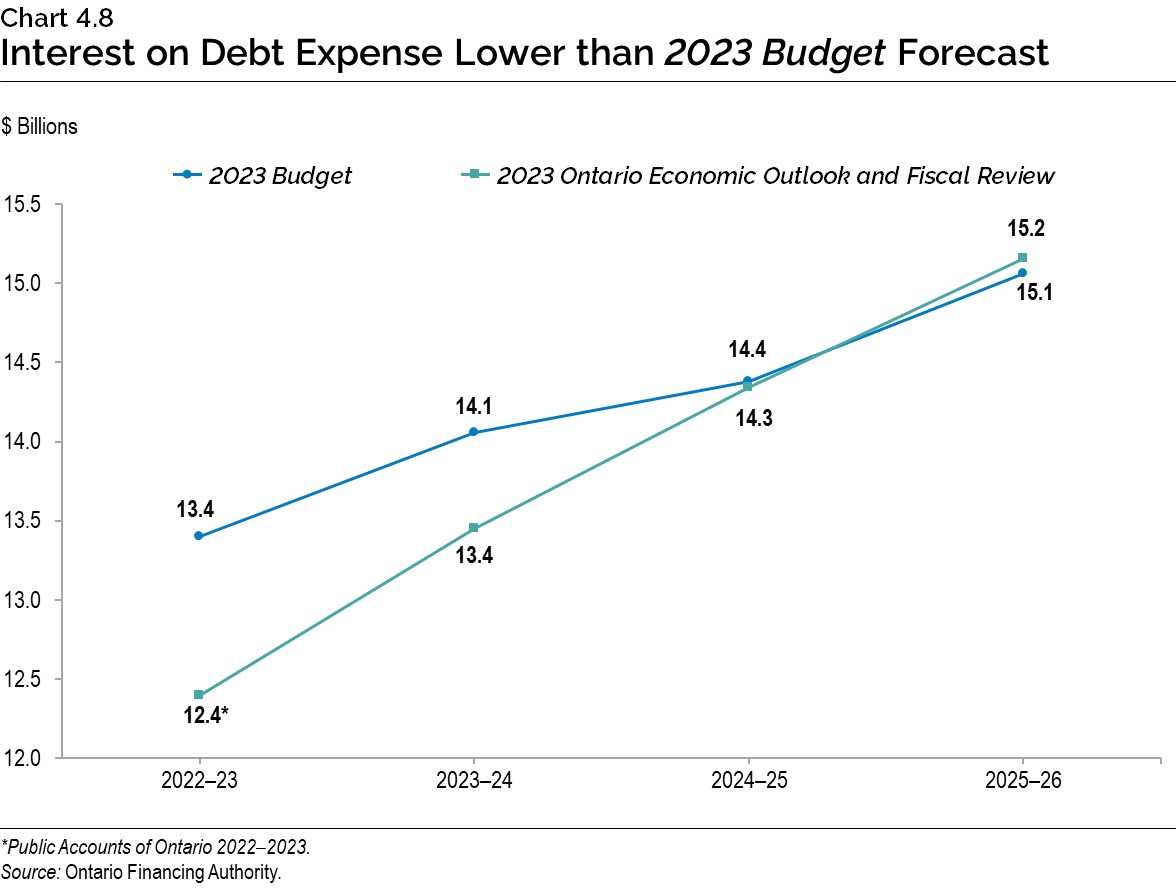
Ontario is forecast to pay $13.4 billion in interest costs in 2023–24, $14.3 billion in 2024–25, and $15.2 billion in 2025–26, compared to the 2023 Budget forecasts of $14.1 billion, $14.4 billion and $15.1 billion, respectively. Over this period, cumulative IOD expense is $0.7 billion below the 2023 Budget forecast. This is primarily due to lower borrowing costs in 2022–23 as reported in the Public Accounts of Ontario 2022–2023, partially offset by higher long-term borrowings for these years. Interest on Debt remains Ontario’s fourth largest expense after health care, education and social services.
Term of Debt
Ontario has continued to extend the term of its debt, when investor demand allowed, to reduce refinancing risk on maturing debt. This also protects the IOD forecast in the long term against further increases in interest rates. Ontario has issued $129.8 billion of bonds, or well over one quarter of total debt, with maturities of 30 years or longer since 2010–11. This includes $5.6 billion in 2023–24.
The success Ontario has had in extending the term of its debt from the time of the Global Financial Crisis has created flexibility for managing its large borrowing program and debt portfolio. Due to the extension of the term of debt in recent years, the impact on IOD in the short term and medium term has been lessened. Given interest rates have recently risen to near historical averages, Ontario will monitor the market and adjust the debt term strategy in the future, if necessary, in response to further changes to interest rates and the yield curve.
Ensuring Adequate Liquidity Levels
Ontario balances the objective of minimizing the cost of holding liquid reserves against the need to always have enough cash on hand to pay its bills, invest in capital assets, refinance maturing debt and pay interest.
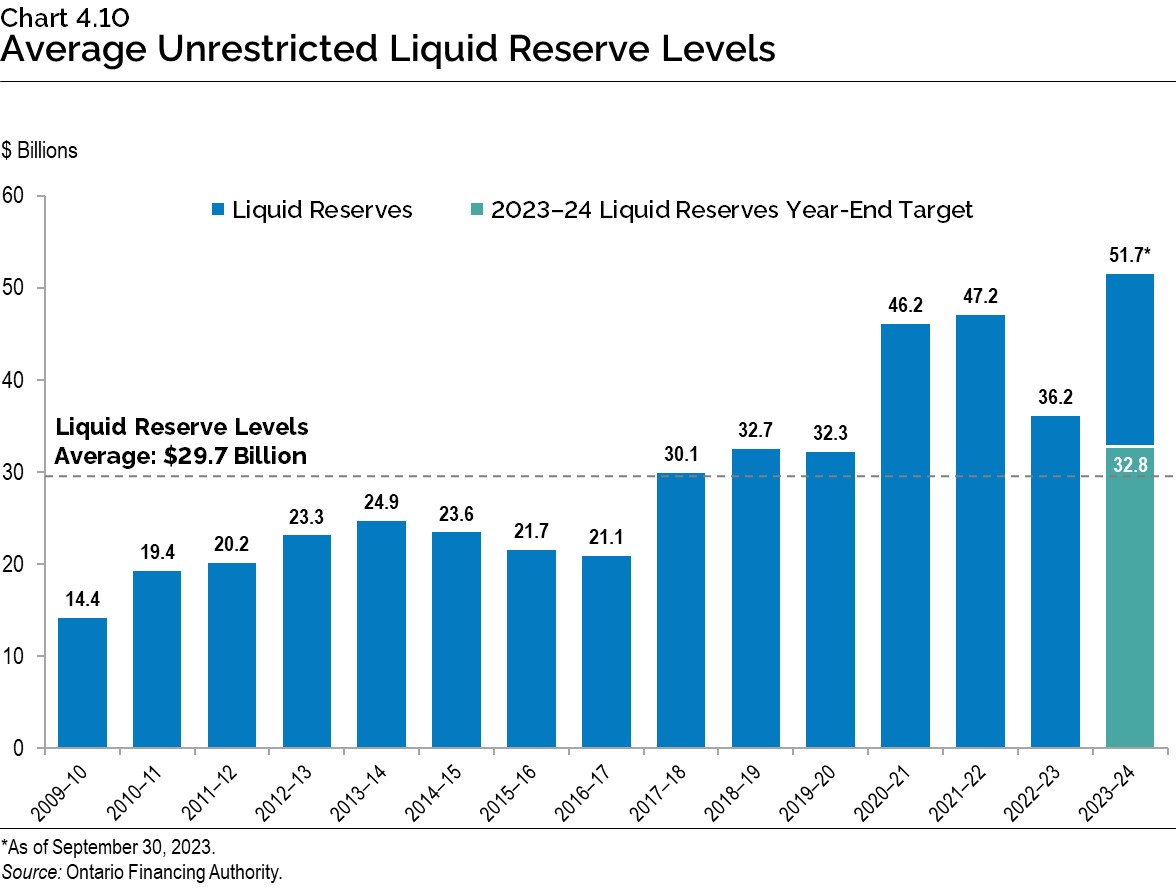
With the onset of the COVID-19 pandemic, Ontario had built larger cash reserves due to growth in the borrowing program. Starting in 2022–23, Ontario began to bring liquid reserves back to pre‑COVID-19 pandemic levels, as shown in Chart 4.10. Cash reserves also allow the government to quickly respond to any unforeseen borrowing market, economic or geopolitical events.
Ontario’s unrestricted liquid reserves for 2023–24 have averaged $51.7 billion so far this year. These levels are unusually high, and well above the target of $32.8 billion for the end of the fiscal year. The average for the year to date is pulled higher by having kept sufficient funds for the first two months of the fiscal year in advance of a large debt maturity and coupon payment on June 2, 2023, totalling over $16 billion. As well, liquid reserves have remained high given other financial obligations that had yet to be paid out by September 30.
Progress on the Debt Burden Reduction Strategy
In the 2023 Budget, Ontario included an updated Debt Burden Reduction Strategy, with new targets over the medium-term outlook for the relevant measures of debt sustainability. The government remains committed to reducing the debt burden and putting Ontario’s finances back on a more sustainable path.
| 2023 Budget Target |
2023 Budget 2023–24 |
2023 FES 2023–24 |
|
|---|---|---|---|
| Net Debt-to-GDP | <40.0 | 37.8 | 38.4 |
| Net Debt-to-Revenue | <200 | 199 | 206 |
| Interest on Debt-to-Revenue | <7.5 | 6.9 | 6.7 |
Table 4.2 footnotes:
Note: 2023 FES in the table is defined as the 2023 Ontario Economic Outlook and Fiscal Review.
Source: Ontario Financing Authority.
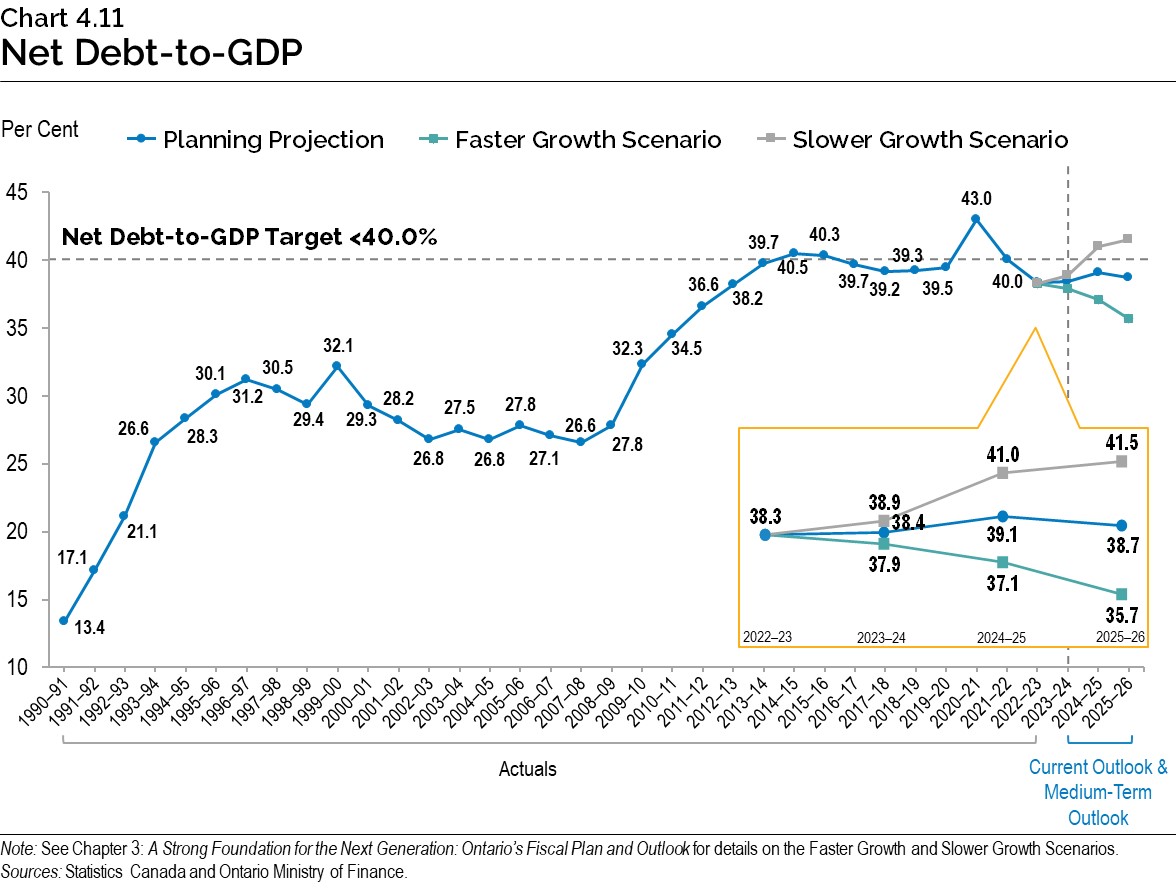
Ontario’s 2023–24 net debt-to-GDP ratio is now forecast to be 38.4 per cent, an increase of 0.6 percentage points from the forecasted 37.8 per cent in the 2023 Budget, which is mainly due to higher than previously projected deficits. This ratio measures the relationship between a government’s obligations and its ability to meet them, indicating the burden of government debt as a share of the economy. Ontario’s net debt-to-GDP is now forecast to be 39.1 per cent in 2024–25 and 38.7 per cent in 2025–26, compared to the 2023 Budget forecasts of 37.7 per cent and 36.9 per cent, respectively.
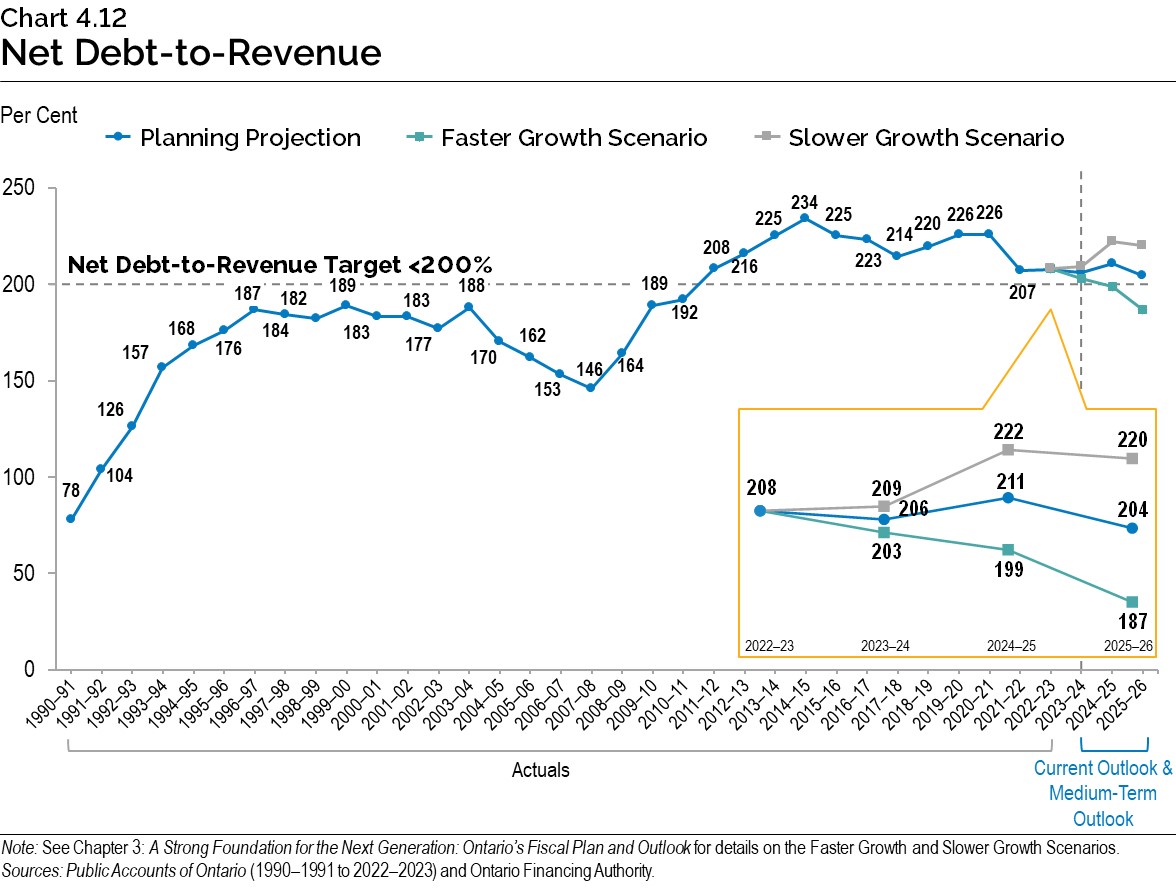
The net debt‑to-revenue ratio is projected to be 206 per cent in 2023–24, 7 percentage points above the 199 per cent forecast in the 2023 Budget. This ratio is an indicator of how many years it would take to eliminate the debt if the Ontario government were to spend all its annual revenue on debt repayment. Over the medium-term outlook, this ratio is forecast to be 211 per cent in 2024–25 and 204 per cent in 2025–26, higher by 14 percentage points in each year, compared to the forecast in the 2023 Budget. The modest rise in this ratio above the 200 per cent target will be monitored leading up to the 2024 Budget.
The IOD-to-revenue ratio is forecast to be 6.7 per cent in 2023–24, 0.2 percentage points lower than the 6.9 per cent forecast in the 2023 Budget. This ratio represents how much Ontario needs to spend on interest for every revenue dollar received. Despite increases in deficits, IOD-to-revenue over the medium term continues to remain lower than forecasted in the pre-COVID-19 pandemic 2019 Budget. This ratio is forecast to remain below the peak of 9.1 per cent reached last decade during the recovery from the Global Financial Crisis and is significantly lower than the levels in the early 1990s through to the mid‑2000s.
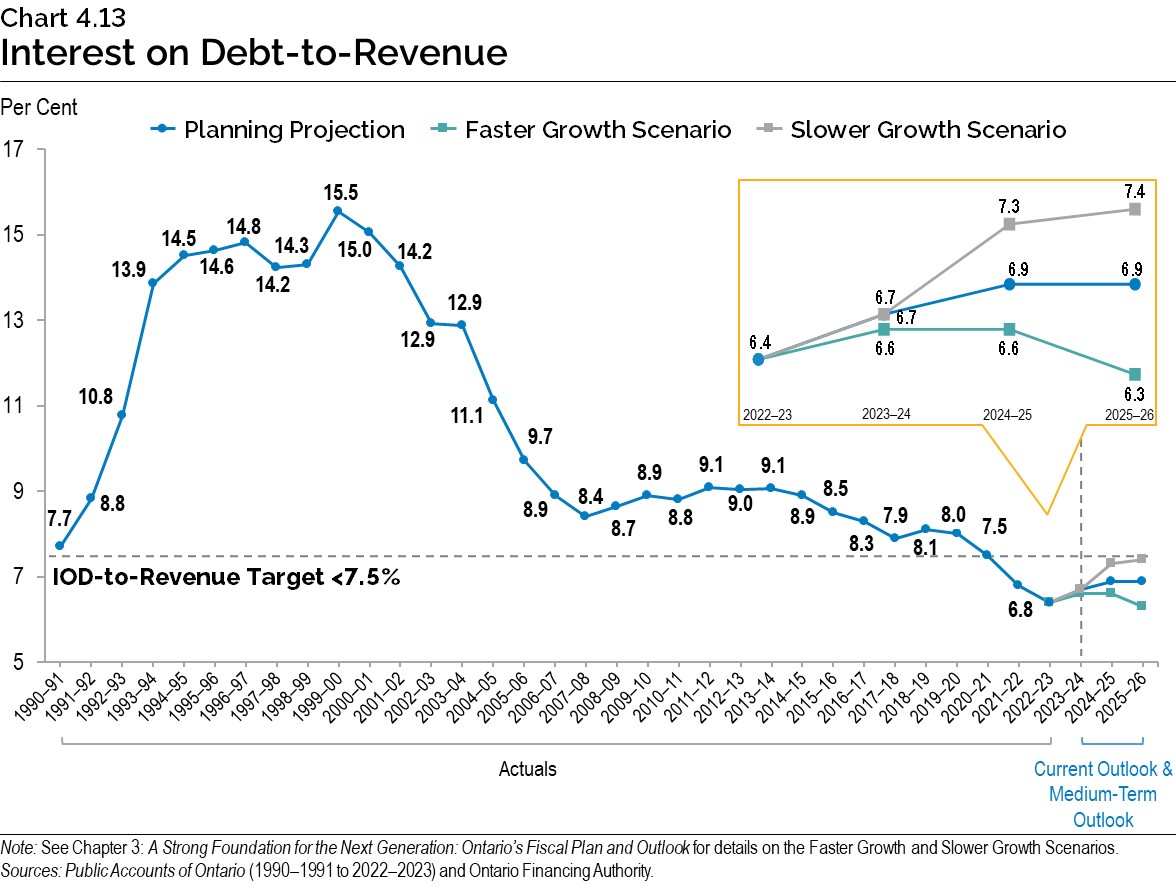
Chart Descriptions
Chart 4.1: Borrowing Outlook Scenarios for Long-Term Borrowing
| Year | 2022–23 | 2023–24 | 2024–25 | 2025–26 |
|---|---|---|---|---|
| Planning Projection | $32.2 | $34.7 | $37.4 | $37.0 |
| Slower Growth Scenario | $32.2 | $36.8 | $44.0 | $45.8 |
| Faster Growth Scenario | $32.2 | $32.4 | $30.2 | $27.0 |
Sources: Ontario Financing Authority andOntario Ministry of Finance.
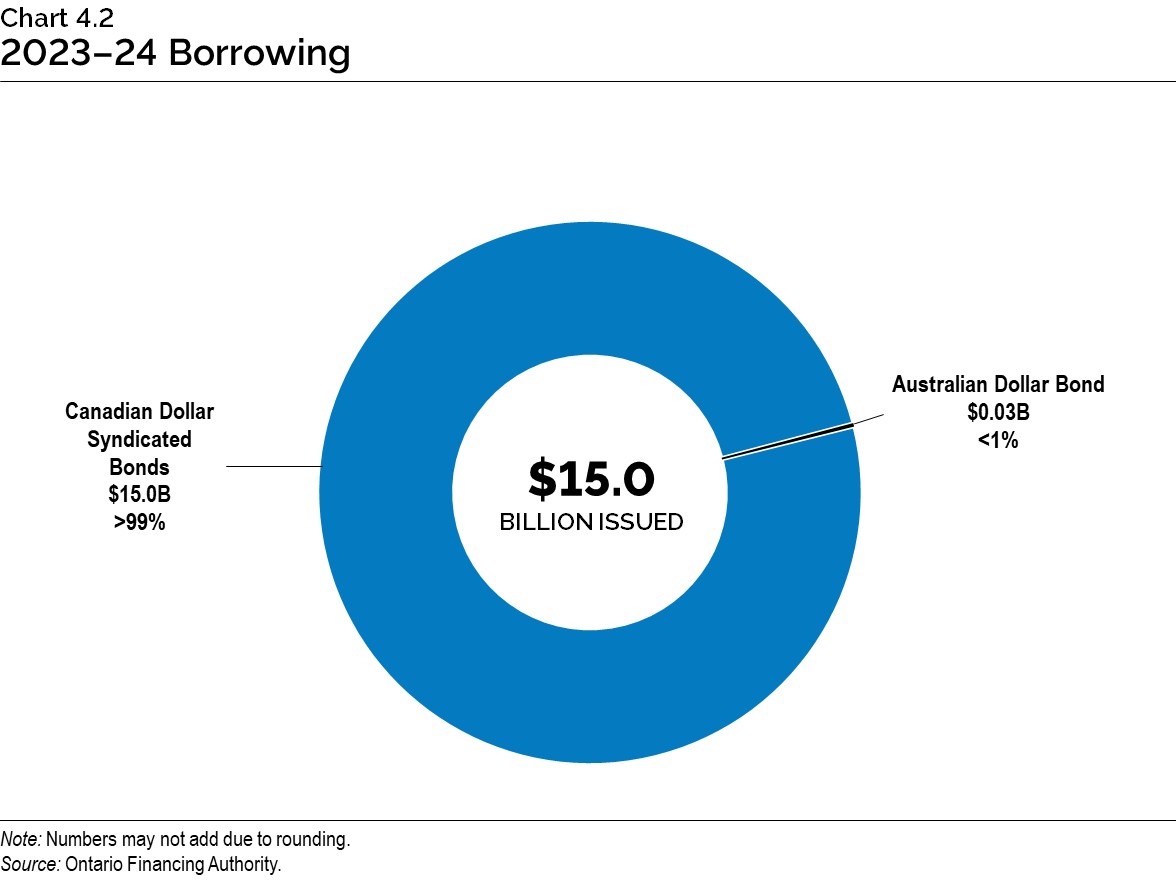
Chart 4.2: 2023–24 Borrowing
Long-term public borrowing of $15.0 billion has been completed for fiscal year 2023–24. This consisted of $15.0 billion (more than 99 per cent) of Canadian dollar syndicated bonds, and $0.03 billion (less than 1 per cent) of Australian dollar bond.
Note: Numbers may not add due to rounding.
Source: Ontario Financing Authority.
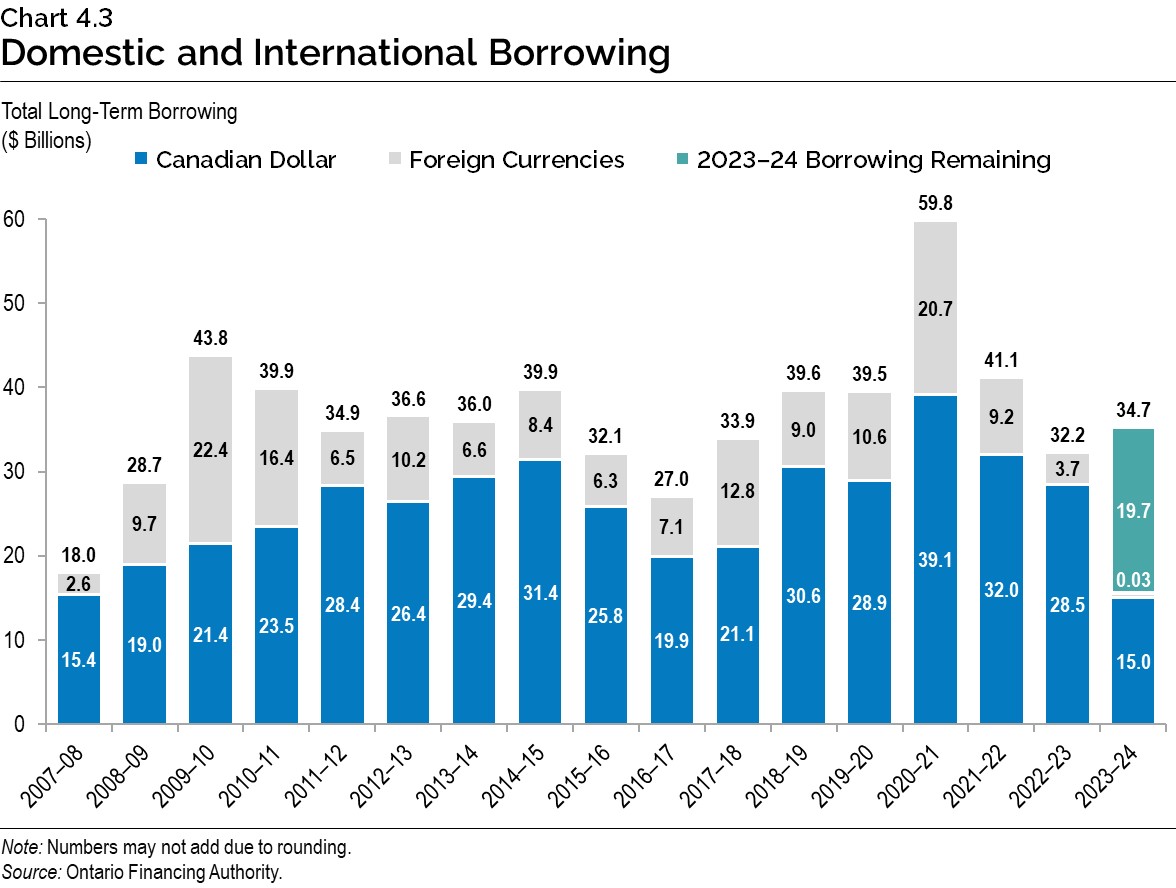
Chart 4.3: Domestic and International Borrowing
Ontario’s total long-term borrowing completed in 2023–24 is forecast to be $34.7 billion — $15.0 billion was borrowed in the Canadian dollar market and $0.03 billion was borrowed in foreign currencies, with $19.7 billion of borrowing remaining for 2023–24.
| Year | Canadian Dollar ($ Billions) | Foreign Currencies ($ Billions) | Total ($ Billions) |
|---|---|---|---|
| 2007–08 | 15.4 | 2.6 | 18.0 |
| 2008–09 | 19.0 | 9.7 | 28.7 |
| 2009–10 | 21.4 | 22.4 | 43.8 |
| 2010–11 | 23.5 | 16.4 | 39.9 |
| 2011–12 | 28.4 | 6.5 | 34.9 |
| 2012–13 | 26.4 | 10.2 | 36.6 |
| 2013–14 | 29.4 | 6.6 | 36.0 |
| 2014–15 | 31.4 | 8.4 | 39.9 |
| 2015–16 | 25.8 | 6.3 | 32.1 |
| 2016–17 | 19.9 | 7.1 | 27.0 |
| 2017–18 | 21.1 | 12.8 | 33.9 |
| 2018–19 | 30.6 | 9.0 | 39.6 |
| 2019–20 | 28.9 | 10.6 | 39.5 |
| 2020–21 | 39.1 | 20.7 | 59.8 |
| 2021–22 | 32.0 | 9.2 | 41.1 |
| 2022–23 | 28.5 | 3.7 | 32.2 |
| 2023–24 | 15.0 | 0.03 | 34.7 |
Note: Numbers may not add due to rounding.
Source: Ontario Financing Authority.
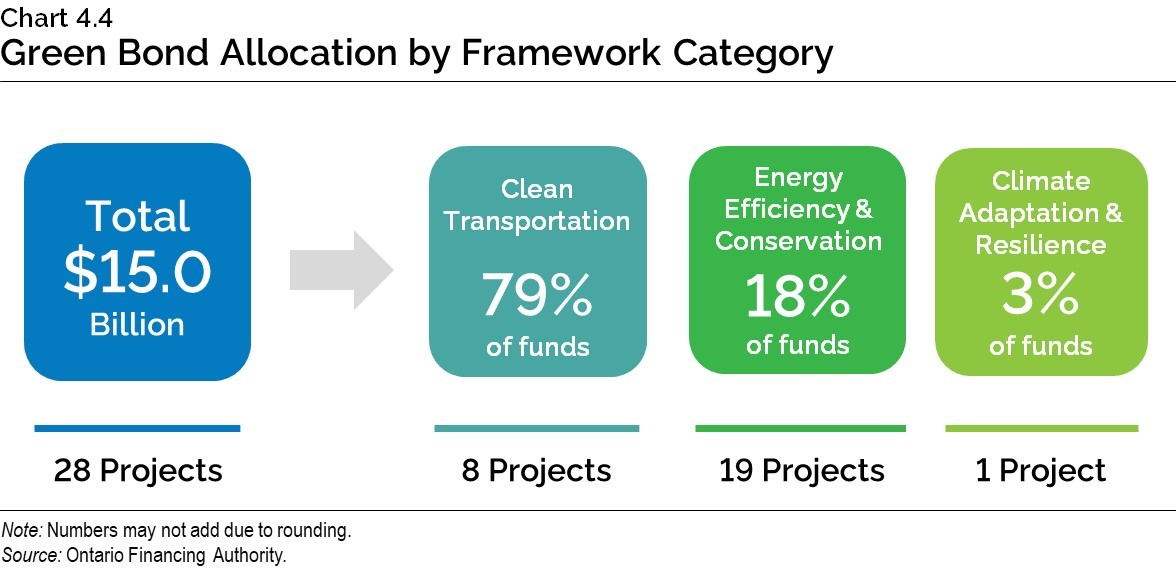
Chart 4.4: Green Bond Allocation by Framework Category
A total of $15.0 billion in Green Bond funding has provided funding for 28 projects. Eight of those projects are under the Clean Transportation framework category and have received 79 per cent of the funding. Nineteen projects are under the Energy Efficiency and Conservation category and have received 18 per cent of the funding. One project is under the Climate Adaptation and Resilience category and has received three per cent of the funding.
Note: Numbers may not add due to rounding.
Source: Ontario Financing Authority.
Chart 4.5: Ontario’s Green Bond Issues
Since 2014, Ontario has issued Green Bonds totalling $15.0 billion.
| Year | 2014–15 | 2015–16 | 2016–17 | 2017–18 | 2018–19 | 2019–20 | 2020–21 | 2021–22 | 2022–23 |
|---|---|---|---|---|---|---|---|---|---|
| Green Bond Issues ($) | $500 million | $750 million | $800 million | $1.0 billion | $950 million | $1.25 billion | $2.75 billion | $4.5 billion | $2.5 billion |
Source: Ontario Financing Authority.
Chart 4.6: Effective Interest Rate (Weighted Average) on Total Debt
As of September 30, 2023, the effective interest rate (calculated as a weighted average) for
fiscal year-end is forecast to be 3.3 per cent on Ontario’s total debt.
| Year | Effective Interest Rate (%) |
|---|---|
| 1990–91 | 10.9 |
| 1991–92 | 10.7 |
| 1992–93 | 10.1 |
| 1993–94 | 9.5 |
| 1994–95 | 9.8 |
| 1995–96 | 9.4 |
| 1996–97 | 9.0 |
| 1997–98 | 9.0 |
| 1998–99 | 8.6 |
| 1999–00 | 8.4 |
| 2000–01 | 8.2 |
| 2001–02 | 7.6 |
| 2002–03 | 7.2 |
| 2003–04 | 6.7 |
| 2004–05 | 6.4 |
| 2005–06 | 6.1 |
| 2006–07 | 6.0 |
| 2007–08 | 5.8 |
| 2008–09 | 5.2 |
| 2009–10 | 4.6 |
| 2010–11 | 4.5 |
| 2011–12 | 4.4 |
| 2012–13 | 4.1 |
| 2013–14 | 3.9 |
| 2014–15 | 3.7 |
| 2015–16 | 3.6 |
| 2016–17 | 3.5 |
| 2017–18 | 3.6 |
| 2018–19 | 3.6 |
| 2019–20 | 3.4 |
| 2020–21 | 3.0 |
| 2021–22 | 3.0 |
| 2022–23 | 3.2 |
| 2023–24 | 3.3* |
*As of September 30, 2023.
Sources: Public Accounts of Ontario (1990–1991 to 2022–2023) and Ontario Financing Authority.
Chart 4.7: Average Annual Ontario Borrowing Rates
| Year | 2023 Ontario Economic Outlook and Fiscal Review (%) |
|---|---|
| 2022–23 | 3.78 |
| 2023–24 | 4.60 |
| 2024–25 | 4.60 |
| 2025–26 | 4.65 |
Source: Ontario Financing Authority.
Chart 4.8: Interest on Debt Expense Lower than 2023 Budget Forecast
| Year | 2023 Ontario Economic Outlook and Fiscal Review ($ Billions) | 2023 Budget ($ Billions) |
|---|---|---|
| 2022–23 | 12.4* | 13.4 |
| 2023–24 | 13.4 | 14.1 |
| 2024–25 | 14.3 | 14.4 |
| 2025–26 | 15.2 | 15.1 |
*Public Accounts of Ontario 2022–2023.
Source: Ontario Financing Authority.
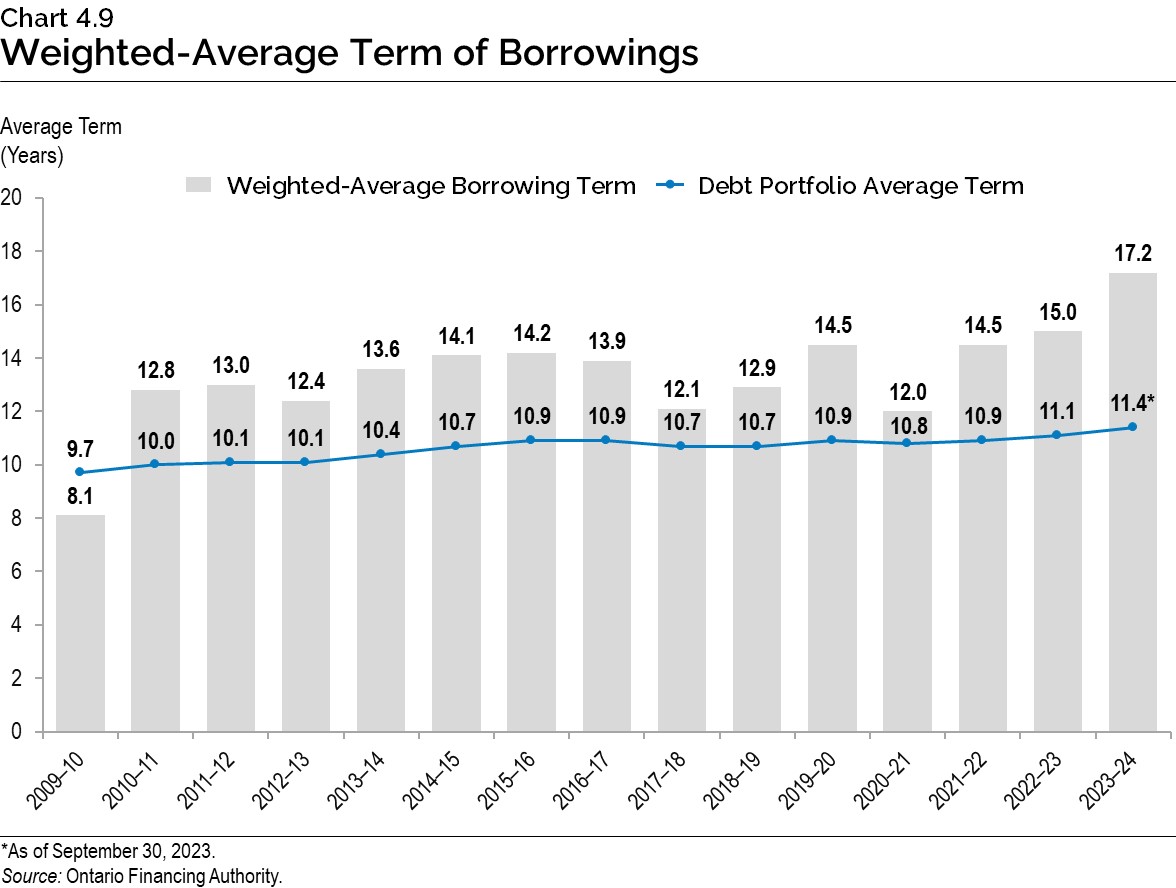
Chart 4.9: Weighted-Average Term of Borrowings
The average term of Ontario’s debt portfolio has been extended from 9.7 years in 2009–10 to 11.4 years in 2023–24. The weighted-average borrowing term for 2022–23 was 17.2 years as of October 12, 2023.
| Year | 2009–10 | 2010–11 | 2011–12 | 2012–13 | 2013–14 | 2014–15 | 2015–16 | 2016–17 | 2017–18 | 2018–19 | 2019–20 | 2020–21 | 2021–22 | 2022–23 | 2023–24 |
|---|---|---|---|---|---|---|---|---|---|---|---|---|---|---|---|
| Weighted-Average Borrowing Term (Years) | 8.1 | 12.8 | 13.0 | 12.4 | 13.6 | 14.1 | 14.2 | 13.9 | 12.1 | 12.9 | 14.5 | 12.0 | 14.5 | 15.0 | 17.2 |
| Debt Portfolio Average Term (Years) | 9.7 | 10.0 | 10.1 | 10.1 | 10.4 | 10.7 | 10.9 | 10.9 | 10.7 | 10.7 | 10.9 | 10.8 | 10.9 | 11.1 | 11.4* |
*As of September 30, 2023.
Source: Ontario Financing Authority.
Chart 4.10: Average Unrestricted Liquid Reserve Levels
Average unrestricted liquid reserve levels for 2023–24 were $51.7 billion as of September 30, 2023, with a year-end target of $32.8 billion.
| Year | Average Unrestricted Liquid Reserve Levels ($ billions) |
|---|---|
| 2009–10 | 14.4 |
| 2010–11 | 19.4 |
| 2011–12 | 20.2 |
| 2012–13 | 23.3 |
| 2013–14 | 24.9 |
| 2014–15 | 23.6 |
| 2015–16 | 21.7 |
| 2016–17 | 21.1 |
| 2017–18 | 30.1 |
| 2018–19 | 32.7 |
| 2019–20 | 32.3 |
| 2020–21 | 46.2 |
| 2021–22 | 47.2 |
| 2022–23 | 36.2 |
| 2023–24 | 51.7 |
Source: Ontario Financing Authority.
Chart 4.11: Net Debt-to-GDP
Ontario’s net debt-to-GDP ratio is forecast at 38.4 per cent in 2023–24.
| Year | Planning Projection (%) | Faster Growth Scenario (%) | Slower Growth Scenario (%) |
|---|---|---|---|
| 1990–91 | 13.4 | – | – |
| 1991–92 | 17.1 | – | – |
| 1992–93 | 21.1 | – | – |
| 1993–94 | 26.6 | – | – |
| 1994–95 | 28.3 | – | – |
| 1995–96 | 30.1 | – | – |
| 1996–97 | 31.2 | – | – |
| 1997–98 | 30.5 | – | – |
| 1998–99 | 29.4 | – | – |
| 1999–00 | 32.1 | – | – |
| 2000–01 | 29.3 | – | – |
| 2001–02 | 28.2 | – | – |
| 2002–03 | 26.8 | – | – |
| 2003–04 | 27.5 | – | – |
| 2004–05 | 26.8 | – | – |
| 2005–06 | 27.8 | – | – |
| 2006–07 | 27.1 | – | – |
| 2007–08 | 26.6 | – | – |
| 2008–09 | 27.8 | – | – |
| 2009–10 | 32.3 | – | – |
| 2010–11 | 34.5 | – | – |
| 2011–12 | 36.6 | – | – |
| 2012–13 | 38.2 | – | – |
| 2013–14 | 39.7 | – | – |
| 2014–15 | 40.5 | – | – |
| 2015–16 | 40.3 | – | – |
| 2016–17 | 39.7 | – | – |
| 2017–18 | 39.2 | – | – |
| 2018–19 | 39.3 | – | – |
| 2019–20 | 39.5 | – | – |
| 2020–21 | 43.0 | – | – |
| 2021–22 | 40.0 | – | – |
| 2022–23 | 38.3 | – | – |
| 2023–24 | 38.4 | 37.9 | 38.9 |
| 2024–25 | 39.1 | 37.1 | 41.0 |
| 2025–26 | 38.7 | 35.7 | 41.5 |
Note: See Chapter 3: A Strong Foundation for the Next Generation: Ontario's Fiscal Plan and Outlook for details on the Faster Growth and Slower Growth Scenarios.
Sources: Statistics Canada and Ontario Ministry of Finance.
Chart 4.12: Net Debt-to-Revenue
Ontario’s net debt-to-revenue ratio is forecast to be 206 per cent in 2023–24.
| Year | Planning Projection (%) | Faster Growth Scenario (%) | Slower Growth Scenario (%) |
|---|---|---|---|
| 1990–91 | 78 | – | – |
| 1991–92 | 104 | – | – |
| 1992–93 | 126 | – | – |
| 1993–94 | 157 | – | – |
| 1994–95 | 168 | – | – |
| 1995–96 | 176 | – | – |
| 1996–97 | 187 | – | – |
| 1997–98 | 184 | – | – |
| 1998–99 | 182 | – | – |
| 1999–00 | 189 | – | – |
| 2000–01 | 183 | – | – |
| 2001–02 | 183 | – | – |
| 2002–03 | 177 | – | – |
| 2003–04 | 188 | – | – |
| 2004–05 | 170 | – | – |
| 2005–06 | 162 | – | – |
| 2006–07 | 153 | – | – |
| 2007–08 | 146 | – | – |
| 2008–09 | 164 | – | – |
| 2009–10 | 189 | – | – |
| 2010–11 | 192 | – | – |
| 2011–12 | 208 | – | – |
| 2012–13 | 216 | – | – |
| 2013–14 | 225 | – | – |
| 2014–15 | 234 | – | – |
| 2015–16 | 225 | – | – |
| 2016–17 | 223 | – | – |
| 2017–18 | 214 | – | – |
| 2018–19 | 220 | – | – |
| 2019–20 | 226 | – | – |
| 2020–21 | 226 | – | – |
| 2021–22 | 207 | – | – |
| 2022–23 | 208 | – | – |
| 2023–24 | 206 | 203 | 209 |
| 2024–25 | 211 | 199 | 222 |
| 2025–26 | 204 | 187 | 220 |
Note: See Chapter 3: A Strong Foundation for the Next Generation: Ontario's Fiscal Plan and Outlook for details on the Faster Growth and Slower Growth Scenarios.
Sources: Public Accounts of Ontario (1990–1991 to 2022–2023) and Ontario Financing Authority.
Chart 4.13: Interest on Debt-to-Revenue
Ontario’s interest on debt-to-revenue ratio is forecast to be 6.7 per cent in 2023–24.
| Year | Planning Projection (%) | Faster Growth Scenario (%) | Slower Growth Scenario (%) |
|---|---|---|---|
| 1990–91 | 7.7 | – | – |
| 1991–92 | 8.8 | – | – |
| 1992–93 | 10.8 | – | – |
| 1993–94 | 13.9 | – | – |
| 1994–95 | 14.5 | – | – |
| 1995–96 | 14.6 | – | – |
| 1996–97 | 14.8 | – | – |
| 1997–98 | 14.2 | – | – |
| 1998–99 | 14.3 | – | – |
| 1999–00 | 15.5 | – | – |
| 2000–01 | 15.0 | – | – |
| 2001–02 | 14.2 | – | – |
| 2002–03 | 12.9 | – | – |
| 2003–04 | 12.9 | – | – |
| 2004–05 | 11.1 | – | – |
| 2005–06 | 9.7 | – | – |
| 2006–07 | 8.9 | – | – |
| 2007–08 | 8.4 | – | – |
| 2008–09 | 8.7 | – | – |
| 2009–10 | 8.9 | – | – |
| 2010–11 | 8.8 | – | – |
| 2011–12 | 9.1 | – | – |
| 2012–13 | 9.0 | – | – |
| 2013–14 | 9.1 | – | – |
| 2014–15 | 8.9 | – | – |
| 2015–16 | 8.5 | – | – |
| 2016–17 | 8.3 | – | – |
| 2017–18 | 7.9 | – | – |
| 2018–19 | 8.1 | – | – |
| 2019–20 | 8.0 | – | – |
| 2020–21 | 7.5 | – | – |
| 2021–22 | 6.8 | – | – |
| 2022–23 | 6.4 | – | – |
| 2023–24 | 6.7 | 6.6 | 6.7 |
| 2024–25 | 6.9 | 6.6 | 7.3 |
| 2025–26 | 6.9 | 6.3 | 7.4 |
Note: See Chapter 3: A Strong Foundation for the Next Generation: Ontario's Fiscal Plan and Outlook for details on the Faster Growth and Slower Growth Scenarios.
Sources: Public Accounts of Ontario (1990–1991 to 2022–2023) and Ontario Financing Authority.