Introduction
Ontario’s economy has remained resilient despite still-elevated interest rates and ongoing geopolitical uncertainties weighing on growth. Real gross domestic product (GDP) increased 0.3 per cent in the second quarter of 2024, following growth of 0.7 per cent in the first quarter. Inflation has continued to moderate and is now closer to the Bank of Canada’s 2 per cent target, allowing the Bank to begin lowering policy interest rates.
Despite recent cuts to the Bank of Canada’s key policy interest rate, rates remain at high levels and are projected to continue weighing on economic growth in the near term. Ontario’s real GDP growth is projected to ease from 1.4 per cent in 2023 to 0.9 per cent in 2024. As interest rates continue to decline, real GDP growth is projected to increase to 1.7 per cent in 2025, and to 2.3 per cent in both 2026 and 2027.
Since the 2024 Budget, real GDP growth forecasts have been revised upwards for 2024, as well as for 2026 and 2027, and have been revised lower for 2025. For the purposes of prudent fiscal planning, these projections are set slightly below the average of private‐sector forecasts.
| 2023 | 2024p | 2025p | 2026p | 2027p | |
|---|---|---|---|---|---|
| Real GDP Growth | 1.4 | 0.9 | 1.7 | 2.3 | 2.3 |
| Nominal GDP Growth | 4.3 | 3.8 | 3.9 | 4.4 | 4.4 |
| Employment Growth | 2.4 | 1.4 | 1.5 | 1.4 | 1.2 |
| CPI Inflation | 3.8 | 2.5 | 2.1 | 2.0 | 2.0 |
Table 2.1 footnotes:
p = Ontario Ministry of Finance planning projection based on external sources as of September 19, 2024.
Sources: Statistics Canada and Ontario Ministry of Finance.
Revisions to the Outlook Since the 2024 Budget
The outlook has been revised compared to the projections in the 2024 Budget. Key changes since the 2024 Budget include the following:
- Stronger growth in real GDP in 2024 followed by modestly weaker growth in 2025, and slightly stronger growth in both 2026 and 2027;
- Faster growth in nominal GDP in 2024 and in both 2026 and 2027;
- More robust employment growth in 2024 followed by softer gains in both 2025 and 2027; and
- Upward revisions to nominal household consumption in all years.
| 2024p: 2024 Budget |
2024p: 2024 FES |
2025p: 2024 Budget |
2025p: 2024 FES |
2026p: 2024 Budget |
2026p: 2024 FES |
2027p: 2024 Budget |
2027p: 2024 FES |
|
|---|---|---|---|---|---|---|---|---|
| Real Gross Domestic Product | 0.3 | 0.9 | 1.9 | 1.7 | 2.2 | 2.3 | 2.2 | 2.3 |
| Nominal Gross Domestic Product | 2.7 | 3.8 | 3.9 | 3.9 | 4.3 | 4.4 | 4.1 | 4.4 |
| Compensation of Employees | 4.3 | 5.5 | 4.4 | 4.8 | 4.1 | 4.4 | 4.1 | 4.1 |
| Net Operating Surplus — Corporations | (4.7) | (6.2) | 3.5 | 4.5 | 7.9 | 4.5 | 6.0 | 5.6 |
| Nominal Household Consumption | 3.5 | 5.0 | 4.1 | 4.2 | 4.3 | 4.5 | 4.2 | 4.3 |
| Other Economic Indicators — Employment | 0.8 | 1.4 | 1.7 | 1.5 | 1.4 | 1.4 | 1.4 | 1.2 |
| Other Economic Indicators — Job Creation (000s) | 63 | 111 | 136 | 120 | 114 | 114 | 115 | 99 |
| Other Economic Indicators — Unemployment Rate (Per Cent) | 6.7 | 6.9 | 6.6 | 6.9 | 6.4 | 6.3 | 6.2 | 6.0 |
| Other Economic Indicators — Consumer Price Index | 2.6 | 2.5 | 2.0 | 2.1 | 2.0 | 2.0 | 2.0 | 2.0 |
| Other Economic Indicators — Housing Starts (000s)1 | 87.9 | 81.3 | 92.3 | 86.5 | 94.4 | 93.2 | 95.8 | 95.3 |
| Other Economic Indicators — Home Resales | 4.0 | 2.0 | 16.0 | 13.4 | 1.2 | 5.5 | 1.2 | 1.2 |
| Other Economic Indicators — Home Resale Prices | (0.2) | 0.3 | 3.1 | 4.7 | 4.0 | 4.0 | 4.0 | 4.0 |
| Key External Variables — U.S. Real Gross Domestic Product | 2.1 | 2.7 | 1.7 | 2.0 | 2.1 | 2.1 | 1.9 | 2.0 |
| Key External Variables — WTI Crude Oil ($US per Barrel) | 79 | 77 | 78 | 76 | 77 | 78 | 78 | 78 |
| Key External Variables — Canadian Dollar (Cents US) | 74.6 | 73.3 | 77.6 | 74.4 | 78.2 | 75.2 | 77.0 | 75.9 |
| Key External Variables — Three-Month Treasury Bill Rate (Per Cent)2 | 4.4 | 4.5 | 3.0 | 3.0 | 2.6 | 2.6 | 2.6 | 2.6 |
| Key External Variables — 10-Year Government Bond Rate (Per Cent)3 | 3.2 | 3.3 | 3.1 | 3.1 | 3.3 | 3.2 | 3.5 | 3.4 |
Table 2.2 footnotes:
p = Ontario Ministry of Finance planning projection based on external sources as of September 19, 2024.
[1] Housing starts projection based on private-sector average as of September 19, 2024.
[2], [3] Government of Canada interest rates.
Sources: Statistics Canada; Canada Mortgage and Housing Corporation; Canadian Real Estate Association; Bank of Canada; United States Bureau of Economic Analysis; Blue Chip Economic Indicators (October 2024); U.S. Energy Information Administration; and Ontario Ministry of Finance.
Recent Economic Performance
Ontario’s real GDP growth outpaced Canada’s growth between 2018 and 2023. Over this period, Ontario real GDP growth averaged 1.9 per cent annually, while Canadian real GDP growth averaged 1.6 per cent annually.
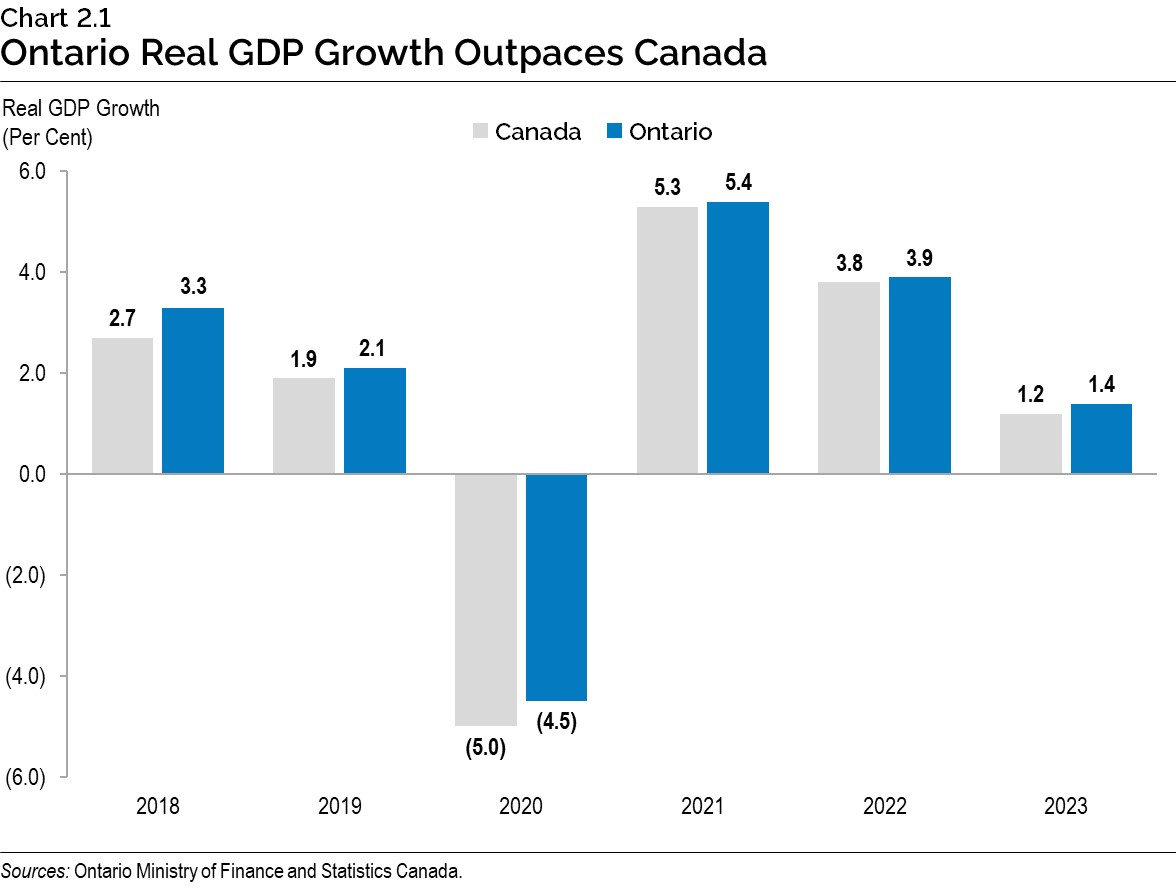
Real GDP in Ontario continued to grow into 2024, rising 0.7 per cent in the first quarter, led by consumer spending and exports. In the second quarter of 2024, Ontario’s real GDP increased 0.3 per cent, with gains in consumer spending on services, government spending and business investment in machinery and equipment.
Canadian real GDP grew by 0.4 per cent in the first quarter of 2024, followed by a 0.5 per cent gain in the second quarter.
Ontario Labour Market
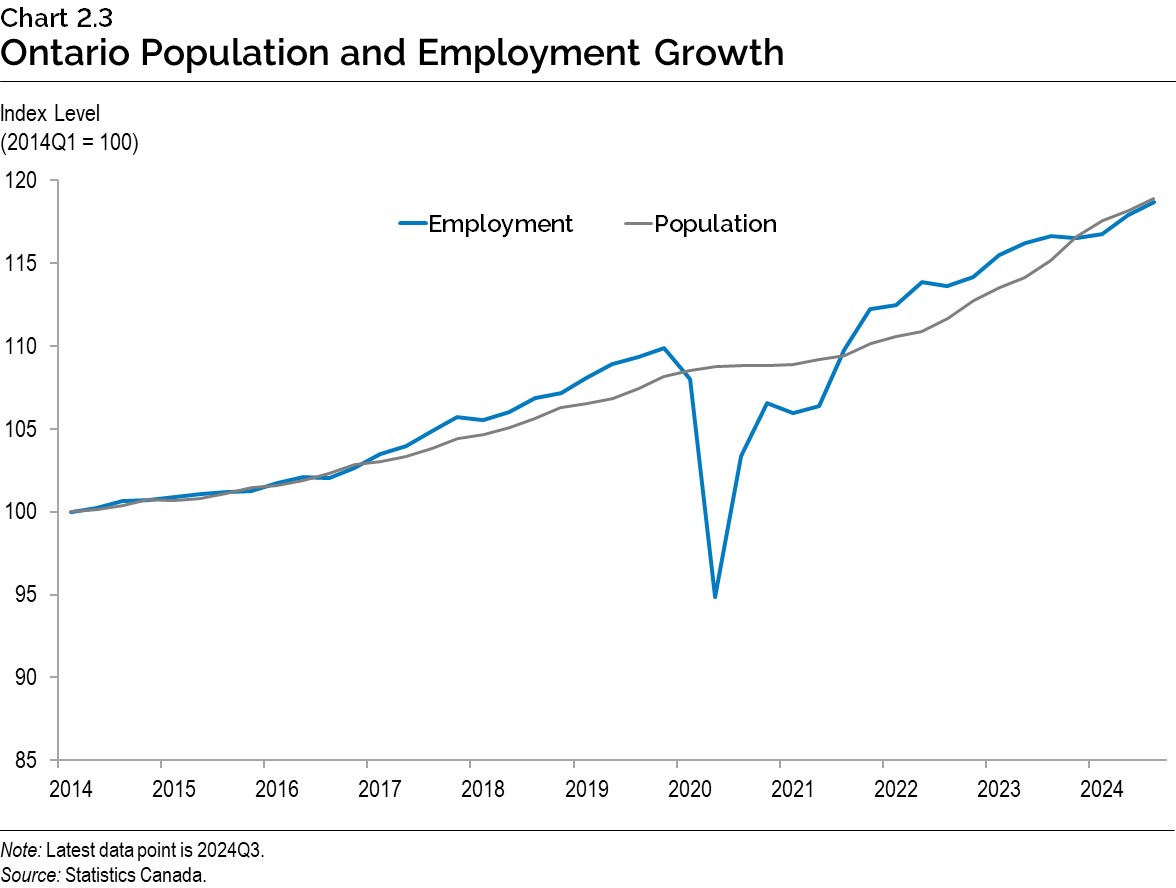
Employment in Ontario has continued to grow, increasing by almost 200,000 since the end of last year. However, the increase in employment has been outpaced by labour force growth due to strong underlying population growth. As a result, Ontario’s unemployment rate rose to 6.9 per cent in September 2024, 1.8 percentage points higher than the recent low of 5.1 per cent in April 2023. While Ontario’s unemployment rate has been trending higher, it remains slightly below the historical average.
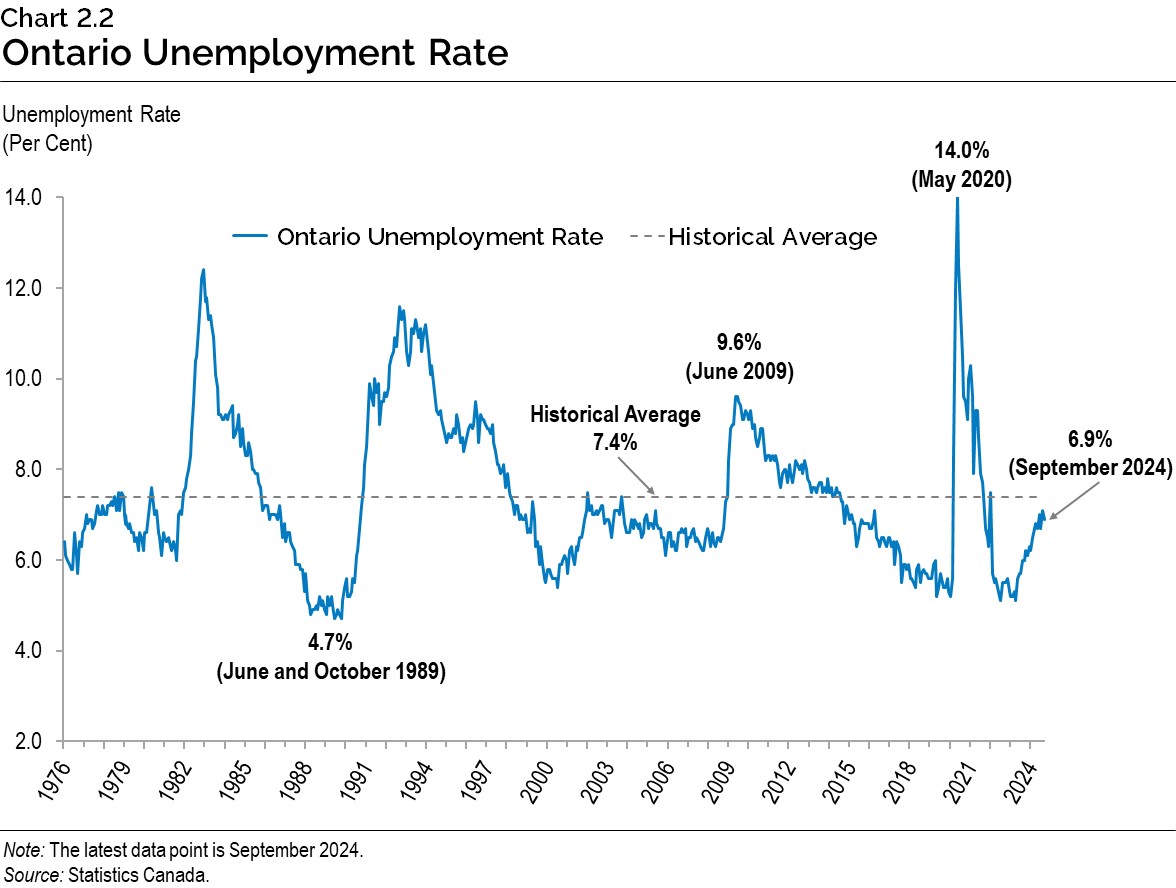
Ontario’s employment growth in the last few years has been taking place alongside historically high population growth. Recently, population growth has outpaced employment growth. However, over the longer term, employment and population have risen at roughly the same rate.
Wage growth has remained strong, with average hourly wages outpacing inflation since early 2023. On a year-over-year basis, Ontario average hourly wages were 5.7 per cent higher in September 2024, compared to Consumer Price Index (CPI) inflation of 1.9 per cent. Ontario average real wages, adjusted for inflation, are well above pre-pandemic levels, helping support the purchasing power of workers and households.
Consumer Price Inflation
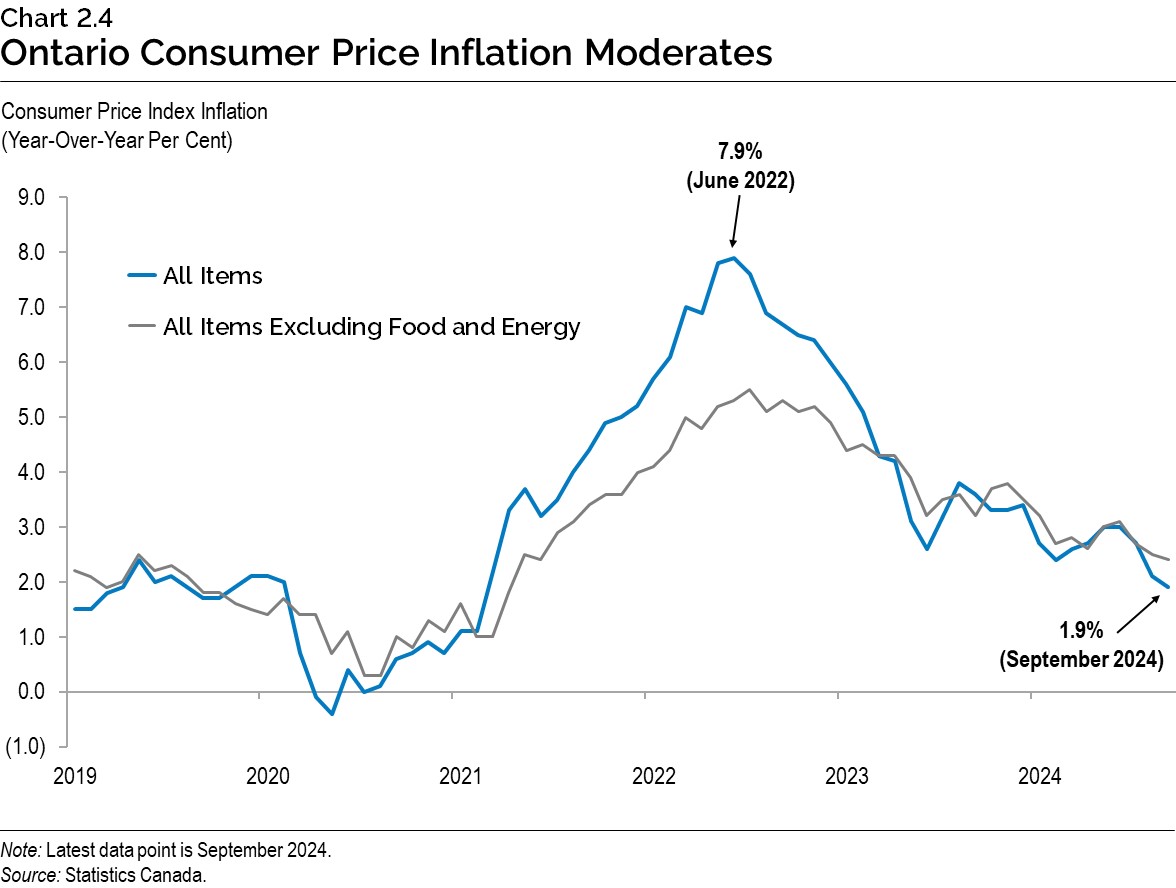
CPI inflation has now returned to within the Bank of Canada’s 1.0 to 3.0 per cent inflation control range. Canadian CPI inflation moderated to 1.6 per cent in September compared to a year earlier, its slowest pace since February 2021.
Ontario CPI inflation moderated to 1.9 per cent (year-over-year) in September, following 2.1 per cent in August. September inflation was six percentage points lower than the peak increase of 7.9 per cent recorded in June 2022. Over this period, price moderation was widespread, with particularly steep declines in energy prices. In September, gasoline prices were 10.1 per cent lower than a year ago compared to gasoline inflation of 54.8 per cent in June 2022. The extension of existing gasoline and fuel tax rate cuts by the Ontario government has helped keep gas prices lower than they otherwise would have been. At the same time, federal carbon tax policy has contributed to inflation. On April 1, 2024, the carbon tax increased by $15 per tonne to $80 per tonne, which has fueled further inflation.1
Inflation excluding food and energy moderated to 2.4 per cent in September 2024 from 5.5 per cent in July 2022. While prices have moderated for most CPI components, shelter price inflation remained elevated at 5.0 per cent in September, in part due to households continuing to renew and initiate mortgages at relatively high interest rates. Nationally, mortgage interest costs rose by 16.7 per cent, making it the largest contributor to national headline inflation in September.
Economic Outlook
The Ontario Ministry of Finance regularly consults with private-sector economists while tracking their forecasts to inform the government’s planning assumptions.
Private-sector forecasters, on average, are projecting that Ontario’s real GDP will grow by 1.0 per cent in 2024, 1.8 per cent in 2025, and by 2.4 per cent in both 2026 and 2027. Since the 2024 Budget, forecasts have been revised upwards for 2024, 2026 and 2027, and revised downwards for 2025. The Ontario Ministry of Finance’s real GDP projections are set slightly below the average of private‑sector forecasts in each year for prudent planning purposes.
| 2024 | 2025 | 2026 | 2027 | |
|---|---|---|---|---|
| BMO Capital Markets (September) | 1.4 | 2.1 | – | – |
| Central 1 Credit Union (September) | 1.2 | 1.9 | 2.0 | – |
| CIBC Capital Markets (September) | 0.7 | 1.4 | – | – |
| The Conference Board of Canada (July) | 1.0 | 2.1 | 2.8 | 2.6 |
| Desjardins Group (September) | 0.9 | 1.8 | – | – |
| Laurentian Bank Securities (September) | 1.0 | 1.7 | – | – |
| National Bank of Canada (September) | 1.0 | 1.3 | – | – |
| Quantitative Economic Decisions, Inc. (September) | 1.3 | 1.8 | 2.6 | 2.3 |
| Royal Bank of Canada (September) | 0.7 | 1.6 | – | – |
| Scotiabank (September) | 1.1 | 1.9 | – | – |
| Stokes Economics (August) | 0.6 | 2.4 | 2.7 | 2.7 |
| TD Bank Group (September) | 1.1 | 1.6 | 2.0 | 2.1 |
| University of Toronto (September) | 1.3 | 2.1 | 2.4 | 2.2 |
| Private-Sector Survey Average | 1.0 | 1.8 | 2.4 | 2.4 |
| Ontario’s Planning Assumption | 0.9 | 1.7 | 2.3 | 2.3 |
Table 2.3 footnotes:
Sources: Ontario Ministry of Finance Survey of Forecasters (September 19, 2024) and Ontario Ministry of Finance.
Private-sector forecasters, on average, are projecting that Ontario’s nominal GDP will grow by 3.9 per cent in 2024, 4.0 per cent in 2025, and by 4.5 per cent in both 2026 and 2027. The Ontario Ministry of Finance’s nominal GDP projections are set slightly below the average of private-sector forecasts in each year for prudent planning purposes.
| 2024 | 2025 | 2026 | 2027 | |
|---|---|---|---|---|
| BMO Capital Markets (September) | 3.8 | 4.3 | – | – |
| Central 1 Credit Union (September) | 3.8 | 3.9 | 4.2 | – |
| CIBC Capital Markets (September) | 3.3 | 3.7 | – | – |
| The Conference Board of Canada (July) | 4.9 | 4.7 | 4.8 | 4.7 |
| Desjardins Group (September) | 3.4 | 3.7 | – | – |
| Laurentian Bank Securities (September) | 3.8 | 3.8 | – | – |
| National Bank of Canada (September) | 3.5 | 3.1 | – | – |
| Quantitative Economic Decisions, Inc. (September) | 5.1 | 4.4 | 4.2 | 4.2 |
| Royal Bank of Canada (September) | 3.3 | 3.7 | – | – |
| Scotiabank (September) | 4.1 | 4.0 | – | – |
| Stokes Economics (August) | 3.4 | 5.5 | 5.3 | 5.2 |
| TD Bank Group (September) | 4.0 | 3.6 | 4.2 | 4.1 |
| University of Toronto (September) | 4.3 | 4.1 | 4.4 | 4.2 |
| Private-Sector Survey Average | 3.9 | 4.0 | 4.5 | 4.5 |
| Ontario’s Planning Assumption | 3.8 | 3.9 | 4.4 | 4.4 |
Table 2.4 footnotes:
Sources: Ontario Ministry of Finance Survey of Forecasters (September 19, 2024) and Ontario Ministry of Finance.
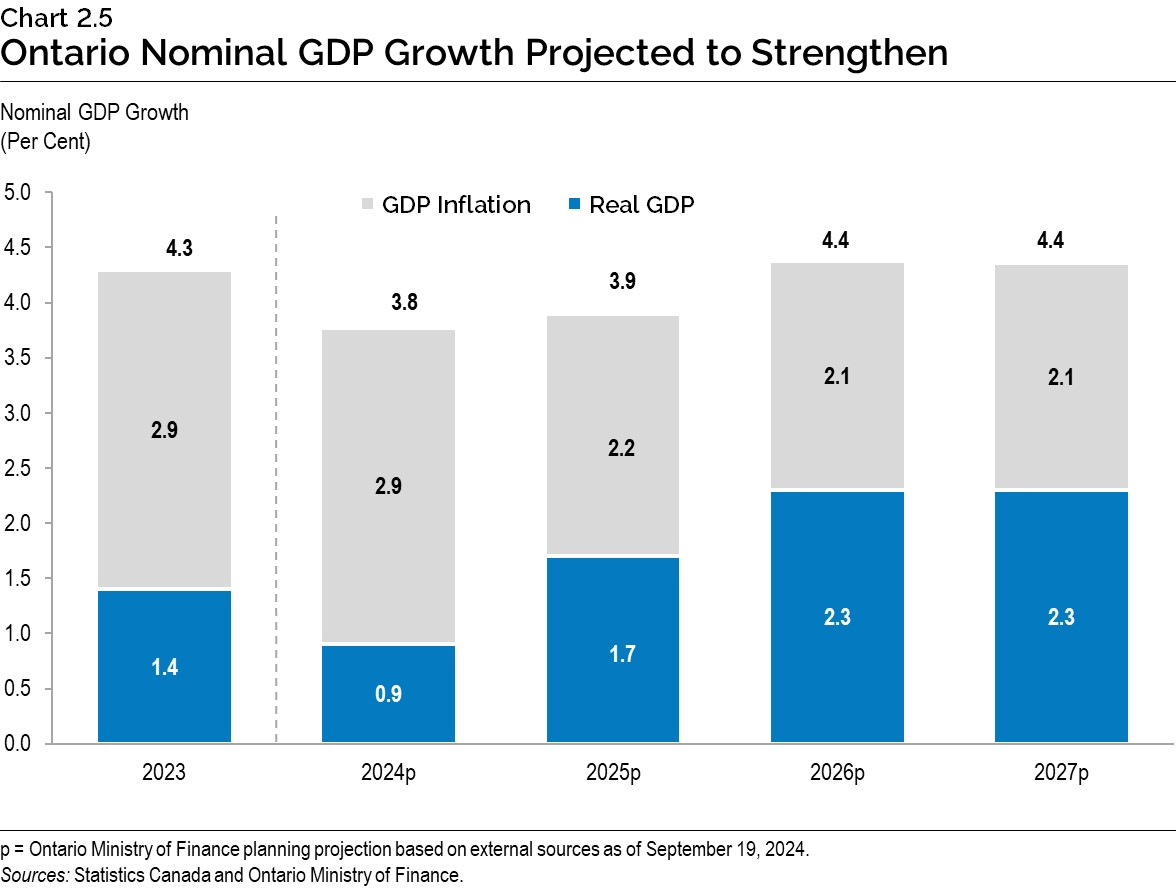
The Ontario Ministry of Finance is projecting that Ontario nominal GDP will rise by 3.8 per cent in 2024, followed by a 3.9 per cent rise in 2025 that reflects lower projected GDP inflation and stronger projected real GDP growth. Nominal GDP growth is projected to rise to 4.4 per cent in both 2026 and 2027, reflecting faster real GDP growth.
Global Economic Environment
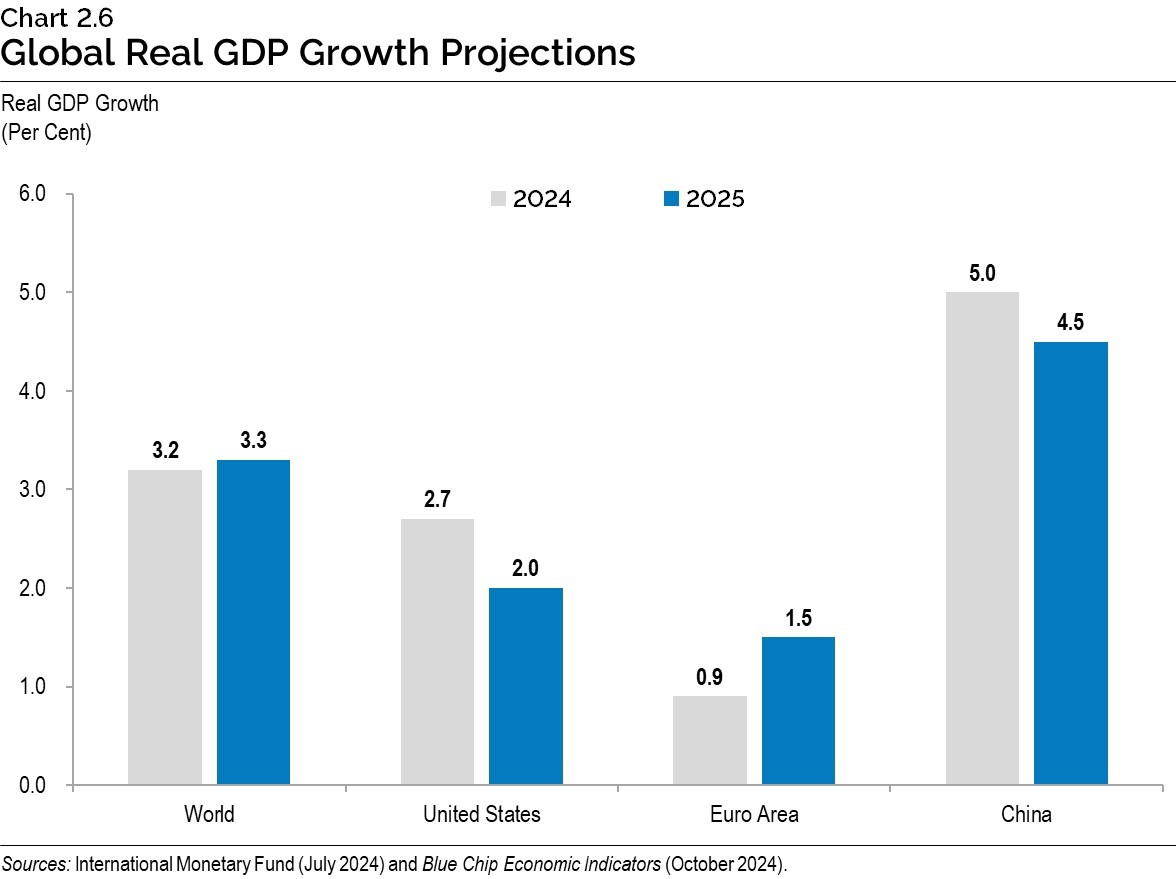
Global economic growth is expected to remain stable in the short run as inflation gradually returns to normal rates in many major economies. The International Monetary Fund (IMF) projects global real GDP growth at 3.2 per cent in 2024 and 3.3 per cent in 2025. According to the IMF, global economic activity is now more aligned with sustainable potential output, as cyclical factors that had led to differences between economies at the start of 2024 ease.
Following growth of 2.9 per cent in 2023, United States real GDP growth is projected to be 2.7 per cent in 2024 and ease to 2.0 per cent in 2025, led by moderating growth in household spending alongside a softer labour market. Euro area real GDP grew slowly in 2023, increasing 0.5 per cent, but is projected to rise by 0.9 per cent in 2024 and by 1.5 per cent in 2025, helped by more supportive monetary policy and strengthening domestic demand. China real GDP growth is projected to slow from 5.2 per cent in 2023 to 5.0 per cent in 2024 and 4.5 per cent in 2025. Growth in China is expected to continue to decelerate over the medium term, due to headwinds from an aging population and slowing productivity growth.
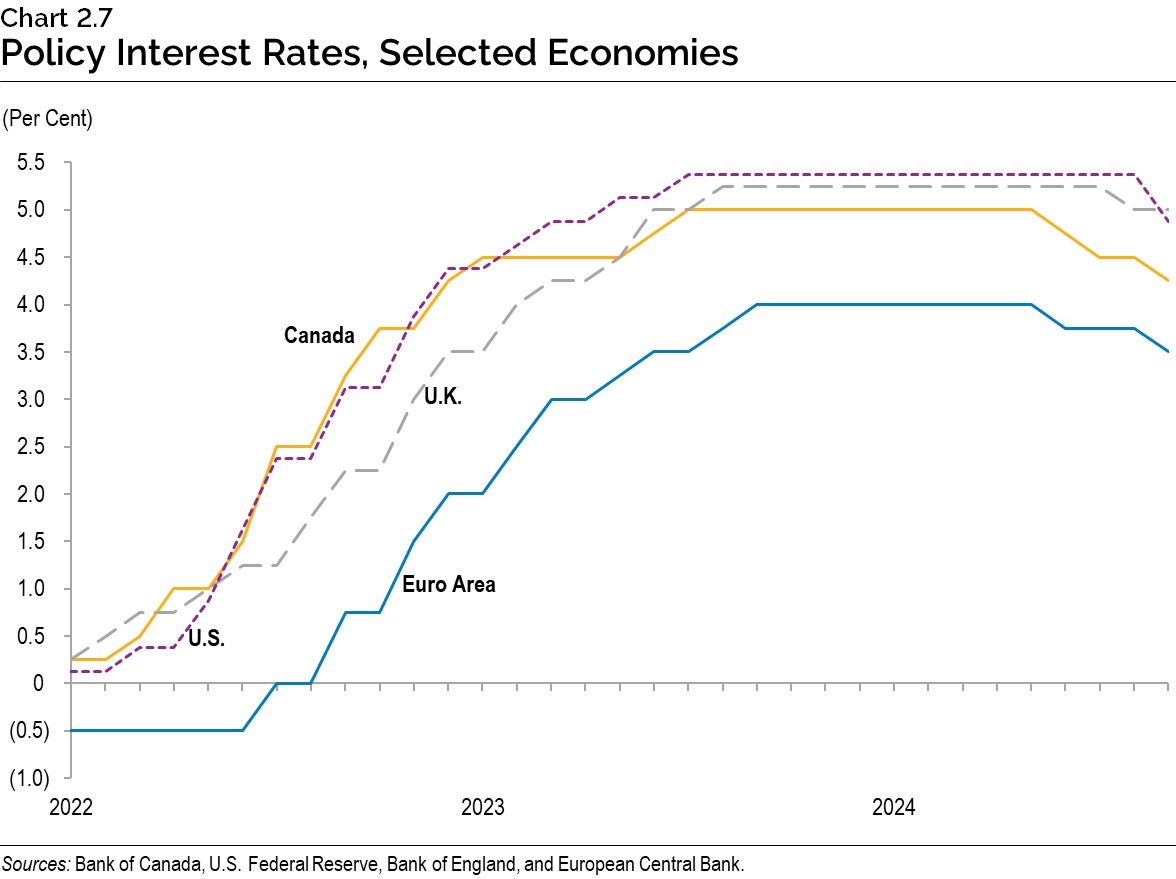
Most major central banks have begun to ease monetary policy as elevated price inflation has continued to moderate. Several central banks have also started the process of quantitative tightening to reduce the size of their balance sheets, which had expanded sharply to support the economy during the pandemic. The pace of future policy rate reductions remains uncertain due to still-elevated services price inflation.
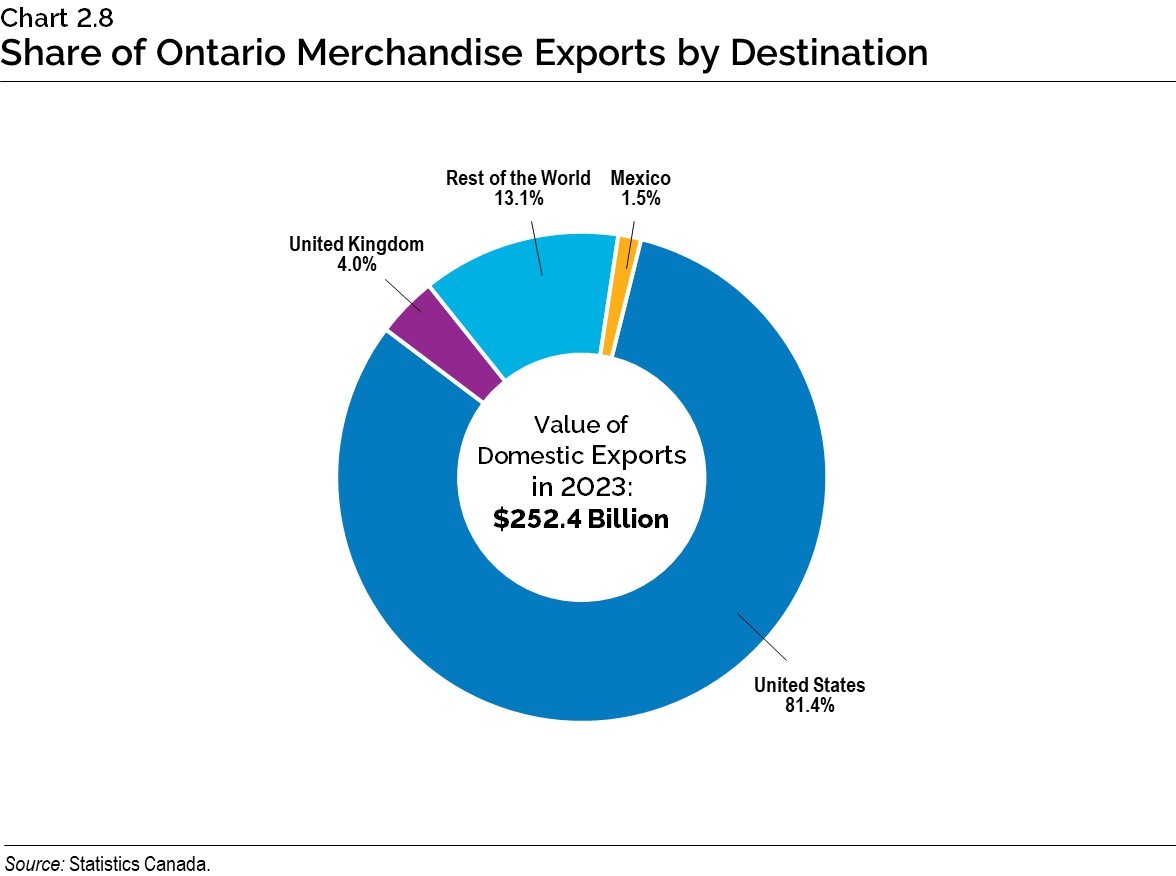
International trade is an important driver of Ontario’s economic growth, with exports accounting for about half of Ontario’s total GDP. Since the Canada-U.S. Free Trade Agreement went into force in 1989, and now as a part of the Canada-United States-Mexico Agreement signed in 2018, both Ontario and the United States have benefited from highly integrated supply chains. In 2023, the United States was the destination for over 81 per cent of Ontario’s domestic merchandise exports. Two-way trade between Ontario and the United States totalled over $493 billion in 2023, an increase of over $100 billion or 26 per cent since 2018. This trade has benefited Ontario, as participation in global supply chains is associated with higher productivity and wages.2 Geopolitical and trade policy developments, particularly in the United States, have the potential to impact Ontario’s economy.
Financial Markets and Other External Factors
CPI inflation in Canada has moderated significantly from recent highs, partly due to monetary policy tightening by the Bank of Canada. Between early 2022 and mid 2023, the Bank implemented the fastest pace of policy rate increases since 1981. The Bank’s policy interest rate peaked at 5.00 per cent between July 2023 and June 2024, well above the 2.25 to 3.25 per cent range that the Bank currently considers as its neutral policy interest rate.3 With Canadian CPI inflation expected to return to the Bank’s 2.0 per cent target in 2025, the Bank lowered its policy interest rate at the June 2024 policy-setting meeting with a 25-basis-point cut, followed by two further 25-basis-point reductions in July and September. The Bank is expected to continue reducing its policy interest rate through next year, which should support economic growth.
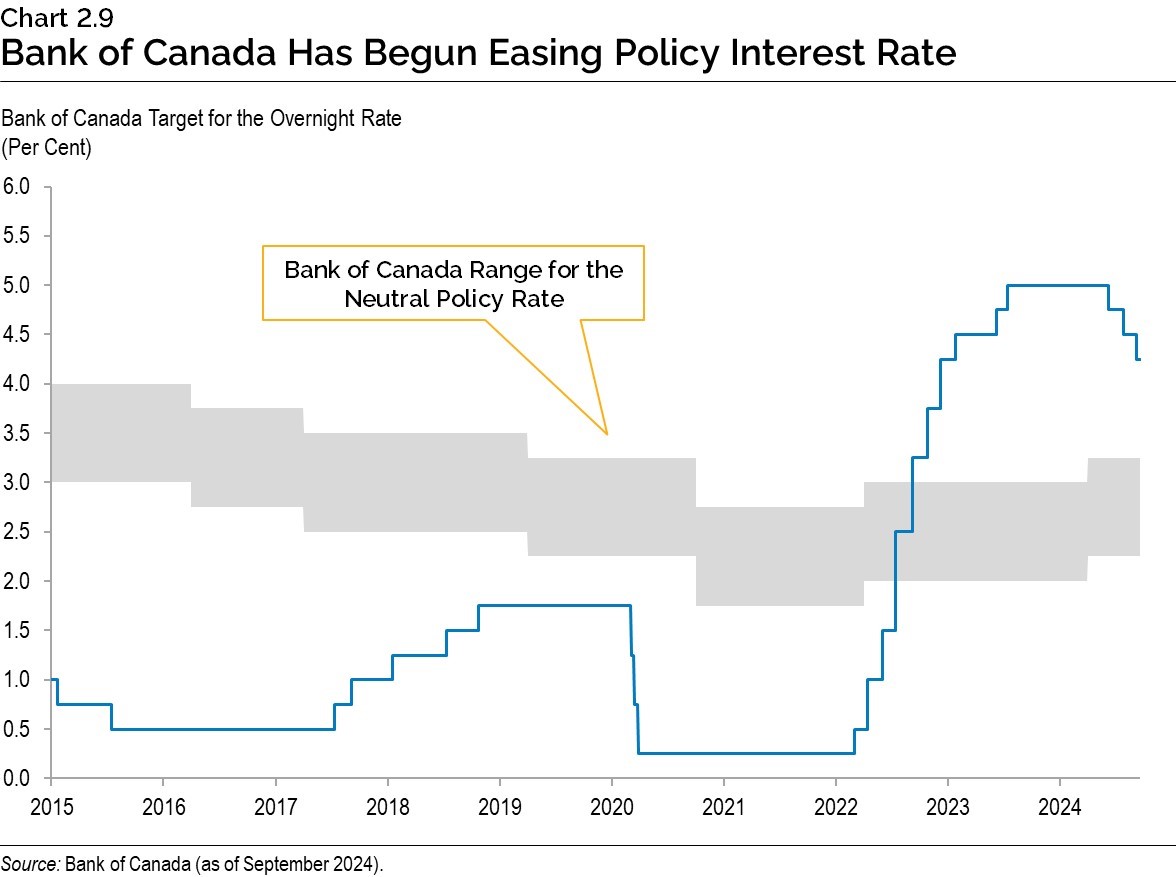
Most private-sector forecasters expect that the Bank of Canada will continue to ease its policy interest rate at the remaining policy-setting meetings in 2024 and further lower the rate in 2025. Accordingly, the Government of Canada three‐month treasury bill rate is expected to moderate from 4.8 per cent in 2023 to 4.5 per cent in 2024 and reach 2.6 per cent by 2026 and 2027. The Government of Canada 10‐year bond rate is expected to remain at its 2023 rate of 3.3 per cent in 2024. It is then expected to edge down to an average of 3.2 per cent between 2025 and 2027.
Energy prices are expected to remain relatively stable over the projection horizon. West Texas Intermediate (WTI) crude oil prices moderated from US$95 per barrel in 2022 to US$78 per barrel in 2023. The WTI price is expected to average US$77 between 2024 and 2027. The Canadian dollar is expected to depreciate from 74.1 cents US in 2023 to 73.3 cents US in 2024. The dollar is then forecast to appreciate gradually over the projection period, rising to 74.4 cents US in 2025 and averaging 75.5 cents US from 2026 to 2027.
| 2023 | 2024p | 2025p | 2026p | 2027p | |
|---|---|---|---|---|---|
| World Real GDP Growth (Per Cent) | 3.3 | 3.2 | 3.3 | 3.2 | 3.1 |
| U.S. Real GDP Growth (Per Cent) | 2.9 | 2.7 | 2.0 | 2.1 | 2.0 |
| West Texas Intermediate (WTI) Crude Oil ($US per Barrel) | 78 | 77 | 76 | 78 | 78 |
| Canadian Dollar (Cents US) | 74.1 | 73.3 | 74.4 | 75.2 | 75.9 |
| Three-Month Treasury Bill Rate1 (Per Cent) | 4.8 | 4.5 | 3.0 | 2.6 | 2.6 |
| 10-Year Government Bond Rate2 (Per Cent) | 3.3 | 3.3 | 3.1 | 3.2 | 3.4 |
Table 2.5 footnotes:
p = Ontario Ministry of Finance planning projection based on external sources as of September 19, 2024.
[1], [2] Government of Canada interest rates.
Sources: International Monetary Fund World Economic Outlook (July 2024 and April 2024); U.S. Bureau of Economic Analysis; U.S. Energy Information Administration; Bank of Canada; Blue Chip Economic Indicators (October 2024); and Ontario Ministry of Finance Survey of Forecasters (September 19, 2024).
Details of Ontario’s Economic Outlook
The Ontario Ministry of Finance projects real GDP to rise by 0.9 per cent in 2024, 1.7 per cent in 2025, and 2.3 per cent in both 2026 and 2027. Nominal GDP is projected to grow by 3.8 per cent in 2024 and 3.9 per cent in 2025 before accelerating to 4.4 per cent in both 2026 and 2027.
| 2023 | 2024p | 2025p | 2026p | 2027p | |
|---|---|---|---|---|---|
| Real Gross Domestic Product | 1.4 | 0.9 | 1.7 | 2.3 | 2.3 |
| Nominal Gross Domestic Product | 4.3 | 3.8 | 3.9 | 4.4 | 4.4 |
| Compensation of Employees | 6.9 | 5.5 | 4.8 | 4.4 | 4.1 |
| Net Operating Surplus — Corporations | (12.8) | (6.2) | 4.5 | 4.5 | 5.6 |
| Nominal Household Consumption | 5.3 | 5.0 | 4.2 | 4.5 | 4.3 |
| Other Economic Indicators — Employment | 2.4 | 1.4 | 1.5 | 1.4 | 1.2 |
| Other Economic Indicators — Job Creation (000s) | 183 | 111 | 120 | 114 | 99 |
| Other Economic Indicators — Unemployment Rate (Per Cent) | 5.7 | 6.9 | 6.9 | 6.3 | 6.0 |
| Other Economic Indicators — Consumer Price Index | 3.8 | 2.5 | 2.1 | 2.0 | 2.0 |
| Other Economic Indicators — Housing Starts (000s)1 | 89.3 | 81.3 | 86.5 | 93.2 | 95.3 |
| Other Economic Indicators — Home Resales | (12.3) | 2.0 | 13.4 | 5.5 | 1.2 |
| Other Economic Indicators — Home Resale Prices | (6.3) | 0.3 | 4.7 | 4.0 | 4.0 |
| Key External Variables — U.S. Real Gross Domestic Product | 2.9 | 2.7 | 2.0 | 2.1 | 2.0 |
| Key External Variables — WTI Crude Oil ($US per Barrel) | 78 | 77 | 76 | 78 | 78 |
| Key External Variables — Canadian Dollar (Cents US) | 74.1 | 73.3 | 74.4 | 75.2 | 75.9 |
| Key External Variables — Three-Month Treasury Bill Rate (Per Cent)2 | 4.8 | 4.5 | 3.0 | 2.6 | 2.6 |
| Key External Variables — 10-Year Government Bond Rate (Per Cent)3 | 3.3 | 3.3 | 3.1 | 3.2 | 3.4 |
Table 2.6 footnotes:
p = Ontario Ministry of Finance planning projection based on external sources as of September 19, 2024.
[1] Housing starts projection based on private-sector average as of September 19, 2024.
[2], [3] Government of Canada interest rates.
Sources: Statistics Canada; Canada Mortgage and Housing Corporation; Canadian Real Estate Association; Bank of Canada; United States Bureau of Economic Analysis; Blue Chip Economic Indicators (October 2024); U.S. Energy Information Administration; and Ontario Ministry of Finance.
Employment
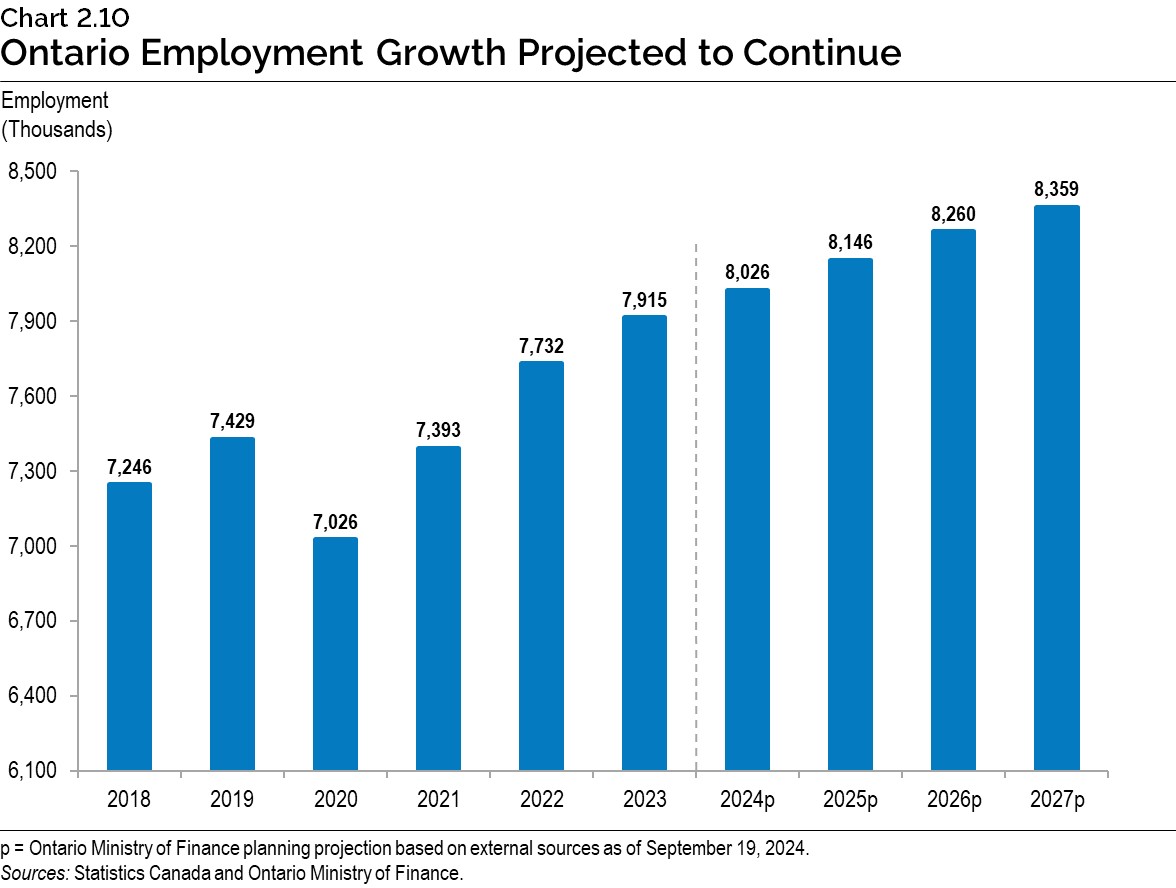
Following employment growth of 2.4 per cent in 2023, slow economic growth is projected to contribute to a moderation in employment growth to 1.4 per cent in 2024, followed by 1.5 per cent in 2025. Employment growth is projected to average 1.3 per cent between 2026 and 2027, with an increase of over 444,000 net new jobs compared to 2023.
Moderating employment growth alongside still-strong gains in population and labour force growth is projected to contribute to a rise in the unemployment rate to 6.9 per cent in 2024 and 2025. Slowing demographic growth and strengthening economic growth are expected to lower the unemployment rate to 6.0 per cent by 2027.
Compensation and Household Spending
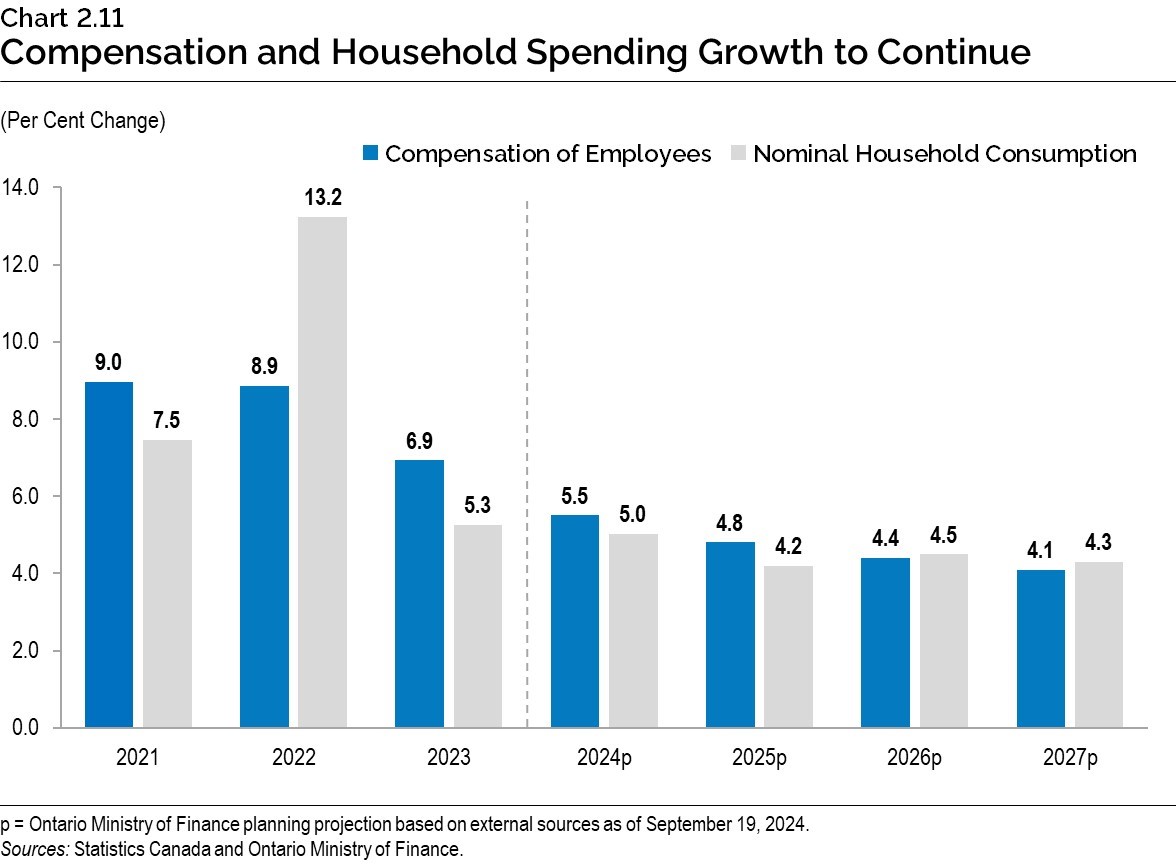
As employment growth slows and wage gains moderate, growth in compensation of employees is projected to ease from 6.9 per cent in 2023 to 5.5 per cent in 2024 and 4.8 per cent in 2025. Compensation of employees is projected to grow 4.3 per cent, on average, annually over 2026 and 2027.
Nominal household spending is projected to rise by 5.0 per cent in 2024, supported by solid compensation growth and strong population gains. Inflation and population growth are projected to slow over the 2025 to 2027 period, impacting nominal household spending growth. Nominal household spending growth is projected to moderate to 4.2 per cent in 2025 and average 4.4 per cent annually over 2026 and 2027.
Consumer Price Inflation
Monetary policy tightening by the Bank of Canada, as well as the moderating of earlier inflationary shocks to global supply chains and commodity markets, have helped ease CPI inflation towards the Bank’s 2.0 per cent inflation rate target. The Bank expects inflation to sustainably return to its target rate in the second half of 2025.
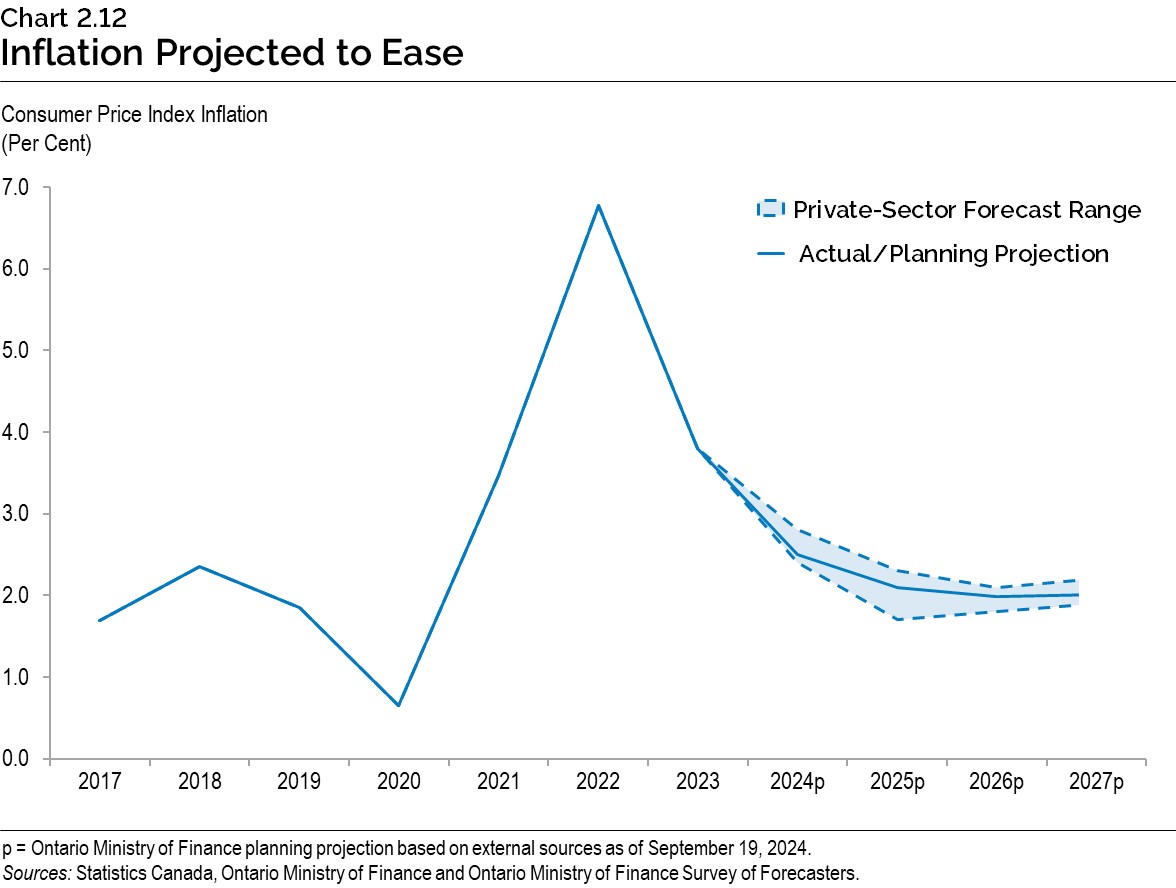
For planning purposes, the Ontario Ministry of Finance is projecting Ontario CPI inflation to slow from 3.8 per cent in 2023 to 2.5 per cent in 2024 and 2.1 per cent in 2025, before returning to the Bank’s 2.0 per cent inflation rate target in 2026 and 2027.
The future path of CPI inflation is uncertain. Persistently elevated inflation for certain services, including shelter, is an upside risk to inflation. Additionally, risks to global supply chains and commodity markets remain elevated. Private‐sector economists have a range of views, with forecasts for 2024 inflation ranging from 2.4 per cent to 2.8 per cent. For 2025, the forecast range of 1.7 per cent to 2.3 per cent is slightly wider. In 2026 and 2027, the range of forecasts is consistent with a successful return to the Bank of Canada’s target rate.
Housing Market
The Bank of Canada began easing monetary policy in June and by September had reduced the policy interest rate by 75 basis points, helping to lower mortgage rates across Canada. Despite the easing in borrowing costs, Ontario’s housing market performance remains subdued.
Several challenges remain. While mortgage rates have declined modestly due to the Bank of Canada’s policy easing, they remain elevated compared to levels prior to the Bank’s monetary tightening.
Looking ahead, lower mortgage rates and more accommodative mortgage regulations recently announced by the federal government are expected to help housing demand recover. However, challenges around housing affordability are expected to moderate gains in home resale and price growth in the projection period.
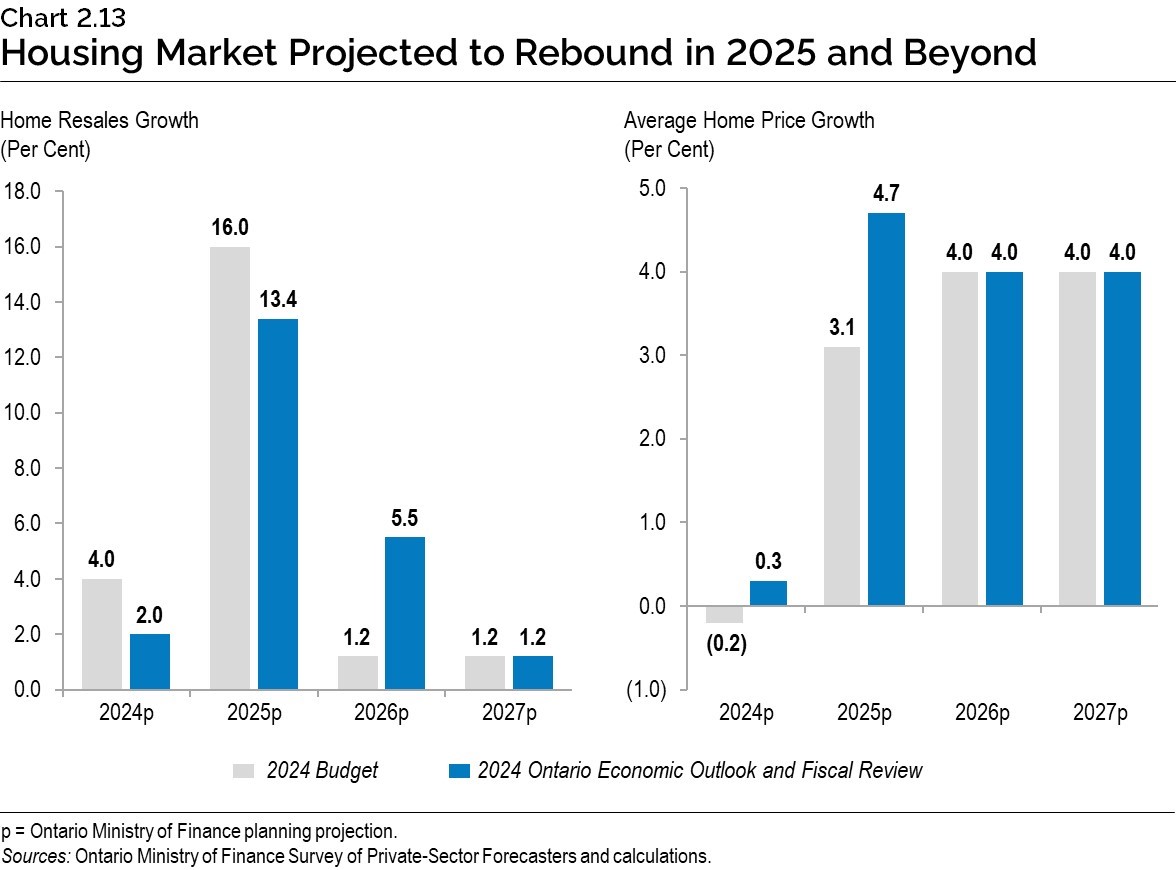
Home resales are projected to grow by 2.0 per cent in 2024, 13.4 per cent in 2025, 5.5 per cent in 2026 and 1.2 per cent in 2027. The average home resale price is projected to grow by 0.3 per cent in 2024, 4.7 per cent in 2025 and 4.0 per cent in 2026 and 2027.
Housing Supply Progress
Ontario has set a goal of building at least 1.5 million homes by 2031 and has assigned the province’s 50 largest and fastest growing municipalities with housing targets to help meet this goal. New homes include a mix of housing types, including additional residential units, student housing, long‑term care and retirement homes.
In 2023, the goal was to create 110,000 new homes in Ontario. By year‐end, 109,011 new homes were created, or 99 per cent of the target. While progress is being made, homebuilders across the province continue to face a challenging economic environment, including elevated interest rates that impact the pace of new home construction. In 2024, the goal is to create 125,000 new homes in Ontario.
Risks to the Outlook
Since peaking in 2022, consumer price inflation in major advanced economies has declined significantly, owing to continued tight monetary policy and a normalization in global supply chains. However, services price inflation has remained high, partly due to shelter price inflation, and continues to pose an upside risk to overall inflation. Persistent inflation in the services sector related to strong wage growth without accompanying productivity growth could result in interest rates remaining at higher levels for longer. This could keep borrowing costs elevated and negatively impact Ontario’s economic growth.
Developments related to conflicts in the Middle East and Ukraine could further fuel inflation in the near term by disrupting supply chains and increasing the cost of imported goods. As well, the risk of increased protectionism and potential further tariffs could revive supply bottlenecks and disrupt trade flows with Ontario’s key trading partners. Also, ongoing, elevated U.S. federal deficits and high levels of public debt pose a risk to the U.S. economy, which could have an impact on Ontario.
Following years of record growth in Ontario’s population, changes in federal immigration policy have created elevated uncertainty around the future pace of Ontario’s demographic growth. Changes in population growth could impact both labour force and employment growth.
Finally, stronger productivity growth, such as through investing in new technologies like artificial intelligence, could help support Ontario’s overall economic growth.
Table 2.7 displays current estimates of the impact of sustained changes in key external factors on Ontario’s real GDP planning assumptions, assuming other external factors remain unchanged. The relatively wide range of estimated impacts reflects the uncertainty regarding how the economy could respond to these changes in external conditions.
| Change in Real GDP Growth First Year |
Change in Real GDP Growth Second Year |
|
|---|---|---|
| Canadian Dollar Appreciates by Five Cents US | (0.1) to (0.7) | (0.2) to (0.8) |
| Crude Oil Prices Increase by $10 US per Barrel | (0.1) to (0.3) | (0.1) to (0.3) |
| U.S. Real GDP Growth Increases by One Percentage Point | +0.2 to +0.6 | +0.3 to +0.7 |
| Canadian Interest Rates Decrease by One Percentage Point | +0.1 to +0.5 | +0.2 to +0.6 |
Table 2.7 footnotes:
Source: Ontario Ministry of Finance.
Economic Outlook Scenarios
To provide more transparency about the province’s economic outlook amid the elevated degree of economic uncertainty, the Ontario Ministry of Finance has developed Faster Growth and Slower Growth scenarios that the economy could take over the next few years. These alternative scenarios should not be considered the best case or the worst case, but reasonable possible outcomes in this period of uncertainty.
| 2024p | 2025p | 2026p | 2027p | |
|---|---|---|---|---|
| Faster Growth Scenario | 1.5 | 3.3 | 2.6 | 2.6 |
| Planning Projection | 0.9 | 1.7 | 2.3 | 2.3 |
| Slower Growth Scenario | 0.5 | 0.3 | 2.2 | 2.2 |
Table 2.8 footnotes:
p = Ontario Ministry of Finance planning projection based on external sources as of September 19, 2024, and alternative scenarios.
Source: Ontario Ministry of Finance.
| 2024p | 2025p | 2026p | 2027p | |
|---|---|---|---|---|
| Faster Growth Scenario | 4.7 | 6.3 | 4.9 | 4.9 |
| Planning Projection | 3.8 | 3.9 | 4.4 | 4.4 |
| Slower Growth Scenario | 3.1 | 1.7 | 4.1 | 4.1 |
Table 2.9 footnotes:
p = Ontario Ministry of Finance planning projection based on external sources as of September 19, 2024, and alternative scenarios.
Source: Ontario Ministry of Finance.
By 2027, the level of real GDP in the Faster Growth scenario is 2.8 per cent higher than in the Planning Projection, while in the Slower Growth scenario, the level of real GDP is 2.0 per cent lower. The nominal GDP scenarios show a wider range of outcomes over the next several years compared to the real GDP scenarios, due largely to near‐term uncertainty around GDP inflation. By 2027, the level of nominal GDP in the Faster Growth scenario is 4.2 per cent higher than in the Planning Projection, while in the Slower Growth scenario, the level of nominal GDP is 3.3 per cent lower.
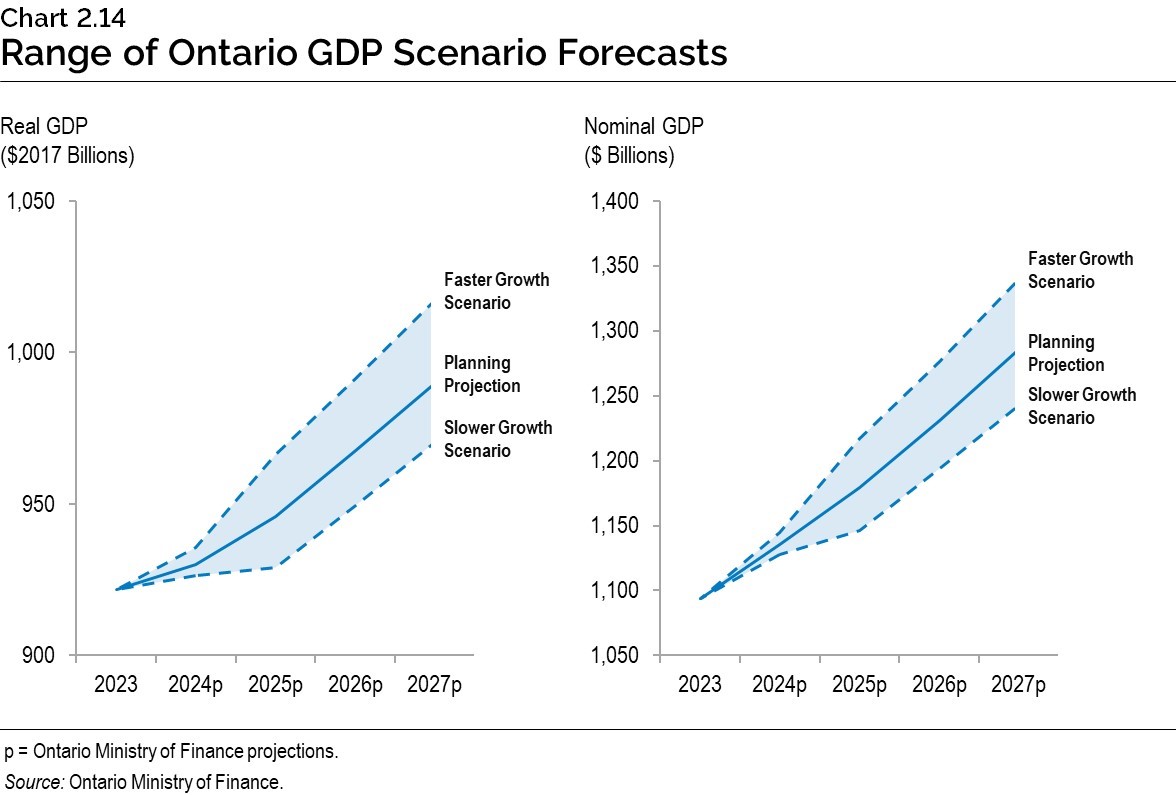
Chart Descriptions
Chart 2.1: Ontario Real GDP Growth Outpaces Canada
This bar chart illustrates annual real gross domestic product growth from 2018 to 2023 for Ontario and Canada. Real gross domestic product growth for Ontario is as follows: 3.3 per cent in 2018; 2.1 per cent in 2019; −4.5 per cent in 2020; 5.4 per cent in 2021; 3.9 per cent in 2022 and 1.4 per cent in 2023. Real gross domestic product growth for Canada is as follows: 2.7 per cent in 2018; 1.9 per cent in 2019; −5.0 per cent in 2020; 5.3 per cent in 2021; 3.8 per cent in 2022 and 1.2 per cent in 2023.
Sources: Ontario Ministry of Finance and Statistics Canada.
Chart 2.2: Ontario Unemployment Rate
This line chart illustrates Ontario’s unemployment rate from January 1976 to September 2024. Ontario’s unemployment rate is represented as the solid blue line, and the historical average unemployment rate for Ontario is represented as the dashed gray line. The historical average unemployment rate, which is the average of all observations dating back to January 1976, was 7.4 per cent as of September 2024. The Ontario unemployment rate was 6.9 per cent as of September 2024.
Other labels on this chart are as follows, starting from the leftmost label: all-time record low unemployment rate of 4.7 per cent, recorded in both June and October of 1989; the peak unemployment rate during the 2008–2009 Global Financial Recession, which reached 9.6 per cent in June 2009; and the peak unemployment rate during the COVID-19 pandemic of 14.0 per cent, which was also the all-time record high, in May 2020.
Source: Statistics Canada.
Chart 2.3: Ontario Population and Employment Growth
This line chart illustrates population and employment growth for Ontario between 2014Q1 to 2024Q3. Ontario’s population growth is represented as the gray line and employment growth is represented as the solid blue line. Ontario’s population and employment growth are both indexed to the 2014Q1 level. While the change in employment is more variable over the time frame, including a significant decline during the COVID-19 pandemic, employment and population have grown at approximately the same rate in Ontario over the 10-year period.
Source: Statistics Canada.
Chart 2.4: Ontario Consumer Price Inflation Moderates
This line chart shows Ontario’s Consumer Price Index (CPI) inflation in year-over-year per cent for all items (shown as a solid blue line) and all items excluding food and energy (shown as a solid gray line) from January 2019 to September 2024.
In September 2024, Ontario CPI inflation for all items was 1.9 per cent year-over-year, while CPI inflation for all items excluding food and energy was 2.4 per cent, year-over-year. Ontario CPI inflation for all items in September was six percentage points lower than the 7.9 per cent rate in June 2022.
Source: Statistics Canada.
Chart 2.5: Ontario Nominal GDP Growth Projected to Strengthen
The bar chart shows Ontario real and nominal GDP growth rates from 2023 to 2027. The difference between the nominal growth rate and real growth rate is the GDP inflation for each year.
Ontario nominal GDP growth was 4.3 per cent in 2023, is projected to be 3.8 per cent in 2024, 3.9 per cent in 2025, and 4.4 per cent in both 2026 and 2027.
Ontario real GDP growth was 1.4 per cent in 2023, is projected to be 0.9 per cent in 2024, 1.7 per cent in 2025, and 2.3 per cent in both 2026 and 2027.
Sources: Statistics Canada and Ontario Ministry of Finance.
Chart 2.6: Global Real GDP Growth Projections
This bar chart shows projected real GDP growth in per cent for 2024 and 2025 for the world economy, the United States, the Euro area and China. Real GDP growth in 2024 and 2025 is projected to be 3.2 per cent and 3.3 per cent for the world economy; 2.7 per cent and 2.0 per cent in the United States; 0.9 per cent and 1.5 per cent in the Euro area; and 5.0 per cent and 4.5 per cent in China.
Sources: International Monetary Fund (July 2024) and Blue Chip Economic Indicators (October 2024).
Chart 2.7: Policy Interest Rates, Selected Economies
This line chart shows monthly series for central bank policy interest rates for the U.K., U.S., Canada and the Euro area from January 2022 to September 2024. Following a period of high policy interest rates, these major central banks have started to lower their rates as elevated price inflation has continued to moderate. As of September 2024, the policy rates are U.K.: 5.00 per cent; U.S.: 4.88 per cent; Canada: 4.25 per cent; and Euro area: 3.50 per cent.
Sources: Bank of Canada, U.S. Federal Reserve, Bank of England, and European Central Bank.
Chart 2.8: Share of Ontario Merchandise Exports by Destination
This donut chart shows the share of Ontario merchandise exports by destination: United States 81.4 per cent, United Kingdom 4.0 per cent, Mexico 1.5 per cent, and rest of the world 13.1 per cent. The value of domestic exports in 2023 was $252.4 billion.
Source: Statistics Canada.
Chart 2.9: Bank of Canada Has Begun Easing Policy Interest Rate
This line chart shows the Bank of Canada target for the overnight rate in per cent from January 2015 to September 2024. The Bank of Canada raised its policy interest rate from 0.25 per cent in March 2022 to 5.00 per cent in July 2023, the fastest pace of policy rate increases since 1981. The policy rate was maintained at 5.00 per cent from July 2023 to May 2024. The Bank of Canada reduced its policy rate by 25 basis points in June 2024, and reduced it by a further 25 basis points in July and September 2024.
The gray area shows the range of the Bank of Canada’s nominal neutral policy rate, which was estimated to be between 3.0 and 4.0 per cent from January 2015 to March 2016, between 2.75 and 3.75 per cent from April 2016 to March 2017, between 2.5 and 3.5 per cent from April 2017 to March 2019, between 2.25 and 3.25 per cent from April 2019 to September 2020, between 1.75 and 2.75 per cent from October 2020 to March 2022, between 2.0 and 3.0 per cent from April 2022 to March 2024, and between 2.25 and 3.25 per cent from April 2024 to September 2024.
Source: Bank of Canada (as of September 2024).
Chart 2.10: Ontario Employment Growth Projected to Continue
This bar chart shows Ontario’s annual employment levels from 2018 to 2023 and expected employment levels from 2024 to 2027. Annual employment level increased from 7,246 thousand in 2018 to 7,429 thousand in 2019. Employment level decreased to 7,026 thousand in 2020 and then increased to 7,393 thousand in 2021; 7,732 thousand in 2022; and 7,915 thousand in 2023. Employment is expected to rise to 8,026 thousand in 2024; 8,146 thousand in 2025; 8,260 thousand in 2026; and 8,359 thousand in 2027.
Sources: Statistics Canada and Ontario Ministry of Finance.
Chart 2.11: Compensation and Household Spending Growth to Continue
The bar chart shows growth in compensation of employees and nominal household spending from 2021 to 2023 and Ontario Ministry of Finance planning projections for 2024 to 2027.
Over the 2021 to 2023 period, growth in compensation of employees ranged from 6.9 per cent to 9.0 per cent. Compensation of employees is projected to grow 5.5 per cent in 2024, 4.8 per cent in 2025, 4.4 per cent in 2026 and 4.1 per cent in 2027.
Over the 2021 to 2023 period, growth in nominal household spending ranged from 5.3 per cent to 13.2 per cent. Nominal household spending is projected to grow 5.0 per cent in 2024, 4.2 per cent in 2025, 4.5 per cent in 2026 and 4.3 per cent in 2027.
Sources: Statistics Canada and Ontario Ministry of Finance.
Chart 2.12: Inflation Projected to Ease
This line chart shows annual Ontario Consumer Price Index (CPI) inflation from 2017 to 2023, as well as projected Ontario CPI inflation for 2024 through 2027. The Ontario Ministry of Finance’s planning projection is based on external sources as of September 19, 2024.
Ontario CPI inflation was near 2.0 per cent between 2017 and 2019, before slowing to 0.7 per cent in 2020. Inflation increased to 3.5 per cent in 2021 and 6.8 per cent in 2022, before easing to 3.8 per cent in 2023.
Ontario CPI inflation is projected to be 2.5 per cent in 2024, before slowing to 2.1 per cent in 2025. Inflation is projected to edge down to 2.0 per cent in 2026 and 2027. The shaded area on the chart shows the range of private-sector forecasts for Ontario CPI inflation for 2024 through 2027. Private-sector forecasts range from 2.4 per cent to 2.8 per cent in 2024. The range widens in 2025, before narrowing again in 2026 and 2027.
Sources: Statistics Canada, Ontario Ministry of Finance and Ontario Ministry of Finance Survey of Forecasters.
Chart 2.13: Housing Market Projected to Rebound in 2025 and Beyond
This bar chart shows 2024 Ontario Economic Outlook and Fiscal Review planning projections for growth in Ontario home resales and average home price.
Home resales are expected to grow 2.0 per cent in 2024 (vs. 4.0 per cent in the 2024 Budget), 13.4 per cent in 2025 (vs. 16.0 per cent), 5.5 per cent in 2026 (vs. 1.2 per cent), and 1.2 per cent in 2027 (same as in the 2024 Budget). Average home price is expected to grow 0.3 per cent in 2024 (vs. −0.2 per cent in the 2024 Budget), 4.7 per cent in 2025 (vs. 3.1 per cent), and 4.0 per cent each in years 2024 and 2025 (same as in the 2024 Budget).
Sources: Ontario Ministry of Finance Survey of Private-Sector Forecasters and calculations.
Chart 2.14: Range of Ontario GDP Scenario Forecasts
The line chart on the left shows Ontario real GDP in 2023 and the Ontario Ministry of Finance planning projection for real GDP for 2024 to 2027, in billions of 2017 dollars. Separate lines show the levels of real GDP in the Faster Growth and the Slower Growth scenarios for 2024 to 2027. Ontario real GDP was $922 billion in 2023. In the Planning Projection, Ontario real GDP is projected to rise from $930 billion in 2024 to $990 billion in 2027. In the Faster Growth scenario, Ontario real GDP is projected to rise from $935 billion in 2024 to $1,017 billion in 2027. In the Slower Growth scenario, Ontario real GDP is projected to rise from $926 billion in 2024 to $970 billion in 2027.
The line chart on the right shows Ontario nominal GDP in 2023 and the Ontario Ministry of Finance planning projection for nominal GDP for 2024 to 2027, in billions of dollars. Separate lines show the levels of nominal GDP in the Faster Growth and the Slower Growth scenarios for 2024 to 2027. Ontario nominal GDP was $1,093 billion in 2023. In the Planning Projection, Ontario nominal GDP is projected to rise from $1,135 billion in 2024 to $1,285 billion in 2027. In the Faster Growth scenario, Ontario nominal GDP is projected to rise from $1,145 billion in 2024 to $1,339 billion in 2027. In the Slower Growth scenario, Ontario nominal GDP is projected to rise from $1,127 billion in 2024 to $1,242 billion in 2027.
Source: Ontario Ministry of Finance.
Footnotes
[1] Bank of Canada, Monetary Policy Report (October 2023).
[2] Institute for Research on Public Policy, Redesigning Canadian Trade Policies for New Global Realities (Volume VI) (2016).
[3] The neutral policy interest rate is the interest rate consistent with the economy producing at its potential capacity when inflation is at the target rate.