Introduction
Ontario’s economy proved to be resilient in 2024, continuing to grow and add jobs as inflationary pressures eased throughout the year. In 2024, real gross domestic product (GDP) increased by 1.5 per cent and employment rose by 140,000 (+1.7 per cent). Although there were solid gains in 2024, the uncertain economic environment is expected to weigh on the economy over the projection period.
Ontario is among the Canadian provinces and territories most exposed to U.S. trade policy and related uncertainty, and its real and nominal GDP forecasts have therefore come down significantly. Real GDP is projected to rise by 0.8 per cent in 2025 and 1.0 per cent in 2026. For the purposes of prudent fiscal planning, these projections are set slightly below the average of private-sector forecasts.
| Item | 2024 | 2025p | 2026p | 2027p | 2028p |
|---|---|---|---|---|---|
| Real GDP Growth | 1.5 | 0.8 | 1.0 | 1.9 | 1.9 |
| Nominal GDP Growth | 5.2 | 3.1 | 3.0 | 4.0 | 4.0 |
| Employment Growth | 1.7 | 0.9 | 0.4 | 0.9 | 0.9 |
| (CPI) Inflation | 2.4 | 2.3 | 2.0 | 2.0 | 2.0 |
Table 2.1 footnotes:
p = Ontario Ministry of Finance planning projection based on external sources as of April 3, 2025.
Sources: Statistics Canada and Ontario Ministry of Finance.
Revisions to the Outlook Since the 2024 Budget
The outlook has been revised compared to the projections in the 2024 Budget. Key changes since the 2024 Budget include the following:
- Much stronger real and nominal GDP growth in 2024, alongside robust job creation;
- Slower real and nominal GDP growth over the forecast period, with weaker job market performance; and
- Stronger compensation of employees growth in 2024 but weaker for the remainder of the projection period.
| Item | 2024: 2024 Budget |
2024: 2025 Budget |
2025p: 2024 Budget |
2025p: 2025 Budget |
2026p: 2024 Budget |
2026p: 2025 Budget |
2027p: 2024 Budget |
2027p: 2025 Budget |
|---|---|---|---|---|---|---|---|---|
| Real Gross Domestic Product | 0.3 | 1.5 | 1.9 | 0.8 | 2.2 | 1.0 | 2.2 | 1.9 |
| Nominal Gross Domestic Product | 2.7 | 5.2 | 3.9 | 3.1 | 4.3 | 3.0 | 4.1 | 4.0 |
| Compensation of Employees | 4.3 | 5.7 | 4.4 | 3.7 | 4.1 | 3.2 | 4.1 | 3.6 |
| Net Operating Surplus — Corporations | (4.7) | (2.0) | 3.5 | (3.0) | 7.9 | 6.4 | 6.0 | 7.2 |
| Nominal Household Consumption | 3.5 | 4.9 | 4.1 | 3.5 | 4.3 | 3.1 | 4.2 | 3.7 |
| Other Economic Indicators — Employment | 0.8 | 1.7 | 1.7 | 0.9 | 1.4 | 0.4 | 1.4 | 0.9 |
| Other Economic Indicators — Job Creation (000s) | 63 | 140 | 136 | 73 | 114 | 33 | 115 | 74 |
| Other Economic Indicators — Unemployment Rate (Per Cent) | 6.7 | 7.0 | 6.6 | 7.6 | 6.4 | 7.3 | 6.2 | 6.6 |
| Other Economic Indicators — Consumer Price Index | 2.6 | 2.4 | 2.0 | 2.3 | 2.0 | 2.0 | 2.0 | 2.0 |
| Other Economic Indicators — Housing Starts (000s)1 | 87.9 | 74.6 | 92.3 | 71.8 | 94.4 | 74.8 | 95.8 | 82.5 |
| Other Economic Indicators — Home Resales | 4.0 | 3.0 | 16.0 | 5.3 | 1.2 | 12.7 | 1.2 | 4.6 |
| Other Economic Indicators — Home Resale Prices | (0.2) | (0.4) | 3.1 | (1.2) | 4.0 | 2.6 | 4.0 | 3.8 |
| Key External Variables — U.S. Real Gross Domestic Product | 2.1 | 2.8 | 1.7 | 1.4 | 2.1 | 1.4 | 1.9 | 2.0 |
| Key External Variables — WTI Crude Oil ($US per Barrel) | 79 | 77 | 78 | 69 | 77 | 69 | 78 | 74 |
| Key External Variables — Canadian Dollar (Cents US) | 74.6 | 73.0 | 77.6 | 69.2 | 78.2 | 71.2 | 77.0 | 73.0 |
| Key External Variables — Three-Month Treasury Bill Rate (Per Cent)2 | 4.4 | 4.3 | 3.0 | 2.4 | 2.6 | 2.3 | 2.6 | 2.4 |
| Key External Variables — 10-Year Government Bond Rate (Per Cent)3 | 3.2 | 3.4 | 3.1 | 3.1 | 3.3 | 3.2 | 3.5 | 3.4 |
Table 2.2 footnotes:
p = Ontario Ministry of Finance planning projection based on external sources as of April 3, 2025.
[1] Housing starts projection based on private-sector average as of April 3, 2025.
[2], [3] Government of Canada interest rates.
Sources: Statistics Canada; Canada Mortgage and Housing Corporation; Canadian Real Estate Association; Bank of Canada; United States Bureau of Economic Analysis; Blue Chip Economic Indicators (March and April 2025); U.S. Energy Information Administration; and Ontario Ministry of Finance.
Recent Economic Performance
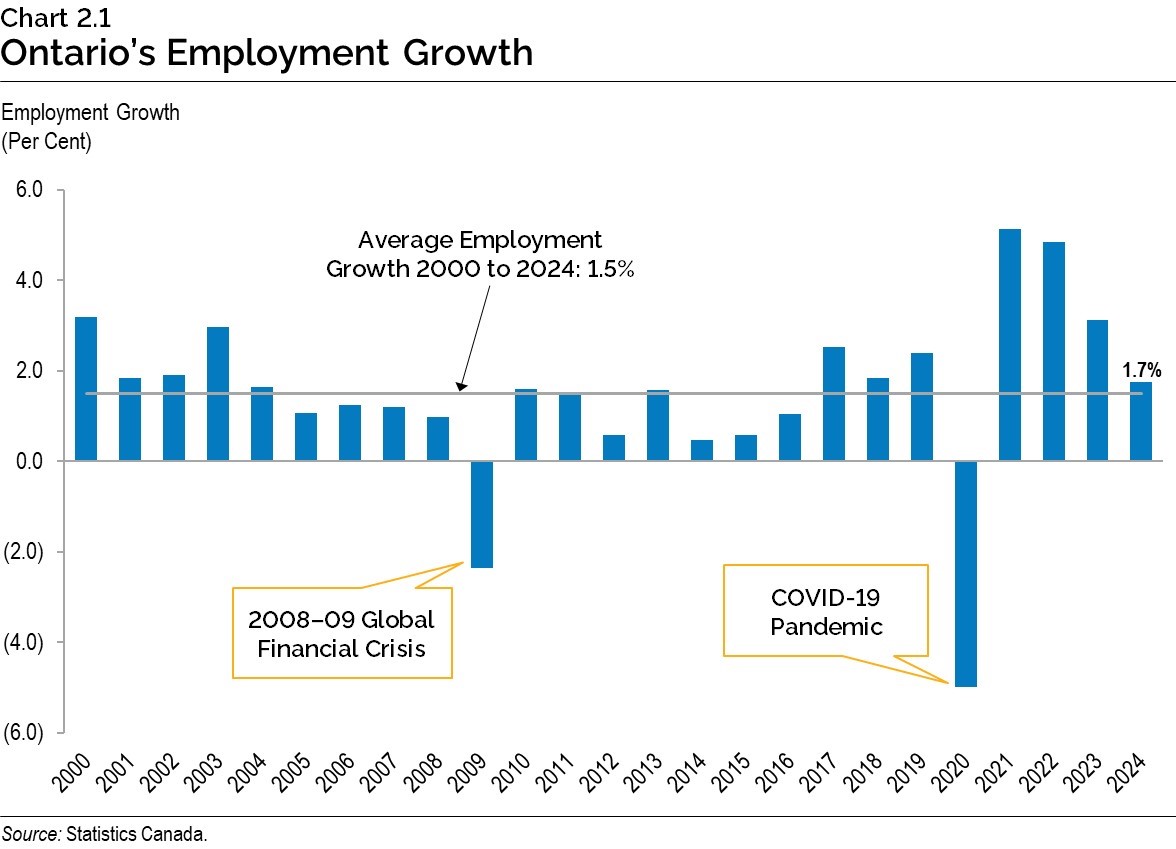
Ontario employment advanced faster than expected in 2024, increasing by 140,000 (+1.7 per cent). This added to three years of particularly strong employment gains between 2021 and 2023 as the economy rebounded from the impacts of the COVID-19 pandemic. The pace of employment growth in 2024 was in line with the longer-term average. Employment continued to rise in the first quarter of 2025, increasing by 59,200.
While employment has been on the rise, it has been outpaced by strong labour force growth of 3.2 per cent in 2024 and significant underlying population growth of 5.1 per cent over the past two years. As a result, Ontario’s unemployment rate has been trending upwards. In 2024, the unemployment rate averaged 7.0 per cent, up from 5.6 per cent in 2023.
Wage growth has remained strong, with average hourly wages outpacing inflation for the second consecutive year in 2024. Ontario average hourly wages were 5.2 per cent higher in 2024, compared to Consumer Price Index (CPI) inflation of 2.4 per cent. Ontario average real wages, adjusted for inflation, are well above pre-pandemic levels.
Real GDP Growth
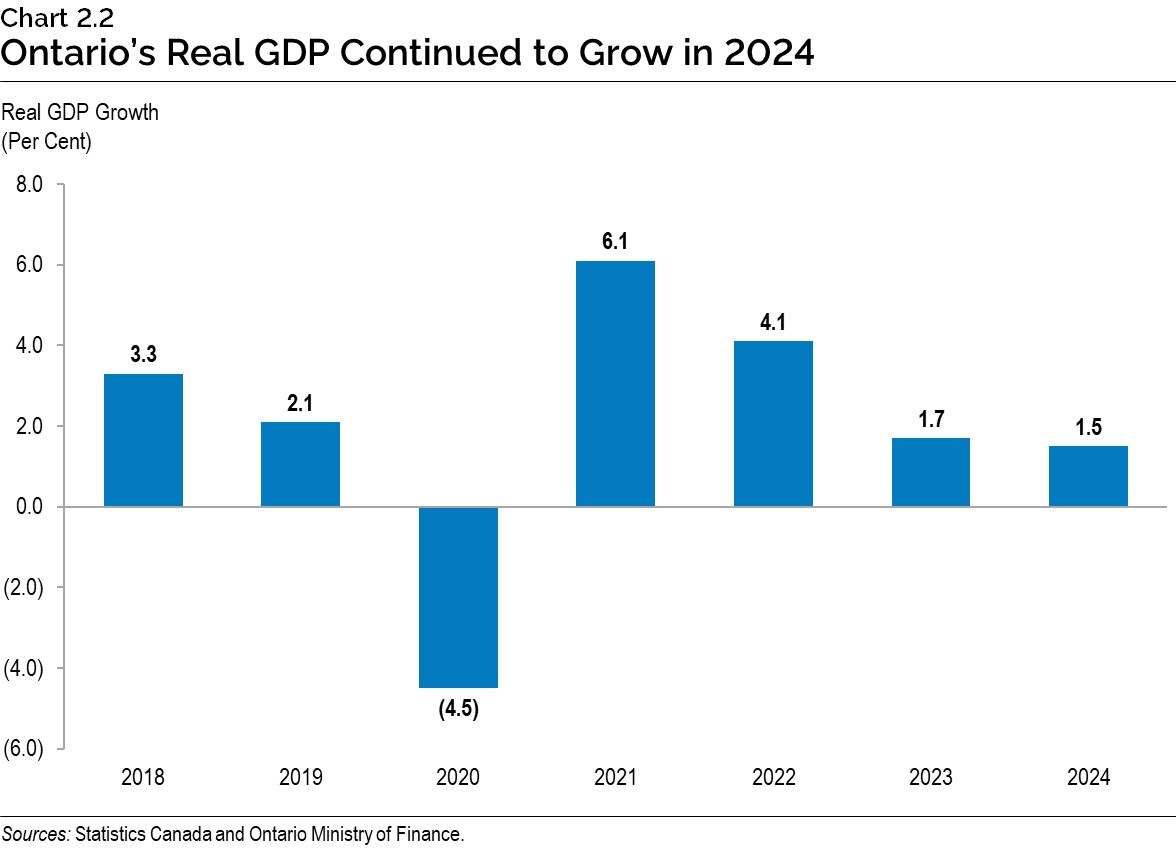
Ontario’s real GDP rose by 1.5 per cent in 2024, supported by a 2.1 per cent advance in household spending, largely due to growth in spending on services. Growth in more interest sensitive components, such as spending on durables goods (+0.1 per cent) and residential investment (−2.6 per cent), was muted by relatively high interest rates.
Consumer Price Inflation
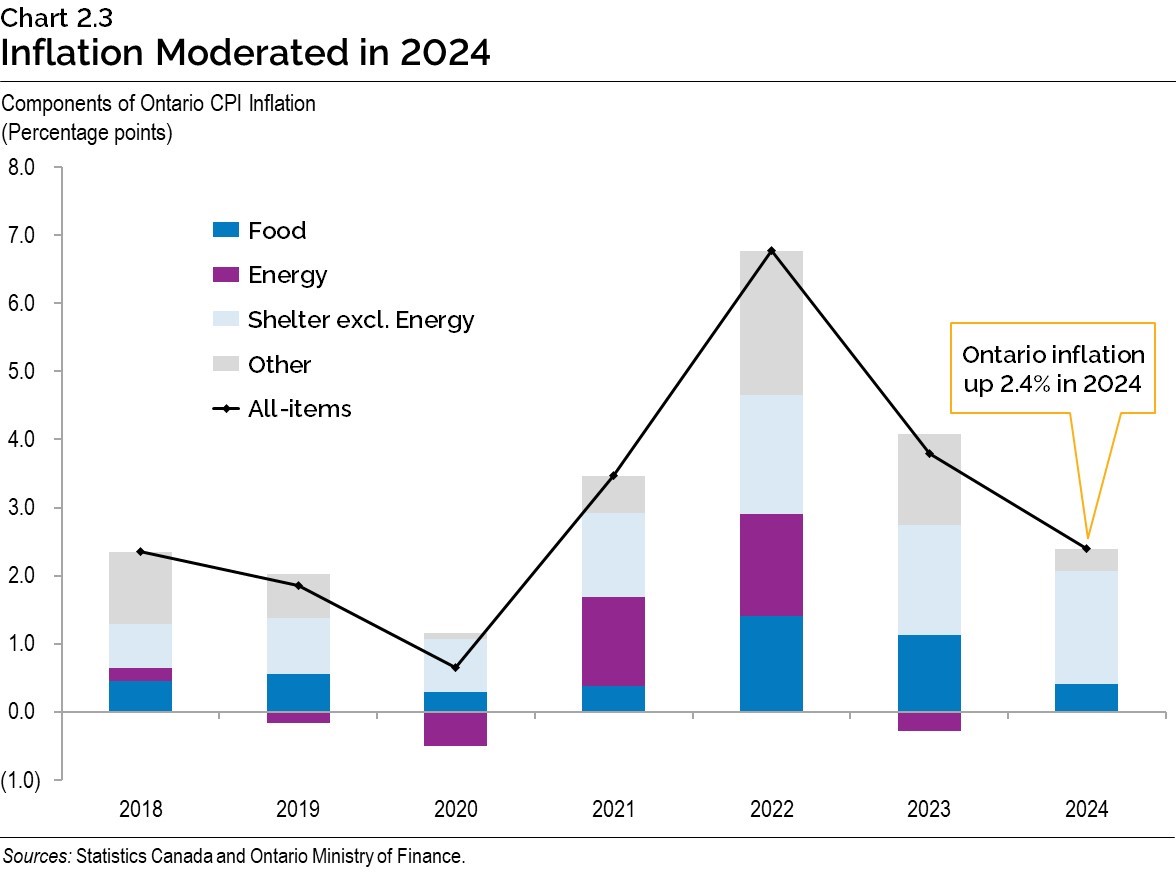
Ontario Consumer Price Index (CPI) inflation averaged 2.4 per cent in 2024, down from 3.8 per cent in 2023. Prices moderated across most CPI categories, with a notable decline in food inflation, which eased from 7.1 per cent in 2023 to 2.6 per cent in 2024. Energy prices edged up 0.1 per cent in 2024, following a 4.3 per cent decline in 2023. Shelter prices remained elevated in 2024, with higher prices for owned and rental accommodation.
Consumer and Business Confidence
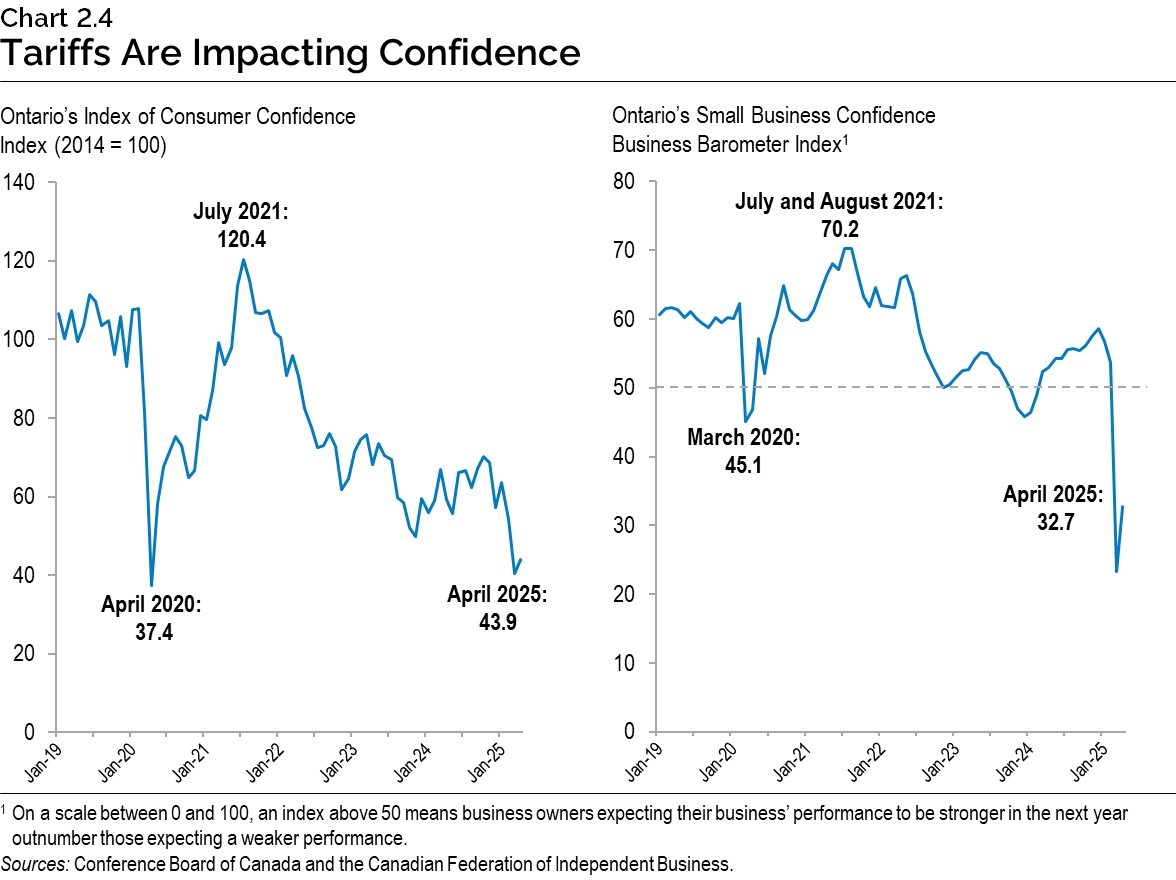
The impact of recent actions by the U.S. government to impose tariffs on certain Ontario exports has not yet been fully observed in recent economic data, which typically reflect conditions several months prior. However, forward-looking economic indicators such as confidence measures are showing the increasing concerns of both consumers and business owners. The Conference Board of Canada’s Index of Consumer Confidence for Ontario declined significantly in March 2025 before edging up to 43.9 in April, close to the lowest levels reached during the COVID‑19 pandemic. The Canadian Federation of Independent Business (CFIB) small business confidence index for Ontario remained weak in April 2025, despite rising from its record low in March 2025.
Economic Outlook
The Ontario Ministry of Finance regularly consults with private-sector economists while tracking their forecasts to inform the government’s planning assumptions.
Private-sector forecasters, on average, are projecting that Ontario’s real GDP will grow by 0.9 per cent in 2025, 1.1 per cent in 2026, and 2.0 per cent in 2027 and 2028.The Ontario Ministry of Finance’s real GDP projections are set slightly below the average of private-sector forecasts in each year for prudent planning purposes. Three external economic experts reviewed the Ontario Ministry of Finance’s economic planning assumptions and found them to be reasonable.1
| Item | 2025 | 2026 | 2027 | 2028 |
|---|---|---|---|---|
| BMO Capital Markets (March) | (0.2) | 0.2 | – | – |
| Central 1 Credit Union (April) | 0.8 | 1.5 | 1.7 | – |
| CIBC Capital Markets (March) | 0.9 | 1.7 | – | – |
| The Conference Board of Canada (April) | 0.7 | 2.0 | 2.3 | 2.4 |
| Desjardins Group (March) | 0.7 | 0.8 | 2.0 | – |
| Laurentian Bank Securities (April) | 1.0 | 1.2 | – | – |
| National Bank of Canada (March) | 1.0 | 0.8 | – | – |
| Quantitative Economic Decisions, Inc. (March) | 0.9 | 0.9 | 2.4 | 2.2 |
| Royal Bank of Canada (March) | 1.2 | 1.2 | – | – |
| Scotiabank (March) | 1.6 | 1.3 | – | – |
| Stokes Economics (April) | 0.8 | 1.8 | 2.1 | 1.8 |
| TD Bank Group (March) | 1.0 | 0.9 | – | – |
| University of Toronto (April) | 1.0 | 0.3 | 1.4 | 1.7 |
| Private-Sector Survey Average | 0.9 | 1.1 | 2.0 | 2.0 |
| Ontario’s Planning Assumption | 0.8 | 1.0 | 1.9 | 1.9 |
Table 2.3 footnotes:
Sources: Ontario Ministry of Finance Survey of Forecasters (April 3, 2025) and Ontario Ministry of Finance.
Private-sector forecasters, on average, are projecting that Ontario’s nominal GDP will grow by 3.2 per cent in 2025, 3.1 per cent in 2026, and 4.1 per cent in 2027 and 2028. The Ontario Ministry of Finance’s nominal GDP projections are set slightly below the average of private‑sector forecasts in each year for prudent planning purposes.
| Item | 2025 | 2026 | 2027 | 2028 |
|---|---|---|---|---|
| BMO Capital Markets (March) | 2.1 | 2.2 | – | – |
| Central 1 Credit Union (April) | 3.5 | 4.0 | 4.0 | – |
| CIBC Capital Markets (March) | 3.8 | 3.6 | – | – |
| The Conference Board of Canada (April) | 2.0 | 4.4 | 4.5 | 4.5 |
| Desjardins Group (March) | 3.4 | 2.6 | 3.8 | – |
| Laurentian Bank Securities (April) | 3.6 | 3.5 | – | – |
| National Bank of Canada (March) | 3.5 | 2.6 | – | – |
| Quantitative Economic Decisions, Inc. (March) | 3.3 | 2.6 | 4.5 | 4.3 |
| Royal Bank of Canada (March) | 3.8 | 3.0 | – | – |
| Scotiabank (March) | 3.5 | 3.4 | – | – |
| Stokes Economics (April) | 2.5 | 4.1 | 4.4 | 3.9 |
| TD Bank Group (March) | 3.8 | 2.6 | – | – |
| University of Toronto (April) | 3.1 | 2.1 | 3.5 | 3.8 |
| Private-Sector Survey Average | 3.2 | 3.1 | 4.1 | 4.1 |
| Ontario’s Planning Assumption | 3.1 | 3.0 | 4.0 | 4.0 |
Table 2.4 footnotes:
Sources: Ontario Ministry of Finance Survey of Forecasters (April 3, 2025) and Ontario Ministry of Finance.
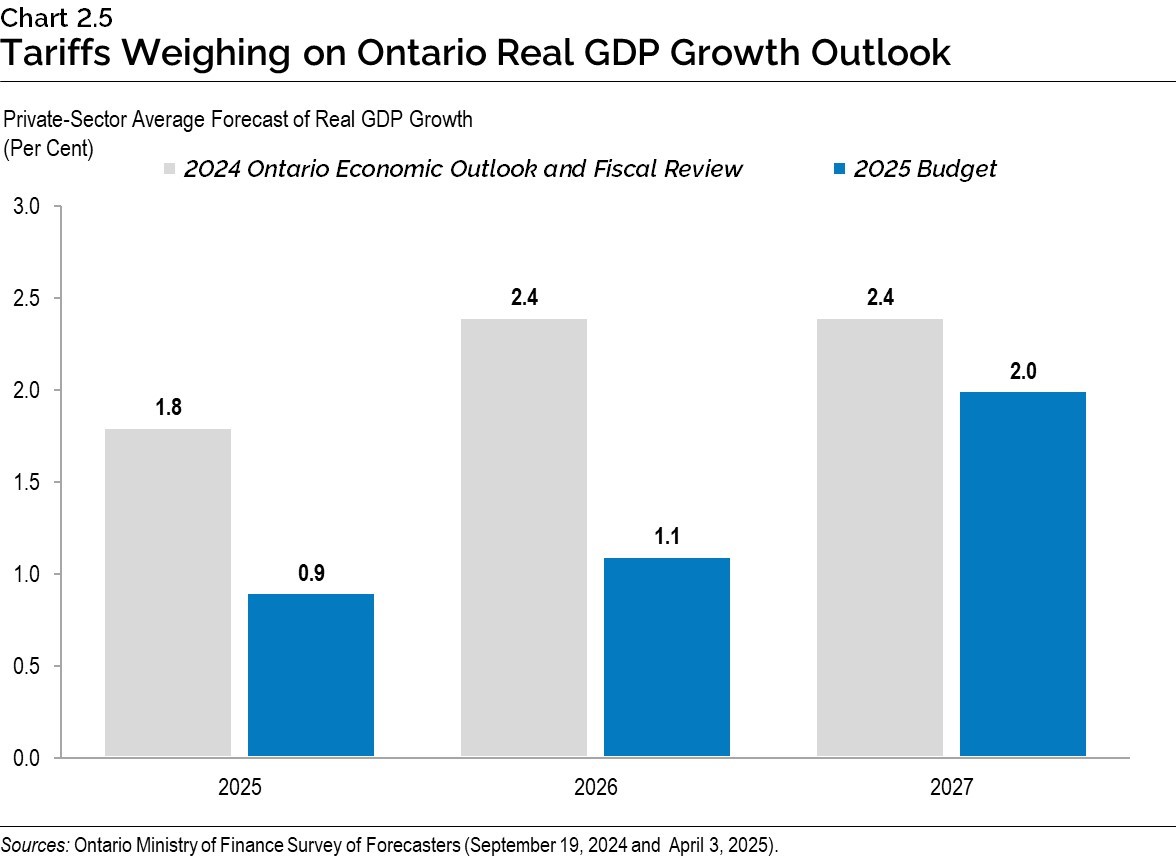
The U.S. tariffs as well as heightened uncertainty around trade policy have contributed to a significant deterioration in the private-sector economic outlook. Compared to the 2024 Ontario Economic Outlook and Fiscal Review, the private-sector average of real GDP growth forecasts has declined from 1.8 per cent to 0.9 per cent in 2025, from 2.4 per cent to 1.1 per cent in 2026, and from 2.4 per cent to 2.0 per cent in 2027.
While tariffs have contributed significantly to the deterioration in private-sector forecasts since the fall, there are a wide range of views and assumptions incorporated in private-sector economic forecasts. At the higher end of the private-sector range, forecasts have generally incorporated fewer tariff impacts over a shorter period of time. At the lower end of the private-sector range, forecasts have generally incorporated more significant tariffs and over a longer period. The uncertainty around U.S. trade policy is reflected in the historically wide range of Ontario real GDP forecasts.
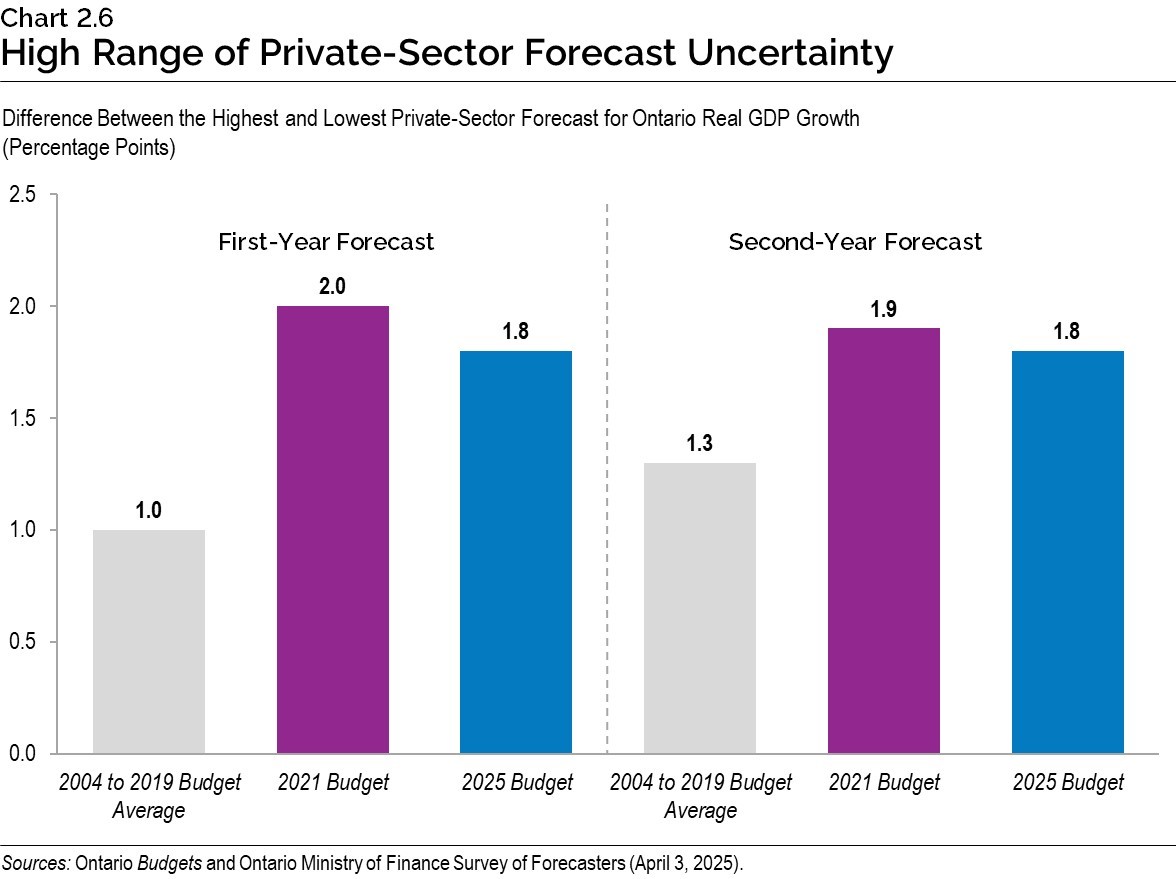
For 2025, Ontario real GDP growth forecasts range from −0.2 per cent to 1.6 per cent, and for 2026, forecasts range from 0.2 per cent to 2.0 per cent. The range of real GDP forecasts for 2025 is almost double the average range for the first year projected in Budgets from 2004 to 2019. The range around real GDP forecasts for 2026 is higher than the average range for the second year projected in Budgets from 2004 to 2019. The uncertainty represented by the 2025 Budget forecast range is only slightly lower than the range of forecasts published in the 2021 Budget, a time of unprecedented uncertainty due to the global pandemic.
Global Economic Environment
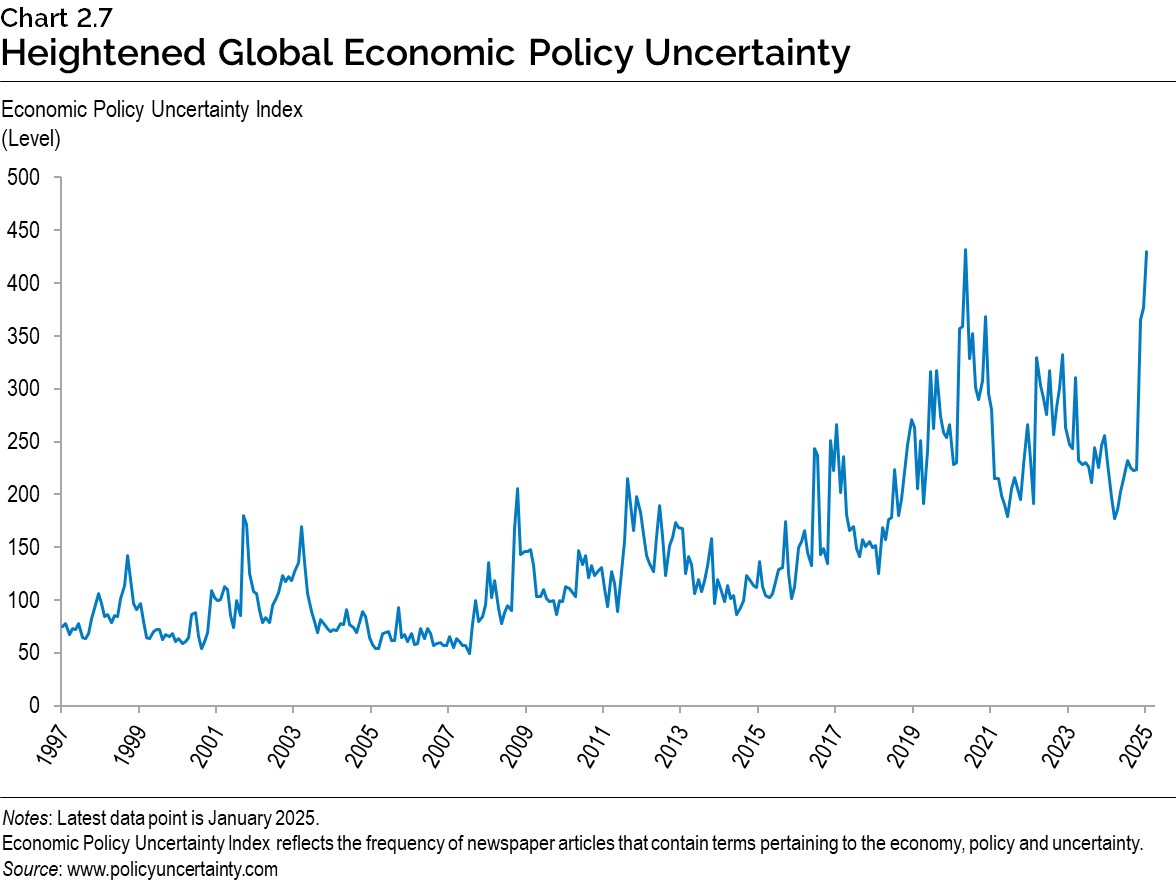
Increased trade tensions emanating from the United States are leading to greater uncertainty and contributing to a weaker global economic outlook. The rapidly evolving trade policy landscape is weighing on businesses and consumers across the world. Trade tensions have also contributed to global economic policy uncertainty, which is at its highest level since 1997.
On April 2, 2025, the Trump administration announced “reciprocal” tariffs on a large set of countries. Subsequently, on April 9, 2025, the administration announced that it was pausing these tariffs for 90 days on all affected countries with the exception of China, where the tariffs were being raised to significantly higher levels. These announcements as well as continued, unexpected policy shifts have resulted in significant financial market volatility and are expected to negatively impact the economy.
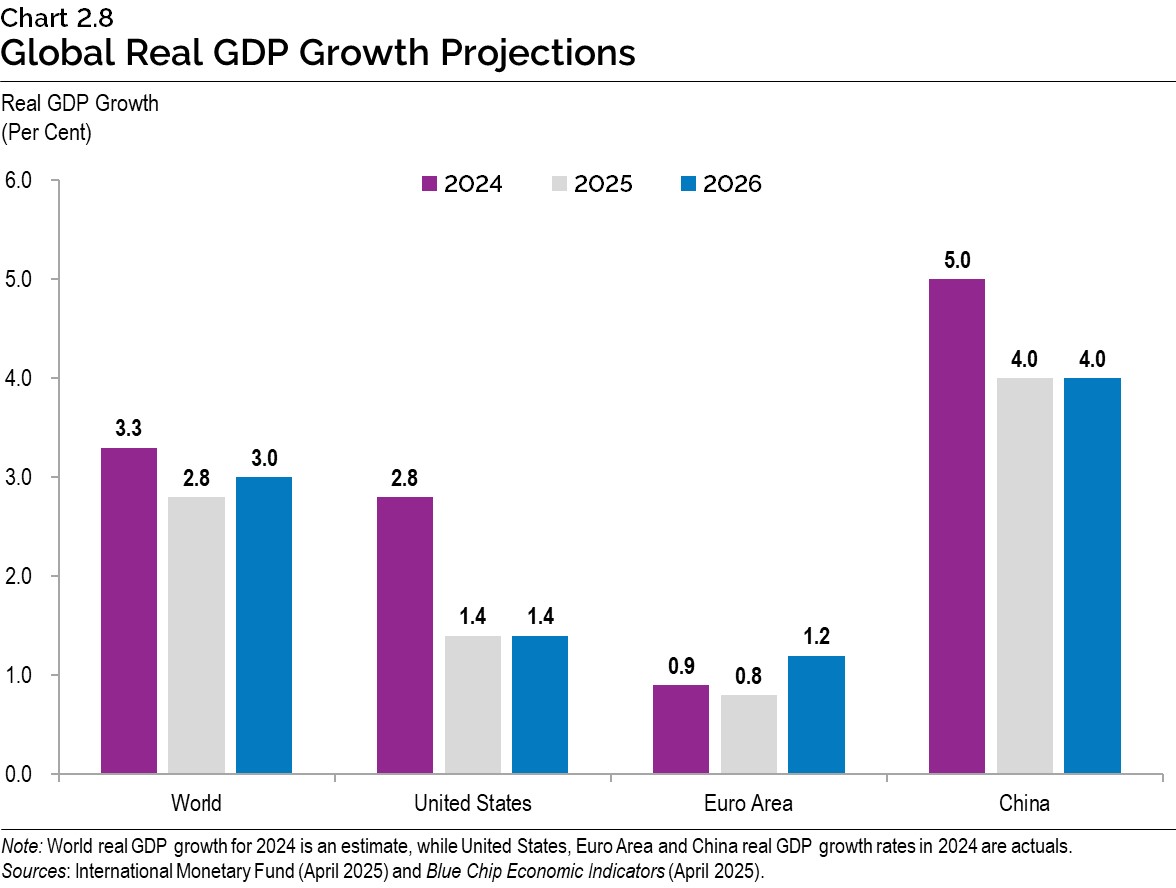
According to the International Monetary Fund (IMF)’s World Economic Outlook (WEO) released in April 2025, “the swift escalation of trade tensions and extremely high levels of policy uncertainty are expected to have a significant impact on global economic activity.” As part of IMF’s “reference forecast” that incorporated information as of April 4, global real GDP growth is projected to decline from an estimated 3.3 per cent in 2024 to 2.8 per cent in 2025 before recovering to 3.0 per cent in 2026. These projections are lower than in the IMF’s January projection, by 0.5 percentage point for 2025 and 0.3 percentage point for 2026, with downward revisions for nearly all countries. The downgrades reflect in large part the direct effects of the new trade measures and their indirect effects through trade linkage spillovers, heightened uncertainty, and deteriorating sentiment.
According to Blue Chip Economic Indicators released in April 2025, U.S. real GDP growth is projected to slow significantly from 2.8 per cent in 2024 to 1.4 per cent in 2025 and 1.4 per cent in 2026. The IMF projects that Euro area real GDP growth will decline from 0.9 per cent in 2024 to 0.8 per cent in 2025 before rising to 1.2 per cent in 2026. China’s real GDP growth is expected to slow from 5.0 per cent in 2024 to 4.0 per cent in 2025 and 4.0 per cent in 2026.
Prior to the threat of protectionist measures and tariffs by the United States, most major central banks had been easing monetary policy as price inflation started to moderate. However, more recently, the U.S. Federal Reserve has slowed down its policy interest rate reductions in light of continued robust economic growth and the potential impact of tariffs on domestic inflation. At the same time, other key central banks are expected to face a dilemma moving forward between lowering their policy interest rates to stimulate their economies impacted by tariffs or undertake restrictive monetary policy in case inflationary pressures mount, resulting from retaliatory tariffs.
Financial Markets and Other External Factors
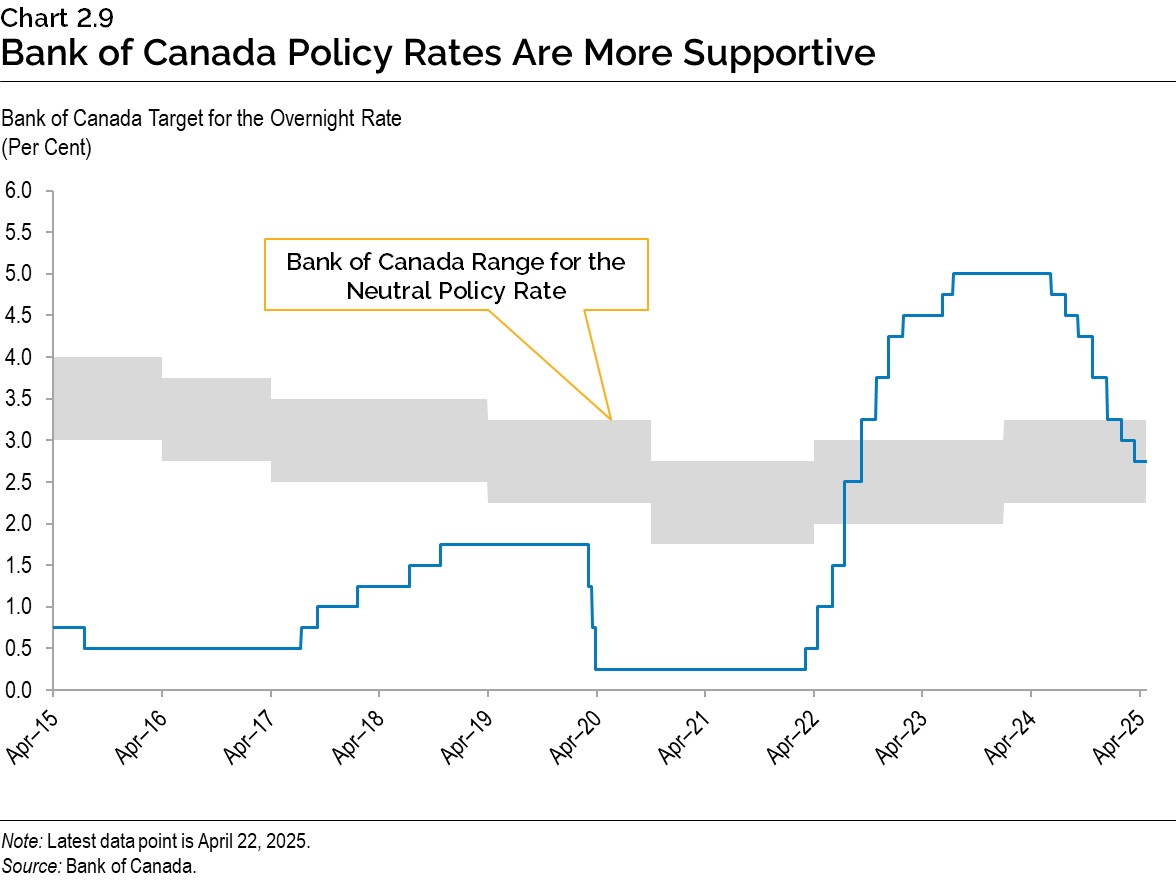
After maintaining its policy interest rate at a two-decade high of 5.0 per cent for almost a year, the Bank of Canada started easing monetary policy in June 2024. Between June 2024 and March 2025, the Bank reduced its key policy rate by a total of 225 basis points to 2.75 per cent as CPI inflation has returned close to the two per cent target, helped by the moderation of earlier inflationary shocks to global supply chains. This is within the Bank’s “neutral range” of 2.25 per cent and 3.25 per cent, a range that indicates the Bank’s monetary policy is not restricting economic growth. In the latest interest rate announcement in April, the Bank noted that the shifts of U.S. trade policy are creating significant uncertainty to the economic outlook and likely to heighten price pressures.
The Government of Canada three‐month treasury bill rate averaged 4.3 per cent in 2024 and is expected to decline to 2.4 per cent in 2025 and to 2.3 per cent in 2026, before averaging 2.5 per cent in 2027 and 2028. The Government of Canada 10‐year bond rate averaged 3.4 per cent in 2024 and is expected to edge down to 3.1 per cent in 2025 and then rise to 3.2 per cent in 2026, before averaging 3.5 per cent in 2027 and 2028.
Trade Uncertainty Impacts the Canadian Dollar and Financial Markets
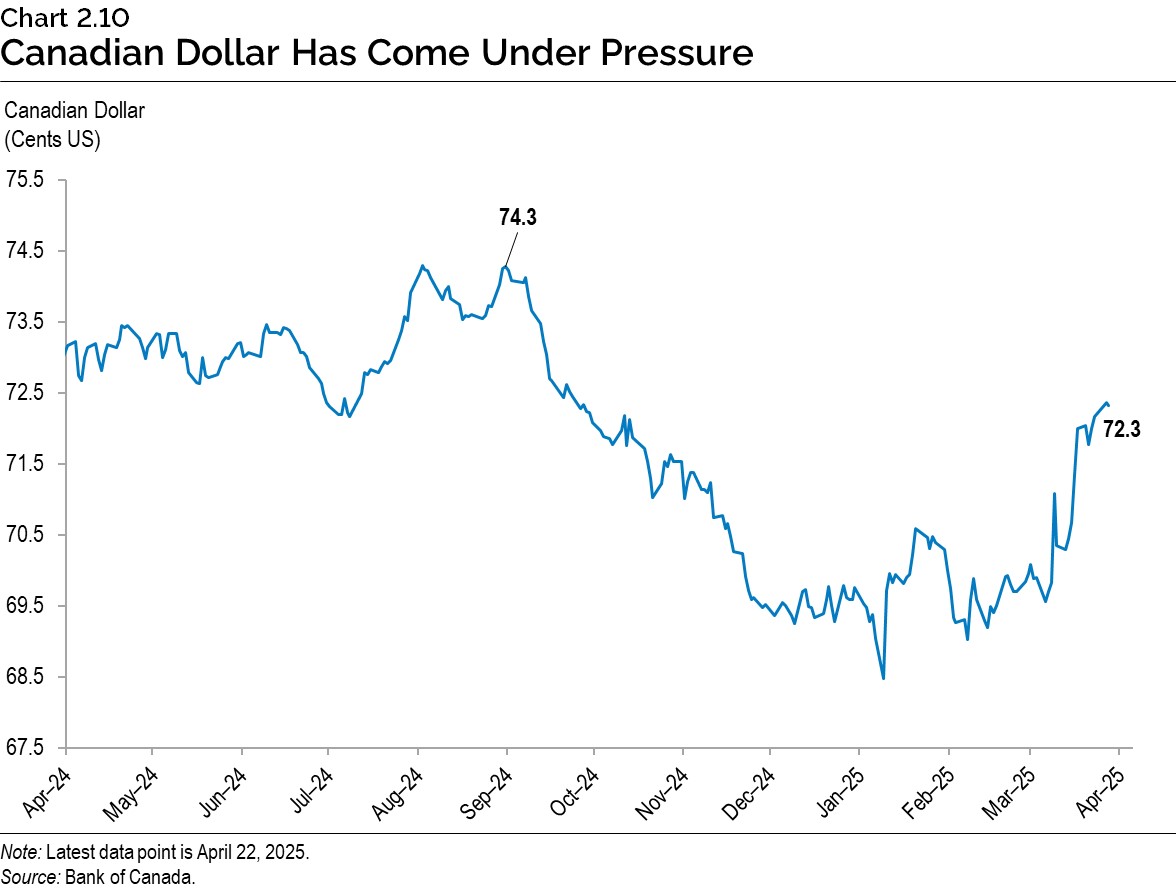
For the first half of 2024, the Canadian dollar was relatively stable, trading between 72.4 cents US and 75.1 cents US. However, the Canadian dollar started to decline in fall 2024, eventually reaching a two‑decade low of 68.8 cents US in January 2025. This weakness reflects, in part, both widening policy divergence between the Bank of Canada and the U.S. Federal Reserve, as well as escalating trade tensions and tariffs. The Canadian dollar has remained volatile so far in 2025, reflecting unpredictable U.S. trade policy announcements and the associated climate of uncertainty.
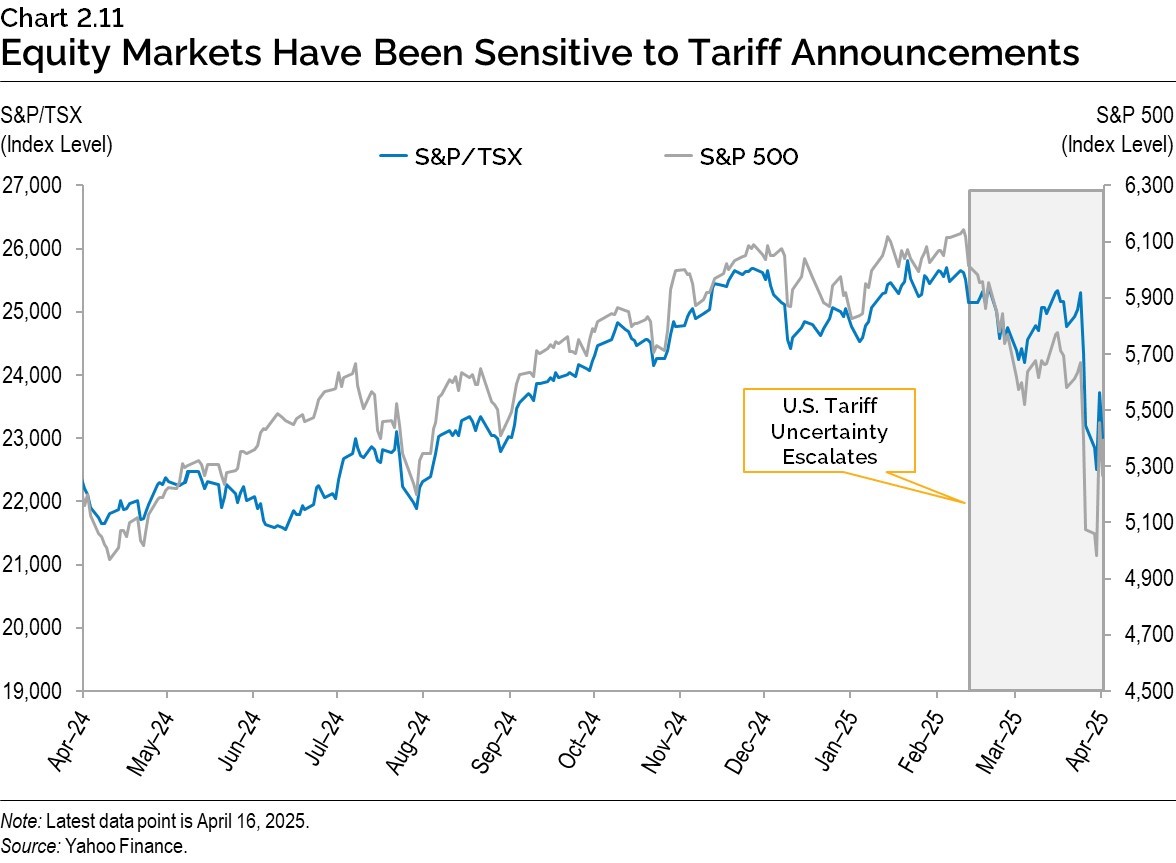
Negative financial market sentiment due to unpredictable trade policy shifts since late January have contributed to declines in North American equity markets. Both the S&P/TSX Composite Index and the S&P 500 Index have declined, and the Canadian market has performed better than its U.S. counterpart, reflecting the potential impact of trade policies on large U.S.-based multinational firms. Although market movements have been sensitive to tariff announcements, the eventual magnitude of impacts will depend on how long the tariffs are maintained, which areas are targeted, and the ability of affected economic sectors to adjust their supply chains.
Energy prices are expected to rise modestly over the projection horizon. The West Texas Intermediate (WTI) crude oil price remained relatively stable at US$77 per barrel in 2024, down from US$78 per barrel in 2023. The WTI crude oil price is expected to drop to US$69 per barrel in 2025 and 2026 before increasing to an average of US$75 per barrel in 2027 and 2028. The Canadian dollar is projected to decline from 73.0 cents US in 2024 to 69.2 cents US in 2025, before appreciating gradually over the projection period to 74.1 cents US in 2028.
| Item | 2024 | 2025p | 2026p | 2027p | 2028p |
|---|---|---|---|---|---|
| World Real GDP Growth (Per Cent) | 3.3 | 2.8 | 3.0 | 3.2 | 3.2 |
| U.S. Real GDP Growth (Per Cent) | 2.8 | 1.4 | 1.4 | 2.0 | 2.0 |
| West Texas Intermediate (WTI) Crude Oil ($US per Barrel) | 77 | 69 | 69 | 74 | 75 |
| Canadian Dollar (Cents US) | 73.0 | 69.2 | 71.2 | 73.0 | 74.1 |
| Three-Month Treasury Bill Rate1 (Per Cent) | 4.3 | 2.4 | 2.3 | 2.4 | 2.6 |
| 10-Year Government Bond Rate2 (Per Cent) | 3.4 | 3.1 | 3.2 | 3.4 | 3.5 |
Table 2.5 footnotes:
p = Ontario Ministry of Finance planning projection based on external sources.
[1], [2] Government of Canada interest rates.
Sources: International Monetary Fund World Economic Outlook (April 2025); U.S. Bureau of Economic Analysis; U.S. Energy Information Administration; Bank of Canada; Blue Chip Economic Indicators (March and April 2025); and Ontario Ministry of Finance Survey of Forecasters (April 3, 2025).
Details of Ontario’s Economic Outlook
The Ontario Ministry of Finance projects real GDP to rise by 0.8 per cent in 2025, 1.0 per cent in 2026, and 1.9 per cent in 2027 and 2028. Nominal GDP is projected to grow by 3.1 per cent in 2025, 3.0 per cent in 2026, and 4.0 per cent in 2027 and 2028.
| Item | 2024 | 2025p | 2026p | 2027p | 2028p |
|---|---|---|---|---|---|
| Real Gross Domestic Product | 1.5 | 0.8 | 1.0 | 1.9 | 1.9 |
| Nominal Gross Domestic Product | 5.2 | 3.1 | 3.0 | 4.0 | 4.0 |
| Compensation of Employees | 5.7 | 3.7 | 3.2 | 3.6 | 3.8 |
| Net Operating Surplus — Corporations | (2.0) | (3.0) | 6.4 | 7.2 | 5.2 |
| Nominal Household Consumption | 4.9 | 3.5 | 3.1 | 3.7 | 3.8 |
| Other Economic Indicators — Employment | 1.7 | 0.9 | 0.4 | 0.9 | 0.9 |
| Other Economic Indicators — Job Creation (000s) | 140 | 73 | 33 | 74 | 75 |
| Other Economic Indicators — Unemployment Rate (Per Cent) | 7.0 | 7.6 | 7.3 | 6.6 | 6.2 |
| Other Economic Indicators — Consumer Price Index | 2.4 | 2.3 | 2.0 | 2.0 | 2.0 |
| Other Economic Indicators — Housing Starts (000s)1 | 74.6 | 71.8 | 74.8 | 82.5 | 85.9 |
| Other Economic Indicators — Home Resales | 3.0 | 5.3 | 12.7 | 4.6 | 1.5 |
| Other Economic Indicators — Home Resale Prices | (0.4) | (1.2) | 2.6 | 3.8 | 4.0 |
| Key External Variables — U.S. Real Gross Domestic Product | 2.8 | 1.4 | 1.4 | 2.0 | 2.0 |
| Key External Variables — WTI Crude Oil ($US per Barrel) | 77 | 69 | 69 | 74 | 75 |
| Key External Variables — Canadian Dollar (Cents US) | 73.0 | 69.2 | 71.2 | 73.0 | 74.1 |
| Key External Variables — Three-Month Treasury Bill Rate (Per Cent)2 | 4.3 | 2.4 | 2.3 | 2.4 | 2.6 |
| Key External Variables — 10-Year Government Bond Rate (Per Cent)3 | 3.4 | 3.1 | 3.2 | 3.4 | 3.5 |
Table 2.6 footnotes:
p = Ontario Ministry of Finance planning projection based on external sources as of April 3, 2025.
[1] Housing starts projection based on private-sector average as of April 3, 2025.
[2], [3] Government of Canada interest rates.
Sources: Statistics Canada; Canada Mortgage and Housing Corporation; Canadian Real Estate Association; Bank of Canada; United States Bureau of Economic Analysis; Blue Chip Economic Indicators (March and April 2025); U.S. Energy Information Administration; and Ontario Ministry of Finance.
Employment
Increased uncertainty and reduced business confidence from trade tensions with the United States are expected to weaken business activity and hiring in Ontario. In addition, slowing population growth due to federal immigration plan changes will moderate employment gains.
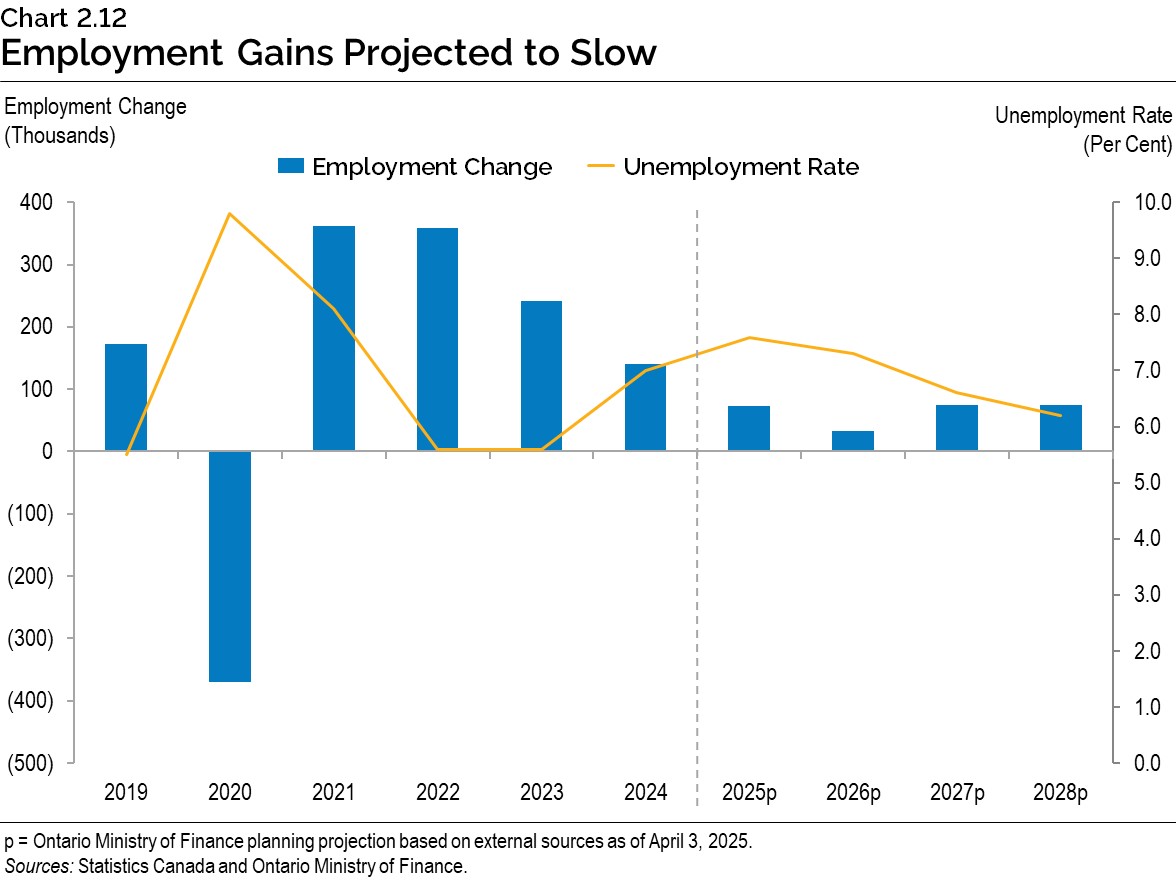
Ontario employment increased by 140,000 or 1.7 per cent in 2024. Although there were solid employment gains early in 2025, the uncertain economic environment is projected to weigh on employment growth over the rest of the year. The annual gains for 2025 are projected to slow to 73,000 or 0.9 per cent. Population and labour force growth are projected to continue to outpace employment growth in 2025, raising the unemployment rate to 7.6 per cent.
Impacts from the trade conflict and economic uncertainty are expected to continue to weigh on employment in 2026, with growth projected to slow further to 0.4 per cent. These impacts are expected to wane in 2027 and 2028, resulting in employment growth improving to 0.9 per cent in both years. As population growth slows significantly over the 2026 to 2028 period and economic growth picks up, employment growth is projected to outpace labour force growth, resulting in a gradual decline in the unemployment rate to 6.2 per cent in 2028.
Household Spending
In 2024, the solid employment growth along with strong wage gains resulted in compensation of employees increasing by 5.7 per cent. As employment gains and wage growth soften amid weaker labour demand, compensation of employees is projected to ease to 3.7 per cent in 2025 and 3.2 per cent in 2026. Growth in compensation of employees is projected to then rise to 3.7 per cent average annual growth over 2027 and 2028.
Households are increasingly concerned about trade tensions and the impacts on the labour market and inflation, leading to declines in consumer confidence. The uncertain environment and moderating compensation growth, along with slowing population growth, are expected to weigh on household spending growth. However, lower interest rates are expected to provide some support to spending.
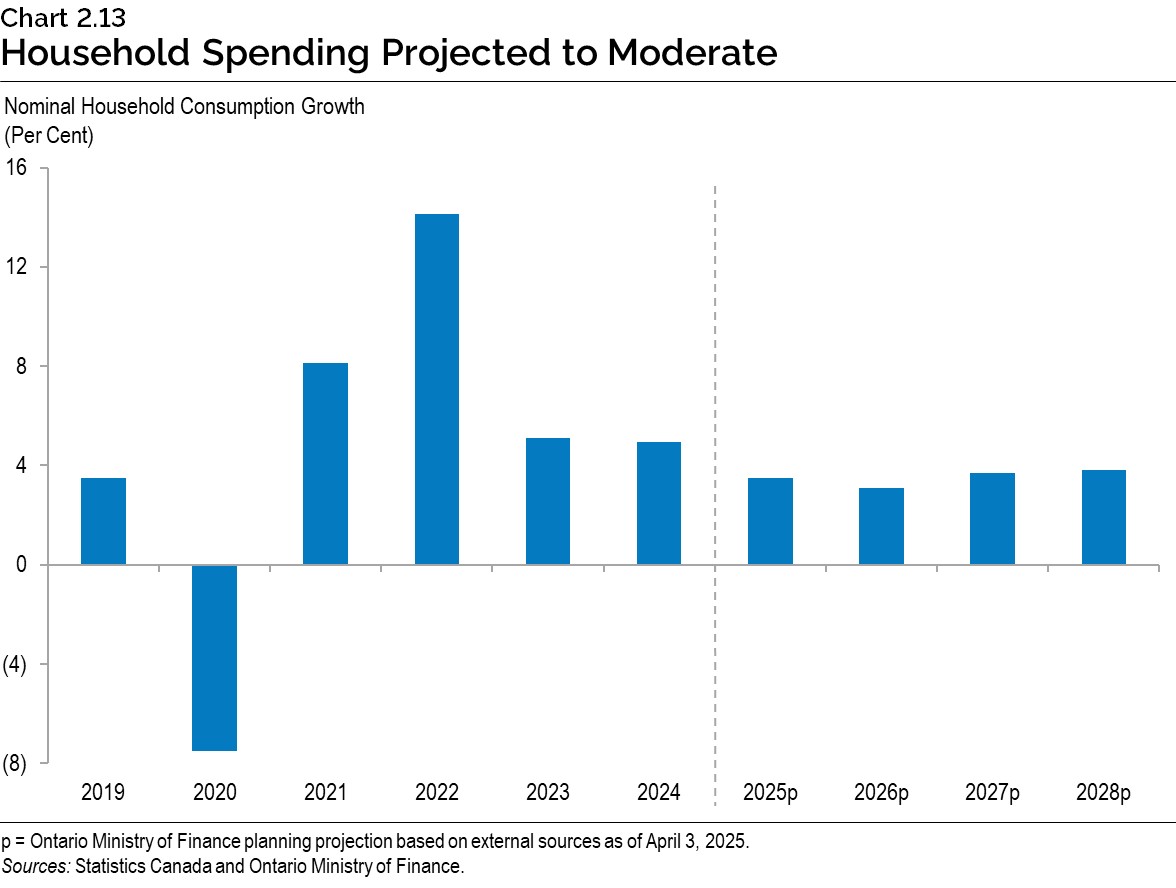
Nominal household consumption growth is projected to moderate from 4.9 per cent in 2024 to 3.5 per cent in 2025 and 3.1 per cent in 2026, reflecting weaker volumes as well as lower inflation. Over the 2027 to 2028 period, nominal household consumption is forecast to grow by an average of 3.8 per cent annually.
Consumer Price Index
Following a period of elevated growth, consumer price inflation has recently returned close to the Bank of Canada’s 2.0 per cent inflation target, helped by past monetary policy tightening by the Bank and the moderation of inflationary shocks to global supply chains and commodity markets. Persistent inflation in certain service sectors and shocks in goods sectors have led to inflation remaining above target.
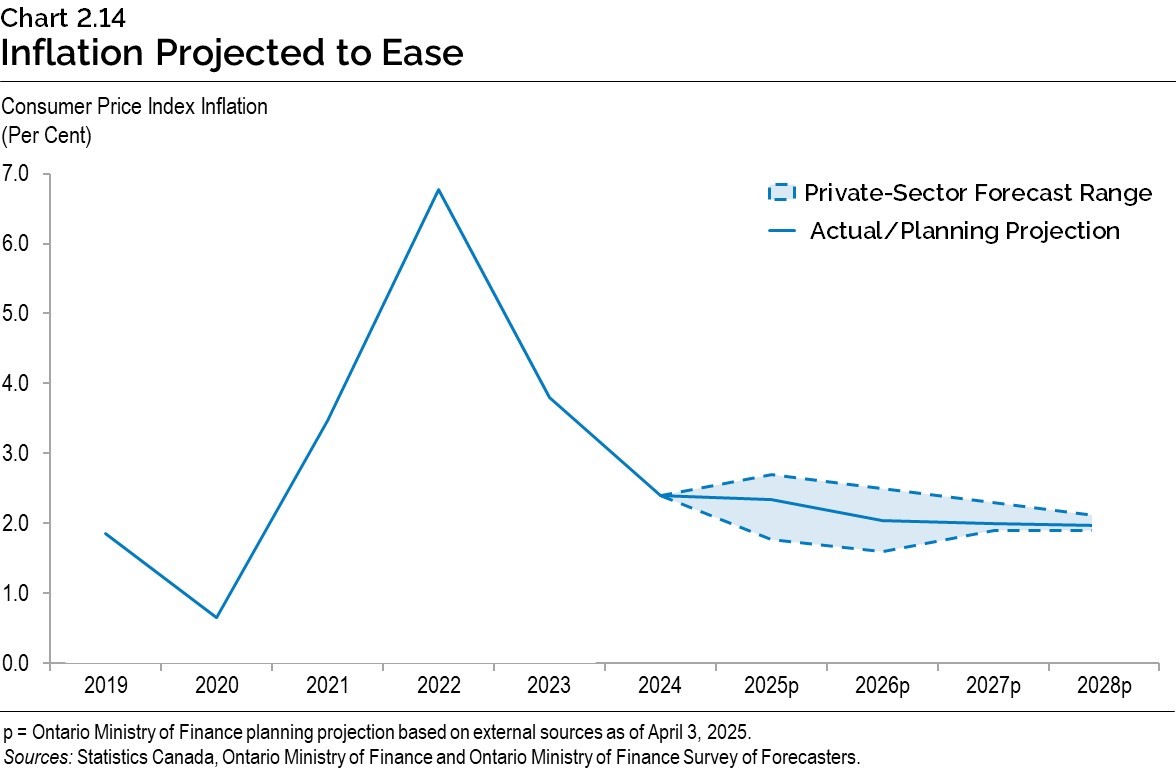
For planning purposes, the Ontario Ministry of Finance is projecting that Ontario CPI inflation will slow from 2.4 per cent in 2024 to 2.3 per cent in 2025 and 2.0 per cent in 2026 and then will remain at the Bank’s 2.0 per cent inflation target through 2028.
Although CPI inflation has eased from recent highs, the outlook remains uncertain. Persistently elevated inflation for certain services, including shelter, is an upside risk to inflation. Tariff actions related to escalating U.S. trade tensions are another significant risk to the inflation outlook. Tariffs risk raising the prices for traded goods, which could cause disruptions to global supply chains and commodity markets. On the other hand, tariffs are expected to weaken the economy and lower domestic demand growth, which could reduce inflationary pressure. Private‐sector economists have a range of views, with forecasts for Ontario CPI inflation for 2025 ranging from 1.8 per cent to 2.7 per cent. For 2026, the forecast range of 1.6 per cent to 2.5 per cent is as equally wide as in the previous year. In 2027 and 2028, the range narrows considerably and returns to the Bank’s target rate.
Housing Market
Since the release of the 2024 Ontario Economic Outlook and Fiscal Review, the Bank of Canada has implemented additional policy rate reductions, which contributed to further easing of mortgage rates and a moderate recovery in housing market activity in the second half of 2024. However, housing market activity softened again in early 2025, due in part to economic uncertainty related to potential global trade disruptions.
Ontario home resales increased by 3.0 per cent in 2024, following significant declines over the previous two years. The average home resale price in Ontario rose in the second half of 2024 before softening again in early 2025. On an annual basis, the average home price in 2024 was 0.4 per cent lower than the 2023 level.
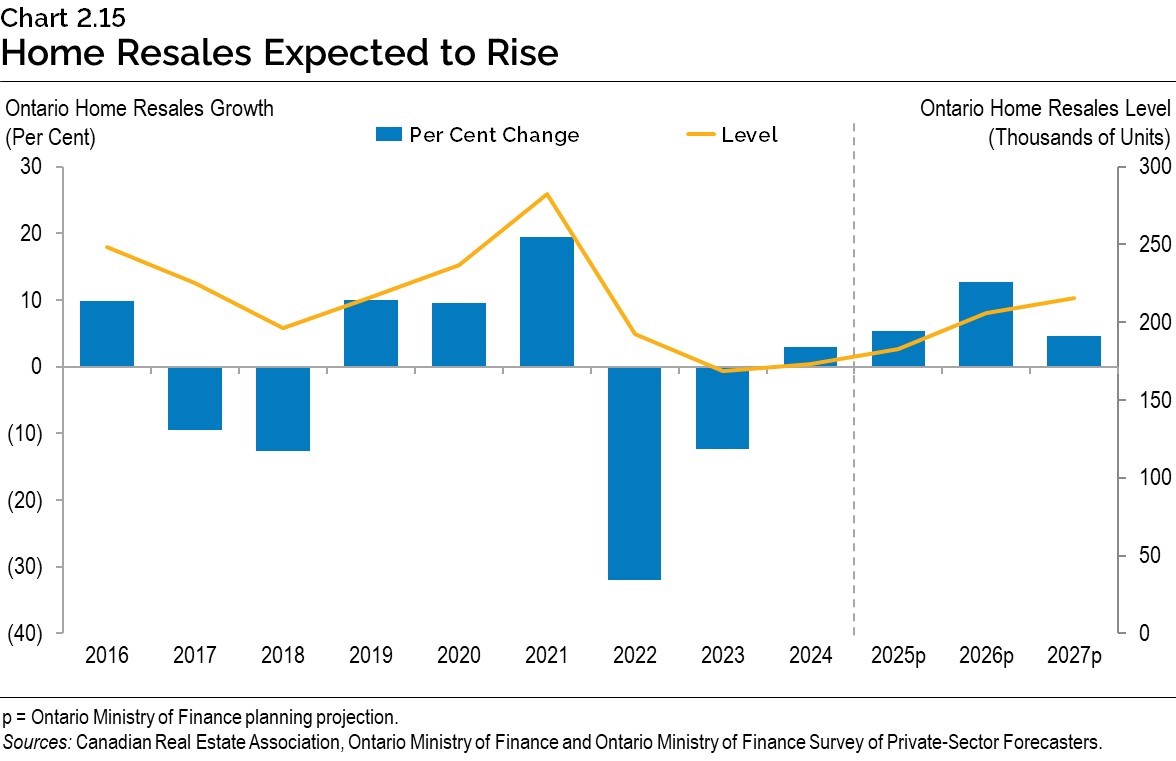
Ontario home resales are projected to rise by 5.3 per cent in 2025 before increasing further in 2026 and 2027. The average home resale price is expected to decline by 1.2 per cent in 2025 followed by modest growth in 2026 and 2027.
Consistent with private-sector economic forecasts, Ontario housing starts are expected to slow over the forecast period. Private-sector commentators have noted the risk that U.S. import tariffs could hold back homebuilding across Canada as a result of the economic uncertainty, including supply chain pressures and higher material costs. This adds to existing challenges created by still-high interest rates, and longstanding supply-demand imbalances.
Risks to the Outlook
Easing consumer price inflation in major advanced economies has allowed central banks to continue loosening monetary policy. However, some price pressures remain persistent, particularly in the services sector. In addition, rising trade policy uncertainty and tariffs could result in renewed disruptions to global supply chains, leading to a pickup in inflation. If progress in moderating inflation stalls, policy interest rates would remain elevated for longer, leading to higher borrowing costs.
Rising trade policy uncertainty could also have broader impacts on the economy. The International Monetary Fund noted that an intensification of protectionist policies could exacerbate trade tensions, lower investment, reduce market efficiency, distort trade flows, and again disrupt supply chains. Ontario’s significant trading relationships, particularly with the United States, expose the economy to elevated risks from trade policy.
Geopolitical tensions and conflicts continue to raise the prospect of disruptions to key commodity markets, which could raise goods prices, including for energy products.
Uncertainty has been rising in financial markets, largely due to the potential impacts of ongoing trade policy tensions. Lower global growth forecasts in an environment with persistent trade conflicts are weighing on equity, currency and commodity markets. Market volatility may weigh on growth through its impacts on consumer and business decision-making.
Table 2.7 displays current estimates of the impact of sustained changes in key external factors on Ontario’s real GDP planning assumptions, assuming other external factors remain unchanged. The relatively wide range of estimated impacts reflects the uncertainty regarding how the economy could respond to these changes in external conditions.
| Item | Change in Real GDP Growth First Year |
Change in Real GDP Growth Second Year |
|---|---|---|
| Canadian Dollar Depreciates by Five Cents US | +0.1 to +0.7 | +0.2 to +0.8 |
| Crude Oil Prices Decrease by $10 US per Barrel | +0.1 to +0.3 | +0.1 to +0.3 |
| U.S. Real GDP Growth Decreases by One Percentage Point | (0.2) to (0.6) | (0.3) to (0.7) |
| Canadian Interest Rates Decrease by One Percentage Point | +0.1 to +0.5 | +0.2 to +0.6 |
Table 2.7 footnotes:
Source: Ontario Ministry of Finance.
Potential Impact of U.S. Tariffs on Ontario’s Economy
Ontario’s Trade Profile
International trade is a key driver of Ontario’s economy. In 2024, the province’s exports of goods and services reached $593 billion, equalling 50 per cent of Ontario’s gross domestic product (GDP). Total trade activity — including both exports and imports — amounted to $1.2 trillion, nearly matching Ontario’s total GDP. Trade with other provinces also plays a significant role, with interprovincial exports totalling $196 billion and imports reaching $144 billion.
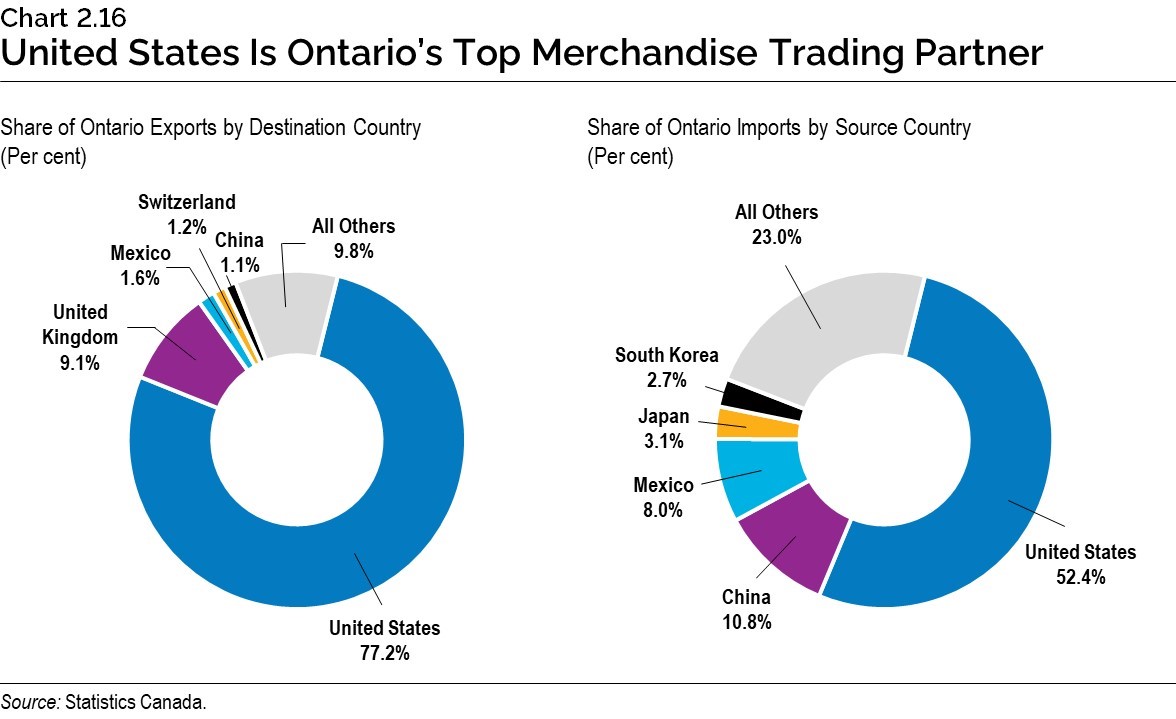
The United States remains Ontario’s largest trading partner due to geographic proximity and highly integrated supply chains. In 2024, Ontario’s domestic merchandise exports to the United States totalled $194.9 billion, accounting for 77.2 per cent of the province’s total merchandise exports. The United Kingdom was Ontario’s second-largest export market at $23.1 billion, representing 9.1 per cent of total exports. Mexico, another treaty partner in the Canada–United States–Mexico Agreement (CUSMA), ranked third at $4.1 billion, or 1.6 per cent of total exports. On the import side, Ontario sourced $243.3 billion in merchandise from the United States, representing 52.4 per cent of total merchandise imports. China followed at $50.3 billion, making up 10.8 per cent of total imports, while Mexico ranked third at $37.2 billion with a share of 8.0 per cent.
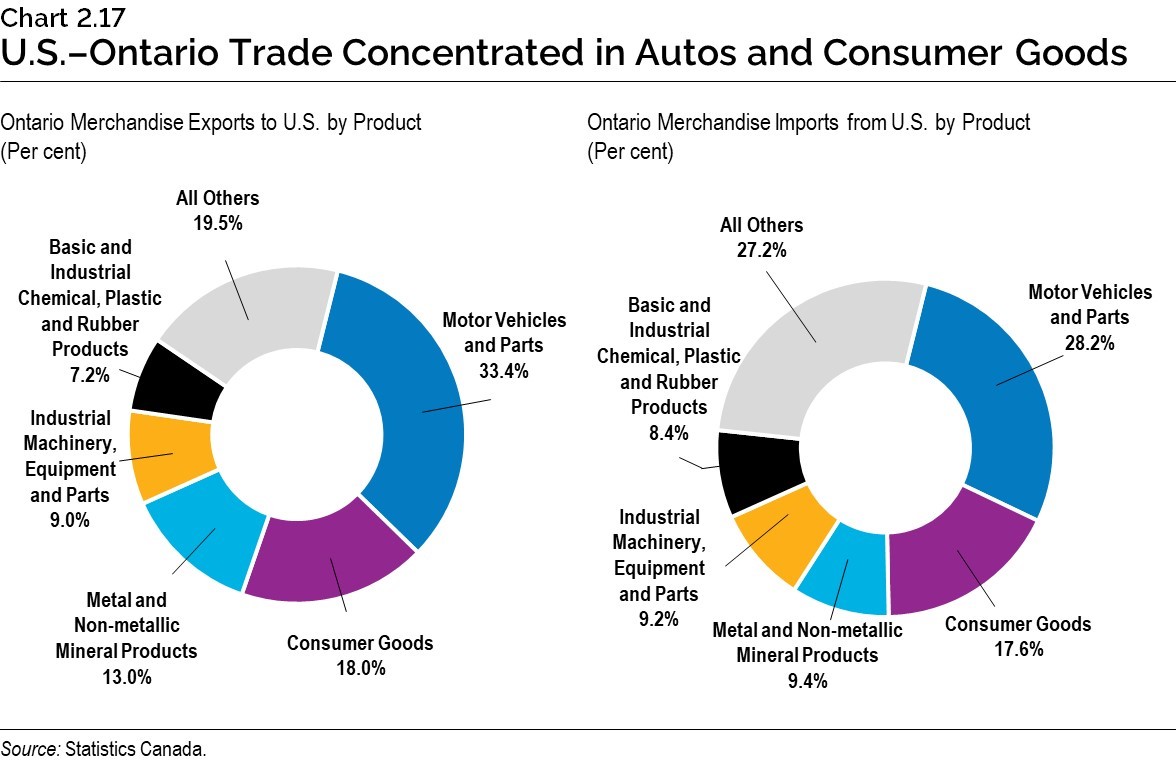
Ontario’s merchandise trade with the United States is heavily concentrated in the auto sector due to North America’s integrated supply chains in auto production. In 2024, motor vehicles and parts accounted for $65.0 billion, or 33.4 per cent of Ontario’s total merchandise exports to the United States. Consumer goods followed at $35.1 billion, making up 18.0 per cent, while metal and non-metallic mineral products totalled $25.4 billion, representing 13.0 per cent.
Ontario’s merchandise imports from the United States followed a similar pattern. In 2024, motor vehicles and parts led at $68.5 billion, accounting for 28.2 per cent of total U.S. merchandise imports. Consumer goods ranked second at $42.9 billion, or 17.6 per cent, while metal and non‑metallic mineral products totalled $22.9 billion, representing 9.4 per cent.
Tariffs between the United States and Canada
Since February of this year, the United States has announced, and subsequently implemented, tariffs on many Canadian imports, adding significant uncertainty to the trade relationship between the two countries.
Ontario’s economy is more exposed to U.S. tariff and retaliatory measures than that of most other Canadian provinces and territories given outsized trade linkages to the United States — particularly in the auto sector. In addition, the shifting nature of U.S. tariff implementation has elevated uncertainty, making it especially difficult for Ontario businesses to plan, while weakening consumer confidence.
Scenarios for the Potential Impact of U.S. Tariffs
Tariff Assumptions for Scenarios
Due to heightened uncertainty around U.S. trade policies, the Ministry of Finance has developed scenarios to assess the potential impact from tariffs on Ontario’s economy over the projection period. As significant risks remain regarding the scale, scope and timing of U.S. trade policies, these alternative scenarios should not be considered the best case or the worst case. Rather, they illustrate a broader range of possible alternative outcomes.
The Faster Growth Scenario assumes that most tariffs and countermeasures imposed between the United States and Canada are removed in the near term through negotiated agreements. Nonetheless, ongoing uncertainty surrounding the future direction of Canada–U.S. trade relations is expected to restrain business investment and consumer spending by dampening overall confidence.
The Slower Growth Scenario assumes 25 per cent U.S. tariffs on all Canadian goods — except for energy products, which are subject to a lower 10 per cent rate — throughout the projection period. It also assumes Canada maintains targeted 25 per cent retaliatory tariffs on $30 billion worth of American imports during this period. This scenario does not account for the impact of global trade disruptions resulting from the broad country-specific tariffs announced by the United States on most of its trading partners, excluding Canada and Mexico, in early April, nor the 145 per cent tariff imposed on goods from China.
With the extreme levels of uncertainty around U.S. trade policy, there are a wide range of factors that could impact these scenarios. For example, the Slower Growth scenario does not incorporate potential monetary or fiscal policy responses that could help mitigate some of the negative impacts of U.S. trade policies. On the other hand, more severe U.S. tariffs on Canada or continued escalation in U.S. trade tensions that contribute to greater policy uncertainty could lead to larger negative impacts on the Ontario economy.
Alternative Economic Scenarios
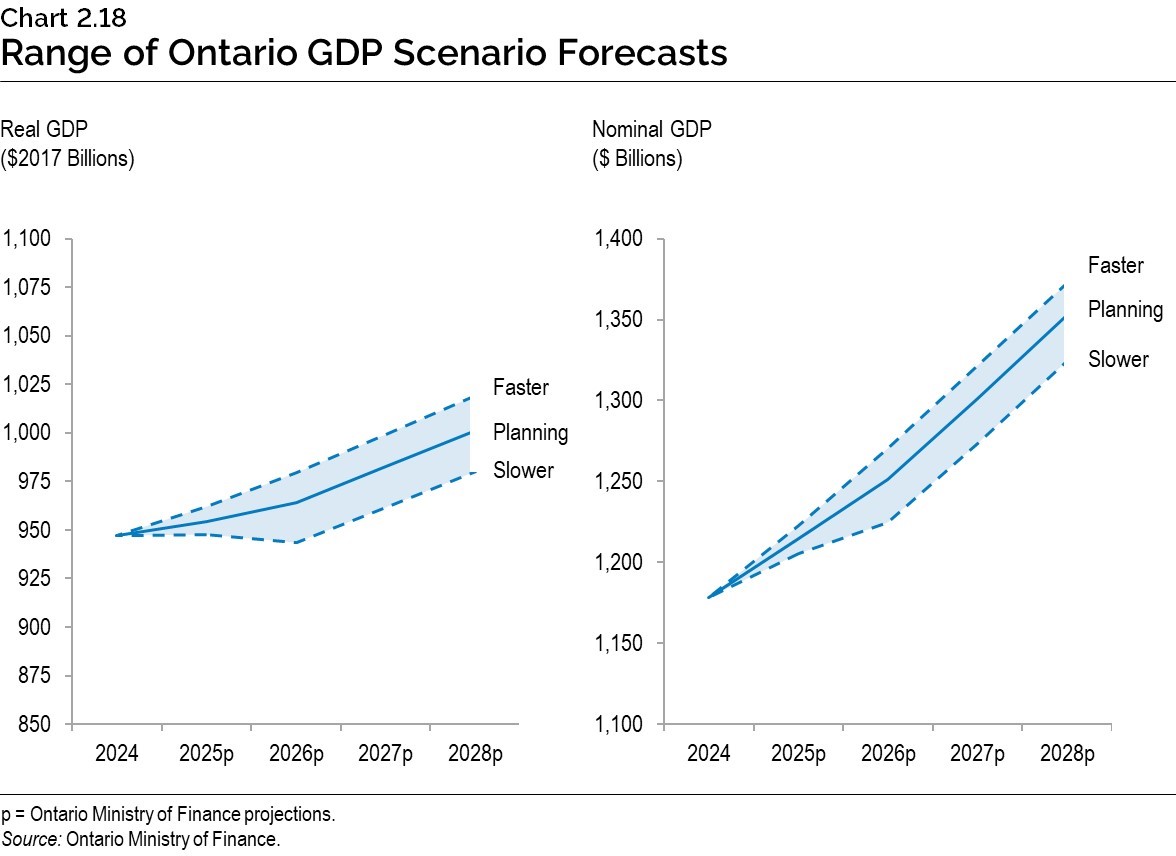
In the Faster Growth Scenario, Ontario real GDP is projected to increase by 1.6 per cent in 2025, 1.8 per cent in 2026, and 2.0 per cent in each of the years 2027 and 2028. In this scenario, Ontario real GDP is projected to be 1.8 per cent higher in 2028 compared to the level in the planning projection.
In the Slower Growth Scenario, Ontario real GDP is projected to be unchanged in 2025, contract 0.4 per cent in 2026, and increase by 1.9 per cent in each of the years 2027 and 2028. In this scenario, Ontario real GDP is projected to be 2.1 per cent lower in 2028 compared to the level in the planning projection.
| Item | 2025p | 2026p | 2027p | 2028p |
|---|---|---|---|---|
| Faster Growth Scenario | 1.6 | 1.8 | 2.0 | 2.0 |
| Planning Projection | 0.8 | 1.0 | 1.9 | 1.9 |
| Slower Growth Scenario | 0.0 | (0.4) | 1.9 | 1.9 |
Table 2.8 footnotes:
p = Ontario Ministry of Finance planning projection based on external sources and alternative scenarios as of April 3, 2025.
Source: Ontario Ministry of Finance.
In the Faster Growth Scenario, Ontario nominal GDP is projected to increase by 3.8 per cent in 2025, 3.9 per cent in 2026, 4.0 per cent in 2027 and 3.9 per cent in 2028. In this scenario, Ontario real GDP is projected to be 1.5 per cent higher in 2028 compared to the level in the planning projection.
In the Slower Growth Scenario, Ontario nominal GDP is projected to increase by 2.3 per cent in 2025, 1.6 per cent in 2026, and 4.0 per cent in each of the years 2027 and 2028. In this scenario, Ontario nominal GDP is projected to be 2.1 per cent lower in 2028 compared to the level in the planning projection.
| Item | 2025p | 2026p | 2027p | 2028p |
|---|---|---|---|---|
| Faster Growth Scenario | 3.8 | 3.9 | 4.0 | 3.9 |
| Planning Projection | 3.1 | 3.0 | 4.0 | 4.0 |
| Slower Growth Scenario | 2.3 | 1.6 | 4.0 | 4.0 |
Table 2.9 footnotes:
p = Ontario Ministry of Finance planning projection based on external sources and alternative scenarios as of April 3, 2025.
Source: Ontario Ministry of Finance.
Transparent Reporting on the Economy
The Ontario Economic Accounts provide a comprehensive overall assessment of the performance of Ontario’s economy. Private‐sector economists use this to assess the current state of the province’s economy and as a basis for updating their forecasts. The Ontario Economic Accounts help inform the government’s economic and revenue forecasts, providing a key foundation for Ontario’s fiscal plan.
The Fiscal Sustainability, Transparency and Accountability Act, 2019 states that the quarterly Ontario Economic Accounts shall be released within 45 days after the Statistics Canada release of the National Income and Expenditure Accounts.
In compliance with the legislation, the quarterly Ontario Economic Accounts will be released according to the schedule outlined in Table 2.10.
| Reference Period | Expected Statistics Canada Release of National Income and Expenditure Accounts | Corresponding Deadline for Release of Ontario Economic Accounts |
|---|---|---|
| First quarter (January-March) 2025 |
May 30, 2025 | By July 14, 2025 |
| Second quarter (April-June) 2025 |
August 29, 2025 | By October 14, 2025 |
| Third quarter (July-September) 2025 |
November 28, 2025 | By January 12, 2026 |
| Fourth quarter (October-December) 2025 |
February 27, 2026 | By April 13, 2026 |
Table 2.10 footnotes:
Sources: Statistics Canada and Ontario Ministry of Finance.
Footnotes
[1] The three experts are from the Policy and Economic Analysis Program at the University of Toronto; Quantitative Economic Decisions, Inc. (QEDinc.); and Stokes Economics Consulting, Inc.
Chart Descriptions
Chart 2.1: Ontario’s Employment Growth
The bar chart shows Ontario’s annual employment growth from 2000 to 2024.
Growth rates were as follows: 3.2 per cent in 2000; 1.8 per cent in 2001; 1.9 per cent in 2002; 3.0 per cent in 2003; 1.6 per cent in 2004; 1.1 per cent in 2005; 1.2 per cent in 2006; 1.2 per cent in 2007; 1.0 per cent in 2008; −2.4 per cent in 2009; 1.6 per cent in 2010; 1.5 per cent in 2011; 0.6 per cent in 2012; 1.6 per cent in 2013; 0.5 per cent in 2014; 0.6 per cent in 2015; 1.0 per cent in 2016; 2.5 per cent in 2017; 1.8 per cent in 2018; 2.4 per cent in 2019; −5.0 per cent in 2020; 5.1 per cent in 2021; 4.9 per cent in 2022; 3.1 per cent in 2023; and 1.7 per cent in 2024.
There is a horizontal line at 1.5 per cent representing the average employment growth over the 2000 to 2024 period. There is a text box pointing to 2009 that says “2008–09 Global Financial Crisis” and a text box pointing to 2020 that says “COVID-19 Pandemic.”
Source: Statistics Canada.
Chart 2.2: Ontario’s Real GDP Continued to Grow in 2024
This bar chart illustrates the annual real gross domestic product growth for Ontario from 2018 to 2024. Real gross domestic product growth for Ontario is as follows: 3.3 per cent in 2018; 2.1 per cent in 2019; −4.5 per cent in 2020; 6.1 per cent in 2021; 4.1 per cent in 2022; 1.7 per cent in 2023; and 1.5 per cent in 2024.
Sources: Statistics Canada and Ontario Ministry of Finance.
Chart 2.3: Inflation Moderated in 2024
This chart shows components of Ontario CPI inflation as stacked bars and annual CPI inflation between 2018 to 2024 as a solid black line. The components of Ontario CPI inflation are food, energy, shelter (excluding energy) and other. Ontario CPI inflation is as follows: 2.4 per cent in 2018; 1.9 per cent in 2019; 0.7 per cent in 2020; 3.5 per cent in 2021; 6.8 per cent in 2022; 3.8 per cent in 2023; and 2.4 per cent in 2024.
Sources: Statistics Canada and Ontario Ministry of Finance.
Chart 2.4: Tariffs Are Impacting Confidence
This chart shows Ontario’s index of consumer confidence and Ontario’s small business confidence index between January 2019 and April 2025. The chart on Ontario’s consumer confidence highlights key points of the index: April 2020 is 37.4; July 2021 is 120.4; and April 2025 is 43.9.
The chart on Ontario’s small business confidence highlights key points of the index: March 2020 is 45.1; July and August 2021 are 70.2; and April 2025 is 32.7.
Sources: Conference Board of Canada and the Canadian Federation of Independent Business.
Chart 2.5: Tariffs Weighing on Ontario Real GDP Growth Outlook
The bar chart shows the private-sector average forecast in the 2024 Ontario Economic Outlook and Fiscal Review and the 2025 Budget. The private-sector average of real GDP growth forecasts has declined from 1.8 per cent to 0.9 per cent in 2025, from 2.4 per cent to 1.1 per cent in 2026, and from 2.4 per cent to 2.0 per cent in 2027.
Sources: Ontario Ministry of Finance Survey of Forecasters (September 19, 2024 and April 3, 2025).
Chart 2.6: High Range of Private-Sector Forecast Uncertainty
The bar chart shows the difference between the highest and lowest private-sector forecast for Ontario real GDP growth. For the first-year forecasts, Ontario real GDP growth forecast range is 1.0 percentage points for 2004 to 2019 Budget average, 2.0 percentage points in the 2021 Budget and 1.8 percentage points in the 2025 Budget. For the second-year forecasts, Ontario real GDP growth forecasts range is 1.3 percentage points for 2004 to 2019 Budget average, 1.9 percentage points in the 2021 Budget and 1.8 percentage points in the 2025 Budget.
Sources: Ontario Budgets and Ontario Ministry of Finance Survey of Forecasters (April 3, 2025).
Chart 2.7: Heightened Global Economic Policy Uncertainty
This line chart shows the monthly series of the global economic policy uncertainty index from January 1997 to January 2025. The Economic Policy Uncertainty Index reflects the frequency of newspaper articles that contain terms pertaining to the economy, policy and uncertainty. The chart suggests that global economic policy uncertainty was at its highest level in January 2025.
Note: Latest data point is January 2025.
Source: www.policyuncertainty.com
Chart 2.8: Global Real GDP Growth Projections
This bar chart shows estimated and forecast real GDP growth in per cent for 2024, 2025 and 2026 for the world economy, the United States, the Euro area and China. Real GDP growth in 2024, 2025 and 2026 is projected to be 3.3 per cent, 2.8 per cent and 3.0 per cent for the world economy; 2.8 per cent, 1.4 per cent and 1.4 per cent in the United States; 0.9 per cent, 0.8 per cent and 1.2 per cent in the Euro area; and 5.0 per cent, 4.0 per cent and 4.0 per cent in China.
Note: World real GDP growth for 2024 is an estimate, while United States, Euro Area and China real GDP growth rates in 2024 are actuals.
Sources: International Monetary Fund (April 2025) and Blue Chip Economic Indicators (April 2025).
Chart 2.9: Bank of Canada Policy Rates Are More Supportive
This line chart shows the Bank of Canada target for the overnight rate in per cent from April 2015 to April 2025. After maintaining its policy interest rate at 5.0 per cent between July 2023 and June 2024, the Bank of Canada started easing monetary policy in June 2024. Between June 2024 and March 2025, the Bank reduced its key policy rate by a total of 225 basis points to 2.75 per cent. The grey area shows the range of the Bank of Canada nominal neutral policy rate, which was estimated to be between 3.0 and 4.0 per cent from January 2015 to March 2016, between 2.75 and 3.75 per cent from April 2016 to March 2017, between 2.5 and 3.5 per cent from April 2017 to March 2019, between 2.25 and 3.25 per cent from April 2019 to September 2020, between 1.75 and 2.75 per cent from October 2020 to March 2022, between 2.0 and 3.0 per cent from April 2022 to March 2024, and between 2.25 per cent to 3.25 per cent from April 2024 to April 2025.
Source: Bank of Canada.
Chart 2.10: Canadian Dollar Has Come Under Pressure
This line chart shows the Canadian dollar exchange rate with the U.S. dollar from April 2024 to April 2025. Throughout the first half of 2024, the Canadian dollar was relatively stable, trading between 72.4 cents US and 75.1 cents US. However, the Canadian dollar started to decline in the fall of 2024, reaching a daily average of 69.5 cents US in January 2025, a daily average of 69.9 cents US in February 2025, and a daily average of 69.6 cents US in March 2025.
From April 2024 to April 2025, the highest daily exchange rate of the Canadian dollar was 74.3 cents US in August 2024 while the lowest daily exchange rate of the Canadian dollar was 68.5 cents US in February 2025.
Source: Bank of Canada.
Chart 2.11: Equity Markets Have Been Sensitive to Tariff Announcements
This line chart shows the S&P/TSX Composite index and the S&P 500 index between April 2024 and April 2025. The S&P/TSX Composite index averaged 22,295 between April 2024 and August 2024, 24,636 between September 2024 and January 2025, and 24,767 between February 2025 and April 2025. The S&P 500 index averaged 5,356 between April 2024 and August 2024, 5,865 between September 2024 and January 2025, and 5,706 between February 2025 and April 2025.
Source: Yahoo Finance.
Chart 2.12: Employment Gains Projected to Slow
This chart shows Ontario’s annual employment gains and unemployment rate from 2019 to 2024 and projections for 2025 to 2028.
The bars show the annual change in Ontario’s employment. There was an increase in employment of over 170,000 in 2019 and then a decline of 370,000 in 2020. Employment grew by around 360,000 in both 2021 and 2022 and then slowed to 242,000 in 2023 and 140,000 in 2024. Employment gains are forecast to be 73,000 in 2025, 33,000 in 2026, 74,000 in 2027 and 75,000 in 2028.
The line shows Ontario’s unemployment rate. The unemployment rate increased from 5.5 per cent in 2019 to 9.8 per cent in 2020. The unemployment rate decreased to 5.6 per cent in 2022 and remained at 5.6 per cent in 2023, before rising to 7.0 per cent in 2024. The unemployment rate is forecast to be 7.6 per cent in 2025, 7.3 per cent in 2026, 6.6 per cent in 2027 and 6.2 per cent in 2028.
Sources: Statistics Canada and Ontario Ministry of Finance.
Chart 2.13: Household Spending Projected to Moderate
The bar chart shows growth in Ontario’s nominal household spending from 2019 to 2024 and Ontario Ministry of Finance planning projections for 2025 to 2028.
Over the 2019 to 2024 period, growth in nominal household spending ranged from a decline of 7.5 per cent in 2020 to an increase of 14.1 per cent in 2022. Nominal household consumption grew by 4.9 per cent in 2024. Nominal household spending is projected to grow 3.5 per cent in 2025, 3.1 per cent in 2026, 3.7 per cent in 2027 and 3.8 per cent in 2028.
Sources: Statistics Canada and Ontario Ministry of Finance.
Chart 2.14: Inflation Projected to Ease
This line chart shows annual Ontario Consumer Price Index (CPI) inflation from 2019 to 2024, as well as projected Ontario CPI inflation for 2025 through 2028. The Ontario Ministry of Finance’s planning projection is based on external sources as of April 3, 2025.
Ontario CPI inflation was 1.9 per cent in 2019, 0.7 per cent in 2020, 3.5 per cent in 2021, 6.8 per cent in 2022, 3.8 per cent in 2023 and 2.4 per cent in 2024.
Ontario CPI inflation is projected to be 2.3 per cent in 2025, before slowing to 2.0 per cent in 2026 and remaining at that rate through 2028.
The shaded area on the chart shows the range of private-sector forecasts for Ontario CPI inflation for 2025 through 2028. Private-sector forecasts range from 1.8 per cent to 2.7 per cent in 2025. The range is 1.6 per cent to 2.5 per cent in 2026. The range then narrows to 1.9 per cent to 2.3 per cent in 2027 and 1.9 per cent to 2.1 per cent in 2028.
Sources: Statistics Canada, Ontario Ministry of Finance and Ontario Ministry of Finance Survey of Forecasters.
Chart 2.15: Home Resales Expected to Rise
This chart shows 2025 Budget planning projections for growth in Ontario home resales. Home resales are expected to grow 5.3 per cent in 2025 (reaching 182,600 units), 12.7 per cent in 2026 (205,800 units) and 4.6 per cent in 2027 (215,200 units).
Sources: Canadian Real Estate Association, Ontario Ministry of Finance and Ontario Ministry of Finance Survey of Private-Sector Forecasters.
Chart 2.16: United States Is Ontario’s Top Merchandise Trading Partner
The donut chart on the left shows the share of Ontario exports by destination country. In 2024, the United States accounted for 77.2 per cent of Ontario’s total merchandise exports, followed by the United Kingdom at 9.1 per cent, Mexico at 1.6 per cent, Switzerland at 1.2 per cent and China at 1.1 per cent. All others accounted for 9.8 per cent.
The donut chart on the right shows the share of Ontario imports by source country. In 2024, the United States accounted for 52.4 per cent of Ontario’s total merchandise imports, followed by China at 10.8 per cent, Mexico at 8.0 per cent, Japan at 3.1 per cent and South Korea at 2.7 per cent. All others accounted for 23.0 per cent.
Source: Statistics Canada.
Chart 2.17: U.S.–Ontario Trade Concentrated in Autos and Consumer Goods
The donut chart on the left shows the share of Ontario merchandise exports to the United States by Product. In 2024, motor vehicles and parts accounted for 33.4 per cent of Ontario’s total merchandise exports to the United States, followed by consumer goods at 18.0 per cent, metal and non-metallic mineral products at 13.0 per cent, industrial machinery, equipment and parts at 9.0 per cent and basic and industrial chemical, plastic and rubber products at 7.2 per cent. All other products accounted for 19.5 per cent.
The donut chart on the right shows the share of Ontario merchandise imports from the United States by Product. In 2024, motor vehicles and parts accounted for 28.2 per cent of Ontario’s total merchandise imports from the United States, followed by consumer goods at 17.6 per cent, metal and non-metallic mineral products at 9.4 per cent, industrial machinery, equipment and parts at 9.2 per cent and basic and industrial chemical, plastic and rubber products at 8.4 per cent. All other products accounted for 27.2 per cent.
Source: Statistics Canada.
Chart 2.18: Range of Ontario GDP Scenario Forecasts
The line chart on the left shows Ontario real GDP in 2024 and the Ontario Ministry of Finance planning projection for real GDP from 2025 to 2028, in billions of 2017 dollars. Separate lines show the levels of real GDP in the Faster Growth and the Slower Growth scenarios for 2025 to 2028. Ontario real GDP was $947 billion in 2024. In the Planning Projection, Ontario real GDP is projected to rise from $955 billion in 2025 to $1,001 billion in 2028. In the Faster Growth scenario, Ontario real GDP is projected to rise from $962 billion in 2025 to $1,019 billion in 2028. In the Slower Growth scenario, Ontario real GDP is projected to be $947 billion in 2025 and $943 billion in 2026, before rising to $980 billion in 2028.
The line chart on the right shows Ontario nominal GDP in 2024 and the Ontario Ministry of Finance planning projection for nominal GDP for 2025 to 2028, in billions of dollars. Separate lines show the levels of nominal GDP in the Faster Growth and the Slower Growth scenarios for 2025 to 2028. Ontario nominal GDP was $1,178 billion in 2024. In the Planning Projection, Ontario nominal GDP is projected to rise from $1,215 billion in 2025 to $1,353 billion in 2028. In the Faster Growth scenario, Ontario nominal GDP is projected to rise from $1,223 billion in 2025 to $1,373 billion in 2028. In the Slower Growth scenario, Ontario nominal GDP is projected to rise from $1,205 billion in 2025 to $1,324 billion in 2028.
Source: Ontario Ministry of Finance.