Introduction
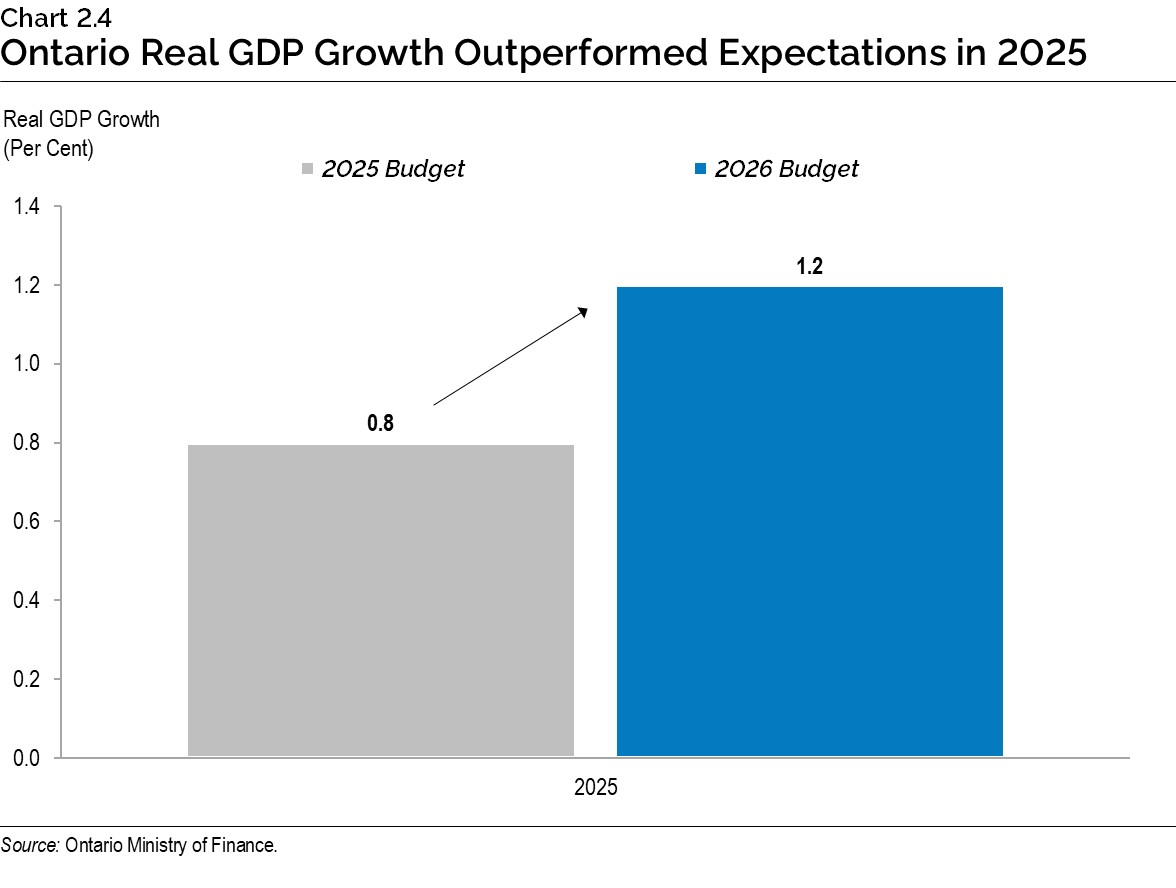
Ontario’s economy remains resilient and performed better than expected in 2025, despite headwinds created by U.S. trade policy. Real gross domestic product (GDP) is estimated to have increased by 1.2 per cent, up from 0.8 per cent at the time of the 2025 Budget.
Ontario’s real GDP is projected to grow by 1.0 per cent in 2026 and growth is expected to pick up in subsequent years, with projected increases of 1.7 per cent in 2027, 1.8 per cent in 2028 and 2.0 per cent in 2029. For the purposes of prudent fiscal planning, these projections are set slightly below the average of private‐sector forecasts.
| Item | 2025 | 2026p | 2027p | 2028p | 2029p |
|---|---|---|---|---|---|
| Real GDP Growth | 1.2e | 1.0 | 1.7 | 1.8 | 2.0 |
| Nominal GDP Growth | 4.2e | 3.2 | 3.9 | 3.7 | 3.9 |
| Employment Growth | 1.0 | 0.5 | 0.7 | 0.8 | 1.1 |
| CPI Inflation | 1.9 | 2.1 | 2.0 | 2.0 | 2.0 |
Table 2.1 footnotes:
e = estimate.
p = Ontario Ministry of Finance planning projection based on external sources as of January 16, 2026.
Sources: Statistics Canada and Ontario Ministry of Finance.
Revisions to the Outlook Since the 2025 Budget
The outlook has been revised compared to the projections in the 2025 Budget. Key changes since the 2025 Budget include the following:
- Stronger nominal GDP growth in 2025 and 2026;
- Stronger growth in compensation of employees and net operating surplus in 2025;
- Stronger job creation in 2025 and 2026; and
- Slower growth in home resales in 2025 and 2026.
| Item | 2025 2025 Budget |
2025 2026 Budget |
2026p 2025 Budget |
2026p 2026 Budget |
2027p 2025 Budget |
2027p 2026 Budget |
2028p 2025 Budget |
2028p 2026 Budget |
|---|---|---|---|---|---|---|---|---|
| Real Gross Domestic Product | 0.8 | 1.2e | 1.0 | 1.0 | 1.9 | 1.7 | 1.9 | 1.8 |
| Nominal Gross Domestic Product | 3.1 | 4.2e | 3.0 | 3.2 | 4.0 | 3.9 | 4.0 | 3.7 |
| Compensation of Employees | 3.7 | 4.0e | 3.2 | 3.2 | 3.6 | 3.3 | 3.8 | 3.5 |
| Net Operating Surplus — Corporations | (3.0) | 4.4e | 6.4 | 4.7 | 7.2 | 7.2 | 5.2 | 6.1 |
| Nominal Household Consumption | 3.5 | 4.0e | 3.1 | 3.3 | 3.7 | 3.4 | 3.8 | 3.6 |
| Other Economic Indicators — Employment | 0.9 | 1.0 | 0.4 | 0.5 | 0.9 | 0.7 | 0.9 | 0.8 |
| Other Economic Indicators — Job Creation (000s) | 73 | 81 | 33 | 41 | 74 | 58 | 75 | 67 |
| Other Economic Indicators — Unemployment Rate (Per Cent) | 7.6 | 7.7 | 7.3 | 7.4 | 6.6 | 6.9 | 6.2 | 6.4 |
| Other Economic Indicators — Consumer Price Index | 2.3 | 1.9 | 2.0 | 2.1 | 2.0 | 2.0 | 2.0 | 2.0 |
| Other Economic Indicators — Housing Starts (000s)1 | 71.8 | 65.4 | 74.8 | 64.8 | 82.5 | 70.3 | 85.9 | 76.8 |
| Other Economic Indicators — Home Resales | 5.3 | (5.6) | 12.7 | 9.1 | 4.6 | 5.6 | 1.5 | 4.6 |
| Other Economic Indicators — Home Resale Prices | (1.2) | (4.4) | 2.6 | 0.8 | 3.8 | 2.7 | 4.0 | 4.2 |
| Key External Variables — U.S. Real Gross Domestic Product | 1.4 | 2.2 | 1.4 | 2.4 | 2.0 | 2.1 | 2.0 | 2.0 |
| Key External Variables — WTI Crude Oil ($US per Barrel) | 69 | 65 | 69 | 59 | 74 | 62 | 75 | 67 |
| Key External Variables — Canadian Dollar (Cents US) | 69.2 | 71.6 | 71.2 | 73.2 | 73.0 | 75.3 | 74.1 | 76.4 |
| Key External Variables — Three-Month Treasury Bill Rate (Per Cent)2 | 2.4 | 2.6 | 2.3 | 2.3 | 2.4 | 2.6 | 2.6 | 2.5 |
| Key External Variables — 10-Year Government Bond Rate (Per Cent)3 | 3.1 | 3.2 | 3.2 | 3.3 | 3.4 | 3.5 | 3.5 | 3.5 |
Table 2.2 footnotes:
e = estimate.
p = Ontario Ministry of Finance planning projection based on external sources as of January 16, 2026.
[1] Housing starts projection based on private-sector average as of January 16, 2026.
[2], [3] Government of Canada interest rates.
Sources: Statistics Canada; Canada Mortgage and Housing Corporation; Canadian Real Estate Association; Bank of Canada; United States Bureau of Economic Analysis; Blue Chip Economic Indicators (February 2026 and October 2025); U.S. Energy Information Administration; and Ontario Ministry of Finance.
Recent Economic Performance
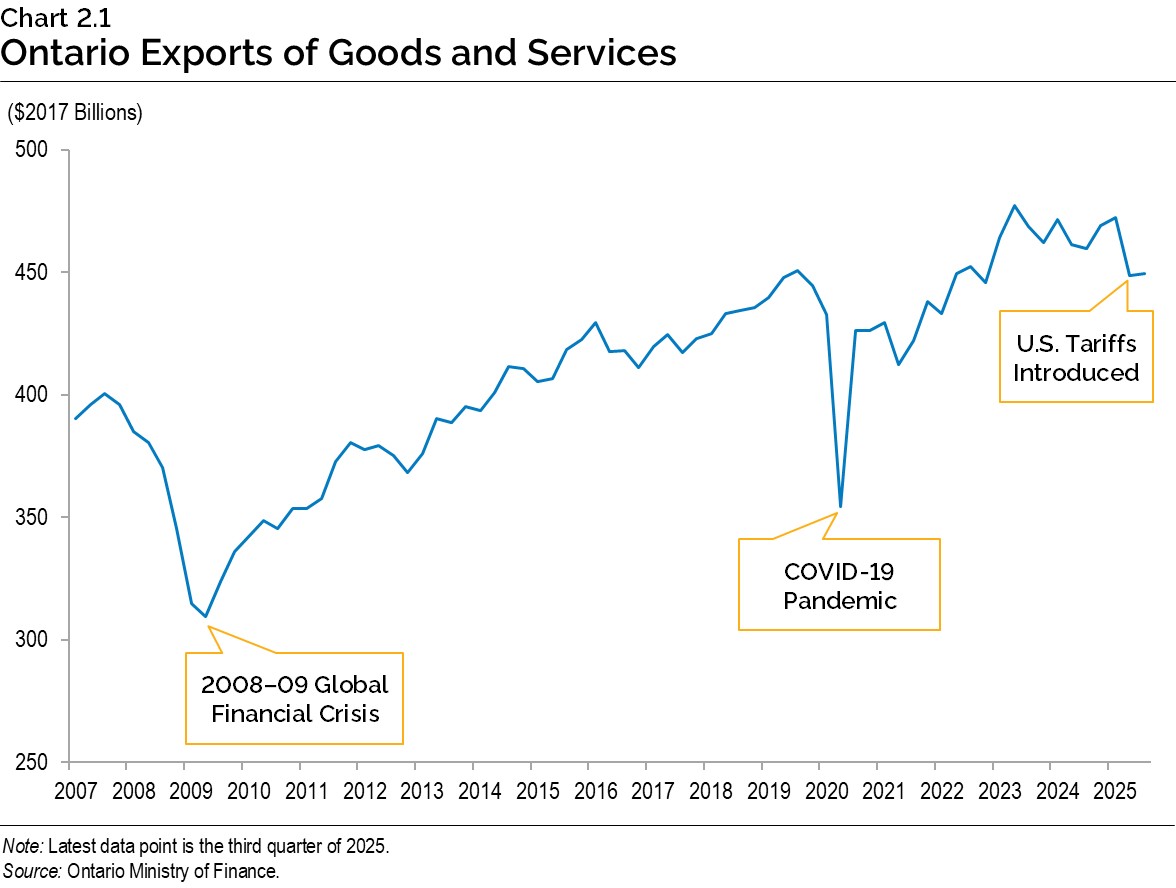
Ontario’s economy continued to grow in 2025 as the province navigated the changing trade landscape. Real GDP rose 0.5 per cent in the first quarter of 2025, as export activity was pulled forward in anticipation of the implementation of U.S. tariffs. In the second quarter, exports experienced the biggest decline since the pandemic, contributing to a 0.7 per cent decline in overall real GDP. Real GDP then rebounded by 0.5 per cent in the third quarter, with growth supported by gains in net trade as exports edged up and imports declined.
While uncertainty related to trade continues to impact the economy, measures of consumer confidence have improved since early 2025, and consumer spending has remained resilient. Real consumer spending rose by 0.5 per cent in the first quarter of 2025 and 0.7 per cent in the second quarter, before edging down slightly by 0.1 per cent in the third quarter.
Business investment in machinery and equipment has weakened amid ongoing trade uncertainty. By the third quarter of 2025, real machinery and equipment investment had declined by more than 6 per cent compared with the end of 2024.
Ontario Labour Market
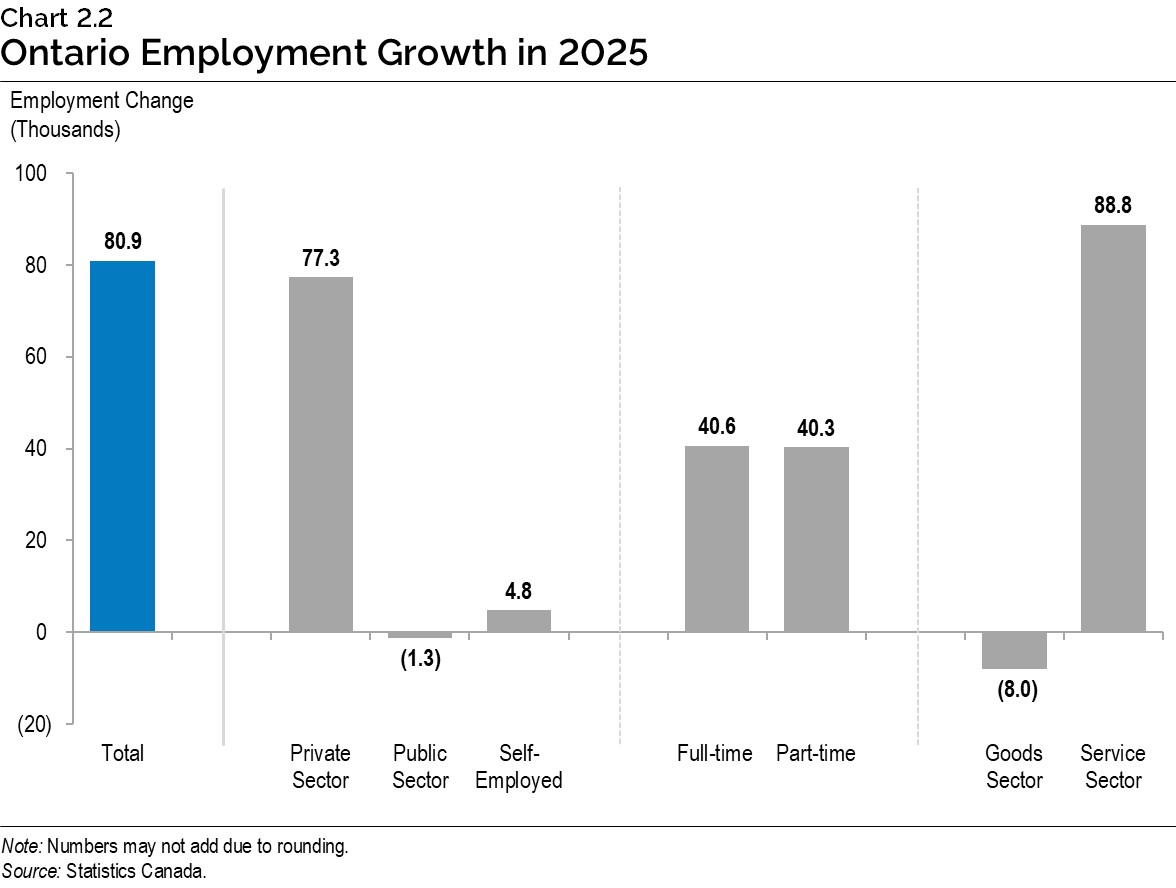
Ontario’s employment increased by 80,900 net jobs in 2025, with nearly all gains in the private sector, and growth evenly split between full-time and part-time positions. Ontario’s unemployment rate rose to an average of 7.7 per cent in 2025, up from 7.0 per cent in 2024, as labour force growth outpaced employment growth.
Tariff-related impacts have hit some parts of Ontario’s economy harder than others. Statistics Canada estimates that nationally, about 9 per cent of employment was based in industries dependent on U.S. demand for Canadian exports in 2024. These jobs are largely concentrated within the goods-producing sector, including most manufacturing industries. Trade disruptions have also disproportionately impacted employment in regions of the province near the United States and with a higher concentration of manufacturing employment.1
Consumer Price Inflation
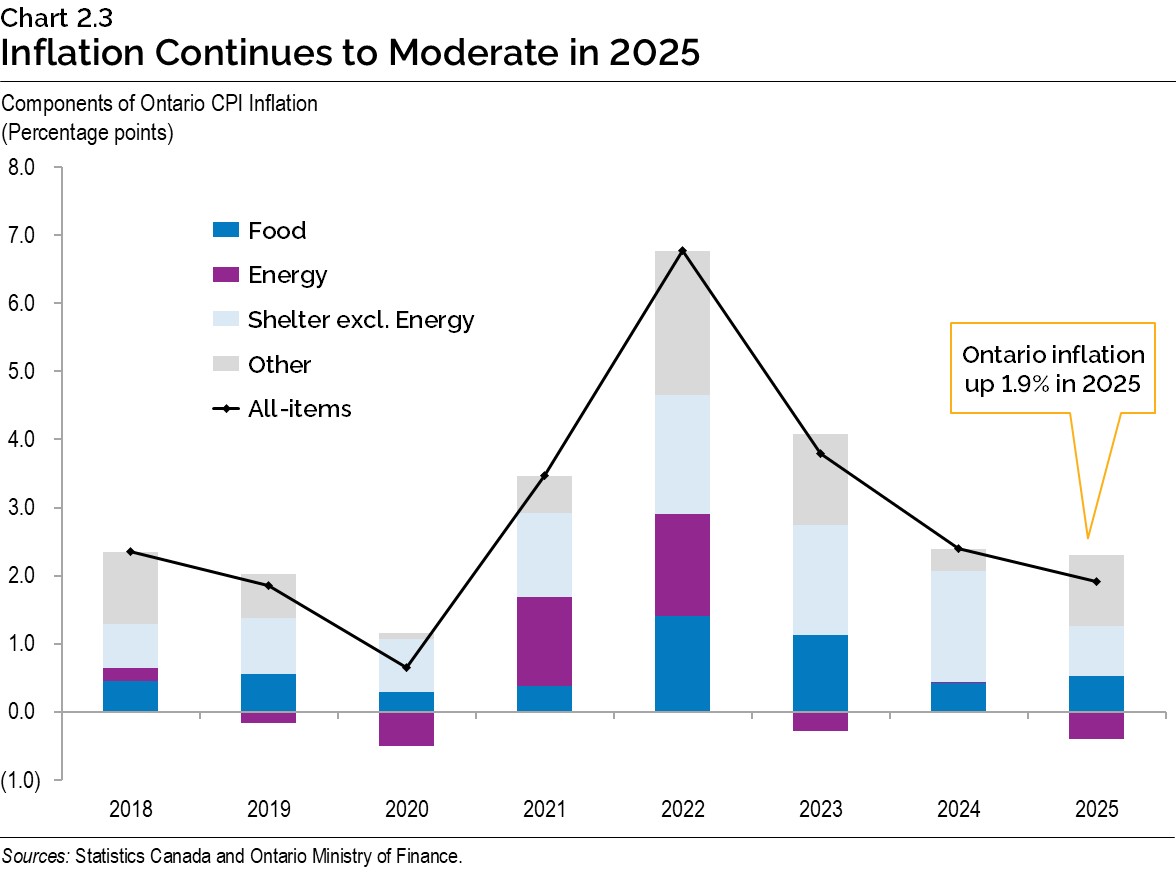
Ontario’s Consumer Price Index (CPI) inflation has moderated significantly from the peak of 7.9 per cent in June 2022, with monthly inflation remaining within the 1 to 3 per cent range for all of 2024 and 2025. Ontario’s CPI inflation rose by an average of 1.9 per cent in 2025, following an increase of 2.4 per cent in 2024.
A significant driver of the overall moderation in inflation in 2025 was a decline in energy prices, which fell 7.4 per cent. The largest contributor to this decline was a 10.7 per cent decrease in gasoline prices, largely reflecting the removal of the consumer carbon price in April 2025. In contrast, food inflation was elevated, rising 3.2 per cent in 2025 compared to 2.6 per cent in 2024. Excluding food and energy, inflation rose by 2.4 per cent in 2025.
Economic Outlook
The Ontario Ministry of Finance regularly consults with private-sector economists while tracking their forecasts to inform the government’s planning assumptions.
Private-sector forecasters, on average, are projecting that Ontario’s real GDP will grow by 1.1 per cent in 2026, 1.8 per cent in 2027, 1.9 per cent in 2028 and 2.1 per cent in 2029. The Ontario Ministry of Finance’s real GDP projections are set slightly below the average of private-sector forecasts in each year for prudent planning purposes. Three external economic experts reviewed the Ontario Ministry of Finance’s economic planning assumptions and found them to be reasonable.2
| Item | 2026 | 2027 | 2028 | 2029 |
|---|---|---|---|---|
| BMO Capital Markets (January) | 1.2 | 2.3 | – | – |
| Central 1 Credit Union (January) | 1.0 | 1.7 | – | – |
| CIBC Capital Markets (January) | 1.2 | 2.1 | – | – |
| Desjardins Group (January) | 1.1 | 1.9 | – | – |
| Laurentian Bank Securities (January) | 1.2 | 1.6 | – | – |
| National Bank of Canada (December) | 0.9 | 1.8 | – | – |
| Quantitative Economic Decisions, Inc. (January) | 0.9 | 1.1 | 1.0 | 1.4 |
| Royal Bank of Canada (December) | 1.1 | 1.4 | – | – |
| Scotiabank (January) | 1.2 | 1.7 | – | – |
| Signal49 Research1 (January) | 1.6 | 2.5 | 2.7 | 2.7 |
| Stokes Economics (January) | 1.0 | 2.0 | 2.1 | 2.0 |
| TD Bank Group (December) | 1.0 | 1.8 | – | – |
| University of Toronto (January) | 0.5 | 1.4 | 1.8 | 2.4 |
| Private-Sector Survey Average | 1.1 | 1.8 | 1.9 | 2.1 |
| Ontario’s Planning Assumption | 1.0 | 1.7 | 1.8 | 2.0 |
Table 2.3 footnotes:
[1] Formerly, the Conference Board of Canada, effective January 2026.
Sources: Ontario Ministry of Finance Survey of Forecasters (January 16, 2026) and Ontario Ministry of Finance.
Private-sector forecasters, on average, are projecting that Ontario’s nominal GDP will grow by 3.3 per cent in 2026, 4.0 per cent in 2027, 3.8 per cent in 2028 and 4.0 per cent in 2029. The Ontario Ministry of Finance’s nominal GDP projections are set slightly below the average of private‑sector forecasts in each year for prudent planning purposes.
| Item | 2026 | 2027 | 2028 | 2029 |
|---|---|---|---|---|
| BMO Capital Markets (January) | 3.5 | 4.4 | – | – |
| Central 1 Credit Union (January) | 3.5 | 4.0 | – | – |
| CIBC Capital Markets (January) | 3.2 | 4.5 | – | – |
| Desjardins Group (January) | 3.5 | 3.9 | – | – |
| Laurentian Bank Securities (January) | 3.3 | 3.8 | – | – |
| National Bank of Canada (December) | 3.3 | 4.0 | – | – |
| Quantitative Economic Decisions, Inc. (January) | 2.7 | 3.2 | 3.1 | 3.4 |
| Royal Bank of Canada (December) | 3.5 | 4.1 | – | – |
| Scotiabank (January) | 3.0 | 3.9 | – | – |
| Signal49 Research1 (January) | 3.7 | 4.4 | 4.2 | 4.2 |
| Stokes Economics (January) | 3.8 | 4.3 | 4.1 | 4.1 |
| TD Bank Group (December) | 3.4 | 3.8 | – | – |
| University of Toronto (January) | 2.7 | 3.4 | 3.9 | 4.5 |
| Private-Sector Survey Average | 3.3 | 4.0 | 3.8 | 4.0 |
| Ontario’s Planning Assumption | 3.2 | 3.9 | 3.7 | 3.9 |
Table 2.4 footnotes:
[1] Formerly, the Conference Board of Canada, effective January 2026.
Sources: Ontario Ministry of Finance Survey of Forecasters (January 16, 2026) and Ontario Ministry of Finance.
In 2025, Ontario real GDP growth outperformed expectations by rising an estimated 1.2 per cent, 0.4 percentage points faster than projected in the 2025 Budget. This was supported by strong growth in the third quarter of 2025 as Ontario showed economic resilience in the face of U.S. trade policy.
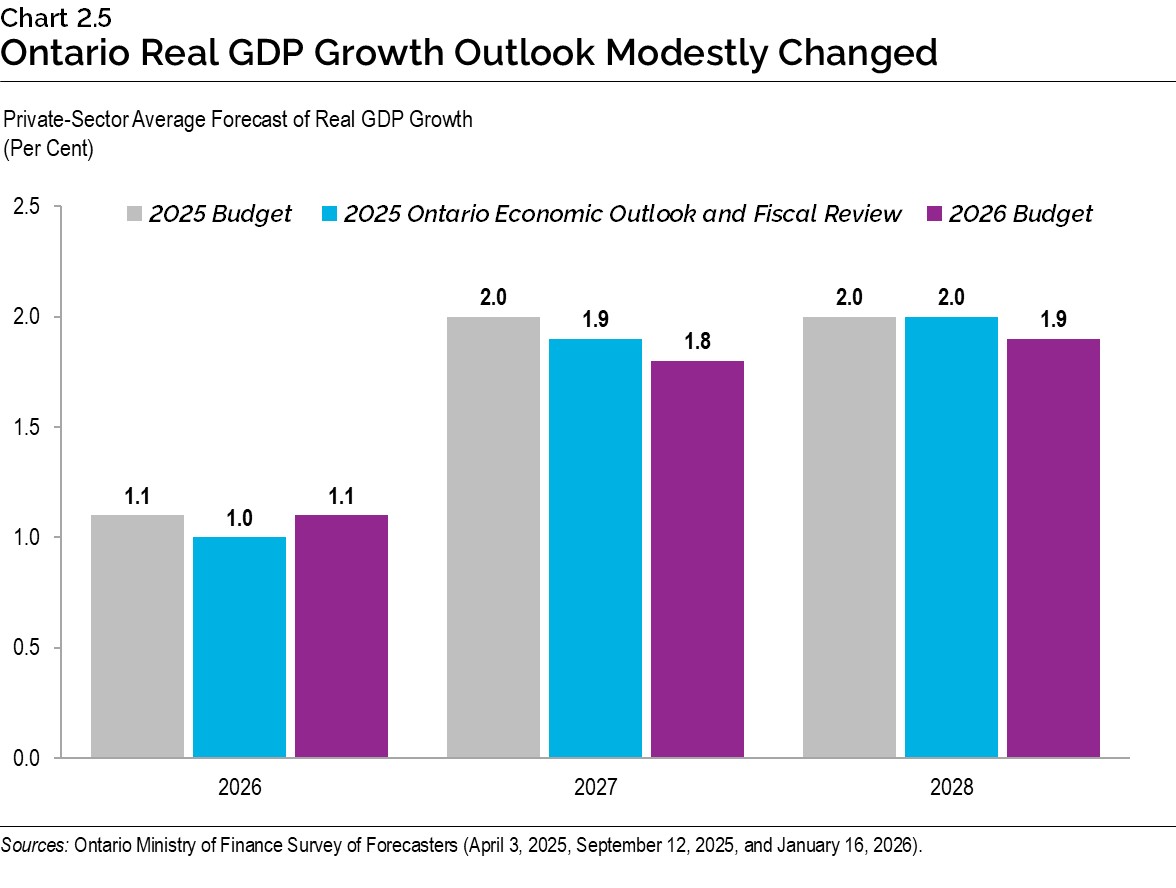
Despite heightened uncertainty around trade policy, the economic outlook for Ontario has been little changed. Compared to the 2025 Budget, the private-sector average of real GDP growth forecasts remained stable for 2026 but declined slightly for 2027 and 2028.
Global Economic Environment
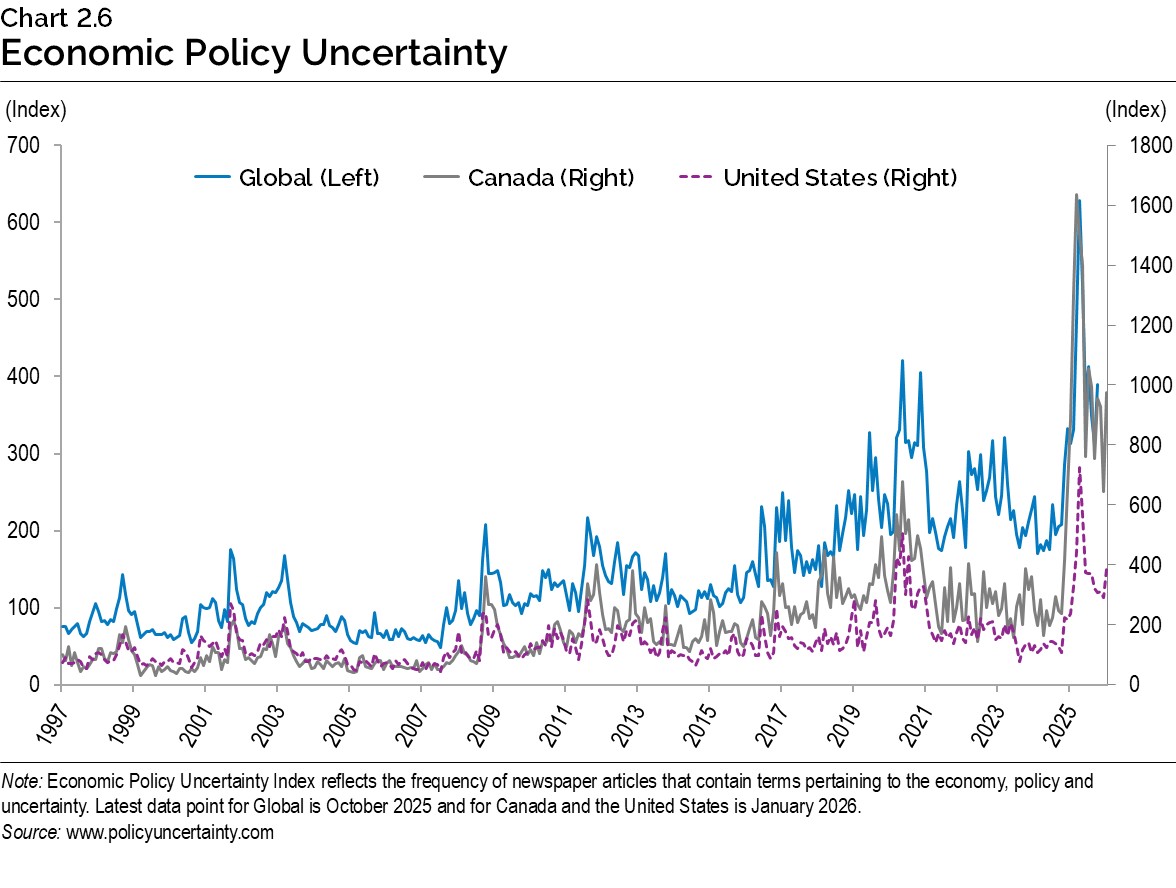
The global economic climate continues to be affected by heightened trade and geopolitical tensions, which have contributed to a sharp rise in the global economic policy uncertainty index, recently reaching its highest levels since 1997. In Canada, the level of policy uncertainty rose faster than in the United States and remains historically elevated despite recent moderation.
Global trade relationships remain unpredictable and volatile. The United States has continued to announce additional tariff increases on imports from most countries, alongside sector-specific tariffs on steel and aluminum, cars and parts, trucks, buses, timber and copper. The effects of higher tariffs are impacting consumer spending choices, business costs and consumer prices.
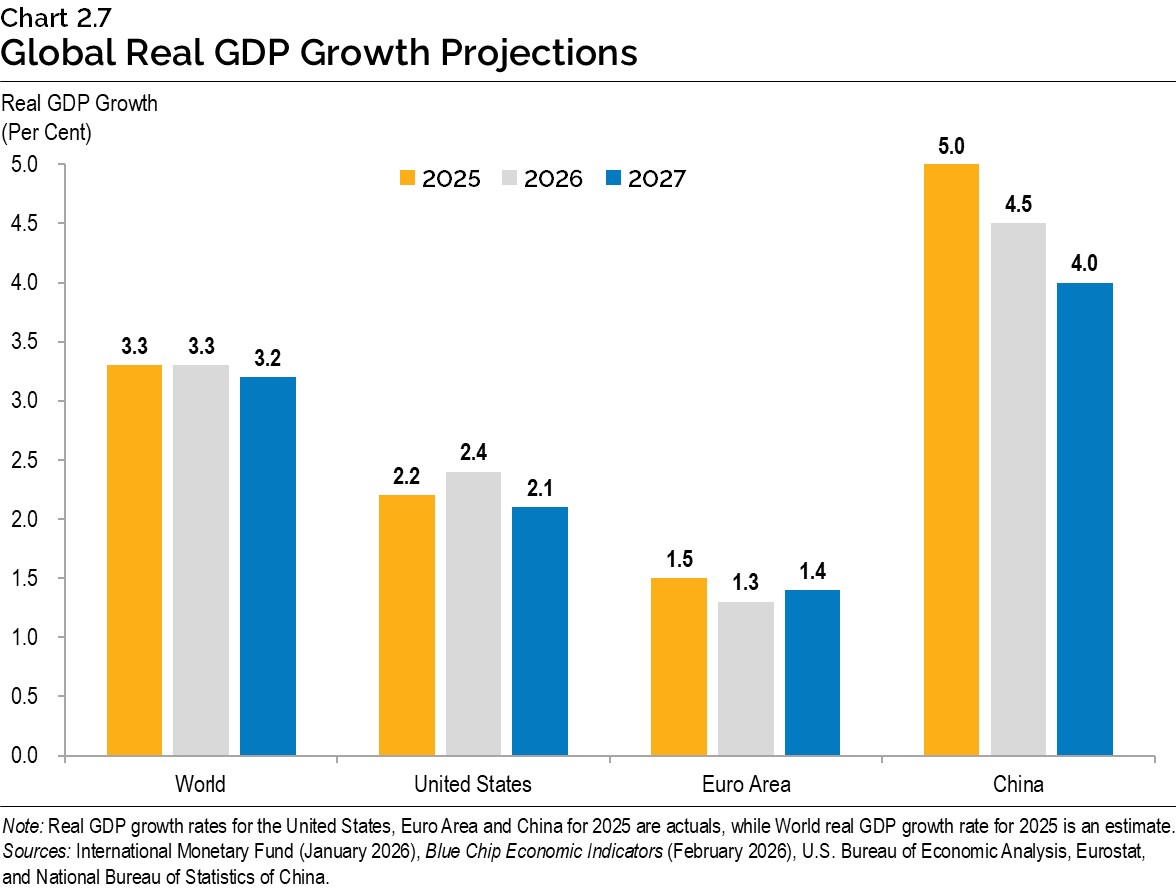
In its January World Economic Outlook Update, the International Monetary Fund (IMF) projects global growth to remain stable. The IMF projects global real GDP growth of 3.3 per cent in 2026 and 3.2 per cent in 2027. U.S. real GDP rose by 2.2 per cent in 2025 and according to Blue Chip Economic Indicators released in February 2026, it is projected to rise by 2.4 per cent in 2026 and 2.1 per cent in 2027. Compared to projections at the time of the 2025 Ontario Economic Outlook and Fiscal Review, U.S. real GDP growth is now estimated to be higher by 0.5 percentage points in 2025 and 0.9 percentage points in 2026. The upward revisions mainly reflect stronger investment and consumption. Euro area real GDP rose by 1.5 per cent in 2025 and the IMF projects growth to remain stable, easing to 1.3 per cent in 2026 before rising slightly to 1.4 per cent in 2027. China’s real GDP growth is expected to slow from 5.0 per cent in 2025 to 4.5 per cent in 2026 and 4.0 per cent in 2027.
Most major central banks have continued to ease their monetary policy as price inflation has been on a moderating trend. At the same time, inflation remains higher than the central bank targets in several economies. Looking forward, these central banks are likely to be faced with a difficult decision between lowering their policy interest rates to stimulate economic growth or undertake restrictive monetary policy in case inflationary pressures mount, including from trade tensions.
Financial Markets and Other External Factors
The Bank of Canada (the Bank) held its key policy interest rate, the target for the overnight rate, unchanged in January 2026, citing a broadly unchanged economic outlook since the fall, while noting that U.S. tariffs and uncertainty surrounding future trade arrangements continue to disrupt Canadian economic activity. The Bank has held its policy interest rate steady for two consecutive meetings. The target for the overnight rate is currently at the bottom of the Bank’s estimated “neutral range” of 2.25 to 3.25 per cent, a range that indicates the Bank’s monetary policy is not restricting economic growth. The Bank has indicated that heightened geopolitical uncertainty, and the upcoming review of the Canada–United States–Mexico Agreement (CUSMA), pose significant risks to the economic outlook.
With the overnight rate at the lower bound of the Bank’s estimated “neutral range,” private-sector forecasters largely expect the monetary policy easing cycle to be nearing its end. The Government of Canada three-month treasury bill rate was 2.6 per cent in 2025 and is projected to decline to 2.3 per cent in 2026. The rate is then expected to rise to 2.6 per cent in 2027, ease to 2.5 per cent in 2028 and return to 2.6 per cent in 2029.
Long-term interest rates began declining in mid-2025 as signs of economic cooling in the United States raised expectations for easing measures by the Federal Reserve. Since the fall, more resilient U.S. data, along with expectations for a more cautious Federal Reserve, helped long-term rates rise. Over the projection period, long-term rates are expected to change modestly, with the Government of Canada 10-year bond rate projected to slightly increase from 3.2 per cent in 2025 to 3.3 per cent in 2026, then rise further to 3.5 per cent in 2027, and remain stable at that rate through 2028 and 2029.
The West Texas Intermediate (WTI) crude oil price is projected to decline from US$65 per barrel in 2025 to US$59 per barrel in 2026. The price is expected to edge up to US$62 per barrel in 2027, before increasing gradually to US$67 and US$69 per barrel in 2028 and 2029, respectively. The Canadian dollar is projected to appreciate gradually from 71.6 cents US in 2025 to 73.2 cents US in 2026, before strengthening further to 75.3 cents US in 2027 and averaging 76.5 cents US in 2028 and 2029.
| Item | 2025 | 2026p | 2027p | 2028p | 2029p |
|---|---|---|---|---|---|
| World Real GDP Growth (Per Cent) | 3.3e | 3.3 | 3.2 | 2.6 | 2.5 |
| U.S. Real GDP Growth (Per Cent) | 2.2 | 2.4 | 2.1 | 2.0 | 1.9 |
| West Texas Intermediate (WTI) Crude Oil ($US per Barrel) | 65 | 59 | 62 | 67 | 69 |
| Canadian Dollar (Cents US) | 71.6 | 73.2 | 75.3 | 76.4 | 76.6 |
| Three-Month Treasury Bill Rate1 (Per Cent) | 2.6 | 2.3 | 2.6 | 2.5 | 2.6 |
| 10-Year Government Bond Rate2 (Per Cent) | 3.2 | 3.3 | 3.5 | 3.5 | 3.5 |
Table 2.5 footnotes:
e = estimate.
p = Ontario Ministry of Finance planning projection based on external sources.
[1], [2] Government of Canada interest rates.
Sources: International Monetary Fund World Economic Outlook Update (October 2025 and January 2026); U.S. Bureau of Economic Analysis; U.S. Energy Information Administration; Bank of Canada; Blue Chip Economic Indicators (October 2025 and February 2026); and Ontario Ministry of Finance Survey of Forecasters (January 16, 2026).
Details of Ontario’s Economic Outlook
The Ontario Ministry of Finance estimates that real GDP rose by 1.2 per cent in 2025 and is projected to rise by 1.0 per cent in 2026, 1.7 per cent in 2027, 1.8 per cent in 2028 and 2.0 per cent in 2029. Nominal GDP is estimated to have grown by 4.2 per cent in 2025 and is projected to rise by 3.2 per cent in 2026, 3.9 per cent in 2027, 3.7 per cent in 2028 and 3.9 per cent in 2029.
| Item | 2024 | 2025 | 2026p | 2027p | 2028p | 2029p |
|---|---|---|---|---|---|---|
| Real Gross Domestic Product | 1.6 | 1.2e | 1.0 | 1.7 | 1.8 | 2.0 |
| Nominal Gross Domestic Product | 5.1 | 4.2e | 3.2 | 3.9 | 3.7 | 3.9 |
| Compensation of Employees | 6.4 | 4.0e | 3.2 | 3.3 | 3.5 | 3.8 |
| Net Operating Surplus — Corporations | (1.1) | 4.4e | 4.7 | 7.2 | 6.1 | 6.0 |
| Nominal Household Consumption | 4.6 | 4.0e | 3.3 | 3.4 | 3.6 | 3.7 |
| Other Economic Indicators — Employment | 1.7 | 1.0 | 0.5 | 0.7 | 0.8 | 1.1 |
| Other Economic Indicators — Job Creation (000s) | 140 | 81 | 41 | 58 | 67 | 92 |
| Other Economic Indicators — Unemployment Rate (Per Cent) | 7.0 | 7.7 | 7.4 | 6.9 | 6.4 | 6.2 |
| Other Economic Indicators — Consumer Price Index | 2.4 | 1.9 | 2.1 | 2.0 | 2.0 | 2.0 |
| Other Economic Indicators — Housing Starts (000s)1 | 74.6 | 65.4 | 64.8 | 70.3 | 76.8 | 80.5 |
| Other Economic Indicators — Home Resales | 4.0 | (5.6) | 9.1 | 5.6 | 4.6 | 1.5 |
| Other Economic Indicators — Home Resale Prices | (1.2) | (4.4) | 0.8 | 2.7 | 4.2 | 4.0 |
| Key External Variables — U.S. Real Gross Domestic Product | 2.8 | 2.2 | 2.4 | 2.1 | 2.0 | 1.9 |
| Key External Variables — WTI Crude Oil ($US per Barrel) | 77 | 65 | 59 | 62 | 67 | 69 |
| Key External Variables — Canadian Dollar (Cents US) | 73.0 | 71.6 | 73.2 | 75.3 | 76.4 | 76.6 |
| Key External Variables — Three-Month Treasury Bill Rate (Per Cent)2 | 4.3 | 2.6 | 2.3 | 2.6 | 2.5 | 2.6 |
| Key External Variables — 10-Year Government Bond Rate (Per Cent)3 | 3.4 | 3.2 | 3.3 | 3.5 | 3.5 | 3.5 |
Table 2.6 footnotes:
e = estimate.
p = Ontario Ministry of Finance planning projection based on external sources as of January 16, 2026.
[1] Housing starts projection based on private-sector average as of January 16, 2026.
[2], [3] Government of Canada interest rates.
Sources: Statistics Canada; Canada Mortgage and Housing Corporation; Canadian Real Estate Association; Bank of Canada; United States Bureau of Economic Analysis; Blue Chip Economic Indicators (February 2026 and October 2025); U.S. Energy Information Administration; and Ontario Ministry of Finance.
Employment
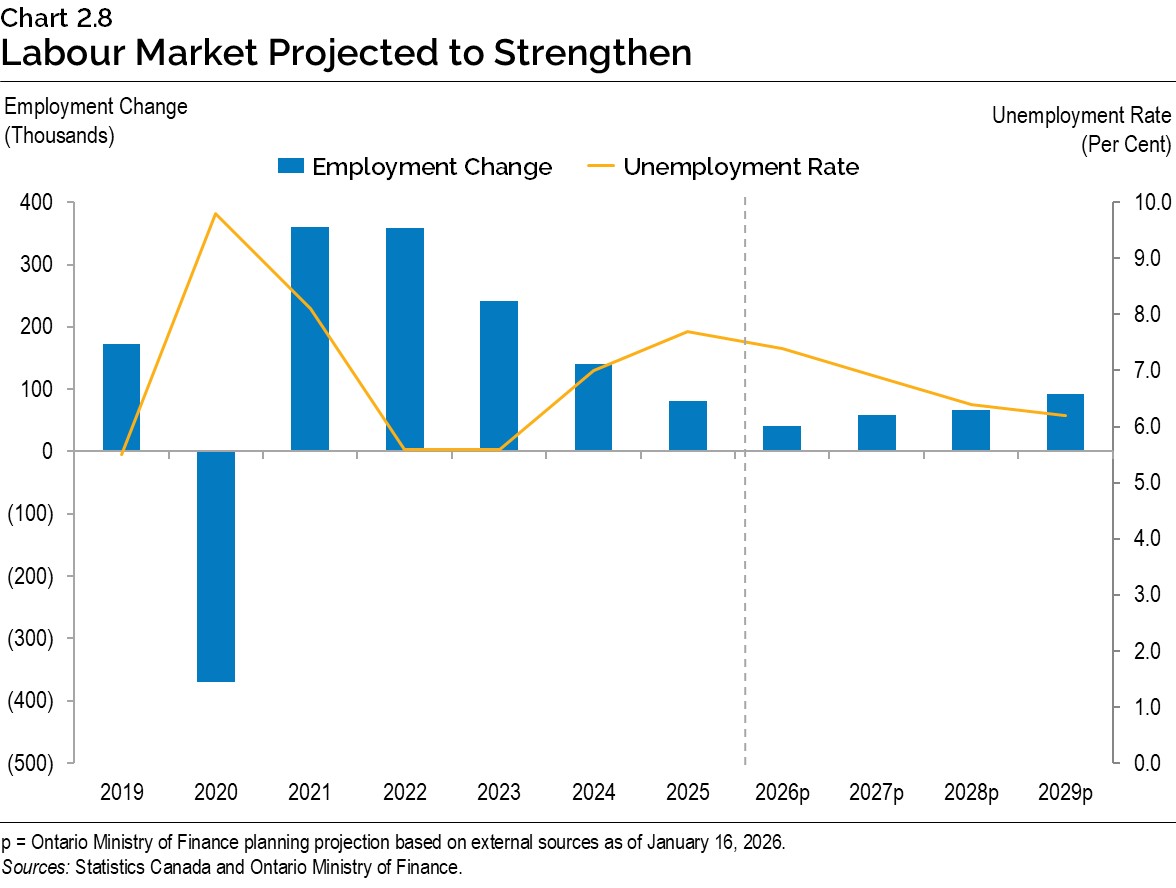
Slower economic growth and lower population growth due to changes in federal immigration policy are projected to contribute to a softer labour market in 2026. Ontario employment growth is also being impacted by ongoing trade conflicts and the effect of the associated uncertainty on investment and hiring. As these effects are projected to ease, employment growth is projected to rise to 0.7 per cent in 2027, 0.8 per cent in 2028 and 1.1 per cent in 2029. Slowing population growth and rising economic growth are projected to result in a decrease in the unemployment rate from 7.7 per cent in 2025 to 7.4 per cent in 2026, 6.9 per cent in 2027, 6.4 per cent in 2028 and 6.2 per cent in 2029.
Consumer Price Index
Inflationary pressures have broadly receded in recent months, with CPI inflation near the Bank of Canada’s 2 per cent target since September 2025. A modest near-term acceleration in inflation is expected, as the decline in energy prices starting last April due to the removal of the federal carbon tax ceases to factor into year-over-year price changes.
For planning purposes, the Ontario Ministry of Finance is projecting Ontario CPI inflation to be 2.1 per cent in 2026 before returning to the Bank’s 2 per cent inflation rate target over the medium‑term projection horizon. Ontario’s inflation outlook is influenced by a range of offsetting risks. Both trade tensions and global economic uncertainty could weigh on economic activity, potentially easing inflationary pressures in Ontario. Geopolitical developments and supply-chain disruptions could raise input costs and push inflation higher than expected. In addition, heightened geopolitical tensions may lift global commodity prices, adding upside risk to Ontario’s inflation trajectory.
Housing Market
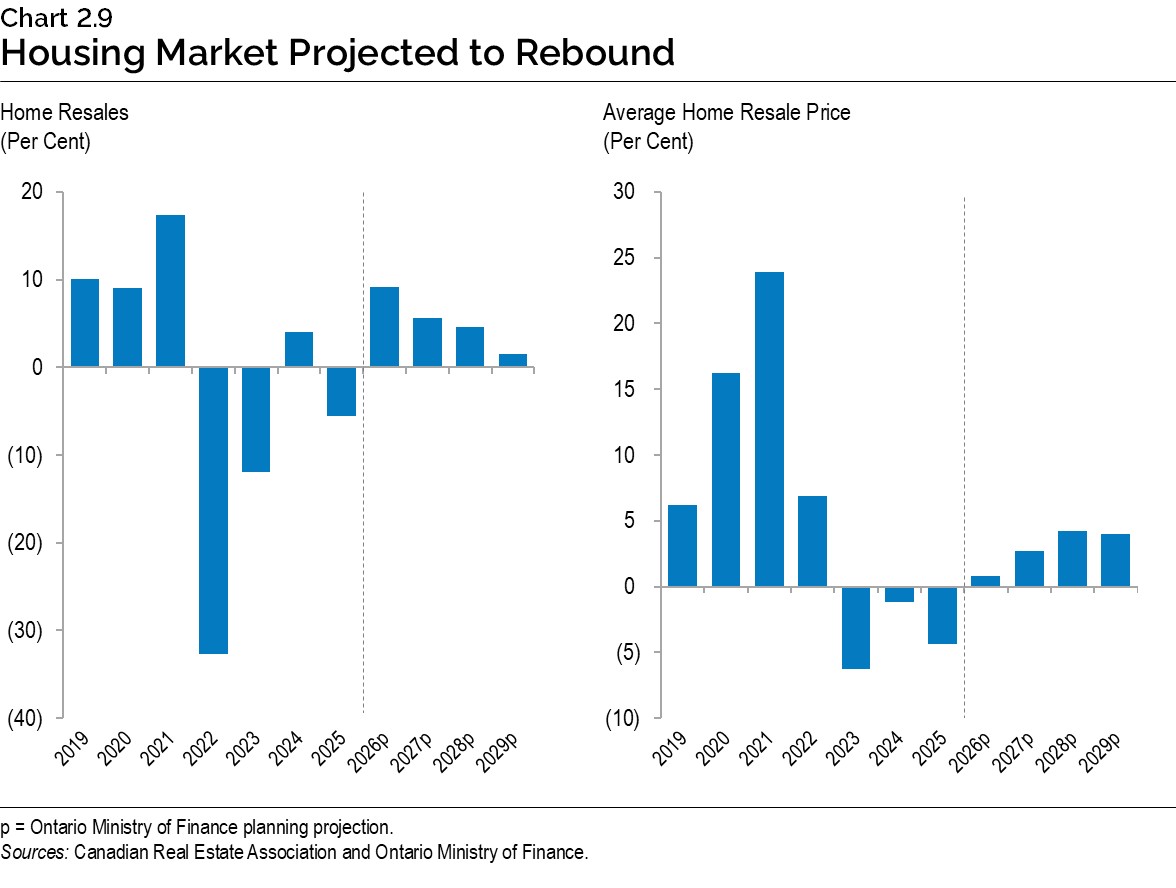
Economic uncertainty has weighed on Ontario’s housing market activity despite easing mortgage rates. Ontario home resales declined 5.6 per cent in 2025, the lowest volume of resales in over two decades. With home buyers holding off purchasing, inventory has risen relative to resales, contributing to a decline in the average home price. The average resale home price fell 4.4 per cent in 2025, marking the third consecutive annual decline in prices.
Looking ahead, home resales are projected to rebound, supported by pent-up demand and economic growth. Home resales are projected to grow 9.1 per cent in 2026, 5.6 per cent in 2027, 4.6 per cent in 2028 and 1.5 per cent in 2029. The average home resale price is expected to grow more gradually, rising 0.8 per cent in 2026, 2.7 per cent in 2027, 4.2 per cent in 2028 and 4.0 per cent in 2029.
Construction activity softened in 2025 and is expected to remain subdued in 2026 as private-sector forecasters continue to highlight the negative effects of economic uncertainty on homebuilding. Ontario housing starts are projected to moderate from 65,400 units in 2025 to 64,800 units in 2026, before increasing to 70,300 units in 2027, 76,800 in 2028 and 80,500 in 2029.
Risks to the Outlook
Global trade tensions and associated uncertainty constitute the main risks to Ontario’s economic outlook. Heightened trade tensions could continue to impact global supply chains and commodity markets, exerting upward pressure on inflation, dampening economic growth and raising volatility in financial markets. While Ontario and Canada have gradually started to adjust and diversify their trade to markets outside the United States, this adjustment could potentially take longer than expected. On the upside, efforts to reduce and eliminate interprovincial trade barriers, coupled with development of significant infrastructure projects, could help boost economic growth over the medium term.
The other significant source of risk is the upcoming review of CUSMA in 2026. Most of Canada’s exports are compliant with CUSMA, which has eased the impacts of announced U.S. tariffs. However, there is a wide range of possible outcomes related to the review in 2026. On the upside, the CUSMA review may result in a mutually favourable trade outcome between Canada and its trading partners that supports growth among trading partners. On the downside, the review may include negative policy adjustments, up to and including a possible withdrawal of member countries from the agreement.
A significant escalation in geopolitical tensions, particularly in the Middle East or Ukraine, but also possibly in Asia and Latin America, could disrupt major shipping routes, critical supply chains and air travel, leading to delays and increased costs.
A surge in investment in artificial intelligence (AI) has recently been a source of economic growth, particularly in the United States. Rising demand for new technologies, such as AI, could support renewed business expansion and contribute to increasing productivity growth. However, there is a risk that the prospects for AI are not as promising as expected and could lead to a correction in capital markets.
Alternative Economic Scenarios
The Ministry of Finance continues to develop scenarios to assess the potential impact of U.S. trade policy on Ontario’s economy over the projection period. As significant uncertainty remains regarding the international trade environment, these alternative scenarios should not be considered the best case or the worst case. Rather, they illustrate a broader range of possible outcomes.
The Faster Growth Scenario assumes that most tariffs and countermeasures imposed by the United States and Canada are removed in the near term. Under this scenario, Ontario’s economic output accelerates in 2026 and 2027 before moderating back to trend by 2028.
The Slower Growth Scenario assumes the United States withdraws from CUSMA. Under this scenario, the United States imposes tariffs at 12 per cent on Canada and Mexico and maintains the current Section 232 tariffs. Motor vehicle tariffs remain effectively at 12.5 per cent, while a similar tariff is applied to vehicle parts. Canada’s energy, potash and critical mineral exports remain exempt. Canada’s current retaliatory tariffs on the United States remain in place.
| Item | 2026p | 2027p | 2028p | 2029p |
|---|---|---|---|---|
| Faster Growth Scenario | 1.6 | 2.2 | 1.9 | 2.1 |
| Planning Projection | 1.0 | 1.7 | 1.8 | 2.0 |
| Slower Growth Scenario | 0.3 | 0.6 | 1.8 | 2.0 |
Table 2.7 footnotes:
p = Ontario Ministry of Finance planning projection based on external sources as of January 16, 2026, and alternative scenarios.
Source: Ontario Ministry of Finance.
| Item | 2026p | 2027p | 2028p | 2029p |
|---|---|---|---|---|
| Faster Growth Scenario | 4.0 | 4.6 | 4.0 | 4.2 |
| Planning Projection | 3.2 | 3.9 | 3.7 | 3.9 |
| Slower Growth Scenario | 2.3 | 2.6 | 3.5 | 3.7 |
Table 2.8 footnotes:
p = Ontario Ministry of Finance planning projection based on external sources as of January 16, 2026, and alternative scenarios.
Source: Ontario Ministry of Finance.
By 2029, the level of real GDP in the Faster Growth scenario is 1.4 per cent higher than in the Planning Projection, while in the Slower Growth scenario, the level of real GDP is 1.7 per cent lower. By 2029, the level of nominal GDP in the Faster Growth scenario is 2.0 per cent higher than in the Planning Projection, while in the Slower Growth scenario, the level of nominal GDP is 2.5 per cent lower.
Transparent Reporting on the Economy
The Ontario Economic Accounts provide a comprehensive overall assessment of the performance of Ontario’s economy. Private‐sector economists use this to assess the current state of the province’s economy and as a basis for updating their forecasts. The Ontario Economic Accounts help inform the government’s economic and revenue forecasts, providing a key foundation for Ontario’s fiscal plan.
The Fiscal Sustainability, Transparency and Accountability Act, 2019 states that the quarterly Ontario Economic Accounts shall be released within 45 days after the Statistics Canada release of the National Income and Expenditure Accounts.
In compliance with the legislation, the quarterly Ontario Economic Accounts will be released according to the schedule outlined in Table 2.9.
| Reference Period | Expected Statistics Canada Release of National Income and Expenditure Accounts |
Corresponding Deadline for Release of Ontario Economic Accounts |
|---|---|---|
| Fourth quarter (October-December) 2025 | February 27, 2026 | By April 13, 2026 |
| First quarter (January-March) 2026 | May 29, 2026 | By July 13, 2026 |
| Second quarter (April-June) 2026 | August 28, 2026 | By October 13, 2026 |
| Third quarter (July-September) 2026 | November 30, 2026 | By January 14, 2027 |
| Fourth quarter (October-December) 2026 | March 1, 2027 | By April 15, 2027 |
Table 2.9 footnotes:
Sources: Statistics Canada and Ontario Ministry of Finance.
Chart Descriptions
Chart 2.1: Ontario Exports of Goods and Services
The line graph shows Ontario’s quarterly exports of goods and services from 2007 to 2025, expressed in billions of 2017 dollars. Three boxes identify notable periods, beginning from the leftmost part of the timeline: the 2008–09 global financial crisis, the COVID‑19 pandemic period, and the introduction of U.S. tariff measures in 2025.
Note: Latest data point is the third quarter of 2025.
Source: Ontario Ministry of Finance.
Chart 2.2: Ontario Employment Growth in 2025
This bar chart illustrates the change in Ontario employment in 2025 by sector. Changes in 2025 are as follows: Total employment increased by 80,900; Private-sector employment increased by 77,300; Public-sector employment decreased by 1,300; Self-employment increased by 4,800; Full-time employment increased by 40,600; Part-time employment increased by 40,300; Goods sector employment decreased by 8,000; and Service sector employment increased by 88,800.
Note: Numbers may not add due to rounding.
Source: Statistics Canada.
Chart 2.3: Inflation Continues to Moderate in 2025
This chart shows components of Ontario CPI inflation as stacked bars and annual CPI inflation between 2018 to 2025 as a solid black line. The components of Ontario CPI inflation are food, energy, shelter (excluding energy) and other. Ontario CPI inflation is as follows: 2.4 per cent in 2018; 1.9 per cent in 2019; 0.7 per cent in 2020; 3.5 per cent in 2021; 6.8 per cent in 2022; 3.8 per cent in 2023; 2.4 per cent in 2024; and 1.9 per cent in 2025.
Sources: Statistics Canada and Ontario Ministry of Finance.
Chart 2.4: Ontario Real GDP Growth Outperformed Expectations in 2025
This bar chart shows Ontario real GDP growth projection from the 2025 Budget compared to the estimate in the 2026 Budget. Ontario real GDP growth outperformed expectations by rising an estimated 1.2 per cent, up from 0.8 per cent in the 2025 Budget.
Source: Ontario Ministry of Finance.
Chart 2.5: Ontario Real GDP Growth Outlook Modestly Changed
This bar chart shows private-sector average forecast of real GDP growth in Ontario for 2026 to 2028 by comparing forecasts from the 2025 Budget, 2025 Ontario Economic Outlook and Fiscal Review and 2026 Budget.
In the 2025 Budget, private-sector forecasters, on average, projected that Ontario’s real GDP would grow by 1.1 per cent in 2026, 2.0 per cent in 2027 and 2.0 per cent in 2028. In the 2025 Ontario Economic Outlook and Fiscal Review, private-sector forecasters, on average, projected that Ontario’s real GDP would grow by 1.0 per cent in 2026, 1.9 per cent in 2027 and 2.0 per cent in 2028. In the 2026 Budget, private-sector forecasters, on average, are projecting that Ontario’s real GDP will grow by 1.1 per cent in 2026, 1.8 per cent in 2027 and 1.9 per cent in 2028.
Sources: Ontario Ministry of Finance Survey of Forecasters (April 3, 2025, September 12, 2025 and January 16, 2026).
Chart 2.6: Economic Policy Uncertainty
This line chart shows the monthly series of the economic policy uncertainty index at the global level (represented by the left-hand side axis), as well as Canada and the United States (both countries represented by the right-hand side axis). All three series increased sharply in early 2025, reaching their highest levels since 1997. In Canada, the level of policy uncertainty rose faster than in the United States. Uncertainty remains elevated despite recent moderation.
Note: Economic Policy Uncertainty Index reflects the frequency of newspaper articles that contain terms pertaining to the economy, policy and uncertainty. Latest data point for Global is October 2025 and for Canada and the United States is January 2026.
Source: www.policyuncertainty.com
Chart 2.7: Global Real GDP Growth Projections
This bar chart shows real GDP growth in per cent for 2025, 2026 and 2027 for the world economy, the United States, the Euro area and China. Real GDP growth rates for the United States, Euro area and China for 2025 are actuals, while the rate for the world economy is an estimate. Growth rates for 2026 and 2027 are projections. Actual, estimated and projected real GDP growth in 2025, 2026 and 2027 is 3.3 per cent, 3.3 per cent and 3.2 per cent for the world economy; 2.2 per cent, 2.4 per cent and 2.1 per cent in the United States; 1.5 per cent, 1.3 per cent and 1.4 per cent in the Euro area; and 5.0 per cent, 4.5 per cent and 4.0 per cent in China.
Note: Real GDP growth rates for the United States, Euro Area and China for 2025 are actuals, while World real GDP growth rate for 2025 is an estimate.
Sources: International Monetary Fund (January 2026), Blue Chip Economic Indicators (February 2026), U.S. Bureau of Economic Analysis, Eurostat and National Bureau of Statistics of China.
Chart 2.8: Labour Market Projected to Strengthen
This chart shows Ontario’s annual employment gains and unemployment rate from 2019 to 2025 and projections for 2026 to 2029.
The bars show the annual change in Ontario’s employment. There was an increase in employment of 173,000 in 2019 and then a decline of 370,000 in 2020. Employment grew by around 360,000 in both 2021 and 2022 and then slowed to 242,000 in 2023, 140,000 in 2024 and 81,000 in 2025. Employment gains are forecast to be 41,000 in 2026, 58,000 in 2027, 67,000 in 2028 and 92,000 in 2029.
The line shows Ontario’s unemployment rate. The unemployment rate increased from 5.5 per cent in 2019 to 9.8 per cent in 2020 and 8.1 per cent in 2021. The unemployment rate decreased to 5.6 per cent in 2022 and remained at 5.6 per cent in 2023, before rising to 7.0 per cent in 2024 and 7.7 per cent in 2025. The unemployment rate is forecast to be 7.4 per cent in 2026, 6.9 per cent in 2027, 6.4 per cent in 2028 and 6.2 per cent in 2029.
Note: Projections for 2026 to 2029 are the Ontario Ministry of Finance planning projection based on external sources as of January 16, 2026.
Sources: Statistics Canada and Ontario Ministry of Finance.
Chart 2.9: Housing Market Projected to Rebound
The left bar chart shows Ontario’s annual home resale growth rates from 2019 to 2025 and projections for 2026 to 2029. Ontario home resales increased 10.1 per cent in 2019, 9.0 per cent in 2020 and 17.3 per cent in 2021, decreased 32.7 per cent in 2022 and 12.0 per cent in 2023, and increased 4.0 per cent in 2024 before decreasing 5.6 per cent in 2025. Ontario home resales are projected to increase 9.1 per cent in 2026, 5.6 per cent in 2027, 4.6 per cent in 2028 and 1.5 per cent in 2029.
The right bar chart shows Ontario’s annual average home resale price growth rates from 2019 to 2025 and projections for 2026 to 2029. Ontario’s average home resale price increased 6.2 per cent in 2019, 16.2 per cent in 2020, 23.9 per cent in 2021 and 6.9 per cent in 2022, and decreased 6.3 per cent in 2023, 1.2 per cent in 2024 and 4.4 per cent in 2025. The average home resale price is projected to increase 0.8 per cent in 2026, 2.7 per cent in 2027, 4.2 per cent in 2028 and 4.0 per cent in 2029.
Sources: Canadian Real Estate Association and Ontario Ministry of Finance.
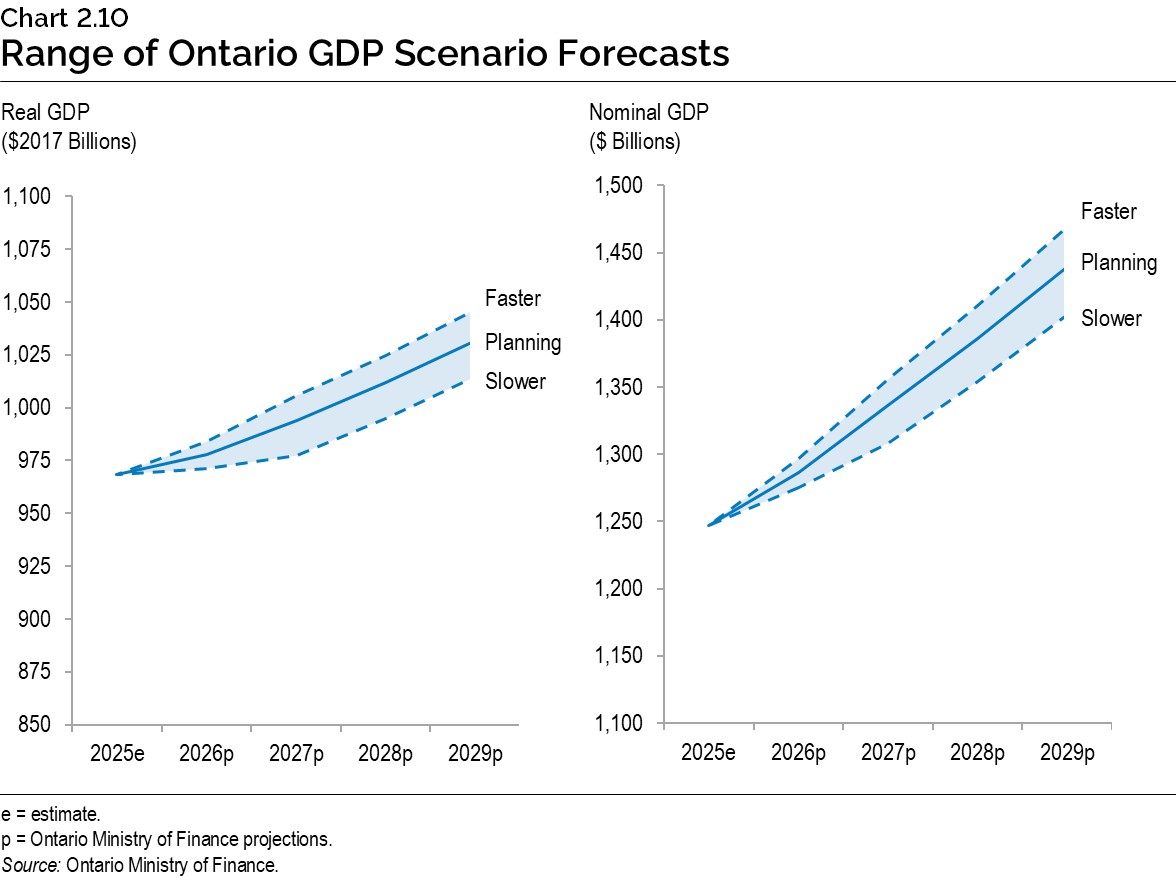
Chart 2.10: Range of Ontario GDP Scenario Forecasts
The line chart on the left shows Ontario real GDP estimate in 2025 and the Ontario Ministry of Finance planning projection for real GDP from 2026 to 2029, in billions of 2017 dollars. Separate lines show the levels of real GDP in the Faster Growth and the Slower Growth scenarios for 2026 to 2029. Ontario real GDP was estimated to be $968 billion in 2025. In the Planning Projection, Ontario real GDP is projected to rise from $978 billion in 2026 to $1,032 billion in 2029. In the Faster Growth scenario, Ontario real GDP is projected to rise from $984 billion in 2026 to $1,046 billion in 2029. In the Slower Growth scenario, Ontario real GDP is projected to rise from $971 billion in 2026 to $1,015 billion in 2029.
The line chart on the right shows Ontario nominal GDP estimate in 2025 and the Ontario Ministry of Finance planning projection for nominal GDP from 2026 to 2029, in billions of dollars. Separate lines show the levels of nominal GDP in the Faster Growth and the Slower Growth scenarios for 2026 to 2029. Ontario nominal GDP was $1,247 billion in 2025. In the Planning Projection, Ontario nominal GDP is projected to rise from $1,287 billion in 2026 to $1,440 billion in 2029. In the Faster Growth scenario, Ontario nominal GDP is projected to rise from $1,297 billion in 2026 to $1,469 billion in 2029. In the Slower Growth scenario, Ontario nominal GDP is projected to rise from $1,275 billion in 2026 to $1,404 billion in 2029.
Source: Ontario Ministry of Finance.
Footnotes
[1] Statistics Canada, “United States Tariffs and Canadian Labour Market Trends” (2025), https://www150.statcan.gc.ca/n1/pub/ 75-006-x/2025003/article/00004-eng.htm
[2] The three experts are from the Policy and Economic Analysis Program at the University of Toronto; Quantitative Economic Decisions, Inc. (QEDinc.); and Stokes Economics Consulting, Inc.