Introduction
Ontario’s economy has shown resilience so far in 2026 but continues to be impacted by heightened economic uncertainty amid ongoing U.S. trade and tariff tensions and geopolitical conflicts.
Ontario’s real gross domestic product (GDP) is projected to grow by 0.5 per cent in 2026 and is expected to pick up in subsequent years, with increases of 1.5 per cent in 2027, 1.8 per cent in 2028 and 2.0 per cent in 2029. For the purposes of prudent fiscal planning, these projections are set slightly below the average of private‐sector forecasts.
| Item | 2025 | 2026p | 2027p | 2028p | 2029p |
|---|---|---|---|---|---|
| Real GDP Growth | 1.3 | 0.5 | 1.5 | 1.8 | 2.0 |
| Nominal GDP Growth | 4.1 | 3.7 | 3.8 | 3.9 | 4.0 |
| Employment Growth | 1.0 | 0.4 | 0.6 | 0.7 | 1.2 |
| CPI Inflation | 1.9 | 2.3 | 2.1 | 2.0 | 2.0 |
Table 2.1 footnotes:
p = Ontario Ministry of Finance planning projection based on external sources as of September 11, 2026.
Sources: Statistics Canada and Ontario Ministry of Finance.
Revisions to the Economic Outlook Since the 2026 Budget
The outlook has been revised compared to the projections in the 2026 Budget. Key changes since the 2026 Budget include the following:
- Lower real GDP growth in 2026 and 2027;
- Stronger growth in nominal GDP and its drivers in 2026, including compensation of employees, net operating surplus of corporations and nominal household consumption; and
- Lower unemployment rate over the projection period.
| Item | 2026p 2026 Budget |
2026p 2026 FES |
2027p 2026 Budget |
2027p 2026 FES |
2028p 2026 Budget |
2028p 2026 FES |
2029p 2026 Budget |
2029p 2026 FES |
|---|---|---|---|---|---|---|---|---|
| Real Gross Domestic Product | 1.0 | 0.5 | 1.7 | 1.5 | 1.8 | 1.8 | 2.0 | 2.0 |
| Nominal Gross Domestic Product | 3.2 | 3.7 | 3.9 | 3.8 | 3.7 | 3.9 | 3.9 | 4.0 |
| Compensation of Employees | 3.2 | 3.4 | 3.3 | 3.0 | 3.5 | 3.1 | 3.8 | 3.8 |
| Net Operating Surplus — Corporations | 4.7 | 7.9 | 7.2 | 6.9 | 6.1 | 6.4 | 6.0 | 5.7 |
| Nominal Household Consumption | 3.3 | 3.6 | 3.4 | 3.2 | 3.6 | 3.4 | 3.7 | 3.8 |
| Other Economic Indicators — Employment | 0.5 | 0.4 | 0.7 | 0.6 | 0.8 | 0.7 | 1.1 | 1.2 |
| Other Economic Indicators — Job Creation (000s) | 41 | 33 | 58 | 50 | 67 | 58 | 92 | 104 |
| Other Economic Indicators — Unemployment Rate (Per Cent) | 7.4 | 7.2 | 6.9 | 6.7 | 6.4 | 6.3 | 6.2 | 6.1 |
| Other Economic Indicators — Consumer Price Index | 2.1 | 2.3 | 2.0 | 2.1 | 2.0 | 2.0 | 2.0 | 2.0 |
| Other Economic Indicators — Housing Starts (000s)1 | 64.8 | 64.7 | 70.3 | 65.1 | 76.8 | 71.7 | 80.5 | 75.4 |
| Other Economic Indicators — Home Resales | 9.1 | (0.7) | 5.6 | 7.8 | 4.6 | 5.1 | 1.5 | 5.3 |
| Other Economic Indicators — Home Resale Prices | 0.8 | (2.4) | 2.7 | 1.4 | 4.2 | 4.2 | 4.0 | 4.6 |
| Key External Variables — U.S. Real Gross Domestic Product | 2.4 | 2.1 | 2.1 | 2.0 | 2.0 | 2.0 | 1.9 | 2.0 |
| Key External Variables — WTI Crude Oil ($US per Barrel) | 59 | 83 | 62 | 74 | 67 | 70 | 69 | 71 |
| Key External Variables — Canadian Dollar (Cents US) | 73.2 | 72.3 | 75.3 | 73.7 | 76.4 | 74.6 | 76.6 | 75.1 |
| Key External Variables — Three-Month Treasury Bill Rate (Per Cent)2 | 2.3 | 2.3 | 2.6 | 2.5 | 2.5 | 2.6 | 2.6 | 2.6 |
| Key External Variables — 10-Year Government Bond Rate (Per Cent)3 | 3.3 | 3.5 | 3.5 | 3.6 | 3.5 | 3.6 | 3.5 | 3.6 |
Table 2.2 footnotes:
p = Ontario Ministry of Finance planning projection based on external sources as of September 11, 2026.
[1] Housing starts projection based on private-sector average as of September 11, 2026.
[2], [3] Government of Canada interest rates.
Sources: Statistics Canada; Canada Mortgage and Housing Corporation; Canadian Real Estate Association; Bank of Canada; United States Bureau of Economic Analysis; Blue Chip Economic Indicators; U.S. Energy Information Administration; and Ontario Ministry of Finance.
Recent Economic Performance
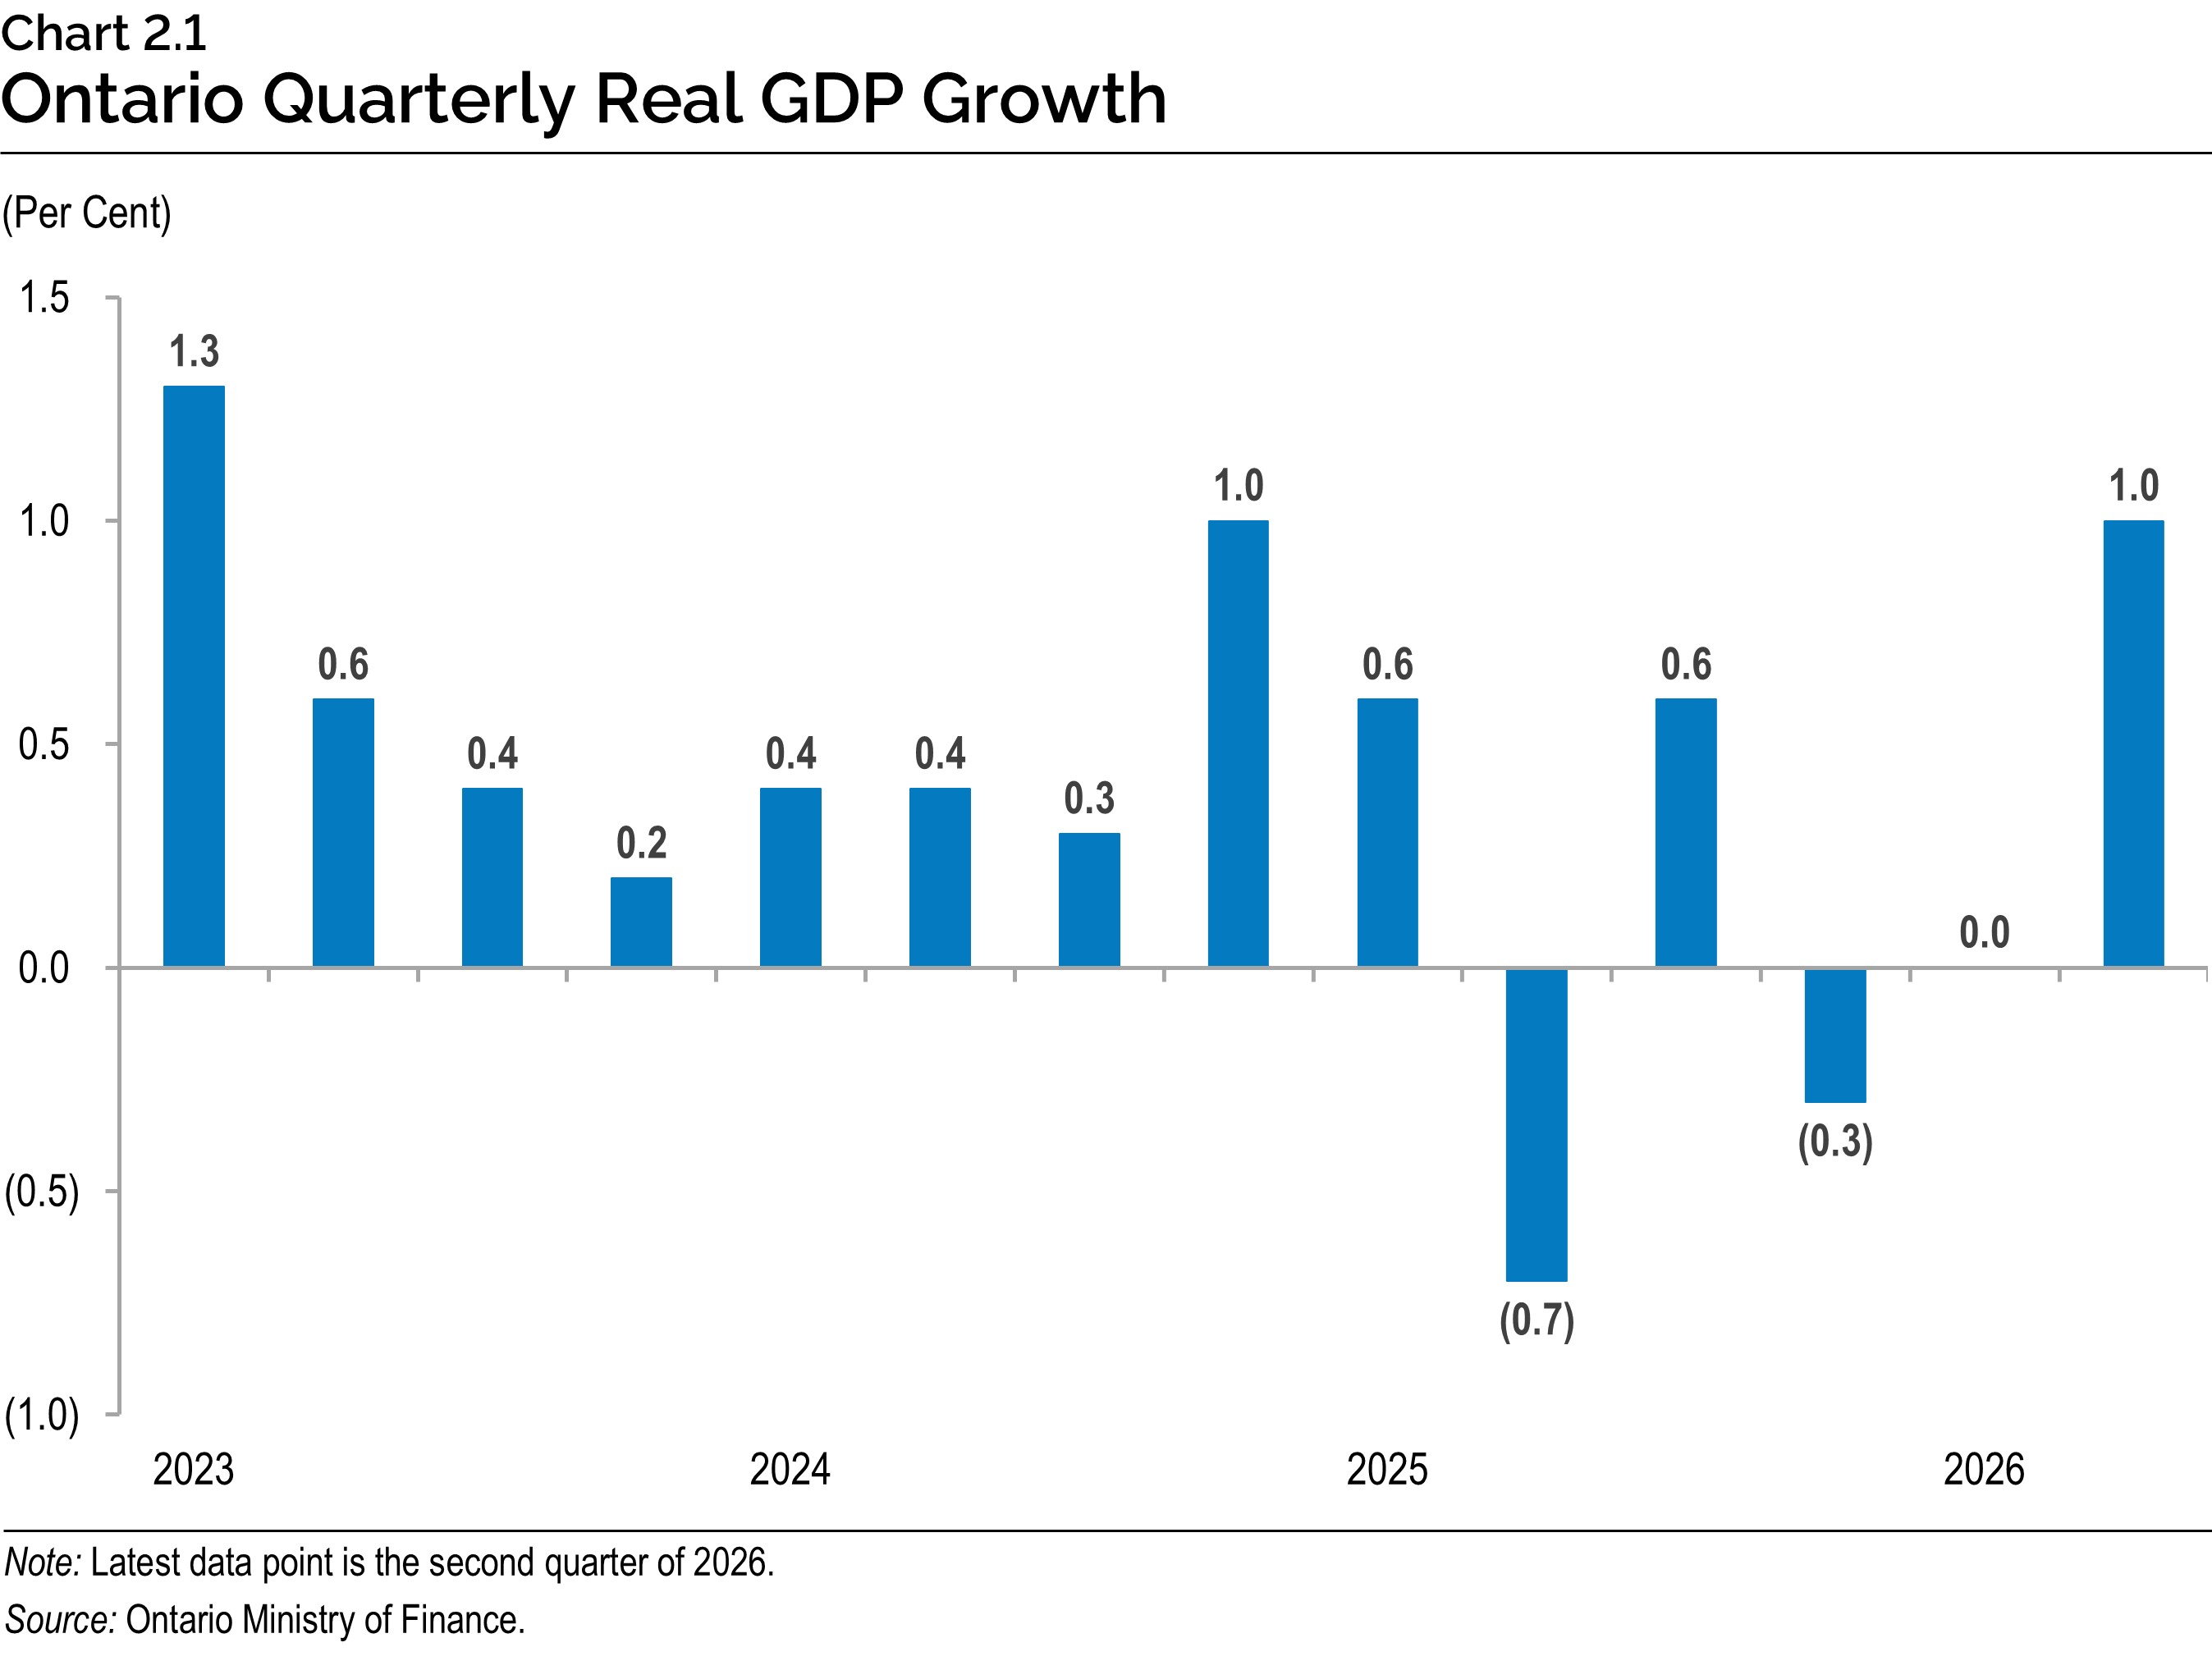
Despite ongoing trade and geopolitical uncertainty, Ontario’s real GDP grew by 1.0 per cent in the second quarter, after remaining unchanged in the first quarter of the year. Exports were a primary driver of growth, in part due to stronger automotive exports. Second quarter growth was also supported by gains in household spending and business investment.
Ontario Labour Market
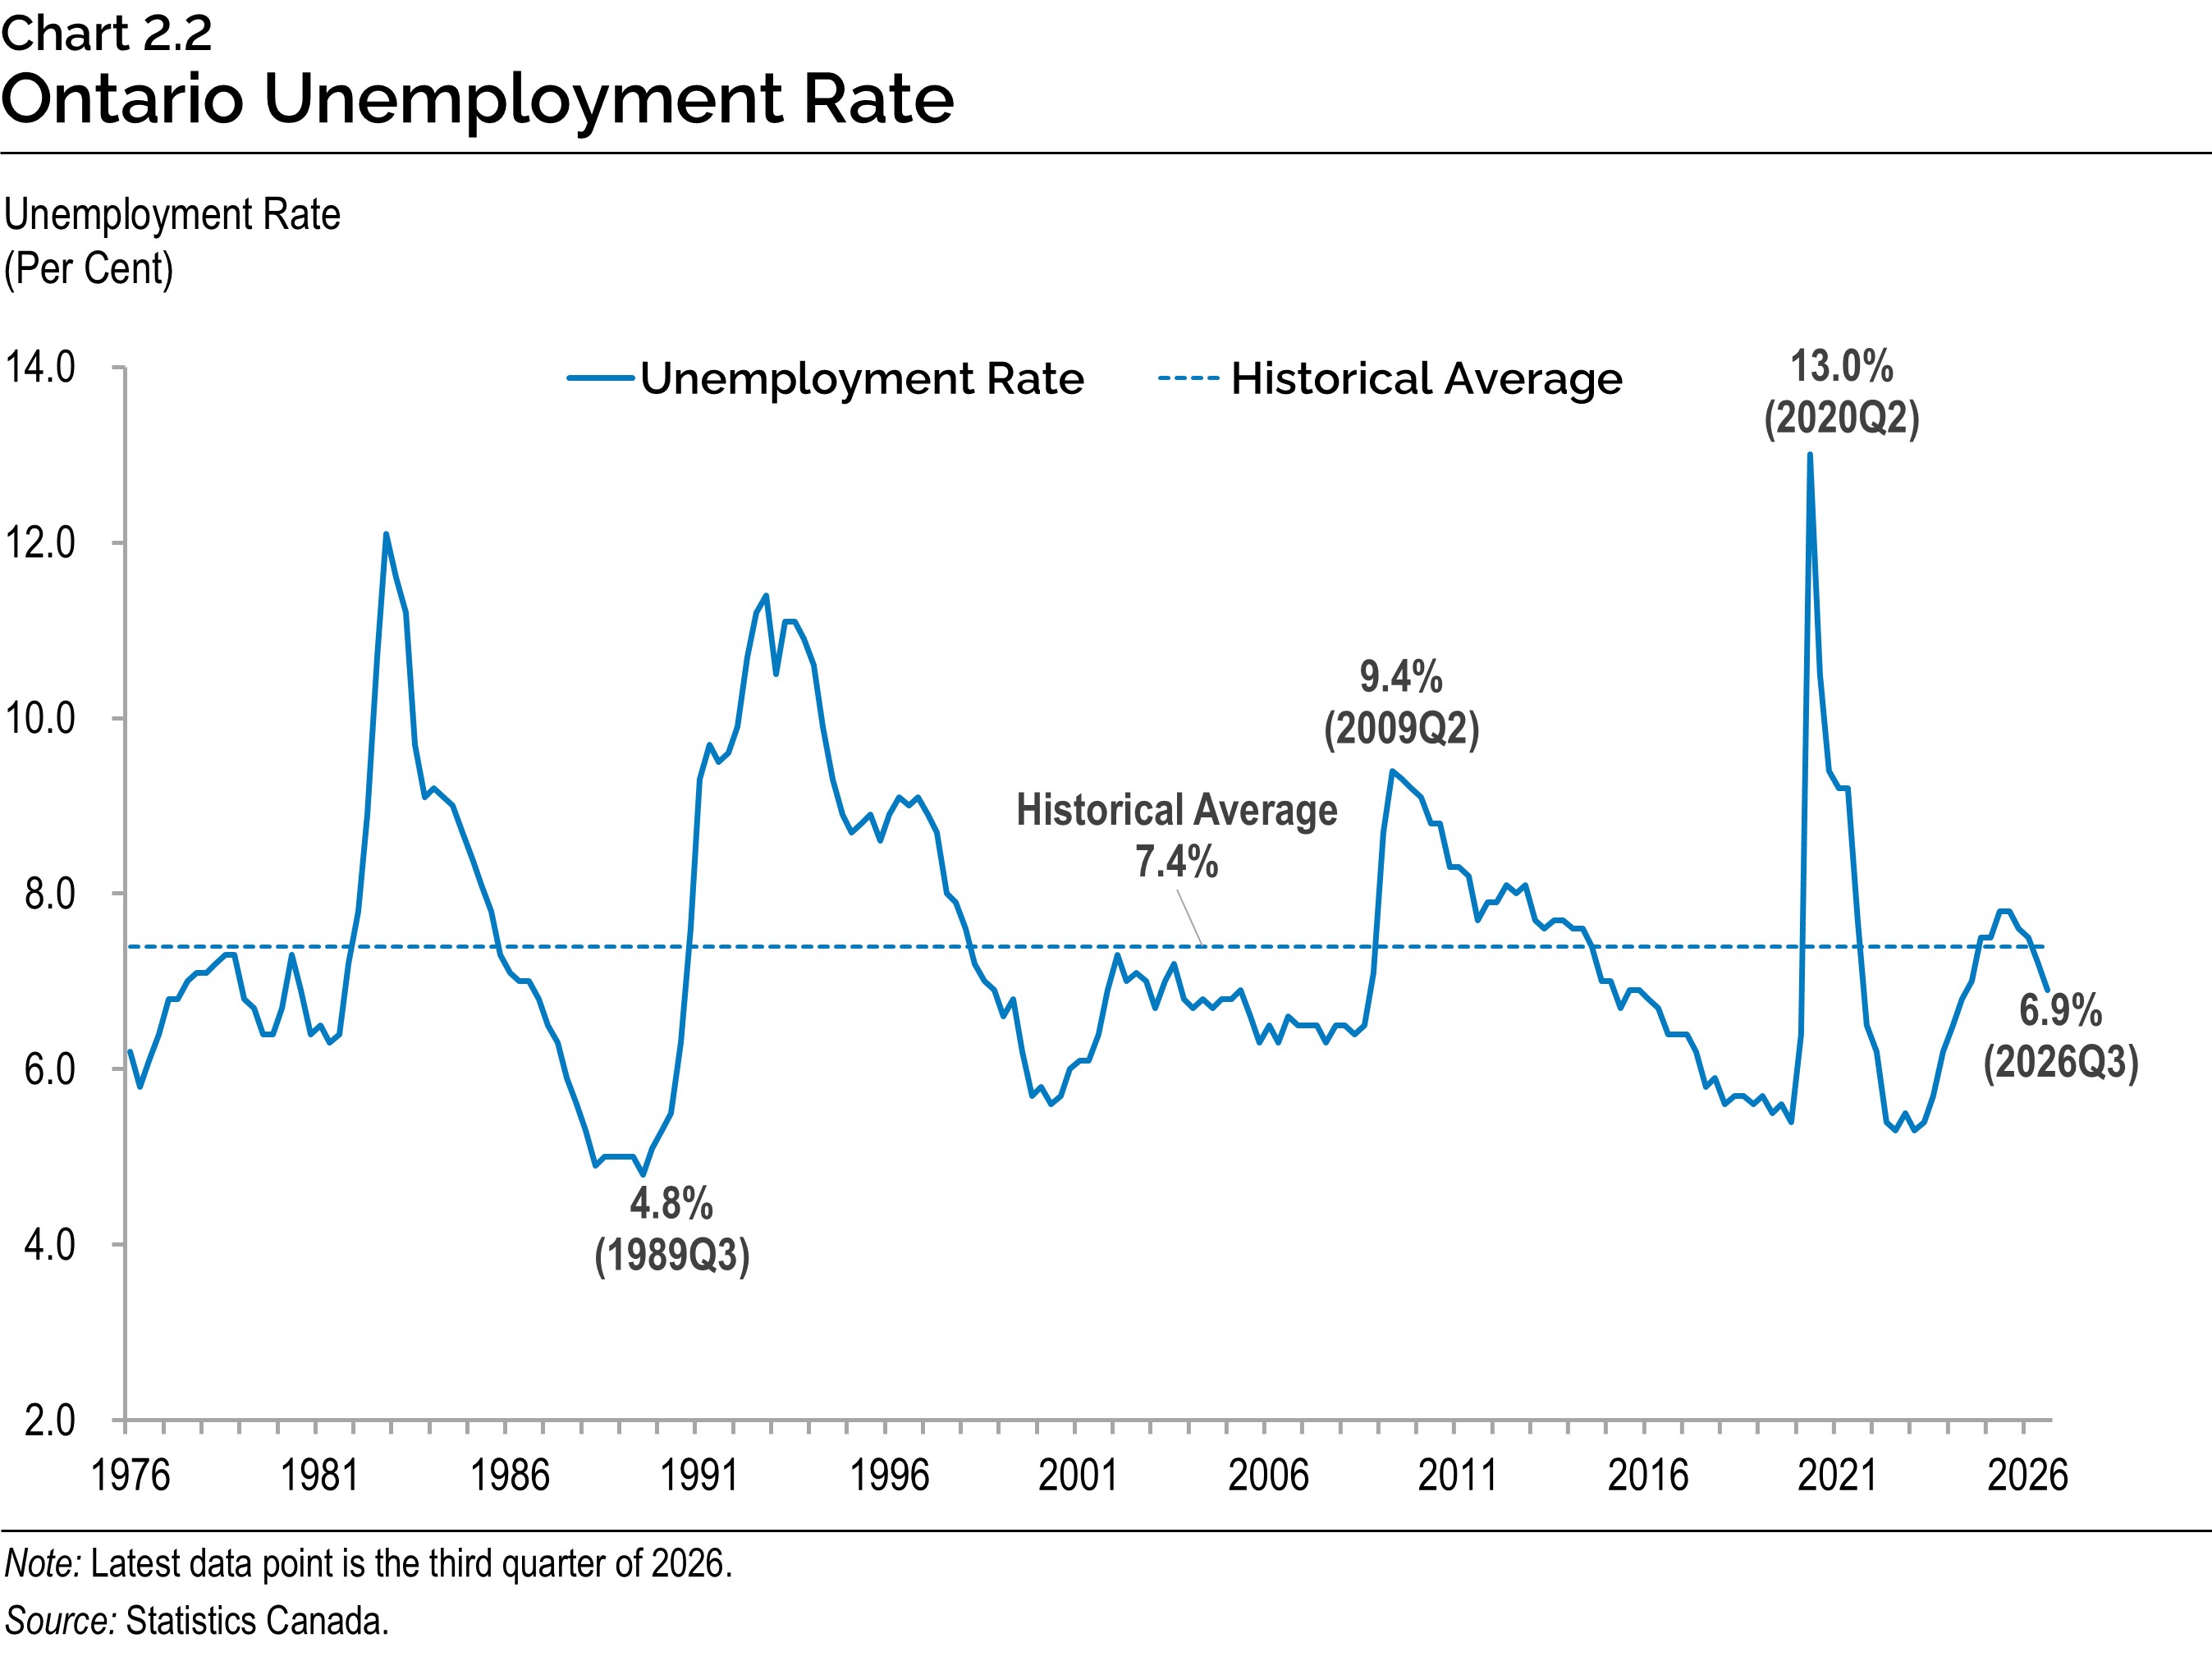
Ontario’s labour market has remained resilient despite ongoing economic uncertainty. Following a decline of 53,000 jobs in the first quarter of 2026, employment rebounded by 62,000 in the second quarter and by a further 36,000 in the third quarter. Employment gains so far in 2026 have been concentrated in full-time positions and in the private sector.
Ontario’s unemployment rate has been trending downward recently. As of the third quarter of 2026, the unemployment rate averaged 6.9 per cent, the lowest since the second quarter of 2024.
Consumer Price Inflation
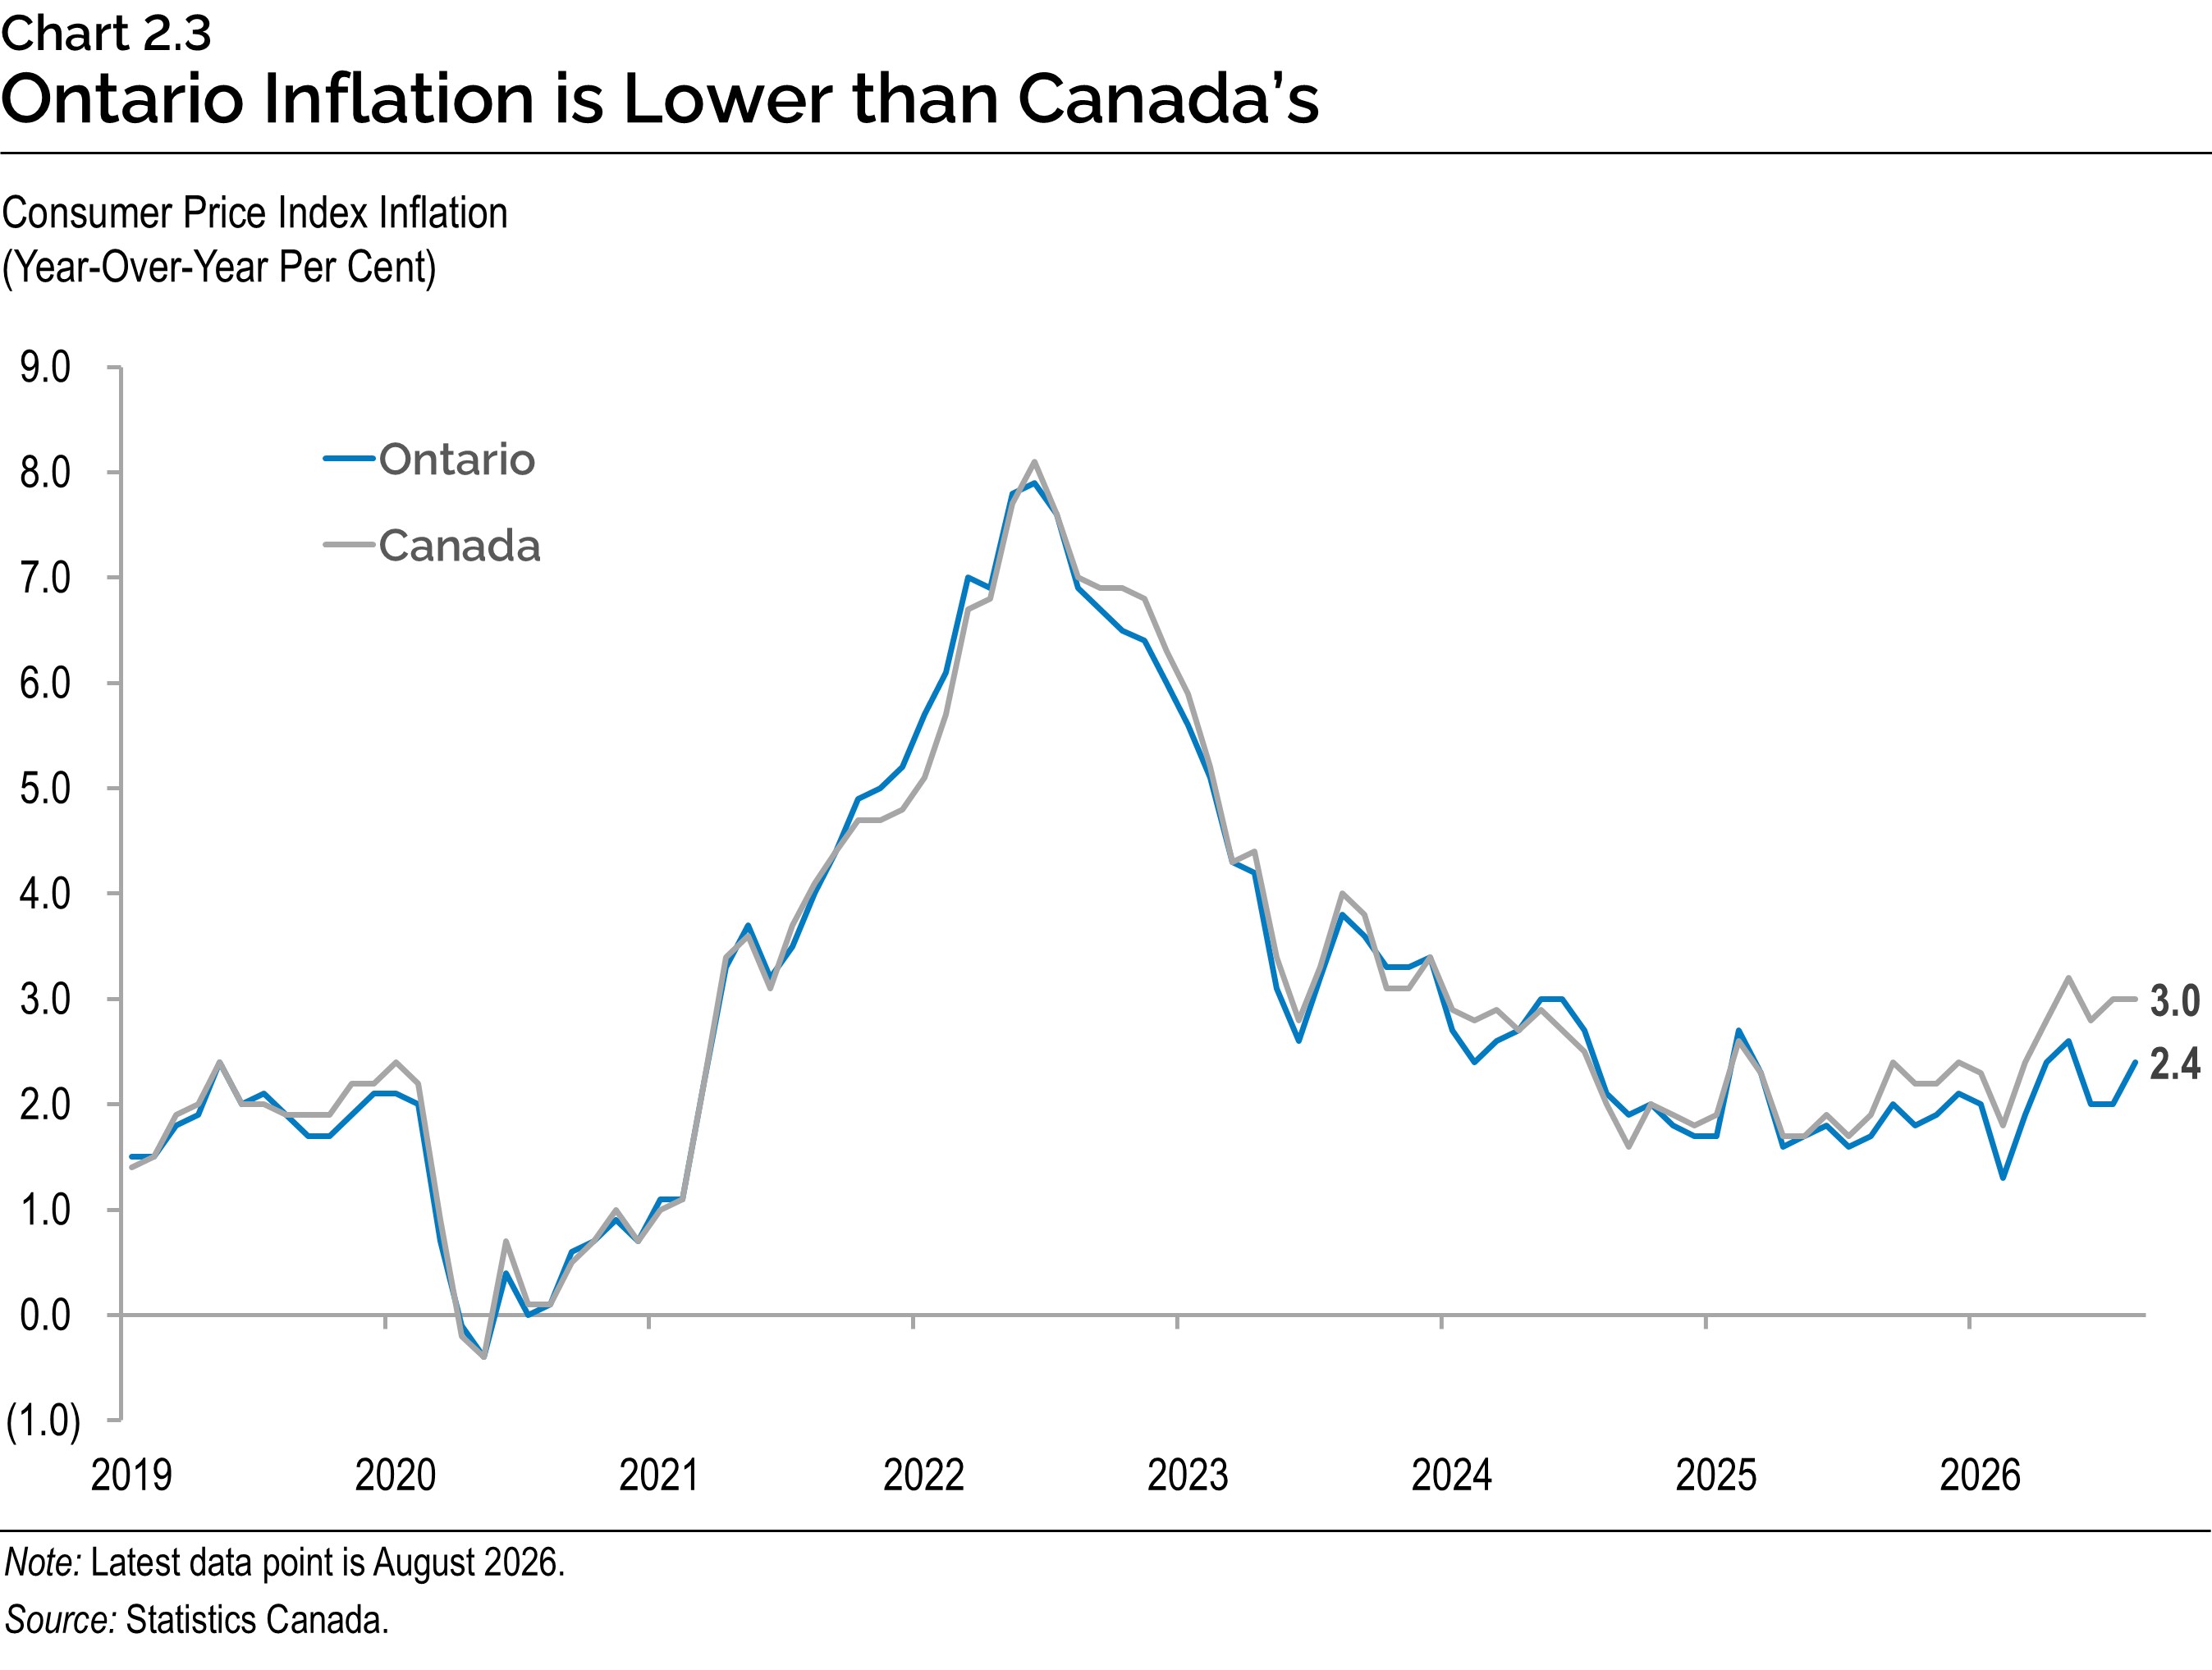
Ontario’s Consumer Price Index (CPI) inflation was 2.4 per cent (year-over-year) in August 2026, following an increase of 2.0 per cent in the previous two months. Inflation in Ontario has remained below the national rate since April 2025.
Higher energy prices have put upward pressure on inflation for most of 2026, as the conflict in the Middle East continues to impact fuel prices. Shelter prices have helped to moderate inflation, mainly reflecting an easing in owned accommodation prices.
Economic Outlook
The Ontario Ministry of Finance regularly consults with private-sector economists while tracking their forecasts to inform the government’s planning assumptions.
Private-sector forecasters, on average, are projecting that Ontario’s real GDP will grow by 0.6 per cent in 2026, 1.6 per cent in 2027, 1.9 per cent in 2028 and 2.1 per cent in 2029. The Ontario Ministry of Finance’s real GDP projections are set slightly below the average of private‑sector forecasts in each year for prudent planning purposes.
| Item | 2026 | 2027 | 2028 | 2029 |
|---|---|---|---|---|
| BMO Capital Markets (September) | 0.8 | 2.0 | – | – |
| Central 1 Credit Union (September) | 0.6 | 1.3 | 1.7 | – |
| CIBC Capital Markets (September) | 0.6 | 1.6 | 2.2 | – |
| Desjardins Group (September) | 0.5 | 1.7 | – | – |
| Laurentian Bank Securities (September) | 0.6 | 1.6 | – | – |
| National Bank of Canada (September) | 0.6 | 1.3 | – | – |
| Quantitative Economic Decisions, Inc. (September) | 0.7 | 1.4 | 1.7 | 1.6 |
| Royal Bank of Canada (September) | 0.7 | 1.3 | – | – |
| Scotiabank (September) | 0.7 | 1.9 | – | – |
| Signal49 Research (September) | 0.5 | 2.0 | 2.4 | 2.3 |
| Stokes Economics (July) | 0.4 | 1.6 | 1.8 | 2.2 |
| TD Bank Group (September) | 0.6 | 1.4 | 1.8 | 1.8 |
| University of Toronto (September) | 0.6 | 1.4 | 1.6 | 2.4 |
| Private-Sector Survey Average | 0.6 | 1.6 | 1.9 | 2.1 |
| Ontario’s Planning Assumption | 0.5 | 1.5 | 1.8 | 2.0 |
Table 2.3 footnotes:
Sources: Ontario Ministry of Finance Survey of Forecasters (September 11, 2026) and Ontario Ministry of Finance.
Private-sector forecasters, on average, are projecting that Ontario’s nominal GDP will grow by 3.8 per cent in 2026, 3.9 per cent in 2027, 4.0 per cent in 2028 and 4.1 per cent in 2029. The Ontario Ministry of Finance’s nominal GDP projections are set slightly below the average of private‑sector forecasts in each year for prudent planning purposes.
| Item | 2026 | 2027 | 2028 | 2029 |
|---|---|---|---|---|
| BMO Capital Markets (September) | 4.0 | 4.1 | – | – |
| Central 1 Credit Union (September) | 3.3 | 3.9 | 4.0 | – |
| CIBC Capital Markets (September) | 3.5 | 3.5 | 4.3 | – |
| Desjardins Group (September) | 3.8 | 3.6 | – | – |
| Laurentian Bank Securities (September) | 4.3 | 4.2 | – | – |
| National Bank of Canada (September) | 4.2 | 3.3 | – | – |
| Quantitative Economic Decisions, Inc. (September) | 3.4 | 3.8 | 3.8 | 3.6 |
| Royal Bank of Canada (September) | 3.8 | 3.9 | – | – |
| Scotiabank (September) | 4.0 | 6.1 | – | – |
| Signal49 Research (September) | 4.3 | 3.6 | 4.1 | 4.1 |
| Stokes Economics (July) | 2.9 | 4.3 | 4.1 | 4.5 |
| TD Bank Group (September) | 4.3 | 3.4 | 3.8 | 3.8 |
| University of Toronto (September) | 4.1 | 3.3 | 3.6 | 4.5 |
| Private-Sector Survey Average | 3.8 | 3.9 | 4.0 | 4.1 |
| Ontario’s Planning Assumption | 3.7 | 3.8 | 3.9 | 4.0 |
Table 2.4 footnotes:
Sources: Ontario Ministry of Finance Survey of Forecasters (September 11, 2026) and Ontario Ministry of Finance.
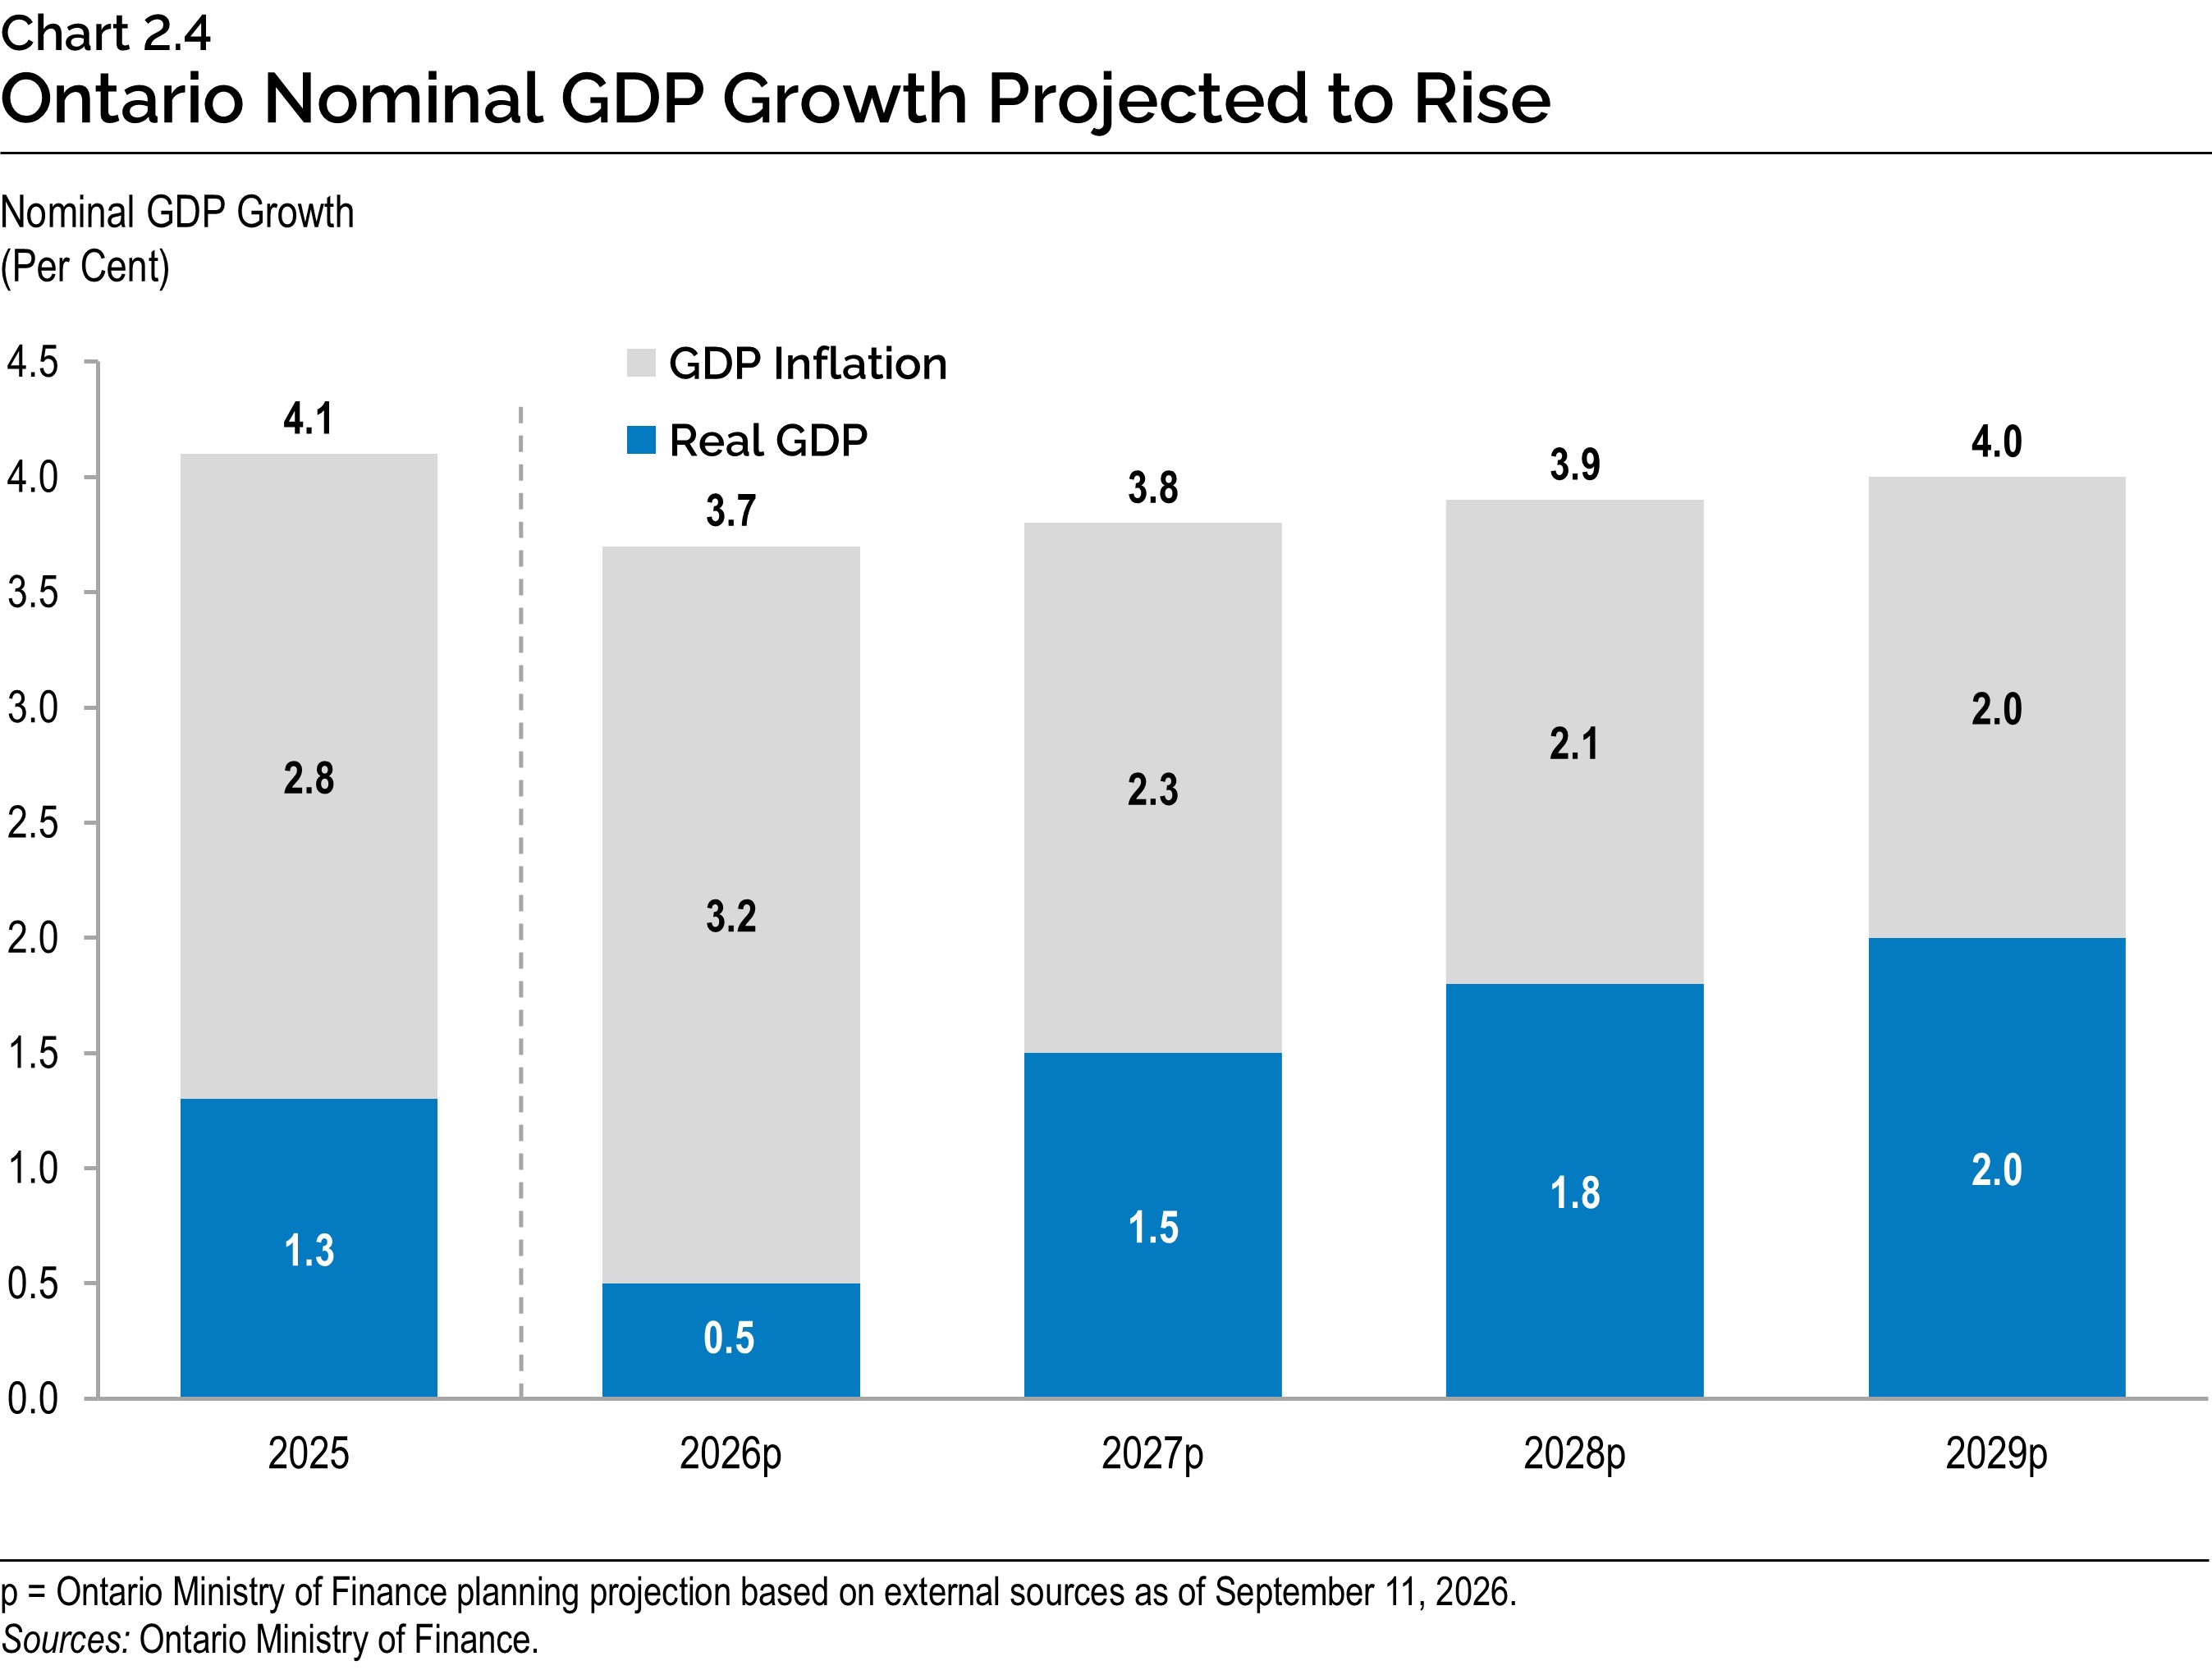
The Ontario Ministry of Finance is projecting that Ontario’s nominal GDP will rise by 3.7 per cent in 2026 as real GDP growth slows from 1.3 per cent in 2025 to 0.5 per cent in 2026. Nominal GDP growth is projected to edge up to 3.8 per cent in 2027, as real GDP growth accelerates to 1.5 per cent while GDP inflation returns closer to its long-run historical average. Nominal GDP growth is expected to strengthen to 3.9 per cent in 2028 and 4.0 per cent in 2029, reflecting stronger real GDP growth.
Global Economic Environment
The global economy continues to be adversely affected by heightened trade and geopolitical tensions. Global trade relationships remain unpredictable and volatile. The United States continues to impose a wide range of tariffs and trade restrictions on countries across the world. More recently, it announced significant new tariffs on imports, prompting Canada to impose counter‑tariffs.
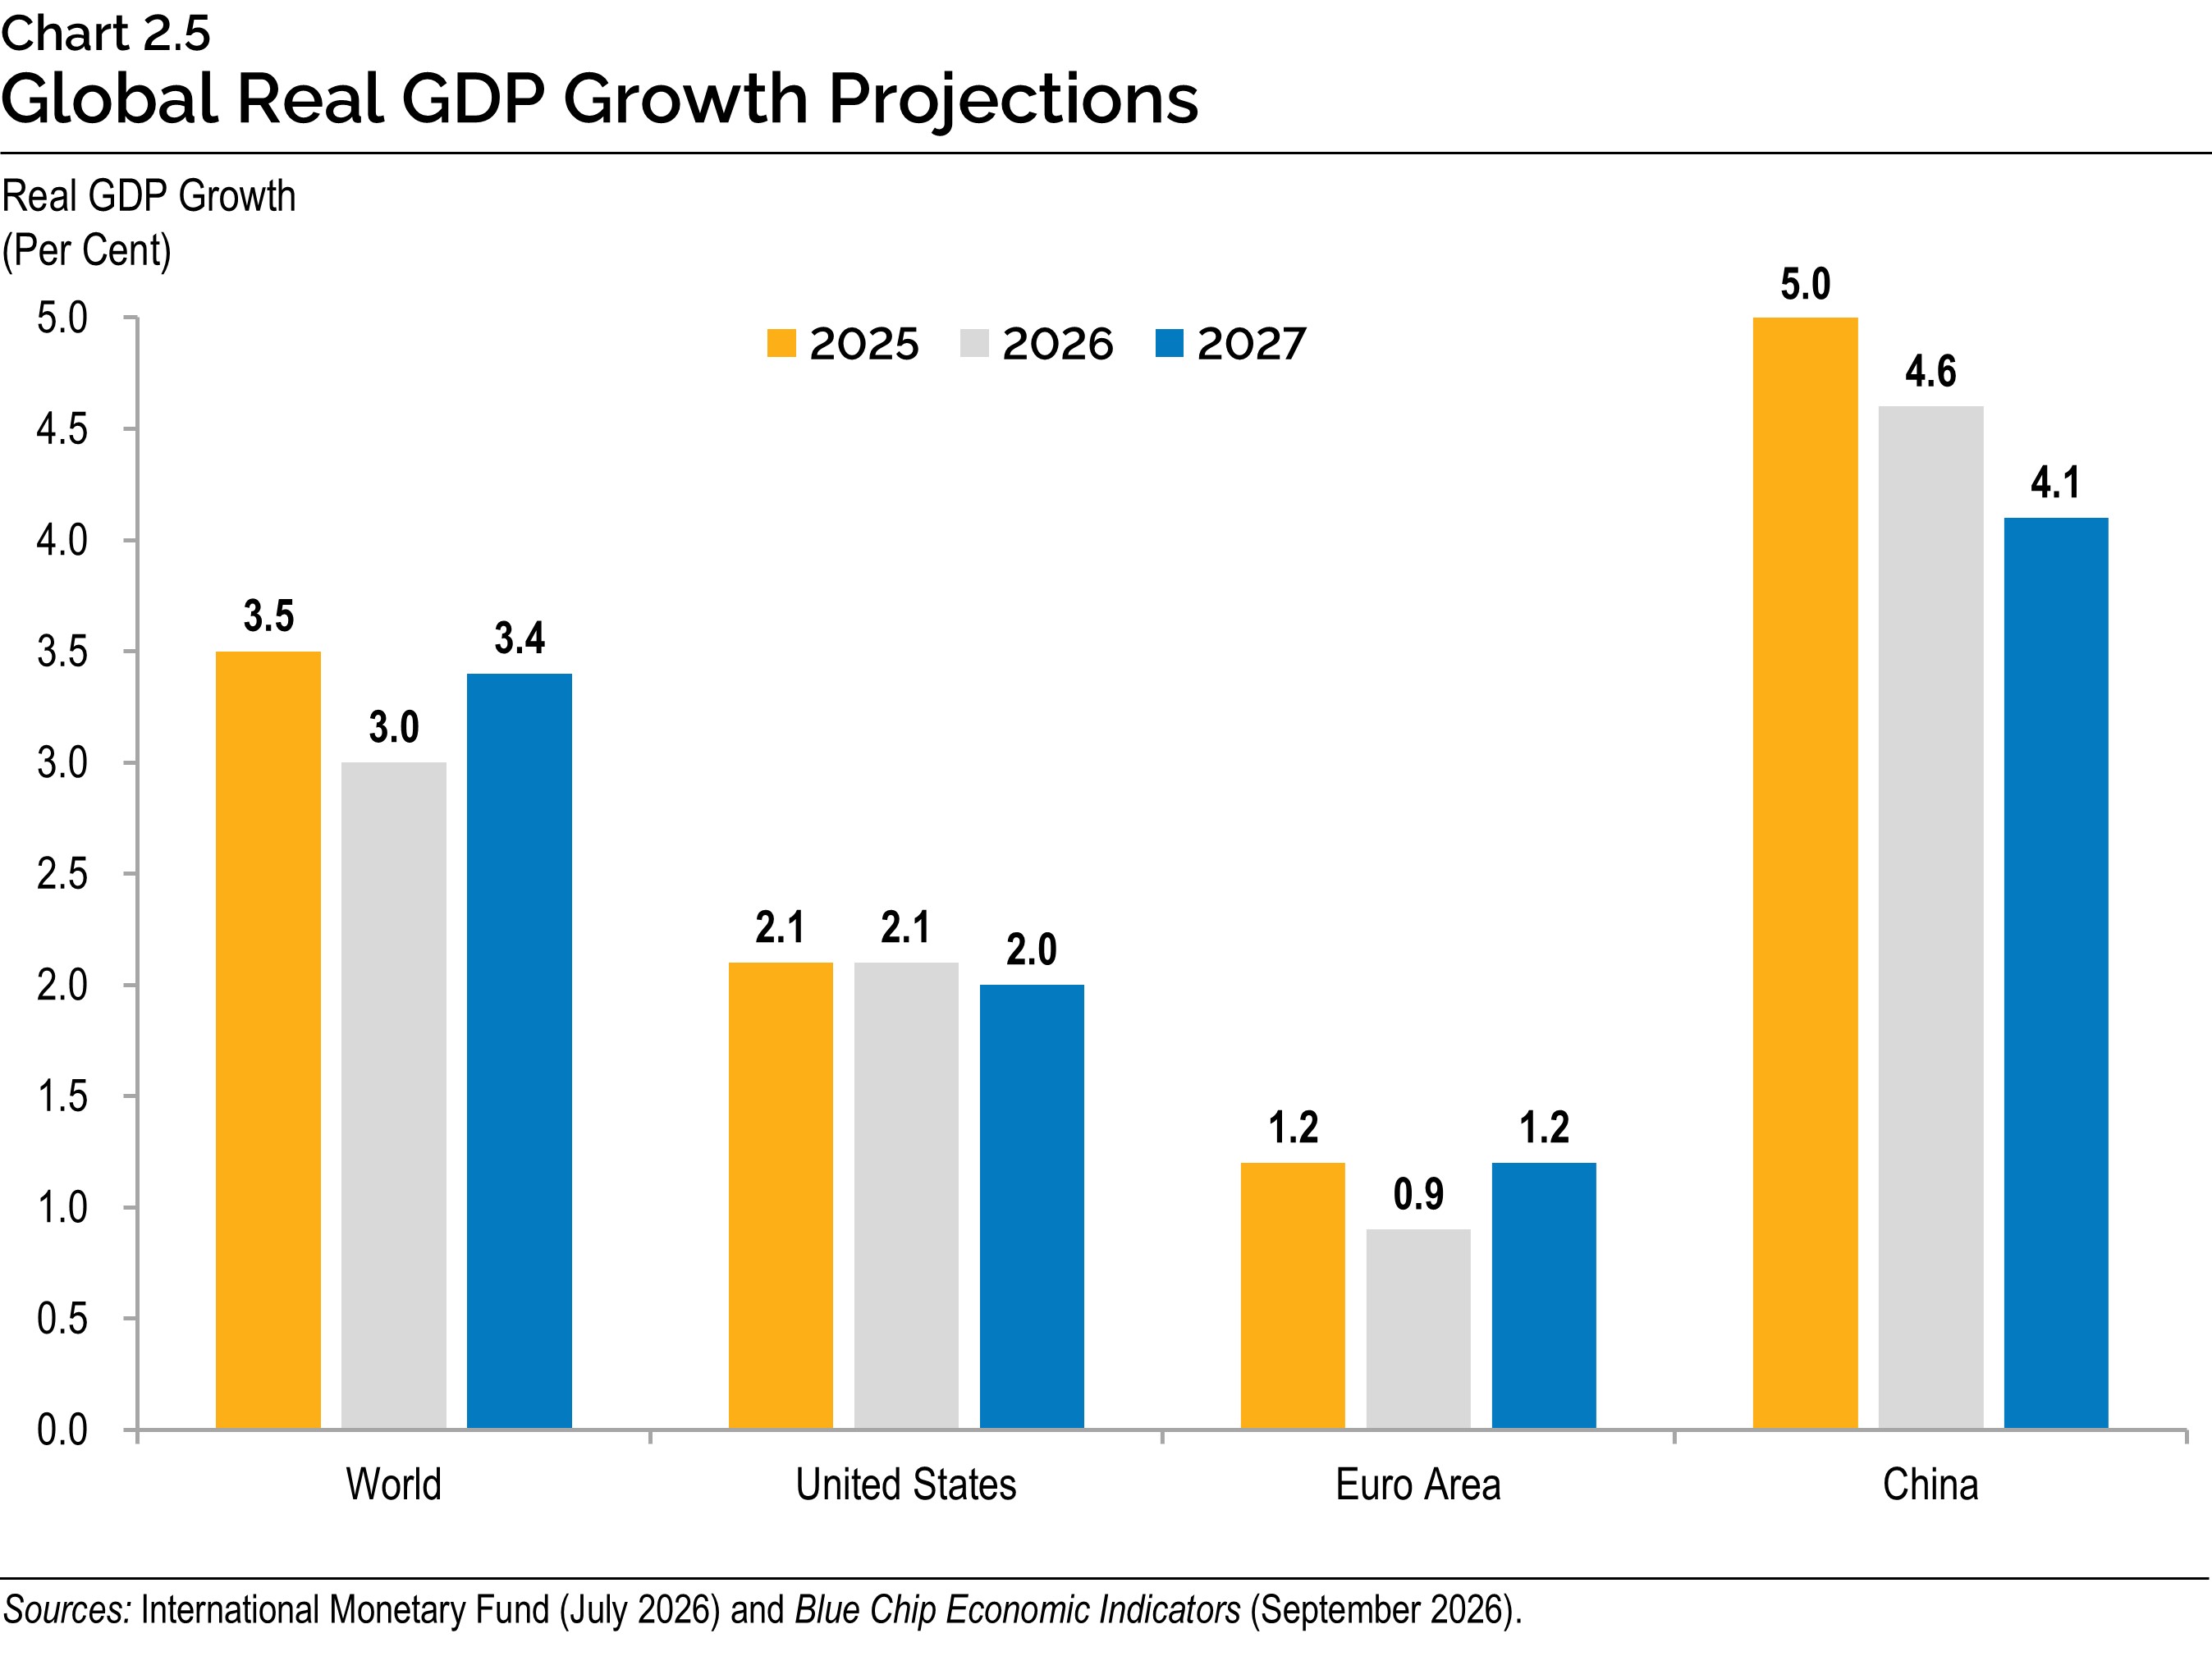
In its July World Economic Outlook Update, the International Monetary Fund (IMF) projects that global real GDP growth will slow from 3.5 per cent in 2025 to 3.0 per cent in 2026 before rising to 3.4 per cent in 2027. The slowdown in global growth for 2026 reflects the effects of the war in the Middle East and ongoing trade disruptions, partially offset by the adoption of artificial intelligence (AI) and AI-related investments. The IMF projects global headline inflation to increase by 4.7 per cent in 2026, before easing to 3.9 per cent in 2027.
U.S. real GDP rose by 2.1 per cent in 2025 and according to Blue Chip Economic Indicators released in September 2026, U.S. real GDP growth is projected to remain at 2.1 per cent in 2026 and then grow by 2.0 per cent in 2027. Compared to projections at the time of the 2026 Budget, U.S. real GDP growth is now estimated to be 0.3 percentage points lower in 2026 and 0.1 percentage points lower in 2027. Euro area real GDP rose by 1.2 per cent in 2025 and the IMF projects growth of 0.9 per cent in 2026 and 1.2 per cent in 2027. China’s real GDP growth is expected to slow from 5.0 per cent in 2025 to 4.6 per cent in 2026 and 4.1 per cent in 2027.
Financial Markets and Other External Factors
Most major central banks have maintained, and some have even tightened, their monetary policy as price inflation remains above their inflation targets. Looking forward, central banks are likely to be faced with a difficult decision between lowering their policy interest rates to stimulate economic growth or undertaking restrictive monetary policy in case inflationary pressures continue to rise.
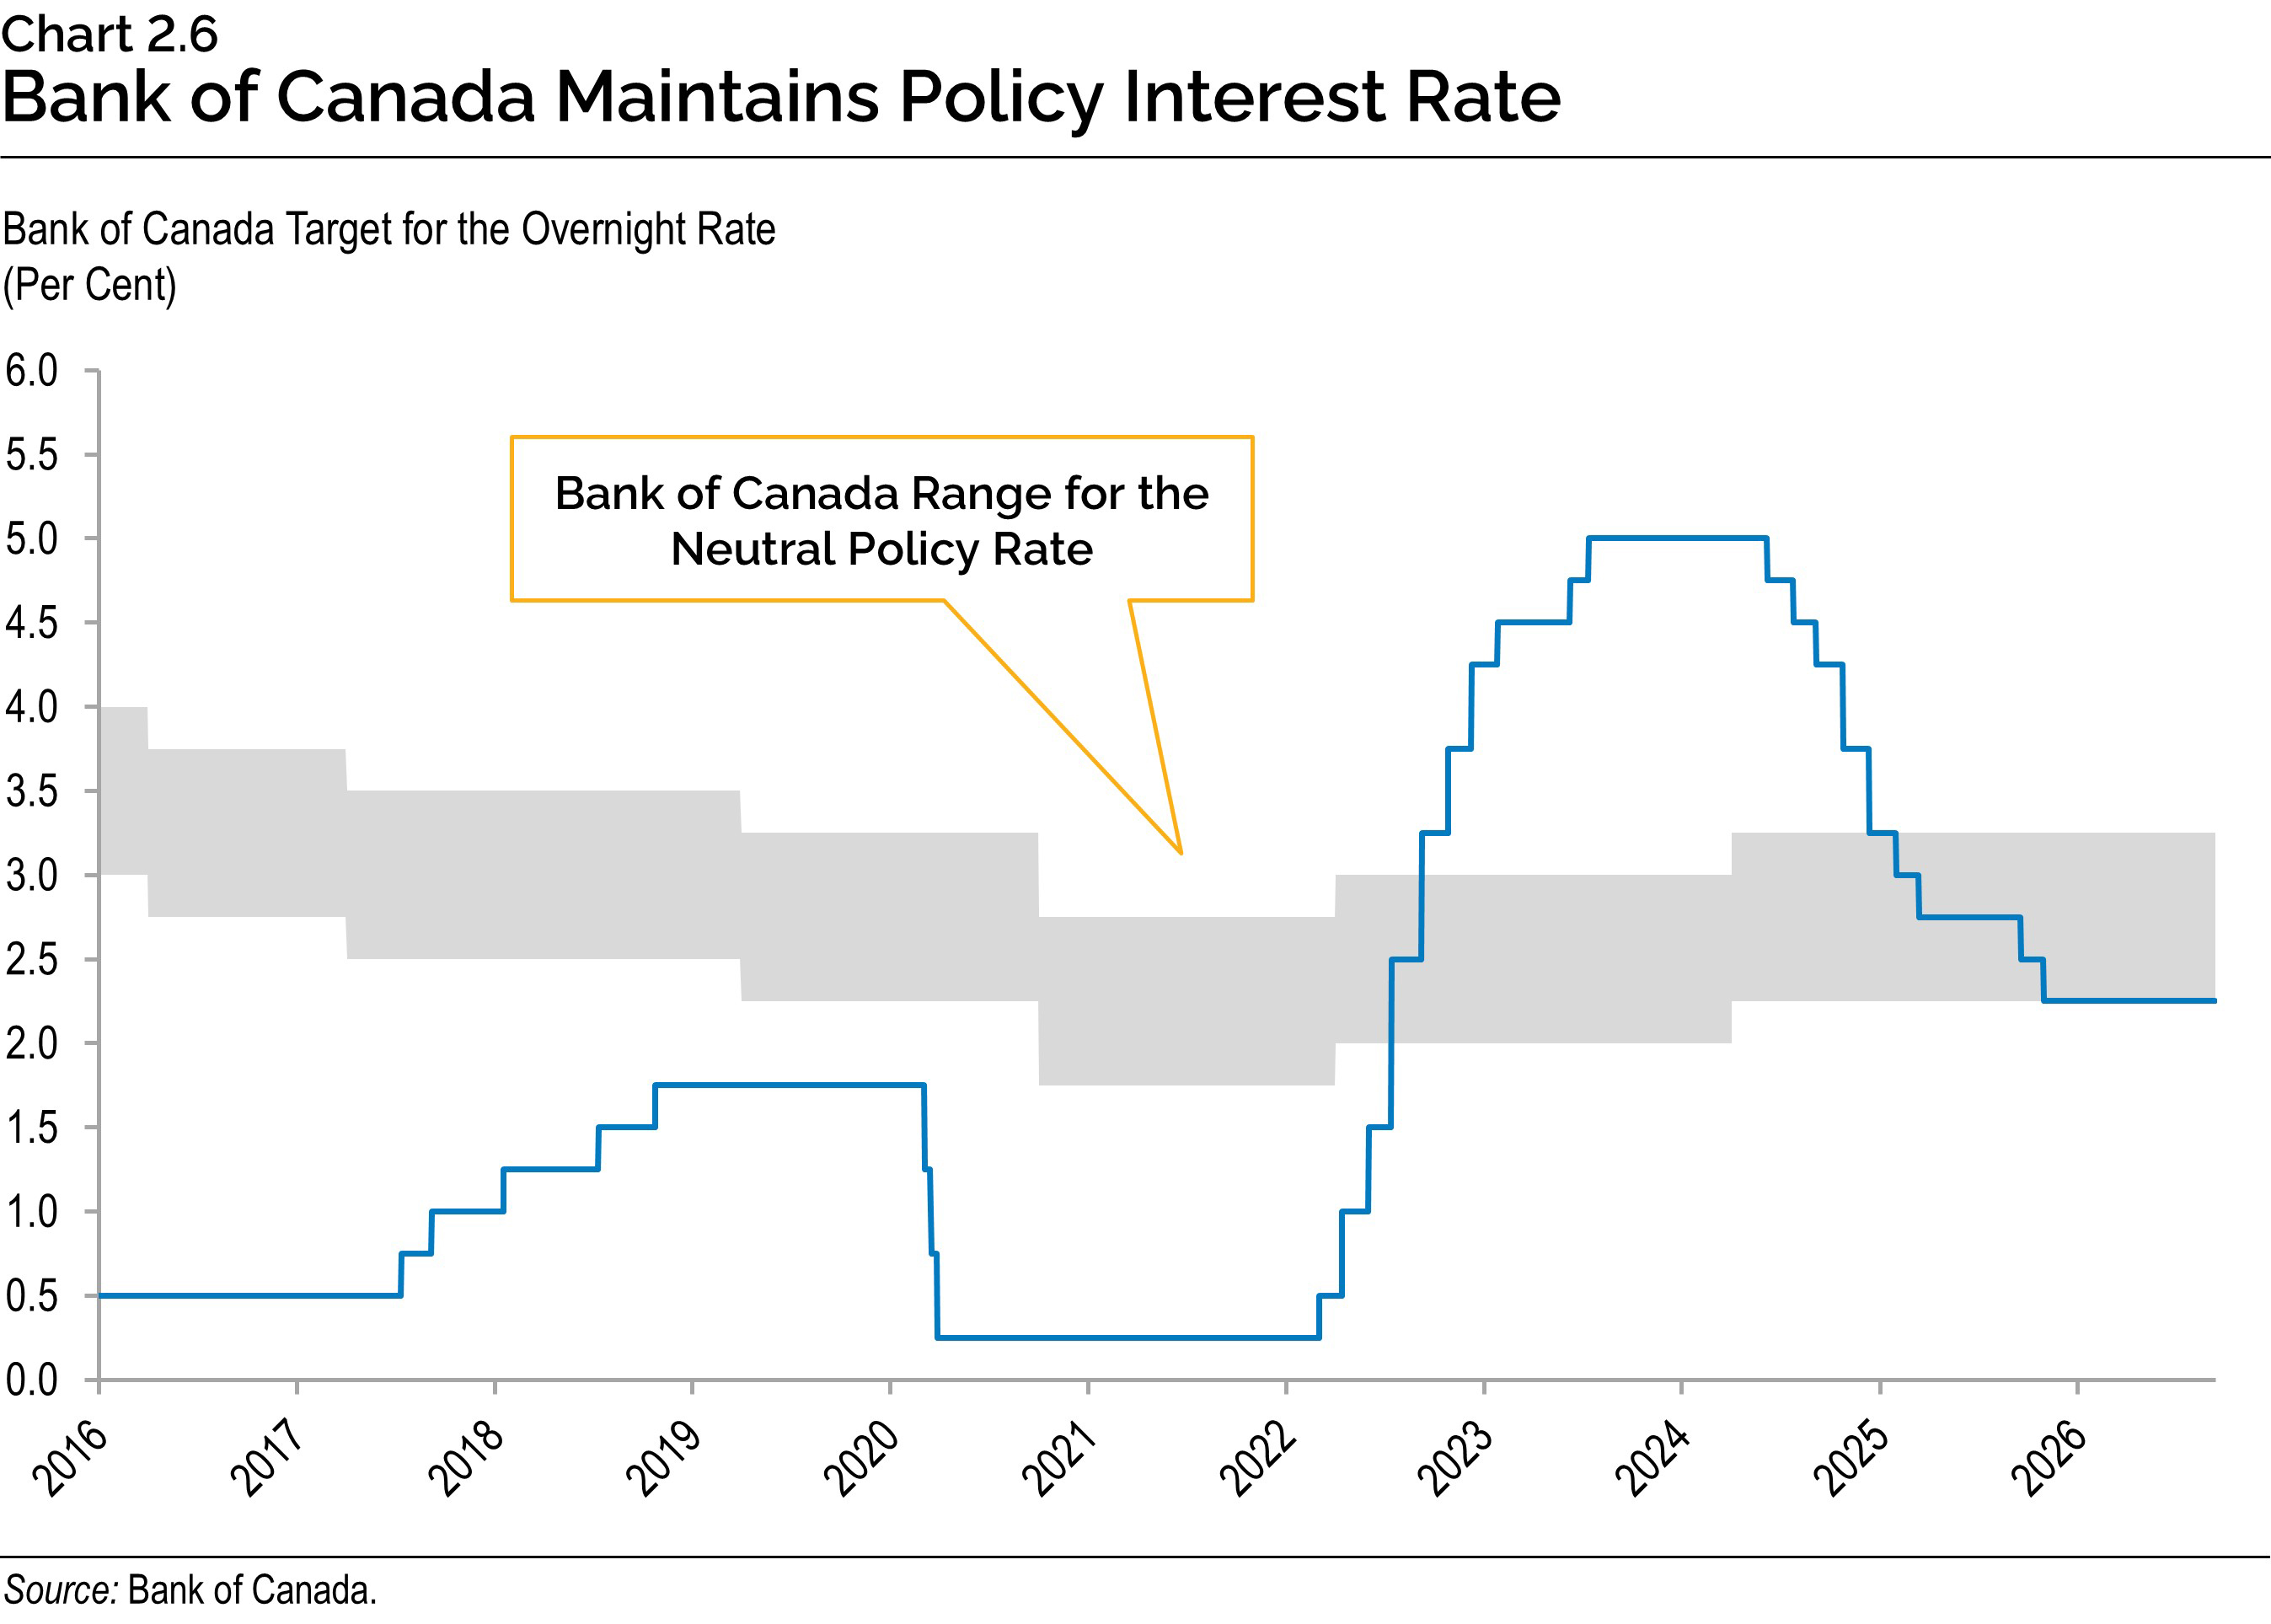
For the seventh consecutive policy decision, the Bank of Canada (the Bank) held its key policy interest rate unchanged at 2.25 per cent in September 2026, keeping it within the range that the Bank considers its neutral policy interest rate. The Bank continues to assess the evolving balance between tariff-induced inflationary pressures, and the potential drag on economic growth stemming from heightened trade uncertainty. The ongoing conflict in the Middle East continues to exert upward pressure on energy prices, raising the risks to the inflation outlook.
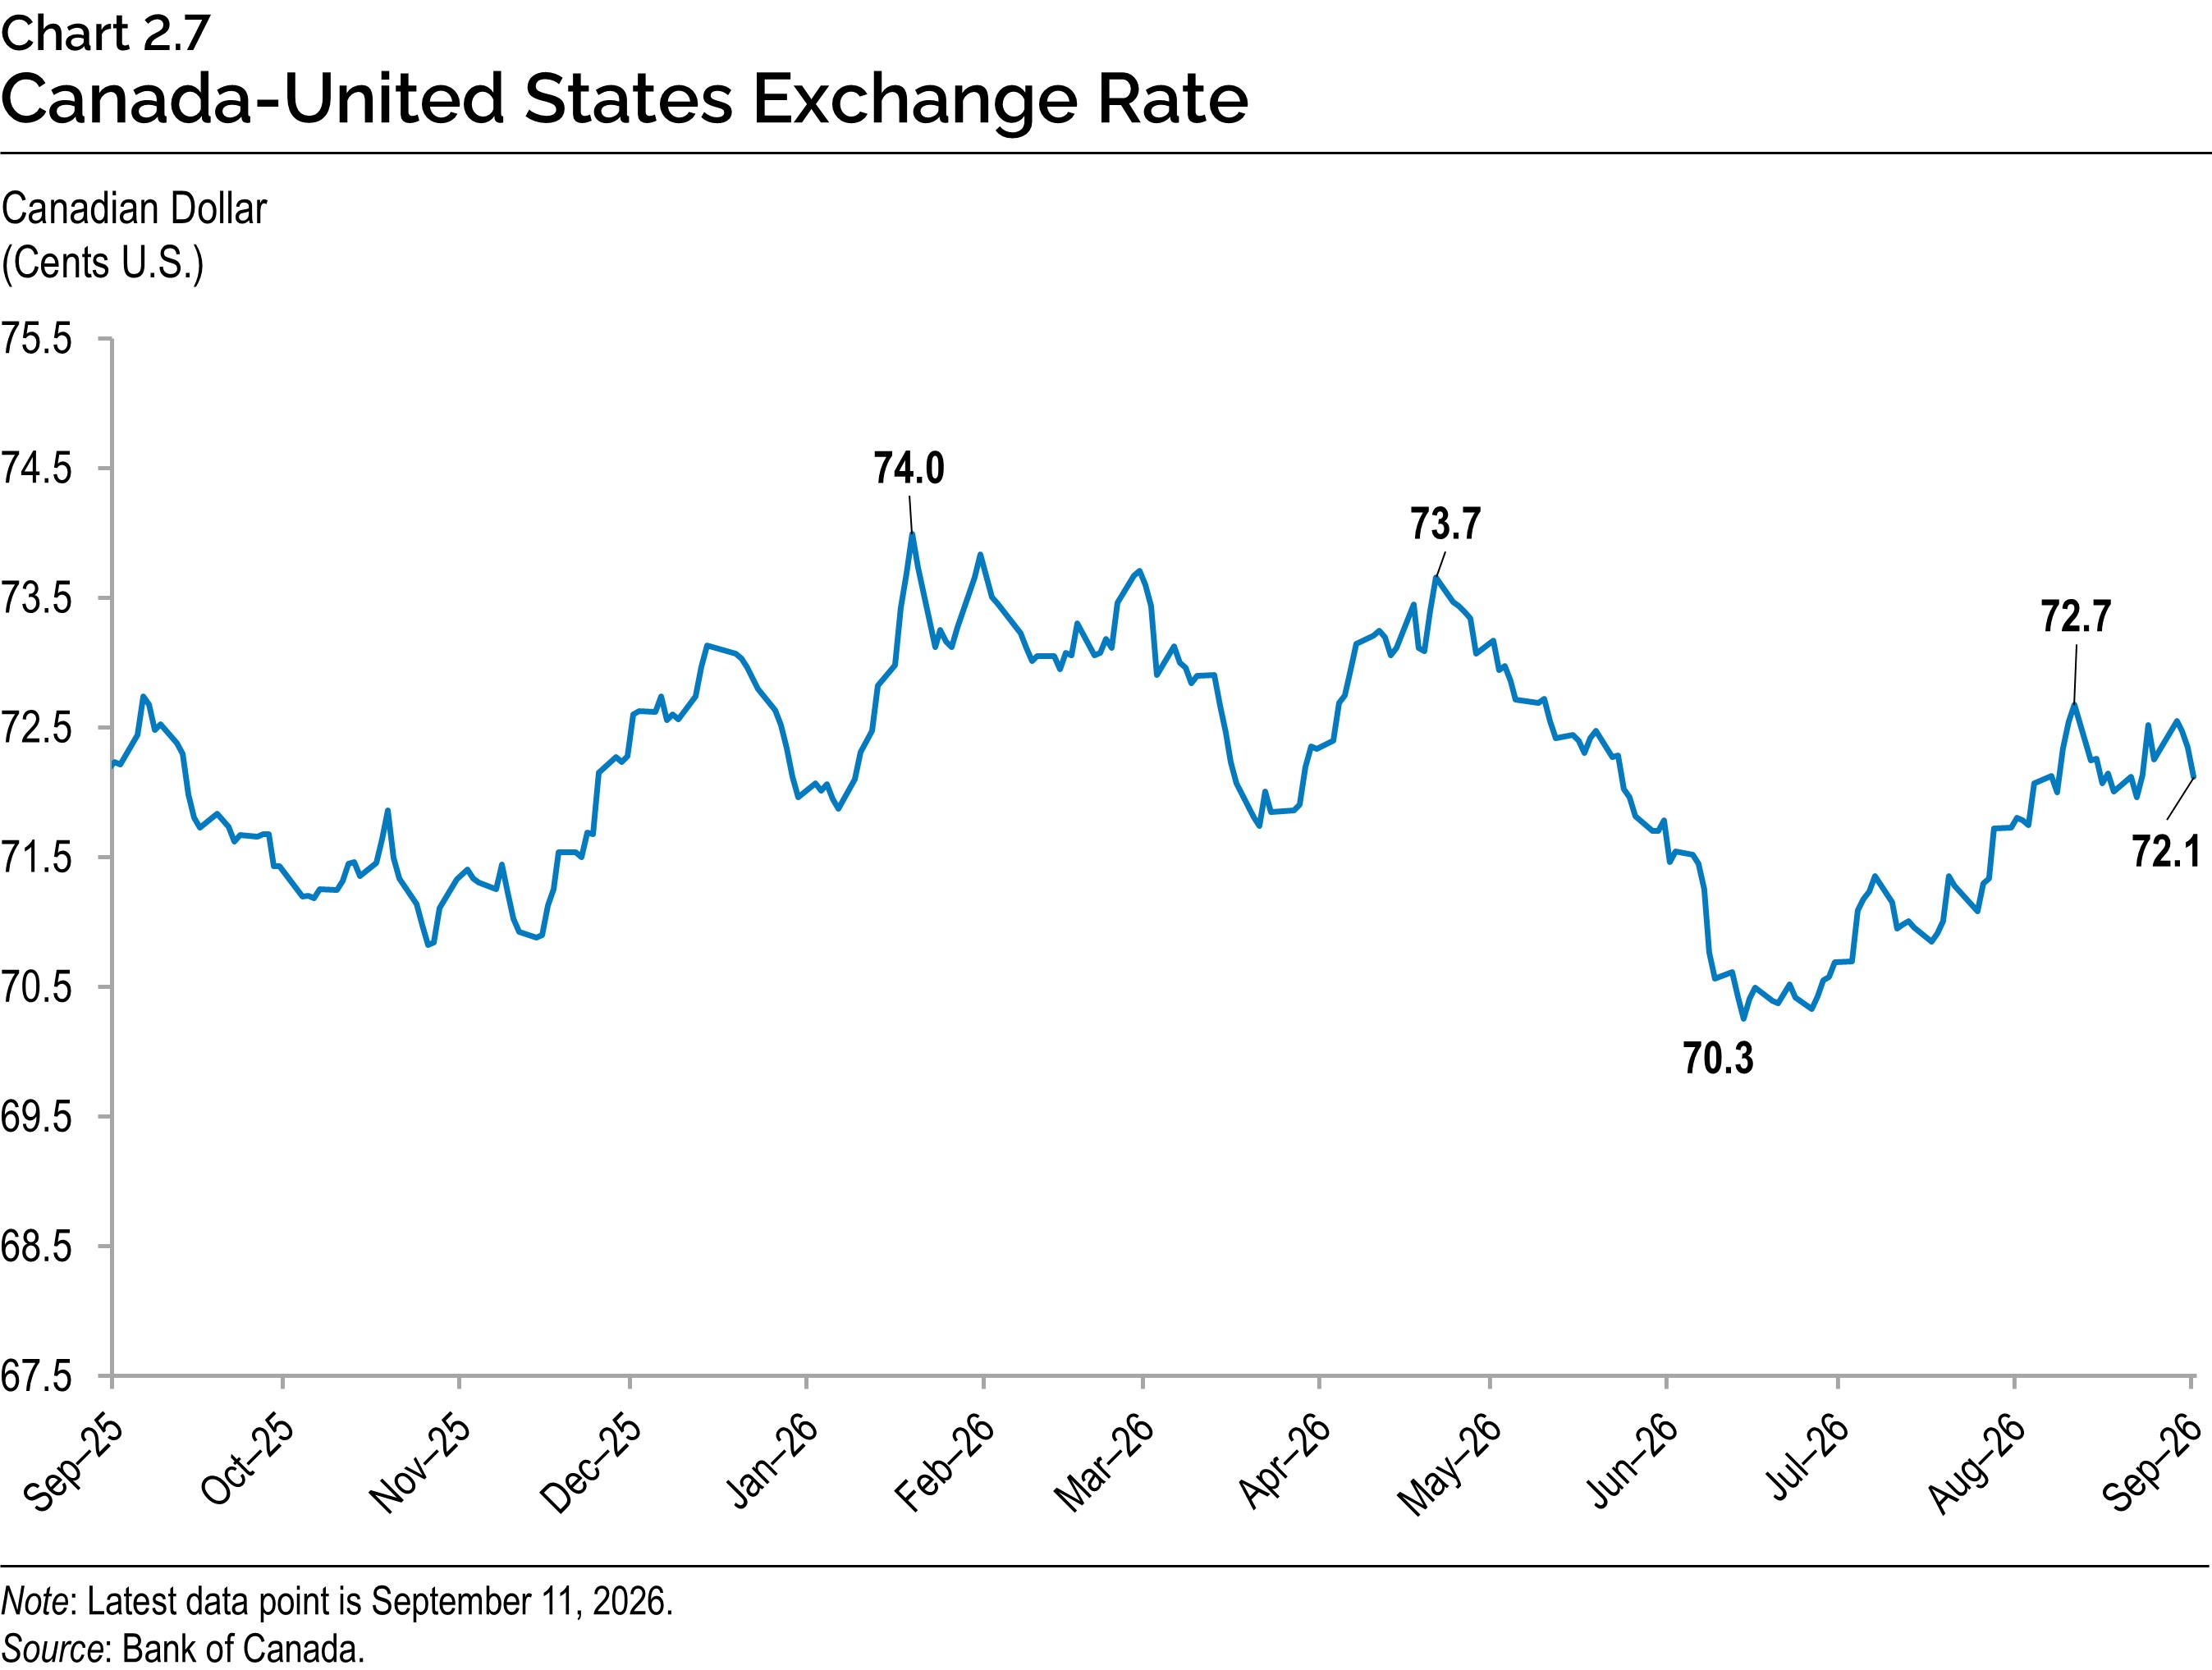
The Canadian dollar has demonstrated resilience amid substantial fluctuations over the past year, reflecting ongoing policy divergence between the Bank of Canada and the U.S. Federal Reserve, alongside persistent uncertainty surrounding U.S. trade policy. The Canadian dollar is projected to increase from 71.6 cents US in 2025 to 72.3 cents US in 2026 and then appreciate gradually over the projection period to reach 73.7 cents US in 2027 and an average of 74.9 cents US in 2028 and 2029.
The Government of Canada three‐month treasury bill rate averaged 2.6 per cent in 2025 and is expected to decrease to 2.3 per cent in 2026, then rise to 2.5 per cent in 2027, before reaching 2.6 per cent in 2028 and 2029. The Government of Canada 10‐year bond rate averaged 3.2 per cent in 2025 and is expected to rise to 3.5 per cent in 2026 and then edge up to 3.6 per cent in 2027 and remain at this rate in 2028 and 2029.
Oil prices are expected to rise in 2026 before moderating later over the projection horizon. The West Texas Intermediate (WTI) crude oil price is expected to rise from US$65 per barrel in 2025 to US$83 per barrel in 2026 before easing to US$74 per barrel in 2027 and averaging US$71 per barrel in 2028 and 2029.
| Item | 2025 | 2026p | 2027p | 2028p | 2029p |
|---|---|---|---|---|---|
| World Real GDP Growth (Per Cent) | 3.5 | 3.0 | 3.4 | 3.2 | 3.2 |
| U.S. Real GDP Growth (Per Cent) | 2.1 | 2.1 | 2.0 | 2.0 | 2.0 |
| West Texas Intermediate (WTI) Crude Oil ($US per Barrel) | 65 | 83 | 74 | 70 | 71 |
| Canadian Dollar (Cents US) | 71.6 | 72.3 | 73.7 | 74.6 | 75.1 |
| Three-Month Treasury Bill Rate1 (Per Cent) | 2.6 | 2.3 | 2.5 | 2.6 | 2.6 |
| 10-Year Government Bond Rate2 (Per Cent) | 3.2 | 3.5 | 3.6 | 3.6 | 3.6 |
Table 2.5 footnotes:
p = Ontario Ministry of Finance planning projection based on external sources as of September 11, 2026.
[1], [2] Government of Canada interest rates.
Sources: International Monetary Fund World Economic Outlook (April 2026 and July 2026 Update); U.S. Bureau of Economic Analysis; U.S. Energy Information Administration; Bank of Canada; Blue Chip Economic Indicators (March and September 2026); and Ontario Ministry of Finance Survey of Forecasters (September 11, 2026).
Details of Ontario’s Economic Outlook
The Ontario Ministry of Finance projects real GDP to rise by 0.5 per cent in 2026, 1.5 per cent in 2027, 1.8 per cent in 2028 and 2.0 per cent in 2029. Nominal GDP is projected to rise by 3.7 per cent in 2026, 3.8 per cent in 2027, 3.9 per cent in 2028 and 4.0 per cent in 2029.
| Item | 2025 | 2026p | 2027p | 2028p | 2029p |
|---|---|---|---|---|---|
| Real Gross Domestic Product | 1.3 | 0.5 | 1.5 | 1.8 | 2.0 |
| Nominal Gross Domestic Product | 4.1 | 3.7 | 3.8 | 3.9 | 4.0 |
| Compensation of Employees | 3.7 | 3.4 | 3.0 | 3.1 | 3.8 |
| Net Operating Surplus — Corporations | 6.2 | 7.9 | 6.9 | 6.4 | 5.7 |
| Nominal Household Consumption | 4.6 | 3.6 | 3.2 | 3.4 | 3.8 |
| Other Economic Indicators — Employment | 1.0 | 0.4 | 0.6 | 0.7 | 1.2 |
| Other Economic Indicators — Job Creation (000s) | 80.9 | 32.9 | 49.6 | 58.2 | 104.1 |
| Other Economic Indicators — Unemployment Rate (Per Cent) | 7.7 | 7.2 | 6.7 | 6.3 | 6.1 |
| Other Economic Indicators — Consumer Price Index | 1.9 | 2.3 | 2.1 | 2.0 | 2.0 |
| Other Economic Indicators — Housing Starts (000s)1 | 65.4 | 64.7 | 65.1 | 71.7 | 75.4 |
| Other Economic Indicators — Home Resales | (5.9) | (0.7) | 7.8 | 5.1 | 5.3 |
| Other Economic Indicators — Home Resale Prices | (4.4) | (2.4) | 1.4 | 4.2 | 4.6 |
| Key External Variables — U.S. Real Gross Domestic Product | 2.1 | 2.1 | 2.0 | 2.0 | 2.0 |
| Key External Variables — WTI Crude Oil ($US per Barrel) | 65 | 83 | 74 | 70 | 71 |
| Key External Variables — Canadian Dollar (Cents US) | 71.6 | 72.3 | 73.7 | 74.6 | 75.1 |
| Key External Variables — Three-Month Treasury Bill Rate (Per Cent)2 | 2.6 | 2.3 | 2.5 | 2.6 | 2.6 |
| Key External Variables — 10-Year Government Bond Rate (Per Cent)3 | 3.2 | 3.5 | 3.6 | 3.6 | 3.6 |
Table 2.6 footnotes:
p = Ontario Ministry of Finance planning projection based on external sources as of September 11, 2026.
[1] Housing starts projection based on private-sector average as of September 11, 2026.
[2], [3] Government of Canada interest rates.
Sources: Statistics Canada; Canada Mortgage and Housing Corporation; Canadian Real Estate Association; Bank of Canada; United States Bureau of Economic Analysis; Blue Chip Economic Indicators (March and September 2026); U.S. Energy Information Administration; and Ontario Ministry of Finance.
Employment
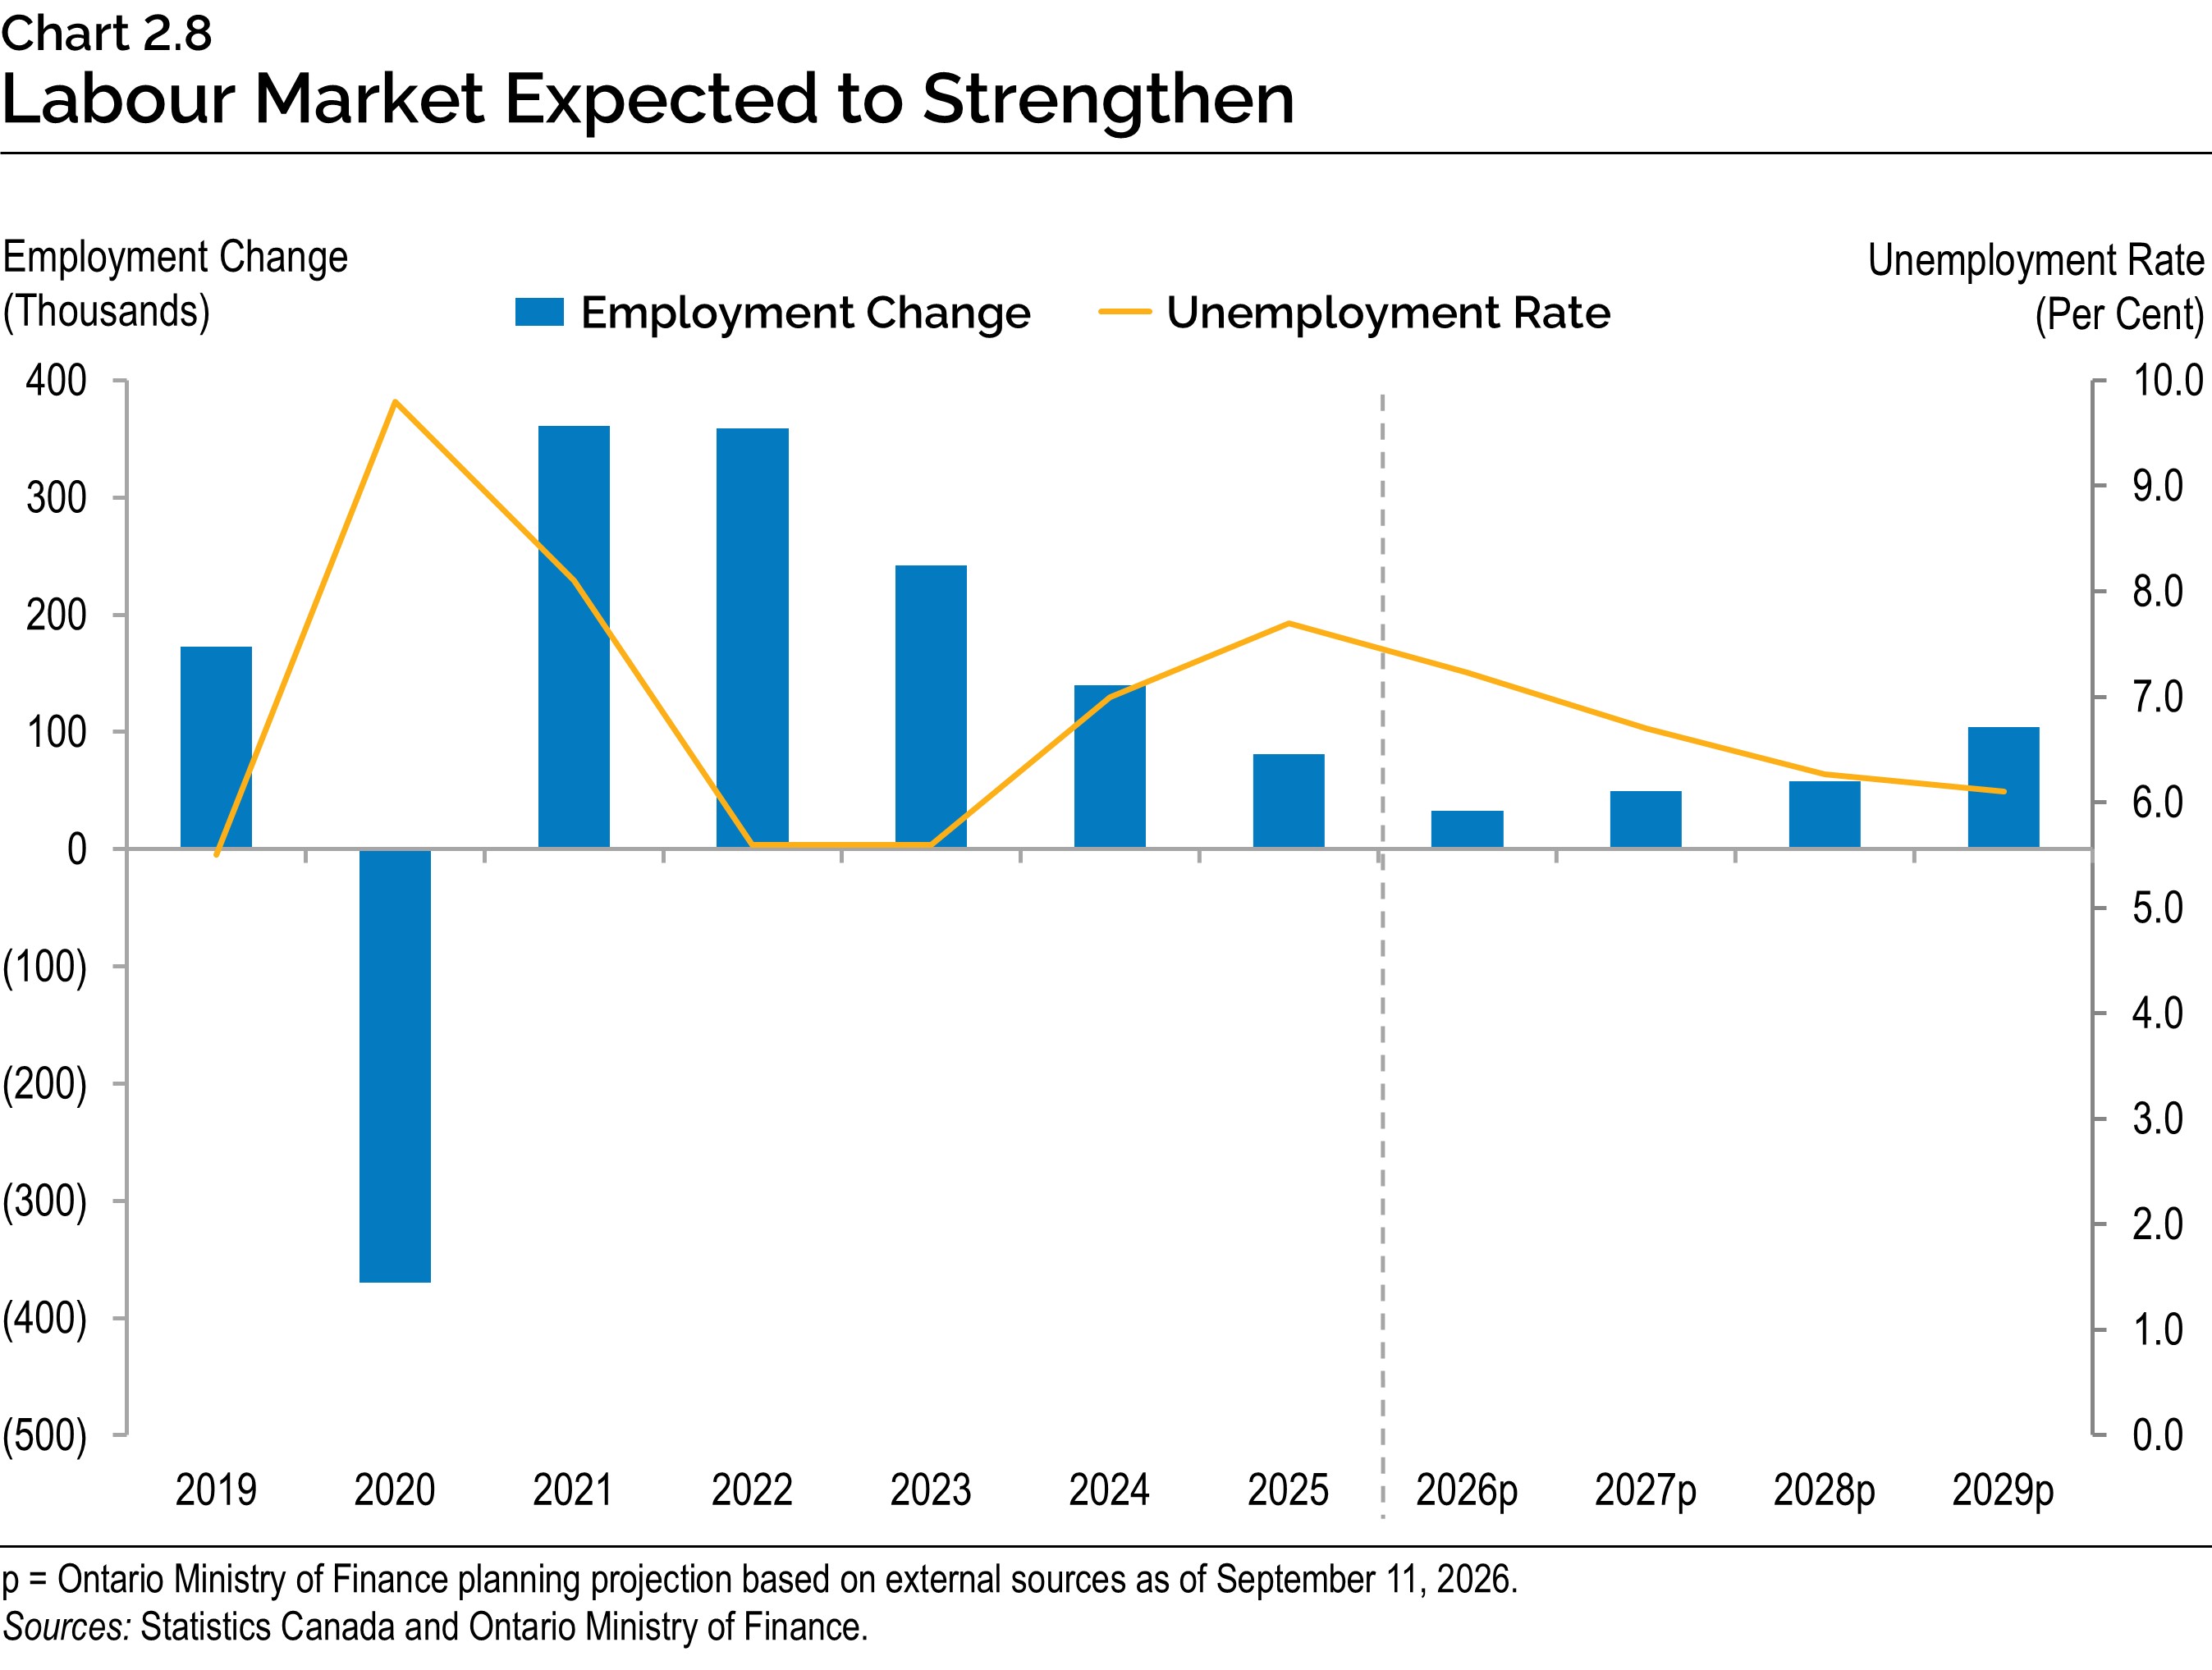
In 2026, Ontario’s labour market has been impacted by slower economic growth as well as ongoing trade conflicts and the effects of the associated uncertainty on investment and hiring. In addition, population growth has slowed due to changes in federal immigration policy. As these effects ease, employment growth is projected to rise from 0.4 per cent in 2026 to 0.6 per cent in 2027, 0.7 per cent in 2028 and 1.2 per cent in 2029. Stronger economic growth and job creation are projected to lead to a decrease in the unemployment rate from 7.2 per cent in 2026 to 6.7 per cent in 2027, 6.3 per cent in 2028 and 6.1 per cent in 2029.
Consumer Price Index
Ontario’s CPI growth remained well-anchored at 2 per cent (year-over-year) in both June and July 2026, broadly consistent with the Bank of Canada’s 2 per cent inflation target. However, price pressures increased in August, with headline inflation rising to 2.4 per cent, pointing to a modest acceleration in overall price pressures.
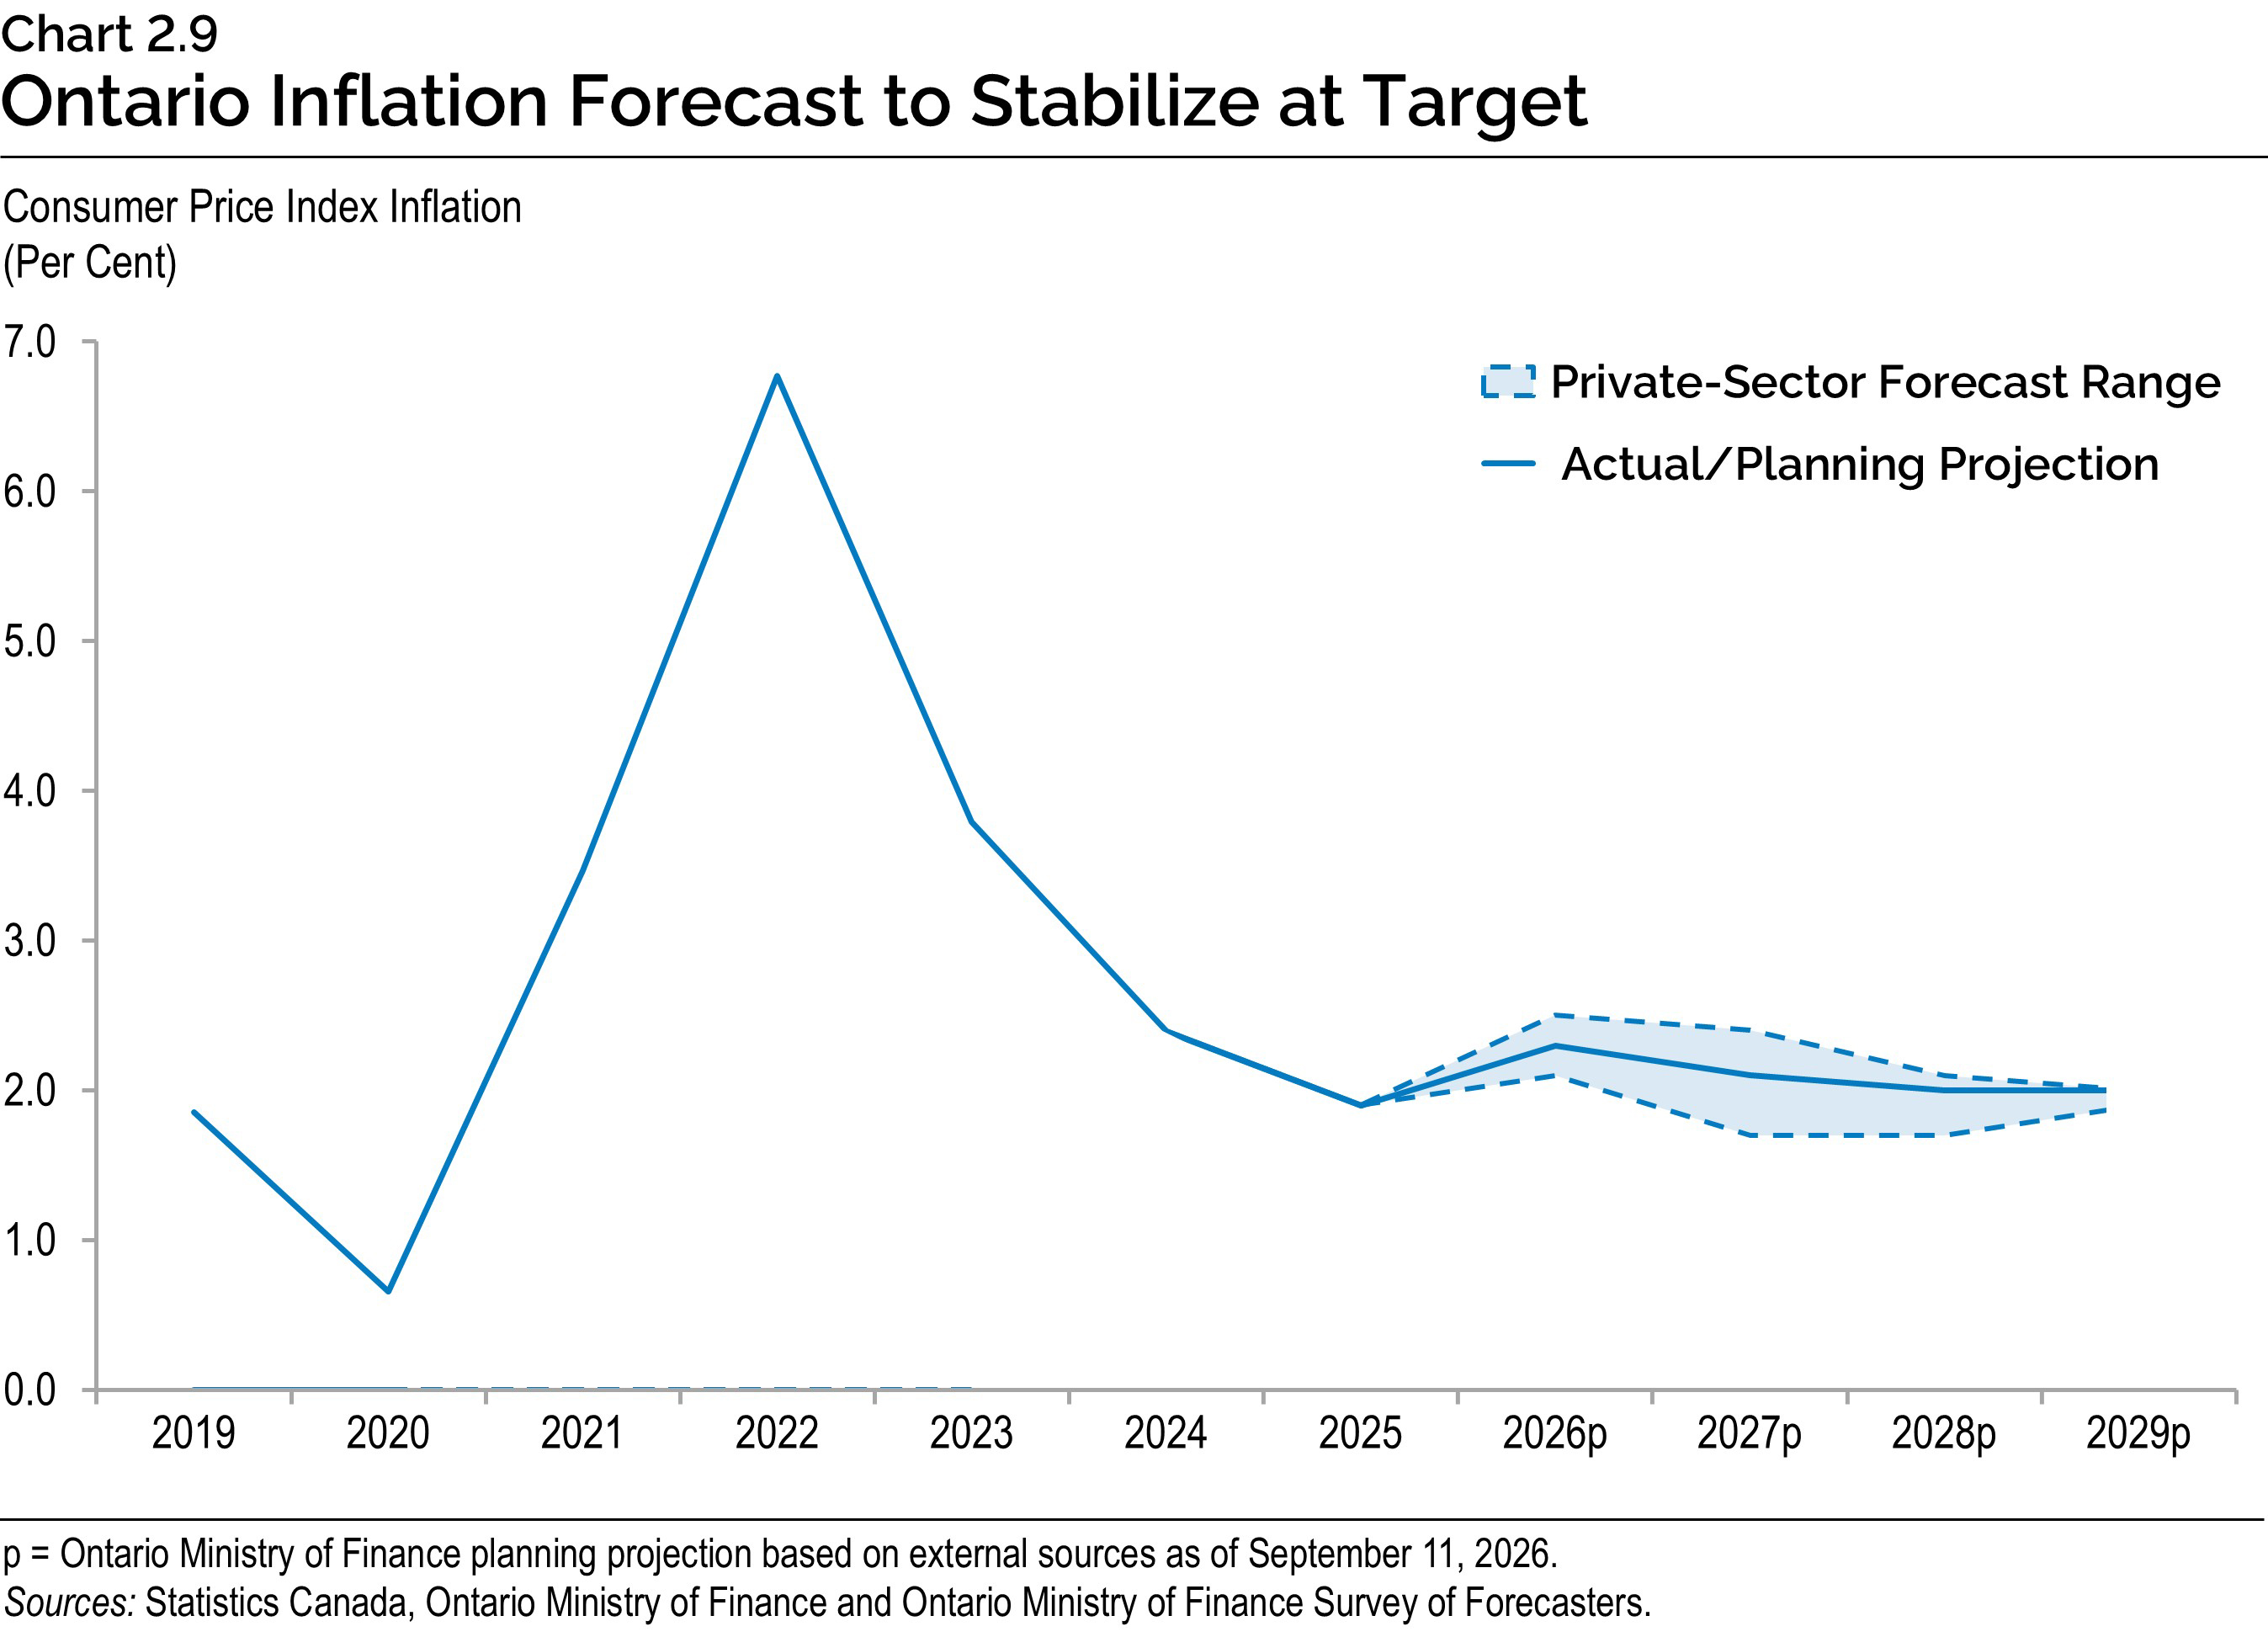
Ontario’s near-term inflation outlook has increased, driven mainly by external supply shocks on global energy prices. For planning purposes, the Ontario Ministry of Finance is projecting that Ontario’s CPI inflation will increase from 1.9 per cent in 2025 to 2.3 per cent in 2026, slow to 2.1 per cent in 2027 and then remain at the Bank’s 2.0 per cent inflation target through 2029.
Housing Market
Housing market activity has remained subdued in 2026 compared to the 2026 Budget planning assumptions, as slow population growth and economic uncertainty weighed on demand. Resale inventory remained elevated relative to sales, although market balance has improved with new listings moderating in recent months. The condominium segment continued to show weakness, particularly in the Greater Toronto Area (GTA), where reduced investor demand and the accumulation of unsold units have constrained prices.
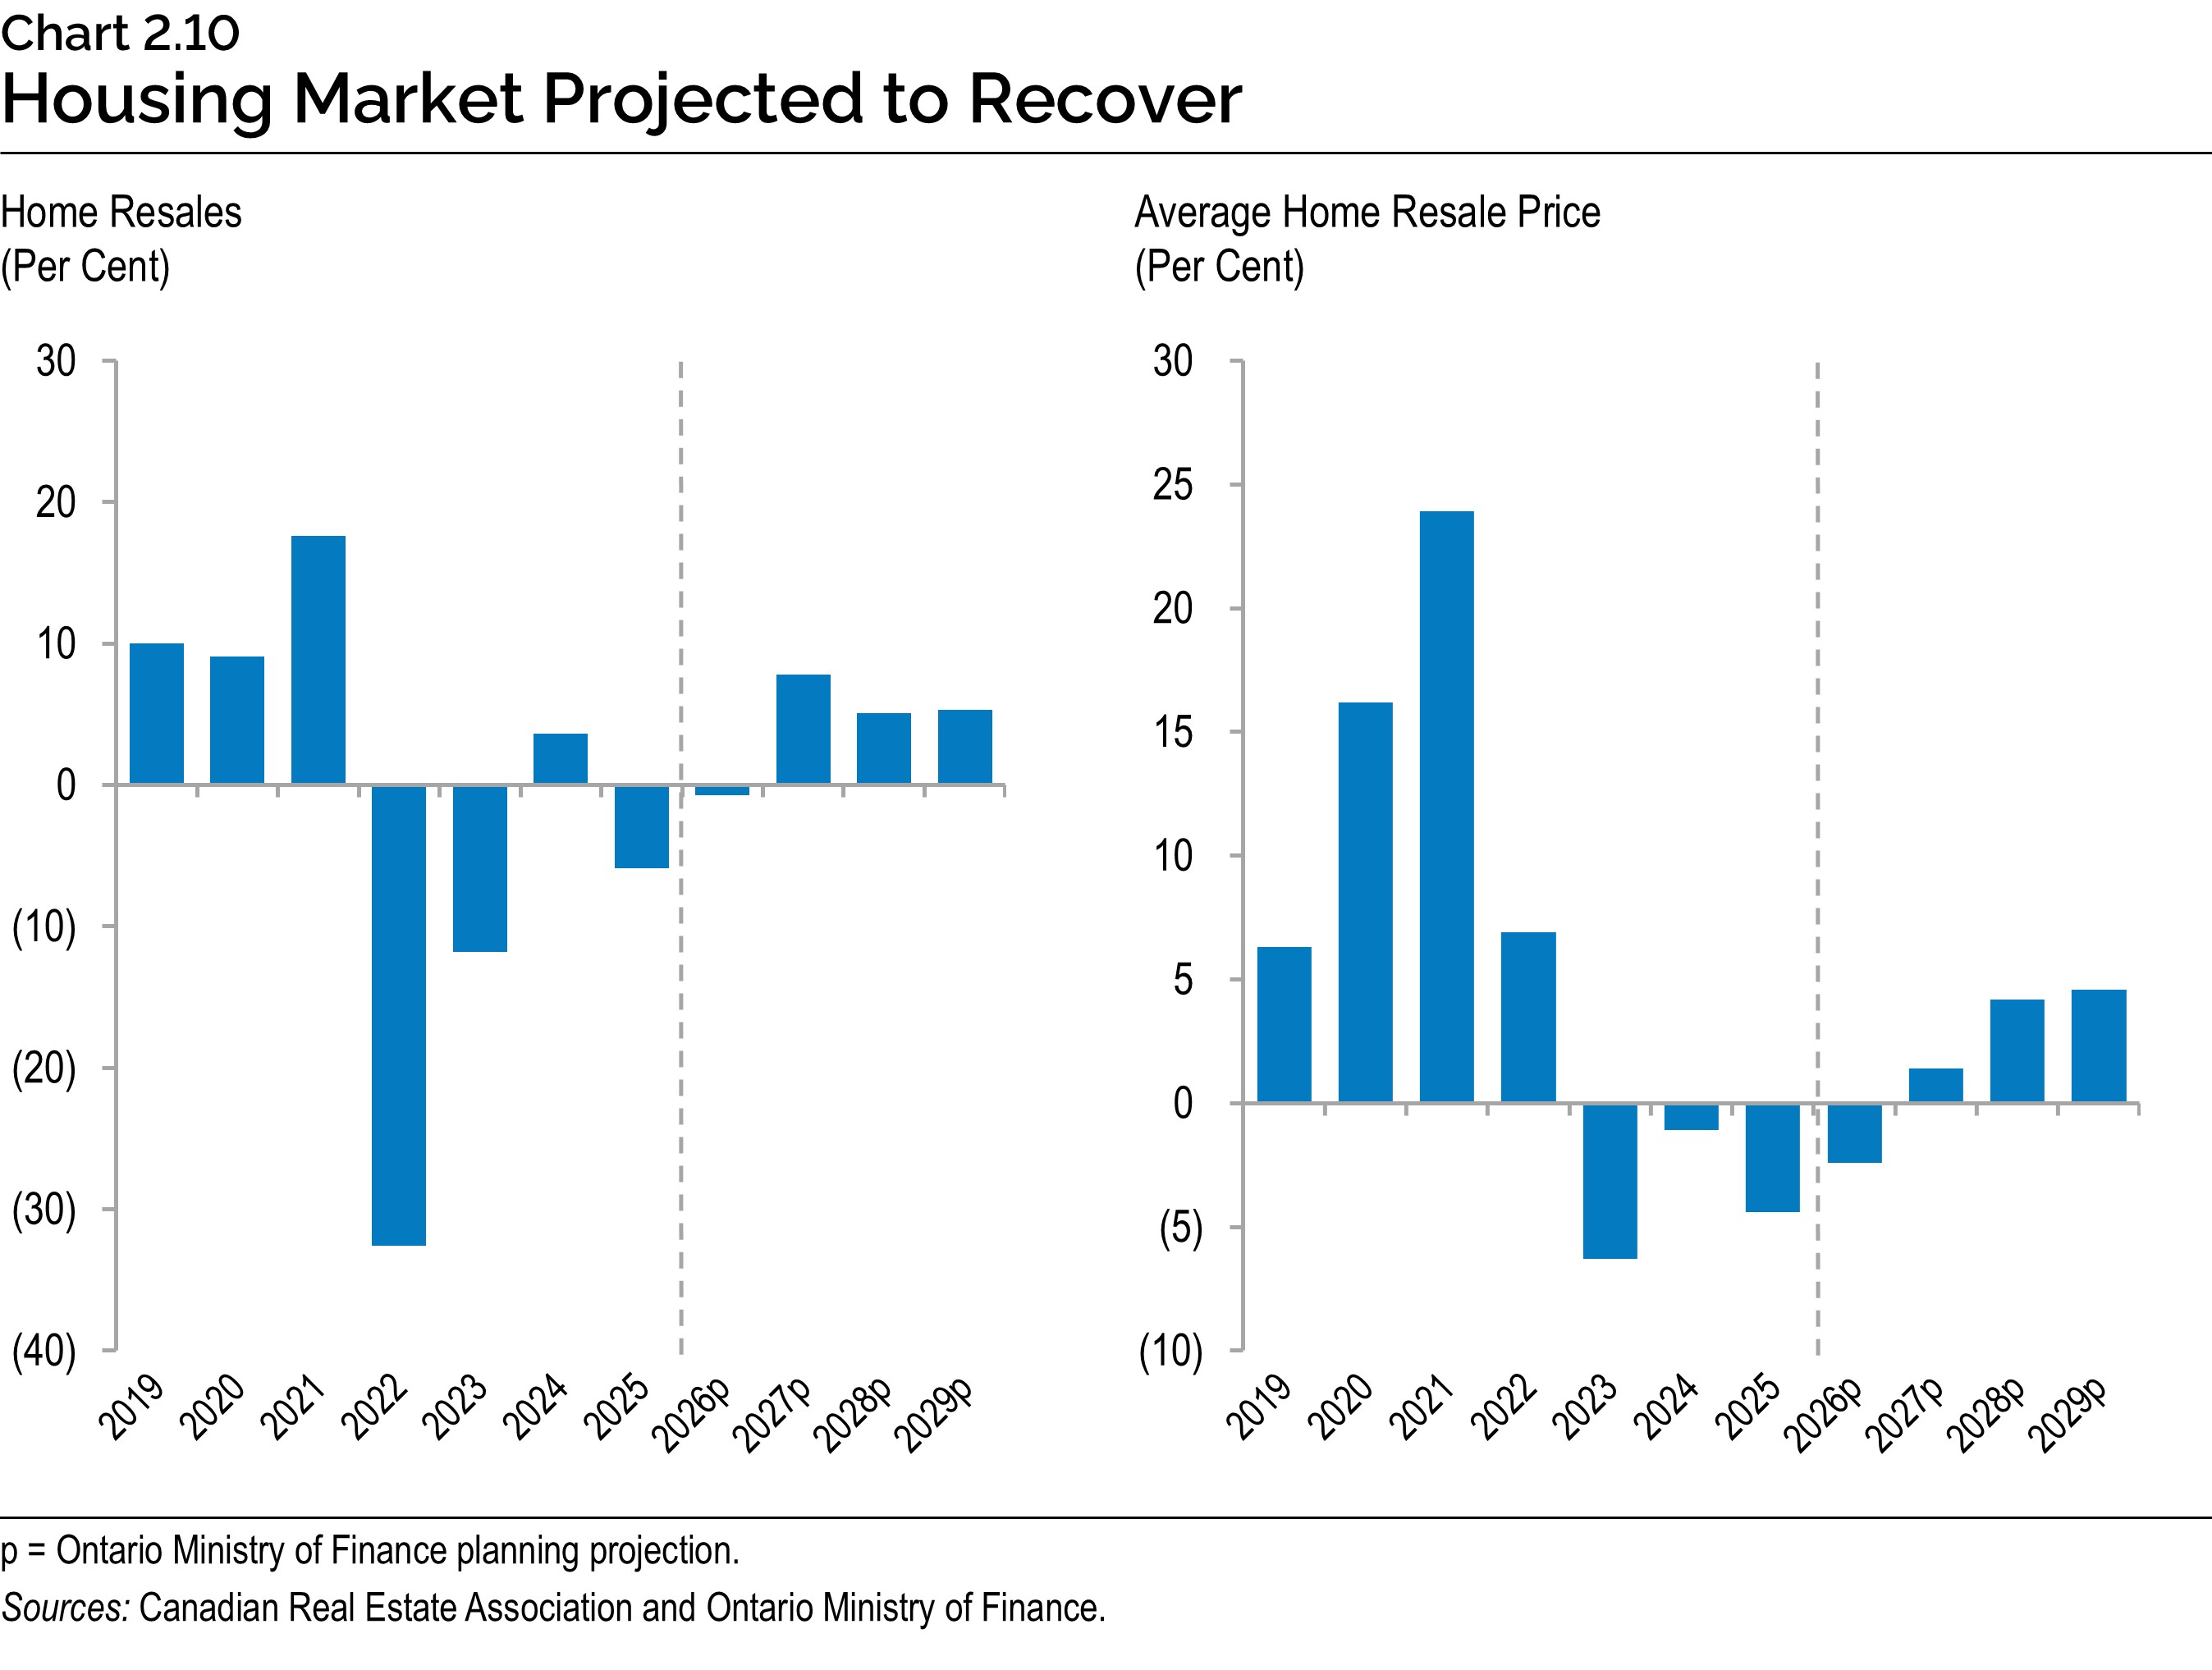
The housing market is expected to recover over the projection period, although the pace of recovery is likely to vary as ongoing economic uncertainty and affordability pressures continue to shape market dynamics. Ontario home resales are projected to decline 0.7 per cent in 2026, followed by increases of 7.8 per cent in 2027, 5.1 per cent in 2028 and 5.3 per cent in 2029. The average home resale price is projected to decline 2.4 per cent in 2026, followed by increases of 1.4 per cent in 2027, 4.2 per cent in 2028 and 4.6 per cent in 2029.
Risks to the Outlook
The main risk to the outlook is global trade uncertainty, which could further disrupt supply chains and commodity markets, exerting upward pressure on inflation, dampening economic growth and raising volatility in financial markets. While Ontario and Canada have gradually started to adjust and diversify trade to markets outside the United States, this adjustment could potentially take longer than expected. On the upside, efforts to reduce and eliminate interprovincial trade barriers, coupled with the development of significant infrastructure projects and other policy measures to promote investment, could help boost economic growth over the medium term.
The prolonged conflict in the Middle East poses another risk to the global economic outlook. According to the IMF, this could extend commodity price increases and volatility, further threaten supply chains, raise prices, and weigh on financial conditions.
The recent increase in global bond yields is another source of risk, which could lead to higher domestic borrowing costs for businesses and consumers.
A surge in AI-related investment has recently been a source of economic growth, particularly in the United States. Rising demand for new technologies, such as AI, could support renewed business expansion and contribute to increasing productivity growth. However, there is significant uncertainty about the scope and timing of the potential benefits.
Alternative Economic Scenarios
The Ministry of Finance continues to develop scenarios to assess the potential impact of U.S. trade policy on Ontario’s economy over the projection period. Since the 2026 Budget, additional trade barriers have been announced and implemented between the United States and Canada, with significant uncertainty remaining regarding future trade policy developments. These alternative scenarios should not be considered the best case or the worst case. Rather, they illustrate a broader range of possible outcomes.
The Faster Growth Scenario assumes that most tariffs and countermeasures imposed by the United States and Canada are removed in the near term. Under this scenario, Ontario’s economic output recovers starting in 2027 and through the projection period.
The Slower Growth Scenario assumes the United States withdraws from the Canada–United States–Mexico Agreement (CUSMA) and maintains the Section 232 and newly implemented Section 338 tariffs. In response, Canada’s current retaliatory tariffs on the United States would remain in place. Under this scenario, Ontario’s economic output remains weak in 2026 and 2027 before recovering in 2028 and 2029. Nominal GDP growth in 2026 is only 0.2 percentage points below the planning assumption in the Slower Growth Scenario, as strong growth in the first half of the year has limited the downside risk for 2026.
| Item | 2026p | 2027p | 2028p | 2029p |
|---|---|---|---|---|
| Faster Growth Scenario | 0.8 | 2.2 | 2.1 | 2.3 |
| Planning Projection | 0.5 | 1.5 | 1.8 | 2.0 |
| Slower Growth Scenario | 0.2 | 0.5 | 1.8 | 2.0 |
Table 2.7 footnotes:
p = Ontario Ministry of Finance planning projection based on external sources as of September 11, 2026, and alternative scenarios.
Source: Ontario Ministry of Finance.
| Item | 2026p | 2027p | 2028p | 2029p |
|---|---|---|---|---|
| Faster Growth Scenario | 4.6 | 4.5 | 4.2 | 4.3 |
| Planning Projection | 3.7 | 3.8 | 3.9 | 4.0 |
| Slower Growth Scenario | 3.5 | 2.6 | 3.5 | 3.7 |
Table 2.8 footnotes:
p = Ontario Ministry of Finance planning projection based on external sources as of September 11, 2026, and alternative scenarios.
Source: Ontario Ministry of Finance.
By 2029, the level of real GDP in the Faster Growth scenario is 1.5 per cent higher than in the Planning Projection, while in the Slower Growth scenario, the level of real GDP is 1.3 per cent lower. The nominal GDP scenarios show a wider range of outcomes over the projection period compared to the real GDP scenarios, largely due to uncertainty surrounding GDP inflation. By 2029, the level of nominal GDP in the Faster Growth scenario is 2.1 per cent higher than in the Planning Projection, while in the Slower Growth scenario, the level of nominal GDP is 2.1 per cent lower.
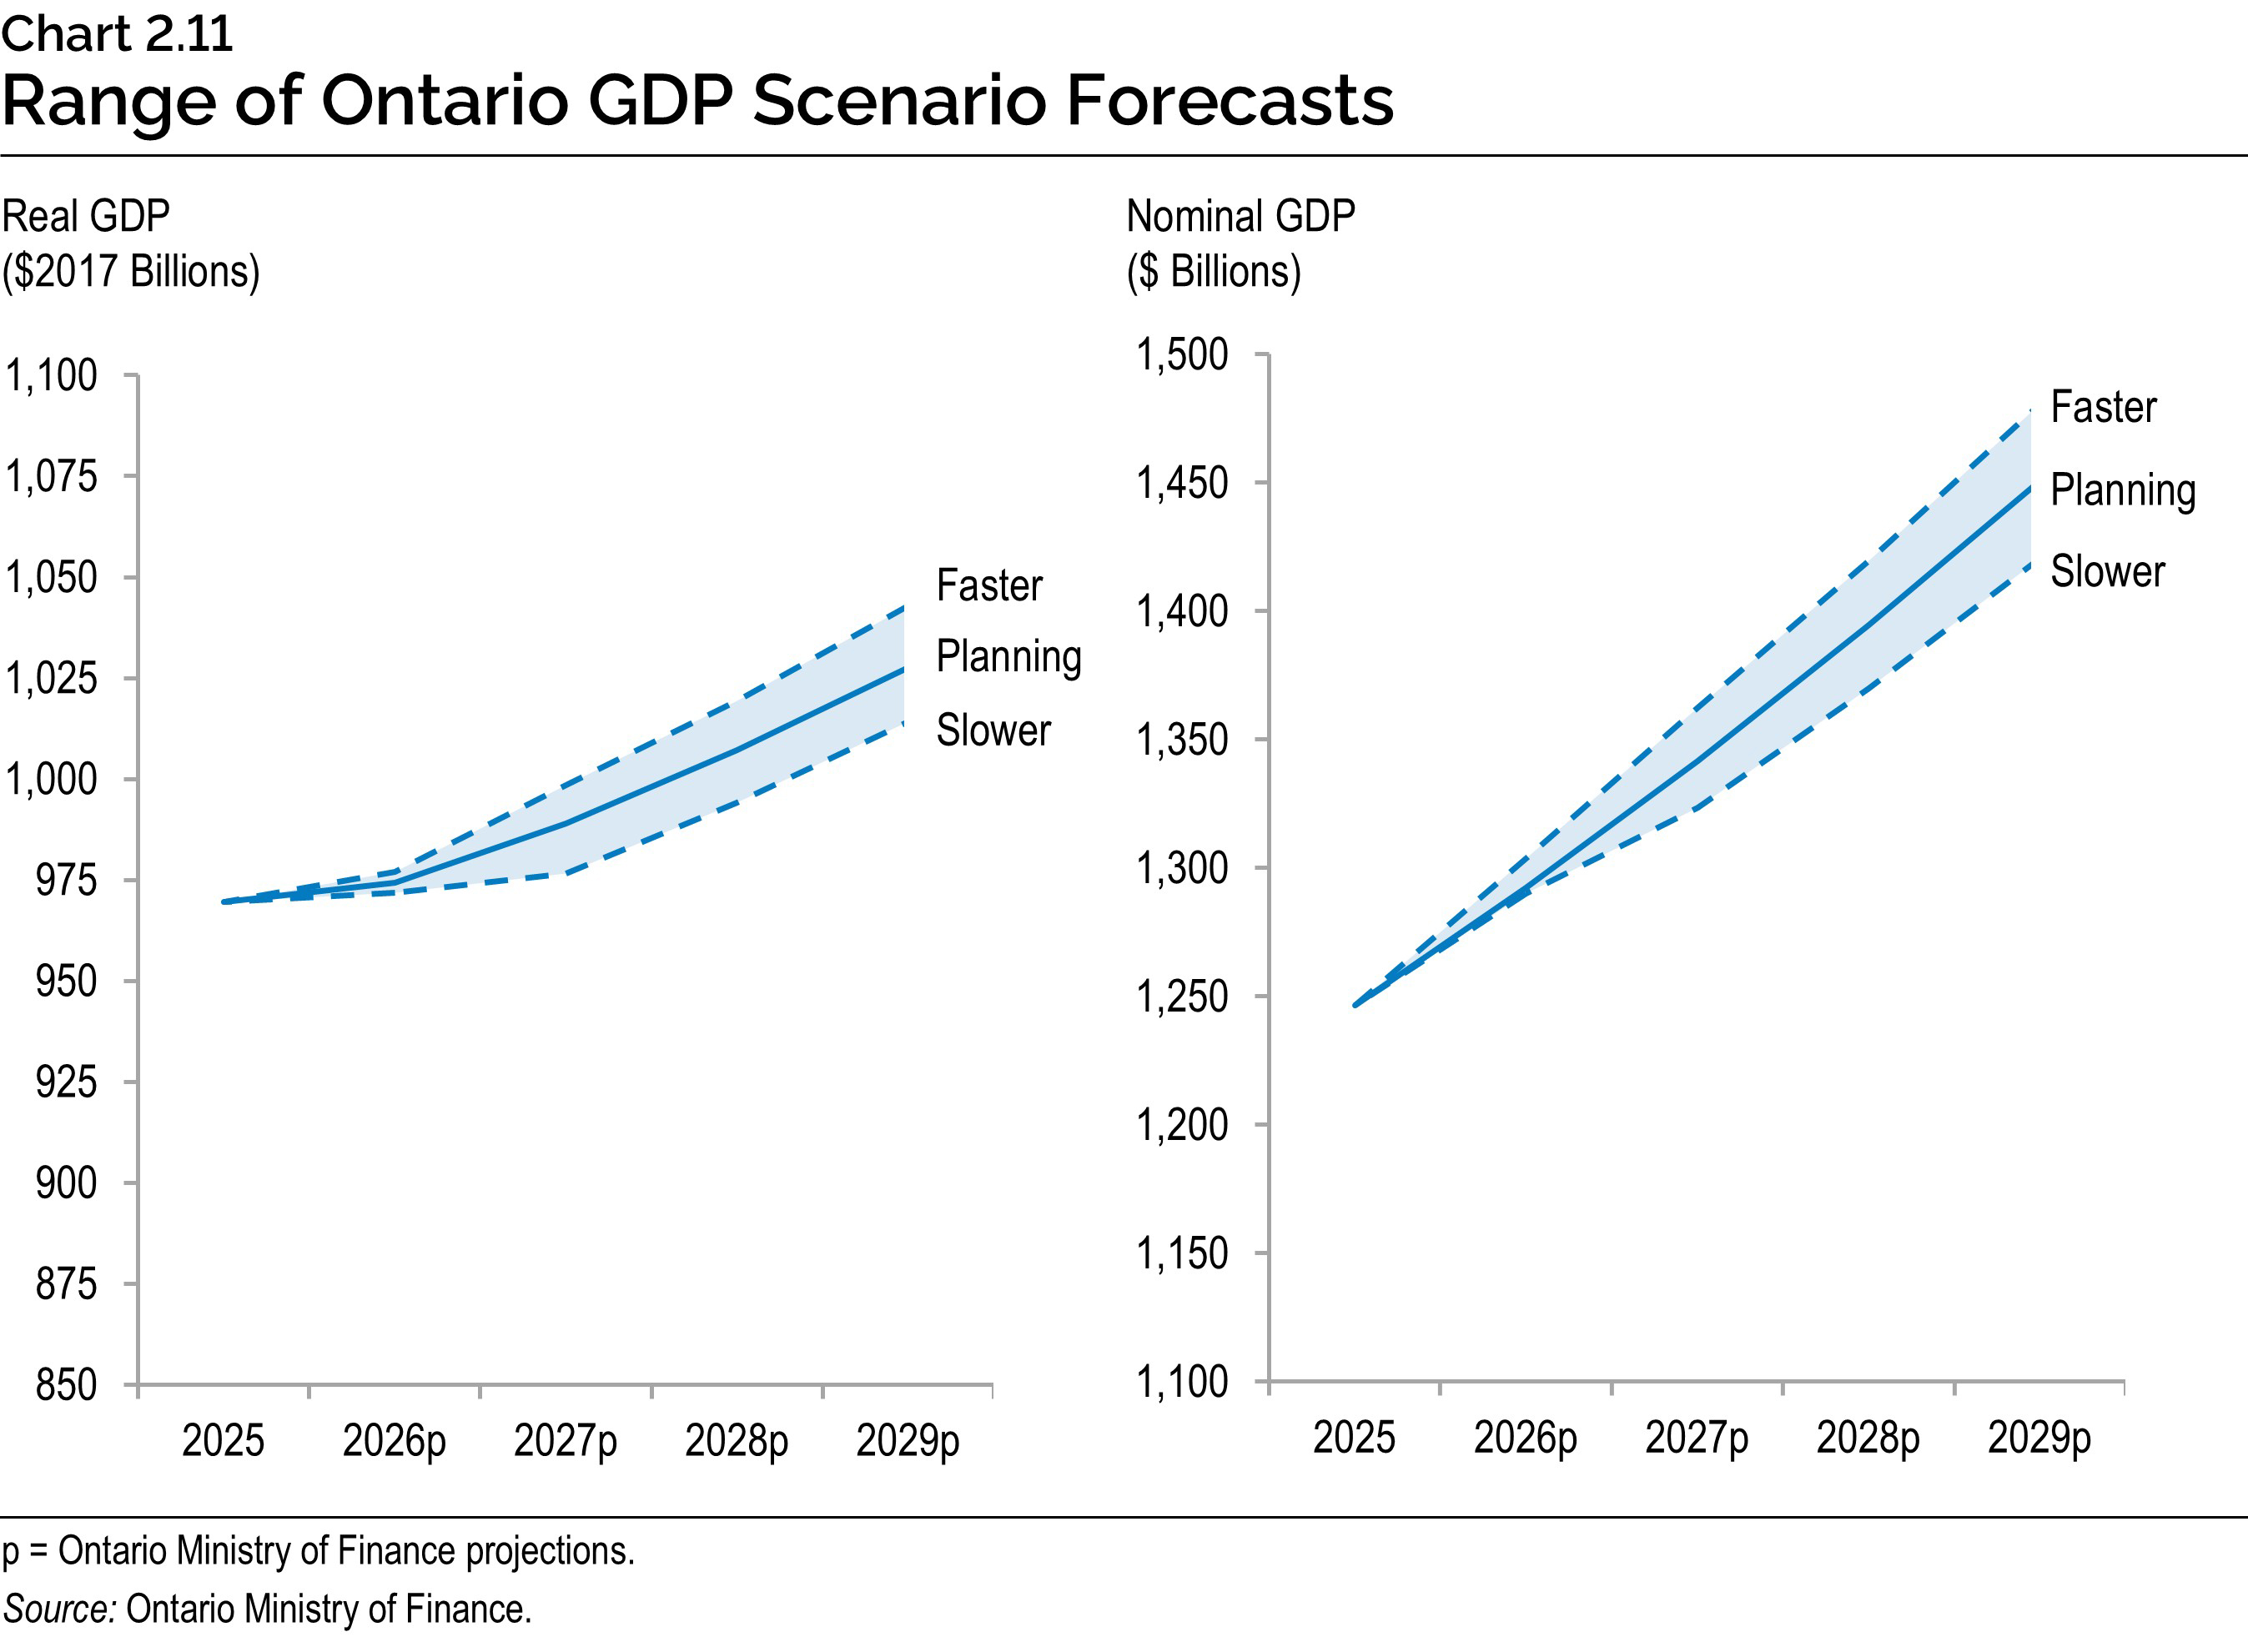
Chart Descriptions
Chart 2.1: Ontario Quarterly Real GDP Growth
This bar chart illustrates the quarterly growth rate for Ontario real gross domestic product between the first quarter of 2024 and the second quarter of 2026. Real gross domestic product growth is as follows: 0.4 per cent in 2024Q1; 0.4 per cent in 2024Q2; 0.3 per cent in 2024Q3; 1.0 per cent in 2024Q4; 0.6 per cent in 2025Q1; –0.7 per cent in 2025Q2; 0.6 per cent in 2025Q3; –0.3 per cent in 2025Q4; 0.0 per cent in 2026Q1; and 1.0 per cent in 2026Q2.
Source: Ontario Ministry of Finance.
Chart 2.2: Ontario Unemployment Rate
This line chart shows the quarterly average Ontario unemployment rate from 1976Q1 to 2026Q3 (shown as a solid blue line), and the historical quarterly average (shown as a dotted grey line).
In 1989Q3 the unemployment rate was 4.8 per cent; in 2009Q2 it was 9.4 per cent; in 2020Q2 it was 13.0 per cent; and in 2026Q3 it was 6.9 per cent. The historical average is 7.4 per cent.
Source: Statistics Canada.
Chart 2.3: Ontario Inflation is Lower than Canada’s
This line chart shows CPI inflation in year-over-year per cent for all items for Ontario (shown as a solid blue line) and Canada (shown as a solid grey line) from January 2019 to August 2026.
In August 2026, Ontario CPI inflation for all items was 2.4 per cent year-over-year, while it was 3.0 per cent year-over-year for Canada.
Source: Statistics Canada.
Chart 2.4: Ontario Nominal GDP Growth Projected to Rise
The bar chart shows Ontario real and nominal GDP growth rates from 2025 to 2029. The difference between the nominal growth rate and real growth rate is the GDP inflation for each year.
Ontario nominal GDP growth was 4.1 per cent in 2025 and is projected to be 3.7 per cent in 2026, 3.8 per cent in 2027, 3.9 per cent in 2028 and 4.0 per cent in 2029.
Ontario real GDP growth was 1.3 per cent in 2025 and is projected to be 0.5 per cent in 2026, 1.5 per cent in 2027, 1.8 per cent in 2028 and 2.0 per cent in 2029.
Ontario GDP inflation was 2.8 per cent in 2025 and is projected to be 3.2 per cent in 2026, 2.3 per cent in 2027, 2.1 per cent in 2028 and 2.0 per cent in 2029.
Note: Projections for 2026 to 2029 are the Ontario Ministry of Finance planning projection based on external sources as of September 11, 2026.
Source: Ontario Ministry of Finance.
Chart 2.5: Global Real GDP Growth Projections
This bar chart shows real GDP growth in per cent for 2025, 2026 and 2027 for the world economy, the United States, the Euro area and China. Real GDP growth rates for 2025 are actuals and for 2026 and 2027 are projections. Real GDP growth in 2025, 2026 and 2027 for the world economy is 3.5 per cent, 3.0 per cent and 3.4 per cent; 2.1 per cent, 2.1 per cent and 2.0 per cent in the United States; 1.2 per cent, 0.9 per cent and 1.2 per cent in the Euro area; and 5.0 per cent, 4.6 per cent and 4.1 per cent in China.
Sources: International Monetary Fund (July 2026) and Blue Chip Economic Indicators (September 2026).
Chart 2.6: Bank of Canada Maintains Policy Interest Rate
This line chart shows the Bank of Canada target for the overnight rate in per cent from January 2016 to September 2026. In its September 2 announcement, the Bank of Canada maintained its policy interest rate at 2.25 per cent. The decision marks the seventh consecutive time the central bank has left the policy rate unchanged. Overall, the Bank of Canada has maintained a steady policy rate throughout 2026. The grey area shows the range of the Bank of Canada nominal neutral policy rate, which was estimated to be between 3.0 and 4.0 per cent from January 2016 to March 2016, between 2.75 and 3.75 per cent from April 2016 to March 2017, between 2.5 and 3.5 per cent from April 2017 to March 2019, between 2.25 and 3.25 per cent from April 2019 to September 2020, between 1.75 and 2.75 per cent from October 2020 to March 2022, between 2.0 and 3.0 per cent from April 2022 to March 2024, and between 2.25 per cent and 3.25 per cent from April 2024 to September 2026.
Source: Bank of Canada.
Chart 2.7: Canada-United States Exchange Rate
This line chart shows the Canadian dollar exchange rate with the U.S. dollar from September 2025 to September 2026. The currency weakened through fall 2025, averaging 71.5 US cents between September and November before edging up to 72.5 US cents in December. It then climbed to 74.0 US cents in January 2026, before declining sharply over the following months to a low of 70.3 US cents around mid-year. The currency subsequently recovered some ground, reaching a daily average of 72.0 US cents in August and 72.3 US cents in early September 2026.
From September 2025 to September 2026, the highest daily exchange rate of the Canadian dollar was 74.0 cents US in January 2026 while the lowest daily exchange rate of the Canadian dollar was 70.3 cents US in June 2026.
Source: Bank of Canada.
Chart 2.8: Labour Market Expected to Strengthen
This chart shows Ontario’s annual employment changes and unemployment rate from 2019 to 2025 and projections for 2026 to 2029.
The bars show the annual change in Ontario’s employment. There was an increase in employment of 173,000 in 2019 and then a decline of 370,000 in 2020. Employment grew by around 360,000 in both 2021 and 2022 and then slowed to 242,000 in 2023, 140,000 in 2024 and 81,000 in 2025. Employment gains are forecast to be 33,000 in 2026, 50,000 in 2027, 58,000 in 2028 and 104,000 in 2029.
The line shows Ontario’s unemployment rate. The unemployment rate increased from 5.5 per cent in 2019 to 9.8 per cent in 2020 and 8.1 per cent in 2021. The unemployment rate decreased to 5.6 per cent in 2022 and remained at 5.6 per cent in 2023, before rising to 7.0 per cent in 2024 and 7.7 per cent in 2025. The unemployment rate is projected to be 7.2 per cent in 2026, 6.7 per cent in 2027, 6.3 per cent in 2028 and 6.1 per cent in 2029.
Note: Projections for 2026 to 2029 are the Ontario Ministry of Finance planning projection based on external sources as of September 11, 2026.
Sources: Statistics Canada and Ontario Ministry of Finance.
Chart 2.9: Ontario Inflation Forecast to Stabilize at Target
This line chart shows annual Ontario Consumer Price Index (CPI) inflation from 2019 to 2025, as well as projected Ontario CPI inflation for 2026 through 2029. The Ontario Ministry of Finance’s planning projection is based on external sources as of September 11, 2026.
Ontario CPI inflation was 1.9 per cent in 2019, 0.7 per cent in 2020, 3.5 per cent in 2021, 6.8 per cent in 2022, 3.8 per cent in 2023, 2.4 per cent in 2024, and 1.9 per cent in 2025.
Ontario CPI inflation is projected to be 2.3 per cent in 2026, before slowing to 2.1 per cent in 2027 and 2.0 per cent in 2028 and 2029.
The shaded area on the chart shows the range of private-sector forecasts for Ontario CPI inflation for 2026 through 2029. Private-sector forecasts range from 2.1 per cent to 2.5 per cent in 2026. The range is 1.7 per cent to 2.4 per cent in 2027. The range then narrows to 1.7 per cent to 2.1 per cent in 2028 and 1.9 per cent to 2.0 per cent in 2029.
Sources: Statistics Canada, Ontario Ministry of Finance and Ontario Ministry of Finance Survey of Forecasters.
Chart 2.10: Housing Market Projected to Recover
The left bar chart shows Ontario’s annual home resale growth rates from 2019 to 2025 and projections for 2026 to 2029. Ontario home resales increased 10.0 per cent in 2019, 9.1 per cent in 2020 and 17.6 per cent in 2021, decreased 32.6 per cent in 2022 and 11.8 per cent in 2023, and increased 3.6 per cent in 2024 before decreasing 5.9 per cent in 2025. Ontario home resales are projected to decrease 0.7 per cent in 2026, before increasing 7.8 per cent in 2027, 5.1 per cent in 2028 and 5.3 per cent in 2029.
The right bar chart shows Ontario’s annual average home resale price growth rates from 2019 to 2025 and projections for 2026 to 2029. Ontario’s average home resale price increased 6.3 per cent in 2019, 16.2 per cent in 2020, 23.9 per cent in 2021 and 6.9 per cent in 2022, and decreased 6.3 per cent in 2023, 1.1 per cent in 2024 and 4.4 per cent in 2025. The average home resale price is projected to decrease 2.4 per cent in 2026 before increasing 1.4 per cent in 2027, 4.2 per cent in 2028 and 4.6 per cent in 2029.
Sources: Canadian Real Estate Association and Ontario Ministry of Finance.
Chart 2.11: Range of Ontario GDP Scenario Forecasts
The line chart on the left shows the Ontario real GDP estimate in 2025 and the Ontario Ministry of Finance planning projection for real GDP from 2026 to 2029, in billions of 2017 dollars. Separate lines show the levels of real GDP in the Faster Growth and the Slower Growth scenarios for 2026 to 2029. Ontario real GDP was estimated to be $969 billion in 2025. In the Planning Projection, Ontario real GDP is projected to rise from $974 billion in 2026 to $1,028 billion in 2029. In the Faster Growth scenario, Ontario real GDP is projected to rise from $977 billion in 2026 to $1,043 billion in 2029. In the Slower Growth scenario, Ontario real GDP is projected to rise from $972 billion in 2026 to $1,014 billion in 2029.
The line chart on the right shows the Ontario nominal GDP estimate in 2025 and the Ontario Ministry of Finance planning projection for nominal GDP from 2026 to 2029, in billions of dollars. Separate lines show the levels of nominal GDP in the Faster Growth and the Slower Growth scenarios for 2026 to 2029. Ontario nominal GDP was $1,246 billion in 2025. In the Planning Projection, Ontario nominal GDP is projected to rise from $1,292 billion in 2026 to $1,451 billion in 2029. In the Faster Growth scenario, Ontario nominal GDP is projected to rise from $1,304 billion in 2026 to $1,481 billion in 2029. In the Slower Growth scenario, Ontario nominal GDP is projected to rise from $1,290 billion in 2026 to $1,421 billion in 2029.
Source: Ontario Ministry of Finance.