Introduction
As of March 5, 2021, Ontario completed $59.0 billion in long-term borrowing in 2020–21. This is $6.7 billion higher than the 2020 Budget forecast primarily due to pre‑funding of $5.2 billion for fiscal year 2021–22 and a $1.4 billion increase in investments in capital assets. The 2021–22 long‑term public borrowing forecast is $54.7 billion, a decrease of $3.9 billion from the 2020 Budget forecast.
Ontario launched a number of large bond issues in the 2020–21 fiscal year to enable it to complete its borrowing program. These included the largest issues ever launched by a province in the Canadian domestic bond market, the euro denominated bond market, the pound sterling bond market, the second largest issue in the U.S. dollar bond market and the two largest Green Bond issues ever launched by the Province.
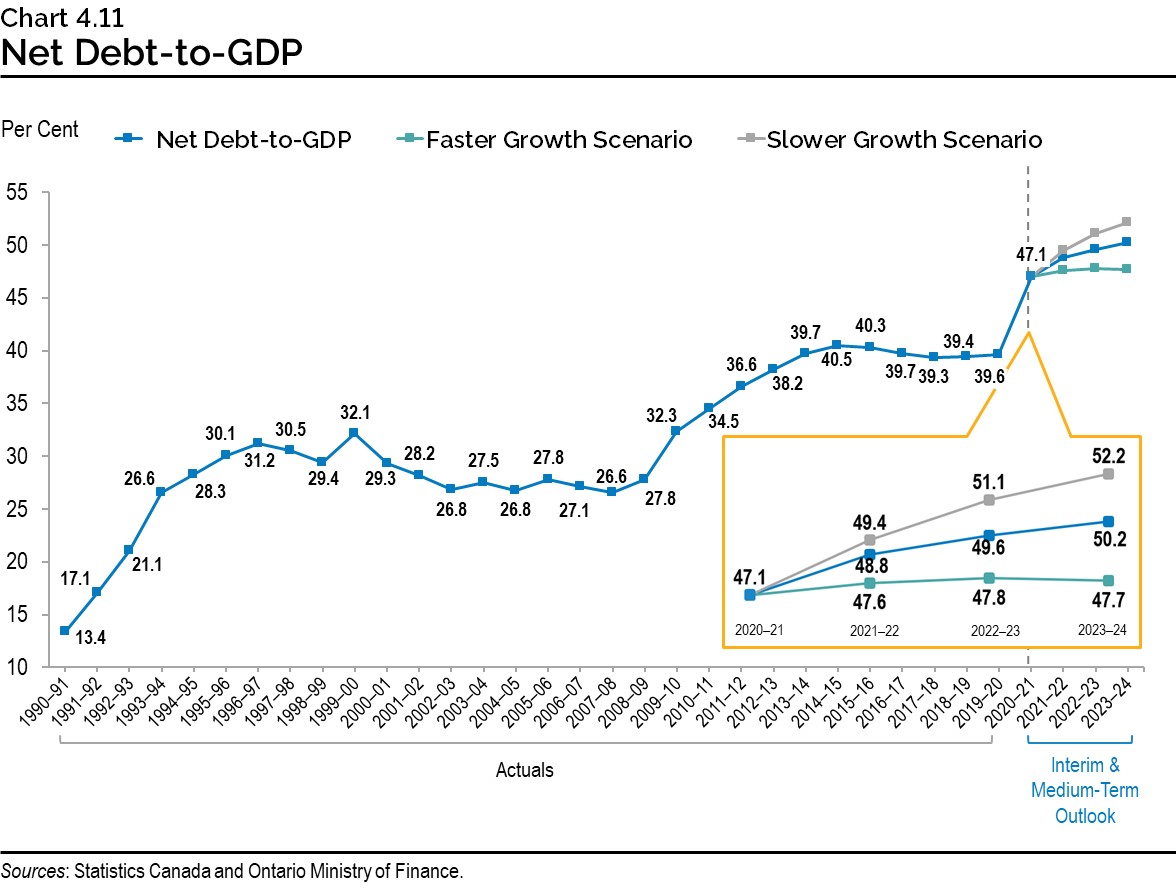
Due to the increase in the Province’s investments in capital assets, Ontario’s net debt-to-GDP ratio is now forecast to be 47.1 per cent in 2020–21, and 48.8 per cent in 2021–22, compared to forecasts of 47.0 per cent and 48.5 per cent, respectively, at the time of the 2020 Budget.
Ontario is forecast to pay $12.5 billion in interest costs in 2020–21, and $13.1 billion in 2021–22, unchanged and $0.1 billion lower, respectively, than forecasted in the 2020 Budget.
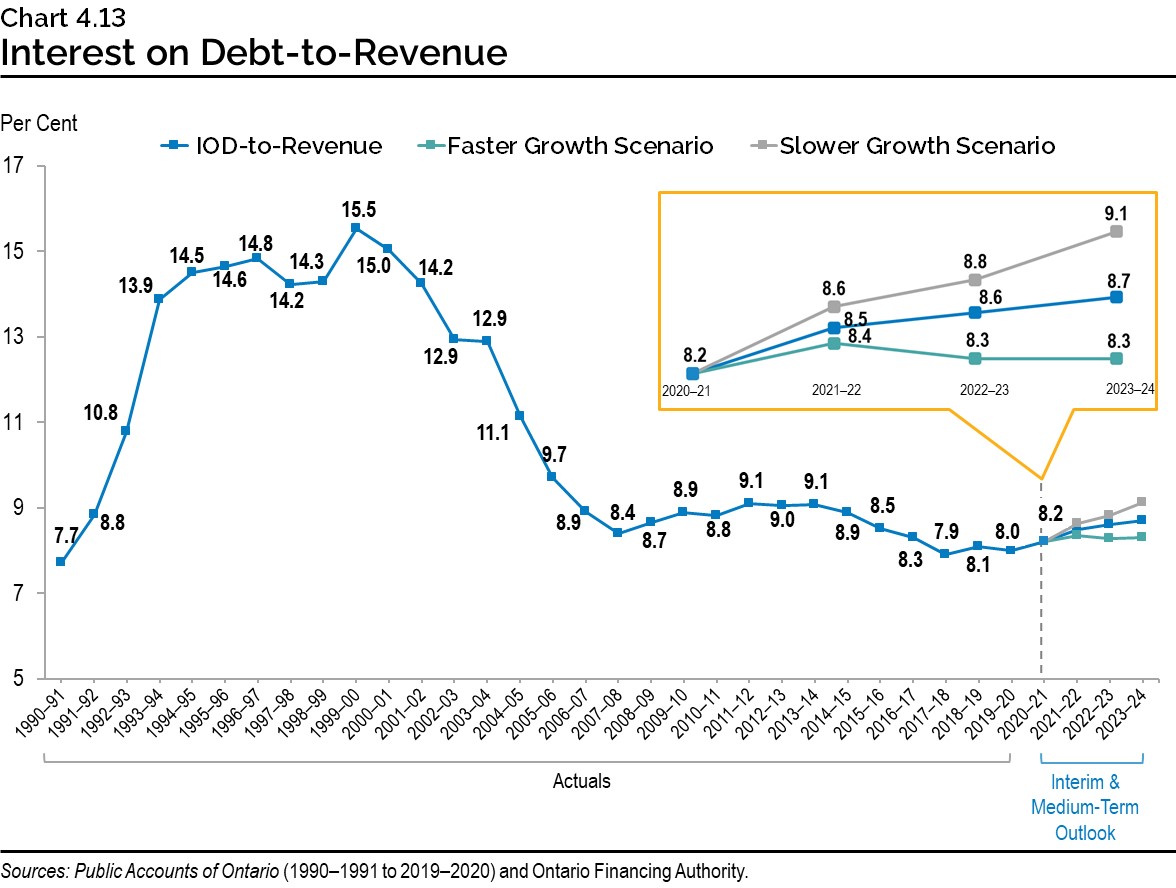
Ontario’s 2020–21 interest on debt-to-revenue forecast remains unchanged from the 2020 Budget forecast of 8.2 per cent. In 2021–22, this ratio is forecast to increase to 8.5 per cent, 0.2 percentage points lower than the 2020 Budget forecast of 8.7 per cent, demonstrating the continued relative affordability of Ontario’s debt.
Borrowing Program
Ontario’s borrowing program is primarily used to fund deficits, refinance maturing debt and make investments in capital assets. Ontario will continue to finance most of its borrowing program in the long-term public markets in Canada and internationally. Ontario will also continue to increase short‑term borrowing to keep the proportion of short-term debt in the range of six to eight per cent of total debt outstanding.
| 2020–21 — 2020 Budget |
2020–21 — Change from 2020 Budget |
2020–21 — Interim1 2020–21 |
Medium-Term Outlook — 2021–22 |
Medium-Term Outlook — 2022–23 |
Medium-Term Outlook — 2023–24 |
|
|---|---|---|---|---|---|---|
| Deficit/(Surplus) | 38.5 | – | 38.5 | 33.1 | 27.7 | 20.2 |
| Investment in Capital Assets | 10.6 | 1.4 | 11.9 | 11.8 | 12.5 | 11.9 |
| Non-Cash Adjustments | (9.2) | – | (9.2) | (9.5) | (9.5) | (9.5) |
| Loans to Infrastructure Ontario | – | – | – | 0.2 | (0.2) | 0.0 |
| Other Net Loans/Investments | 0.6 | (0.7) | (0.1) | 1.3 | 0.1 | (1.0) |
| Debt Maturities/Redemptions | 26.7 | – | 26.7 | 25.0 | 30.5 | 33.6 |
| Total Funding Requirement | 67.0 | 0.7 | 67.7 | 61.9 | 61.1 | 55.2 |
| Decrease/(Increase) in Short-Term Borrowing | (5.7) | 4.7 | (1.0) | (6.0) | (2.0) | – |
| Increase/(Decrease) in Cash and Cash Equivalents | (1.4) | (4.0) | (5.4) | 4.0 | – | – |
| Pre-borrowing in 2019–20 | (7.6) | – | (7.6) | – | – | – |
| Pre-borrowing for 2021–22 | – | 5.2 | 5.2 | (5.2) | – | – |
| Total Long-Term Public Borrowing | 52.3 | 6.7 | 59.0 | 54.7 | 59.1 | 55.2 |
Table 4.1 footnotes:
[1] Interim represents the 2021 Budget projection for the 2020–21 fiscal year.
Note: Numbers may not add due to rounding.
Source: Ontario Financing Authority.
Ontario’s long-term borrowing requirement for 2020–21 increased by $6.7 billion from the 2020 Budget forecast, primarily due to pre-funding of $5.2 billion for fiscal year 2021–22 and a $1.4 billion increase in investments in capital assets. The total long-term borrowing requirements for 2021–22 and 2022–23 are forecast to be $54.7 billion and $59.1 billion, respectively, lower by $3.9 billion and $0.2 billion compared to the 2020 Budget forecast for those fiscal years.
Ontario’s short-term borrowing program in 2020–21 is now forecast to increase by only $1.0 billion compared to the $5.7 billion forecast in the 2020 Budget, and then by $6.0 billion in 2021–22. Over the two-year period, short-term borrowing is forecast to increase by a total of $7.0 billion compared to a forecast of $7.7 billion in 2020 Budget. Short-term borrowing, consisting of a combination of Canadian dollar treasury bills and U.S. commercial paper issuance, provides cost-effective financing and serves as a contingency source of funding.
The government will seek approval from the Legislature for borrowing authority to meet the Province’s borrowing requirements.
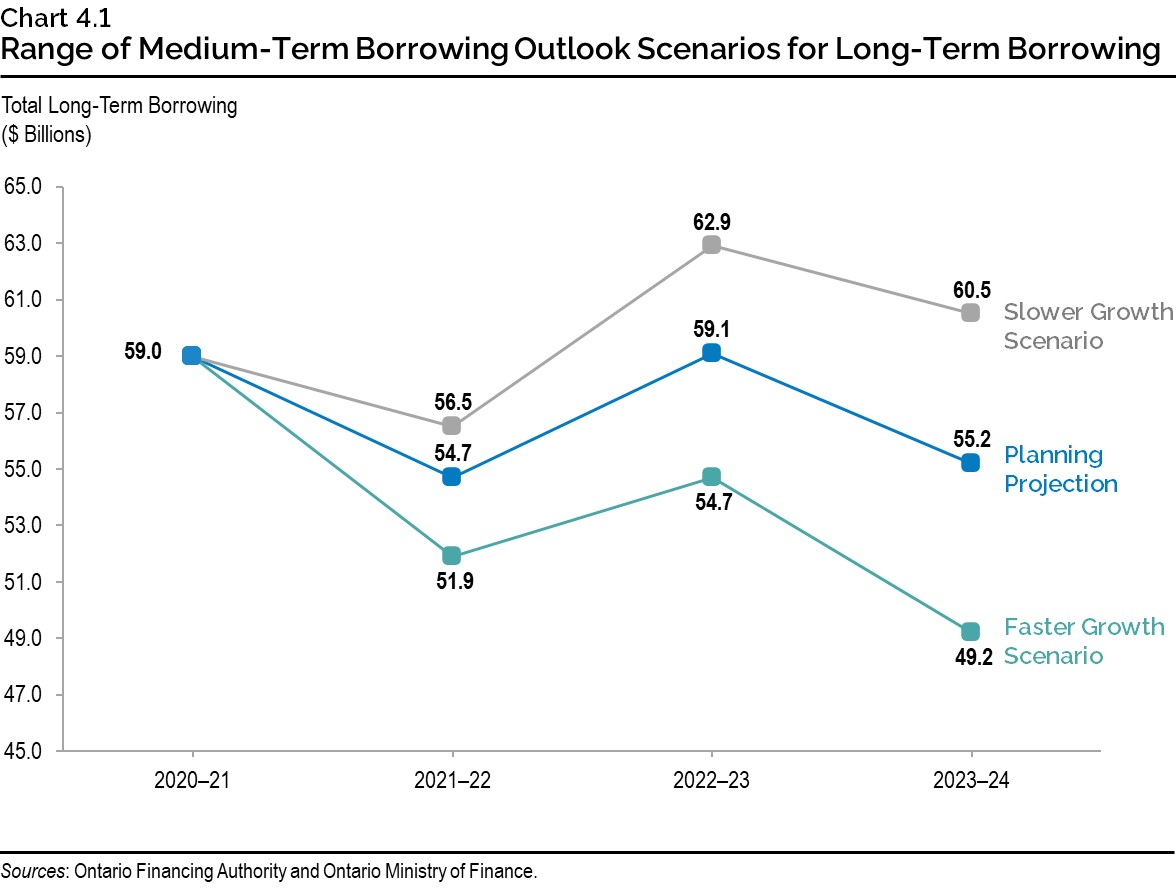
In the event that alternative economic scenarios materialize, the province’s borrowing requirements in the next three years would also change. See Ontario’s Economic and Fiscal Outlook in Brief for more details and a description of the resulting alternative medium-term outlook scenarios. Under the Faster Growth scenario, long-term borrowing would decrease by a total of $13.2 billion over the medium-term outlook, while under the Slower Growth scenario, long-term borrowing would increase by $10.9 billion over the same period.
The strong demand for Ontario debt globally has resulted in Ontario completing more of its long‑term borrowing internationally. As a result, domestic borrowing was below the Province’s target range of issuing 70 to 80 per cent in the Canadian dollar market. Approximately 65 per cent of 2020–21 borrowing has been completed in Canadian dollars through 37 syndicated issues, including the largest issue ever by a province in the Canadian dollar bond market and the two largest Green Bond issues to-date by Ontario. Based on the 2020–21 experience, Ontario has adjusted its target range for domestic borrowing to 65 to 80 per cent for the 2021–22 fiscal year. This range will be further adjusted, if necessary, in response to evolving investor demand in the Canadian dollar and foreign currency debt markets.
Foreign currency borrowing helps reduce Ontario’s overall borrowing costs by continuing to diversify Ontario’s investor base. In 2020–21 Ontario launched the largest issues ever by a province in the euro denominated bond market, the pound sterling bond market, and the second‑largest issue in the U.S. dollar bond market. This diversification ensures the government will continue to have access to capital even if domestic market conditions become challenging.
Green Bond Program
Green Bonds remain a core component of Ontario’s borrowing program and are an important tool to help finance public transit initiatives, extreme weather-resistant infrastructure, as well as energy efficiency and conservation projects. Subject to market conditions, Ontario plans to continue to issue multiple Green Bonds each fiscal year, including in 2021–22.
Ontario’s leadership role in the Canadian dollar Green Bond market has paved the way for other issuers. Over the last few years, there has been a significant increase in issuers in the Canadian dollar Green Bond market, including participation by utilities, pension funds, corporations and all levels of government in Canada. Ontario looks forward to continuing to expand its work in the Green Bond space and collaborating with other Canadian issuers on implementing their own Green Bond programs.
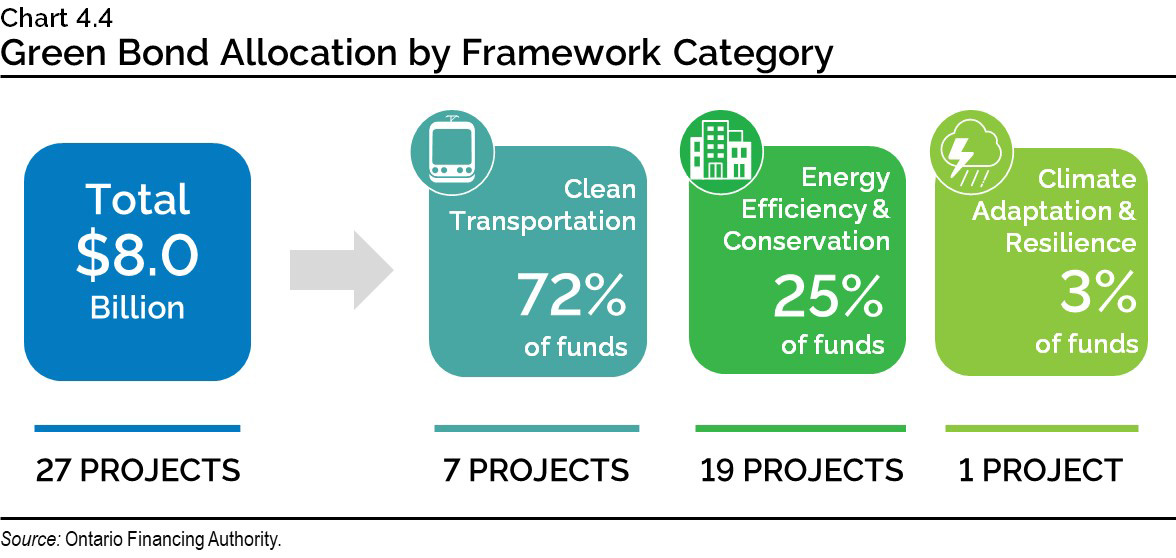
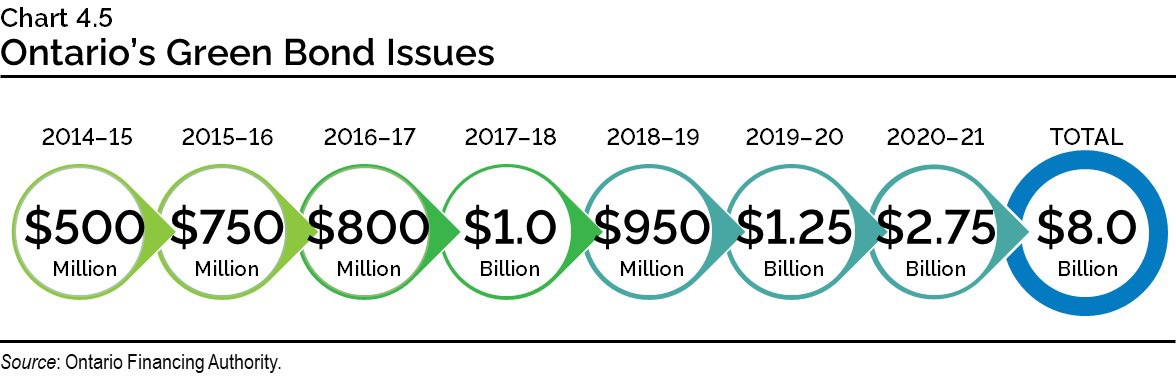
In January 2021, Ontario launched its second Green Bond of fiscal 2020–21, and ninth Green Bond overall. This issue was for $1.25 billion and follows a $1.5 billion Green Bond launched in October 2020. These are the two largest Canadian dollar Green Bond issues ever launched. Nine projects have been selected as eligible to receive funding from Ontario’s latest Green Bond, with an emphasis on clean transportation, energy efficiency and conservation, and climate adaptation and resilience framework categories. Ontario remains the largest issuer of Canadian dollar Green Bonds, totalling $8.0 billion since 2014–15, with $7.5 billion outstanding.
Cost of Debt
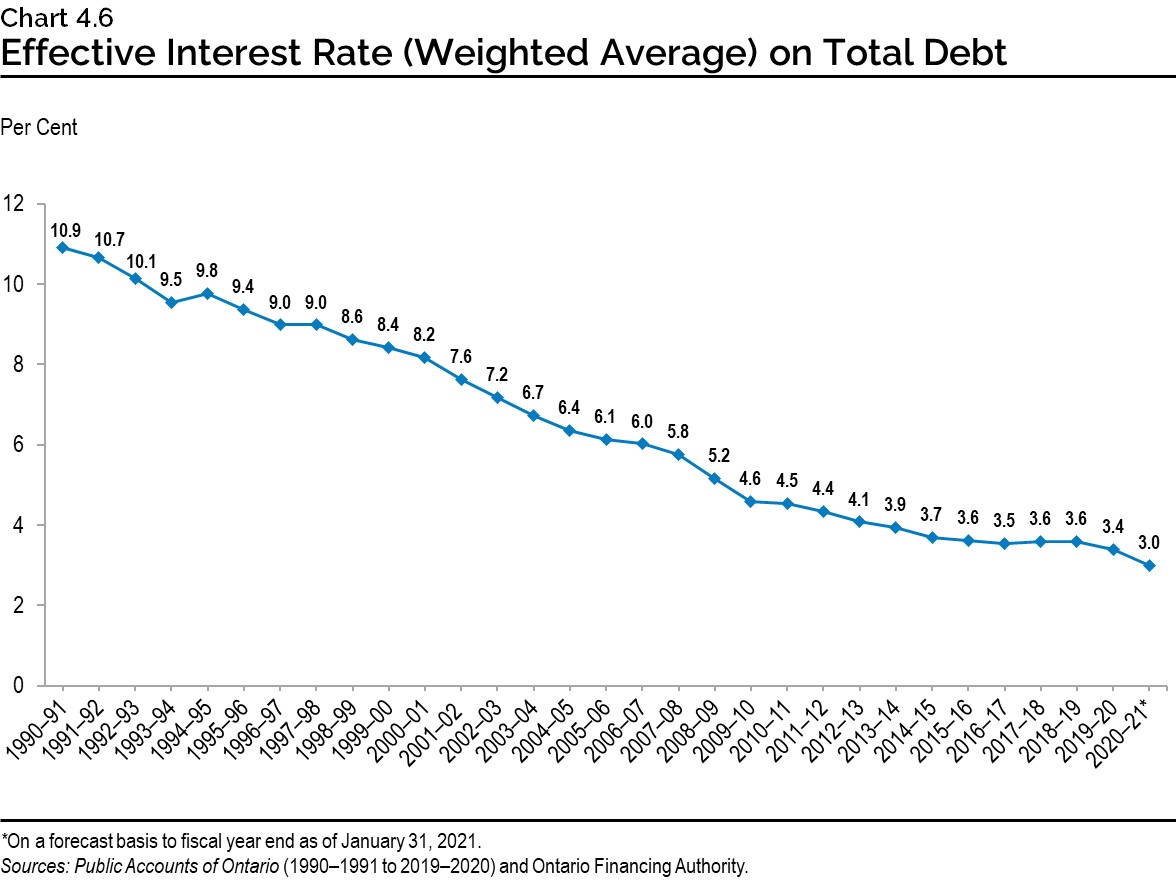
The three-decade decline in interest rates has meant interest on debt (IOD) has not risen as quickly as Ontario’s debt. Chart 4.6 shows the declining effective interest rate Ontario is paying on its total debt portfolio.
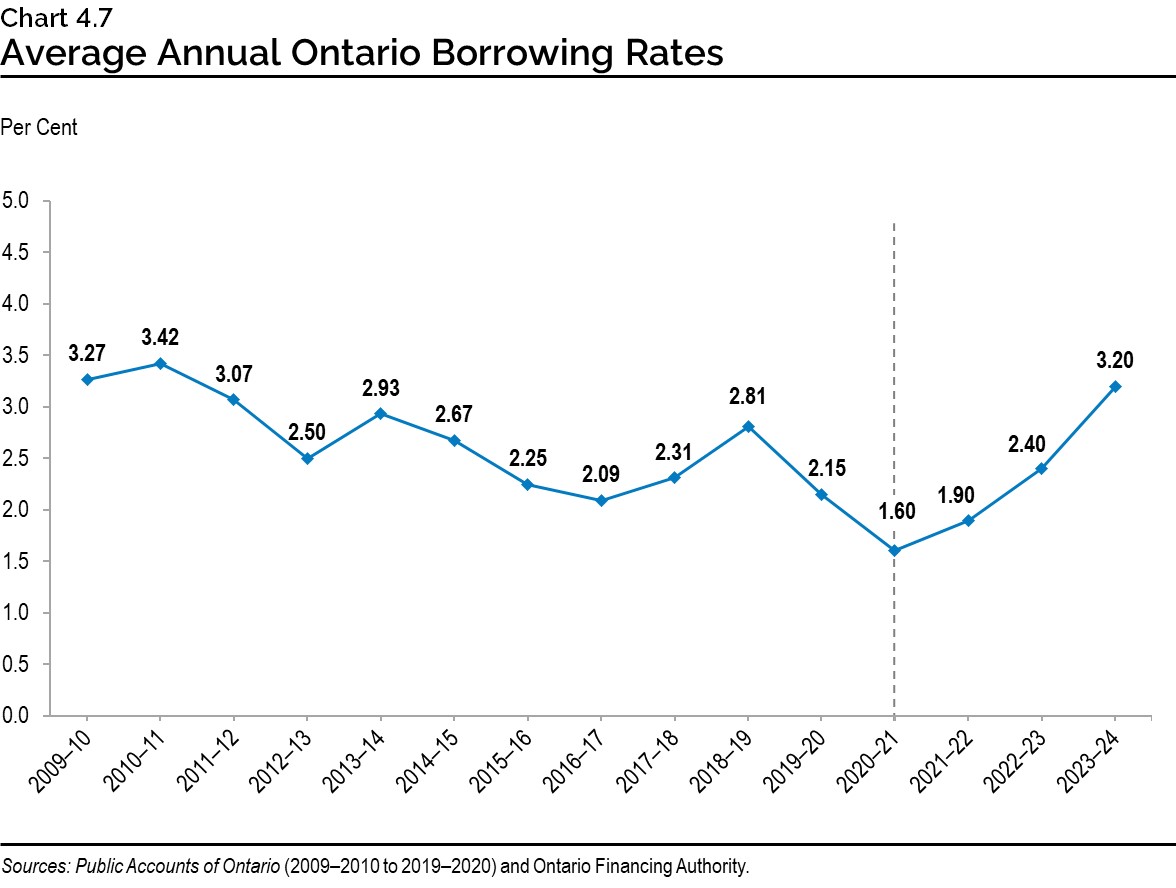
Ontario’s average cost of borrowing in 2021–22 is forecast to be 1.90 per cent. A one percentage point change in interest rates, either up or down, from the current forecast is estimated to have a corresponding change in Ontario’s interest costs by over $750 million in the first full year.
Chart 4.7 shows historic borrowing rates on debt issued and the forecast used to estimate the future cost of borrowing or IOD expense.
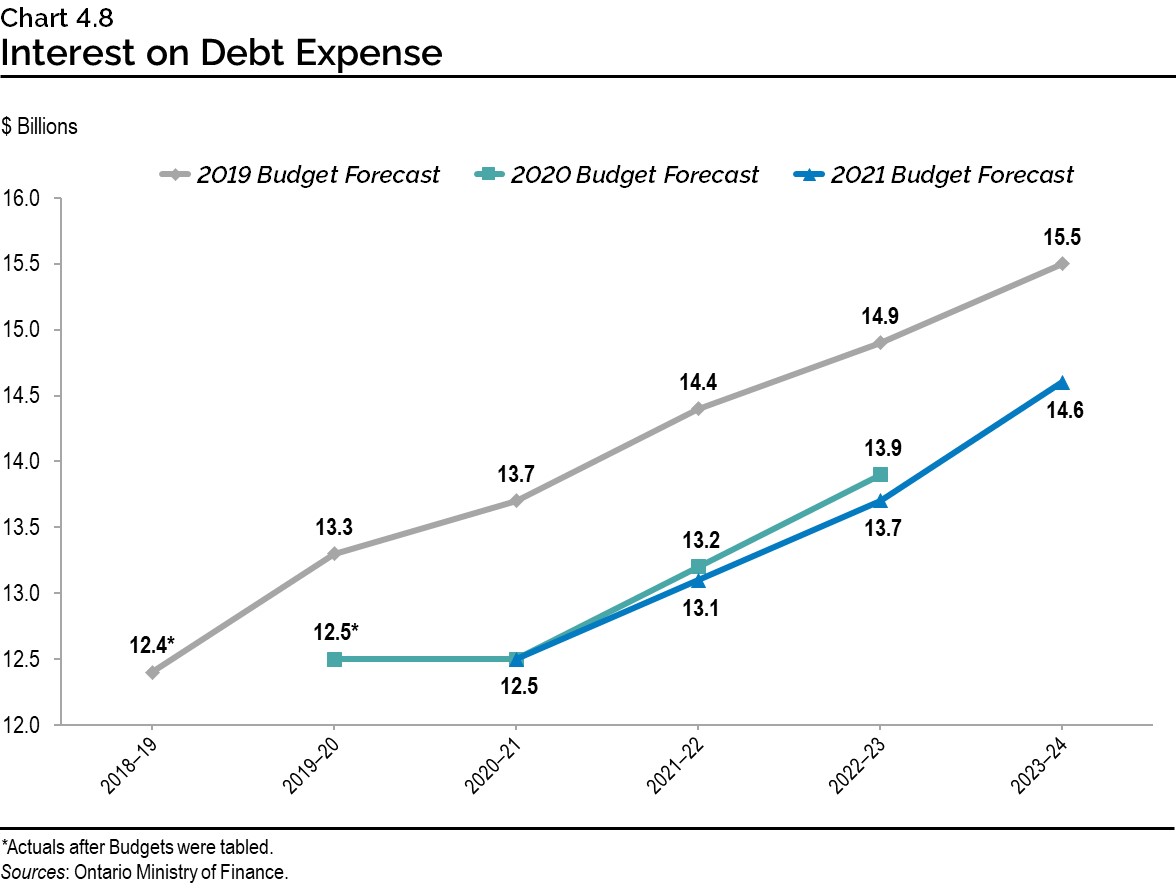
The interest rates Ontario must pay on new or refinanced debt issued remain low. Chart 4.8 shows how lower than projected interest rates have resulted in Ontario’s current IOD forecast remaining below the levels projected in the pre-pandemic 2019 Budget, despite significantly higher deficits, borrowing and debt levels than forecast at that time. The IOD forecast for 2020–21 remains unchanged from the forecast in the 2020 Budget, and the medium-term IOD expense outlook in the 2021 Budget is now projected to be slightly lower than the 2020 Budget forecast. However,IOD remains Ontario’s fourth-largest expense after health care, education and social services.
Term of Debt
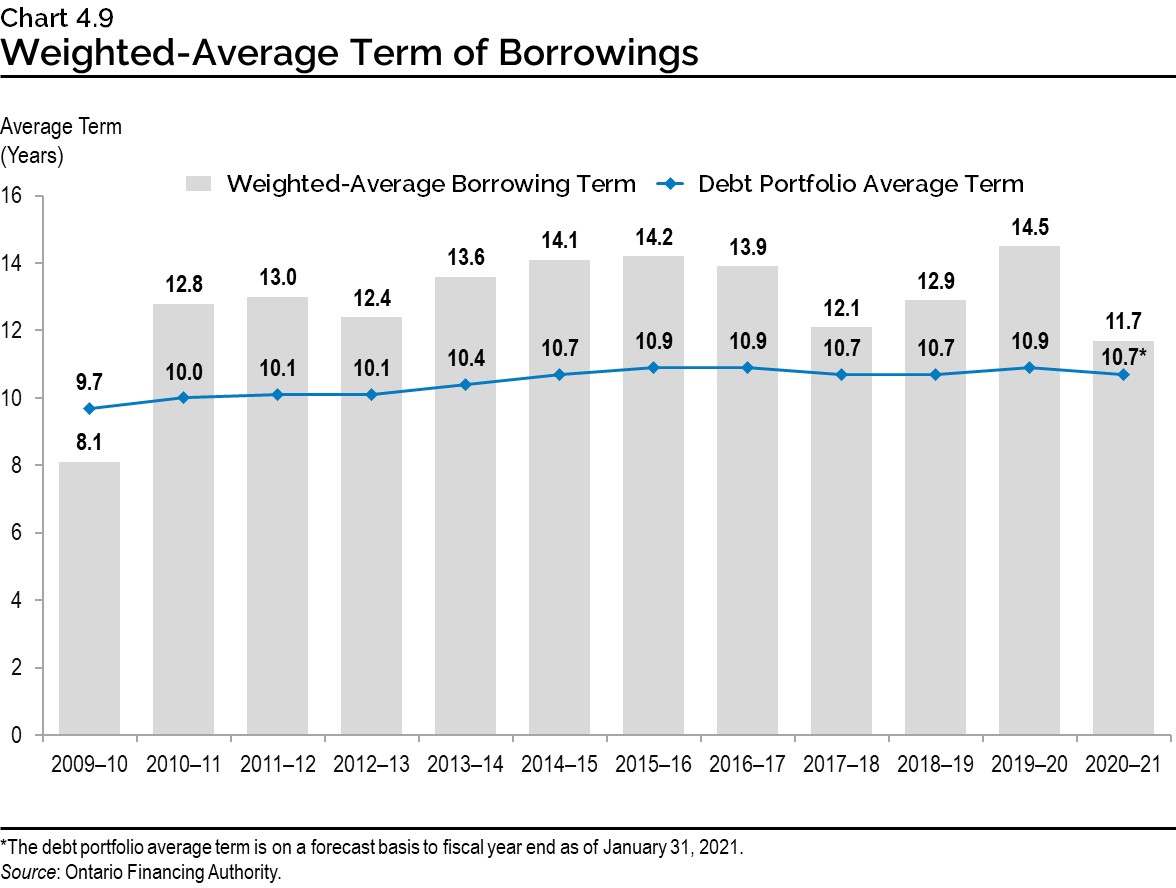
Ontario continues to extend the term of its debt, when investor demand allows, to reduce refinancing risk on maturing debt and capitalize on historically low interest rates. This also protects the IOD forecast, in the long term, against increases in interest rates from the current historically low levels. Ontario has issued $102.6 billion of bonds, or approximately one‑quarter of total debt, with maturities of 30 years or longer since 2010–11. This includes $10.1 billion in 2020–21.
As a result, the average term of Ontario’s debt portfolio, which now stands at 10.7 years, was extended by one year from its 2009–10 level by 2014–15, and has been held at that level since. With low interest rates and a large borrowing program, the current plan is to maintain the term of Ontario’s debt at these levels.
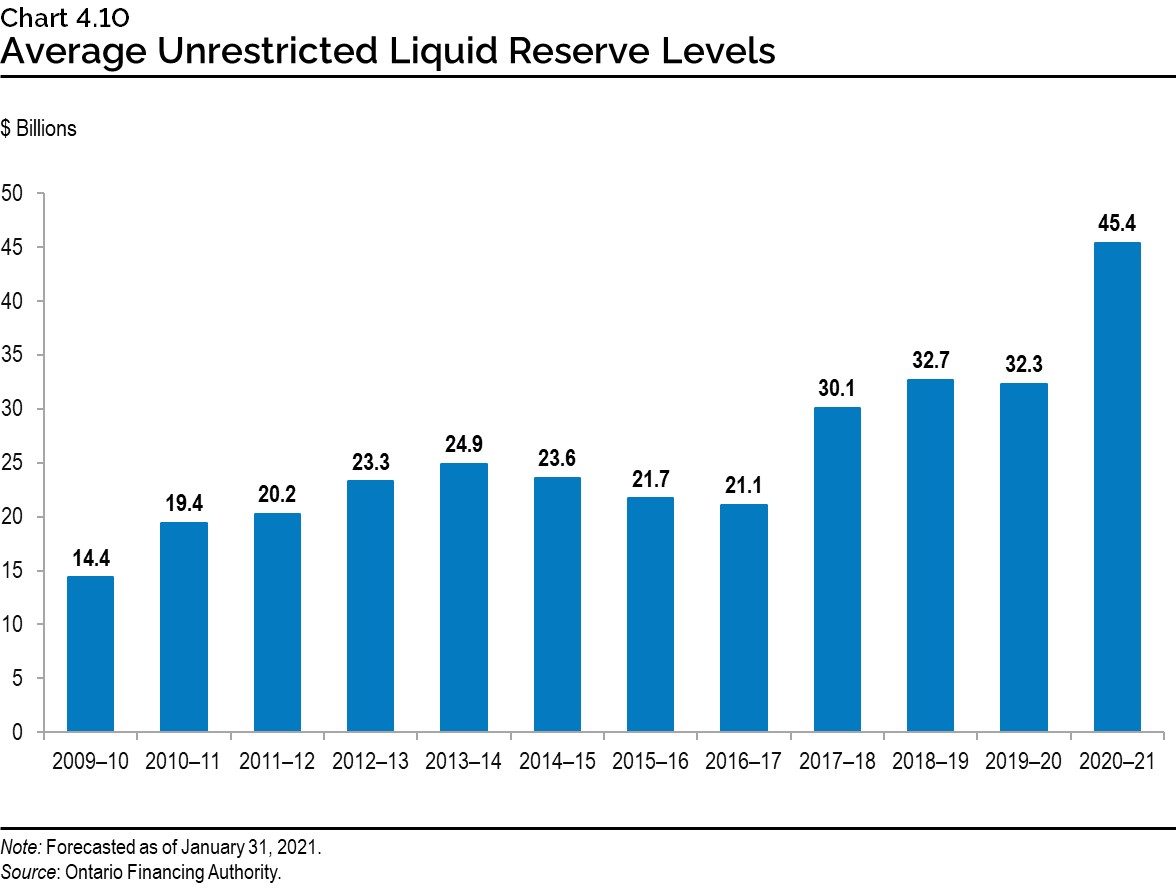
Ensuring Adequate Liquidity Levels
Ontario balances the objective of minimizing the cost of holding liquid reserves against the need to always have enough cash on hand to pay its bills, invest in capital assets, refinance maturing debt and pay interest. Ensuring Ontario always has sufficient liquidity to meet its cashflow needs is even more critical during the COVID‑19 pandemic in order to continue to address any unforeseen economic or public health needs.
Another reason Ontario has needed to build large cash reserves is that, coming out of the 2008–09 global financial crisis, the Province responded to investor demand by creating large, liquid 10‑year and 30-year benchmark domestic bond issues. This lowered Ontario’s borrowing costs while significantly enhancing the Province’s ongoing access to capital. Meeting investor preferences has reduced, but not eliminated, the risk of prolonged periods of limited, or no, demand for new issues of Ontario bonds. However, as a result of these large bond issues, Ontario now has large cash outflows on single days, rather than having maturities and interest payments spread more evenly throughout the year.
In anticipation of the need for cash reserves to meet these requirements for large outflows on a single day, and to allow the government to quickly respond to any unforeseen economic or public health circumstances, Ontario has built larger cash reserves, as depicted in Chart 4.10.
Debt Burden Reduction Strategy
Delivering on the commitment made in the 2020 Budget, this updated debt burden reduction strategy sets out a plan for managing the province’s debt burden to restore fiscal sustainability. Ontario has deployed extraordinary fiscal measures to counter the effects of COVID‑19. The government will continue to make available the necessary resources now to protect people and jobs. It also remains committed to reducing the debt burden and putting Ontario’s finances back on a more sustainable path.
The debt burden reduction strategy has specific objectives, including a target for net debt-to-GDP to not exceed 50.5 per cent over the medium-term outlook, as well as introducing two additional relevant measures of debt sustainability: net debt-to-revenue and IOD-to-revenue. The objective of these additional measures will be to slow their rate of increase, supported by GDP growth.
Ontario’s net debt-to-GDP ratio has increased from 39.6 per cent in 2019–20 due to the COVID‑19 pandemic. Due to the increase in the Province’s investments in capital assets, Ontario’s net debt-to-GDP ratio is now forecast to be 47.1 per cent in 2020–21, and 48.8 per cent in 2021–22, compared to forecasts of 47.0 per cent and 48.5 per cent, respectively, at the time of the 2020 Budget.
Acknowledging the continued uncertainty of the global pandemic, the government’s specific objective will be to slow the rate of increase in the net debt-to-GDP ratio, supported by GDP growth. The target under Ontario’s debt burden reduction strategy is for net debt‑to-GDP to not exceed 50.5 per cent over the medium-term outlook. Over the longer term, Ontario’s debt burden and net debt-to-GDP ratio will begin to decrease once the growth in the province’s economic output begins to outpace the growth of debt.
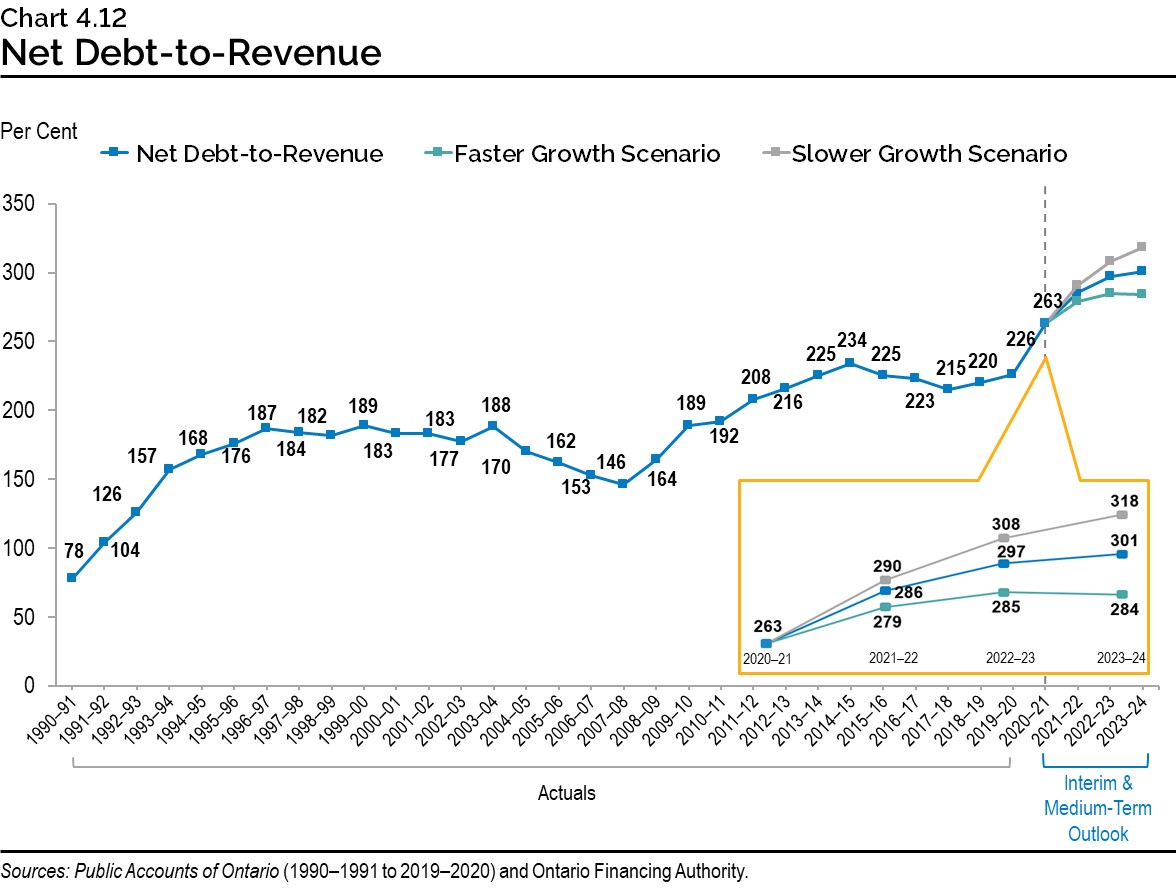
To improve transparency with respect to the affordability of Ontario’s debt, and in response to the Office of the Auditor General of Ontario’s value-for-money audit recommendations,1 the government is now reporting on and setting specific objectives for additional debt sustainability measures. In addition to net debt-to-GDP, the government is reporting on net debt-to-revenue and interest on debt-to-revenue as part of the overall debt burden reduction strategy.
Ontario’s specific objective will be to slow the rate of increase in the net debt-to-revenue ratio, supported by GDP growth. This ratio is an indicator of how many years it would take to eliminate the debt if the Province were to spend all of its annual revenue on debt repayment. The net debt‑to-revenue ratio is projected to be 263 per cent in 2020–21, and 286 per cent in 2021–22, unchanged and lower by one percentage point, respectively, compared to the forecast in the 2020 Budget.
Ontario is also including the IOD-to-revenue ratio as part of the debt burden reduction strategy as it is another key ratio to measure the affordability of the province’s debt. This ratio represents how much Ontario needs to spend on interest for every revenue dollar received. The current forecast is 8.5 cents of interest cost for every dollar of revenue in 2021–22.
Ontario’s specific objective will be to slow the rate of increase in the IOD-to-revenue ratio, supported by GDP growth. Despite increases in forecasted deficits and borrowing requirements caused by the COVID‑19 pandemic, IOD-to-revenue over the medium term continues to remain lower than forecasted in the pre-pandemic 2019 Budget. It also remains lower over the medium-term outlook when compared to the forecast in the 2020 Budget, demonstrating the continued relative affordability of Ontario’s debt. Under the planning projection, this ratio is forecast to remain below the peak reached following the global financial crisis in 2008–09 and lower than the levels in the early 1990s through to the mid-2000s.
Consolidated Financial Tables
| Debt2 | Actual 2016–17 |
Actual 2017–18 |
Actual 2018–19 |
Actual 2019–20 |
Interim1 2020–21 |
Plan 2021–22 |
|---|---|---|---|---|---|---|
| Publicly Held Debt — Bonds3 | 299,356 | 315,247 | 334,940 | 349,088 | 381,010 | 411,212 |
| Publicly Held Debt — Treasury Bills | 16,120 | 17,528 | 17,546 | 19,175 | 24,066 | 30,066 |
| Publicly Held Debt — U.S. Commercial Paper4 | 5,369 | 3,865 | 3,863 | 3,891 | 0 | 0 |
| Publicly Held Debt — Infrastructure Ontario (IO)5 | 300 | 300 | 300 | 300 | 300 | 300 |
| Publicly Held Debt — Other | 296 | 287 | 292 | 264 | 244 | 231 |
| Total Publicly Held Debt | 321,441 | 337,227 | 356,941 | 372,718 | 405,620 | 441,809 |
| Non-Public Debt | 11,661 | 11,433 | 11,039 | 10,010 | 9,311 | 8,750 |
| Total Debt | 333,102 | 348,660 | 367,980 | 382,728 | 414,931 | 450,559 |
| Less: Holdings of Ontario bonds and treasury bills | (8,832) | (11,775) | (13,716) | (9,938) | (10,312) | (652) |
| Revised Total Debt | 324,270 | 336,885 | 354,264 | 372,790 | 404,619 | 449,907 |
| Cash and Temporary Investments Excluding Broader Public Sector (BPS)6 | (14,590) | (19,571) | (26,250) | (29,934) | (34,511) | (42,935) |
| Total Debt Net of Cash and Temporary Investments | 309,680 | 317,314 | 328,014 | 342,856 | 370,108 | 406,972 |
| Other Net (Assets)/Liabilities7 | (9,991) | (6,791) | (3,422) | (3,423) | 16,793 | 22,404 |
| BPS Net Debt | 14,388 | 13,311 | 13,904 | 13,899 | 12,562 | 10,468 |
| Net Debt | 314,077 | 323,834 | 338,496 | 353,332 | 399,463 | 439,844 |
| Non-Financial Assets8 | (108,138) | (114,811) | (121,854) | (127,568) | (135,231) | (142,504) |
| Accumulated Deficit | 205,939 | 209,023 | 216,642 | 225,764 | 264,232 | 297,340 |
Table 4.2 footnotes:
[1] Interim represents the 2021 Budget projection for the 2020–21 fiscal year.
[2] Includes debt issued by the Province and all government organizations, including the Ontario Electricity Financial Corporation (OEFC).
[3], [4] All balances are expressed in Canadian dollars. The balances above reflect the effect of related derivative contracts.
[5] IO’s debt is composed of Infrastructure Renewal Bonds ($300 million). IO's debt is not guaranteed by the Province.
[6] Cash and temporary investments excludes any holdings in Ontario bonds and T-bills.
[7] Other Net (Assets)/Liabilities include accounts receivable, loans receivable, advances and investments in Government Business Enterprises (GBEs) offset by accounts payable, accrued liabilities, deferred revenue and capital contributions, pensions and other employee future benefits, and other liabilities.
[8] Non-financial assets include the tangible capital assets of the Province and broader public sector.
Source: Ontario Ministry of Finance.
| 2021–22 | 2022–23 | 2023–24 | |
|---|---|---|---|
| Total Debt | 450.6 | 481.1 | 503.0 |
| Cash and Temporary Investments1 | (43.6) | (43.6) | (43.6) |
| Total Debt Net of Cash and Temporary Investments | 407.0 | 437.5 | 459.5 |
| Other Net (Assets)/Liabilities | 22.4 | 28.7 | 34.3 |
| Broader Public Sector Net Debt | 10.5 | 9.6 | 9.3 |
| Net Debt | 439.8 | 475.8 | 503.1 |
| Non-Financial Assets | (142.5) | (150.8) | (158.0) |
| Accumulated Deficit | 297.3 | 325.0 | 345.2 |
Table 4.3 footnotes:
[1] Cash and temporary investments includes any holdings in Ontario bonds and T-bills.
Source: Ontario Ministry of Finance.
Footnotes
[1] Office of the Auditor General of Ontario, 2019 Annual Report Volume 1, (2019), https://www.auditor.on.ca/en/content/annualreports/arreports/en19/2019AR_v1_en_web.pdf
Chart Descriptions
Chart 4.1: Range of Medium-Term Borrowing Outlook Scenarios for Long-Term Borrowing
| 2020–21 | 2021–22 | 2022–23 | 2023–24 | |
|---|---|---|---|---|
| Planning Projection | $59.0 | $54.7 | $59.1 | $55.2 |
| Slower Growth Scenario | $59.0 | $56.5 | $62.9 | $60.5 |
| Faster Growth Scenario | $59.0 | $51.9 | $54.7 | $49.2 |
Sources: Ontario Financing Authority andOntario Ministry of Finance.
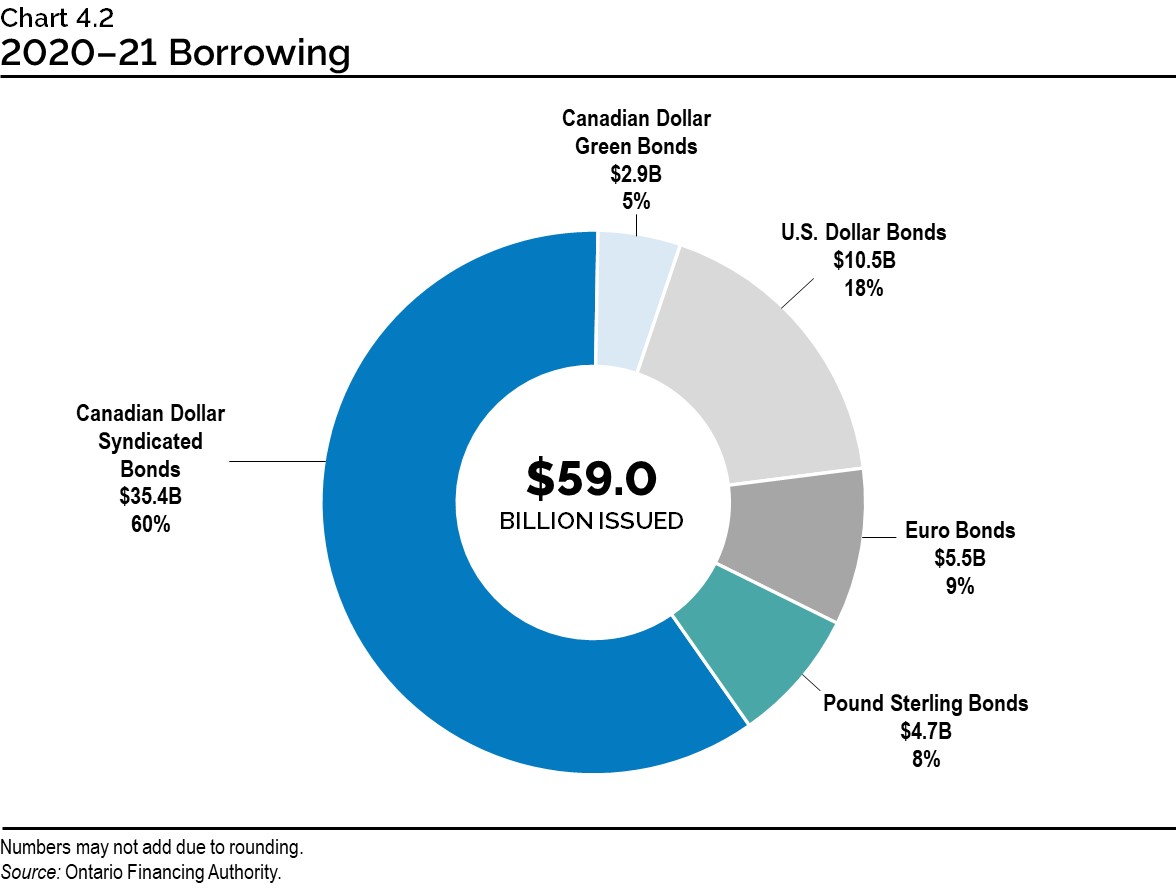
Chart 4.2: 2020–21 Borrowing
Long-term public borrowing of $59.0 billion has been completed for fiscal year 2020–21. This consisted of $35.4 billion (60 per cent) of Canadian dollar syndicated bonds, $2.9 billion (5 per cent) of Canadian dollar Green Bonds, $10.5 billion (18 per cent) of U.S. dollar bonds, $5.5 billion (9 per cent) of euro bonds, and $4.7 billion (8 per cent) of pound sterling bonds.
Numbers may not add due to rounding.
Source: Ontario Financing Authority.
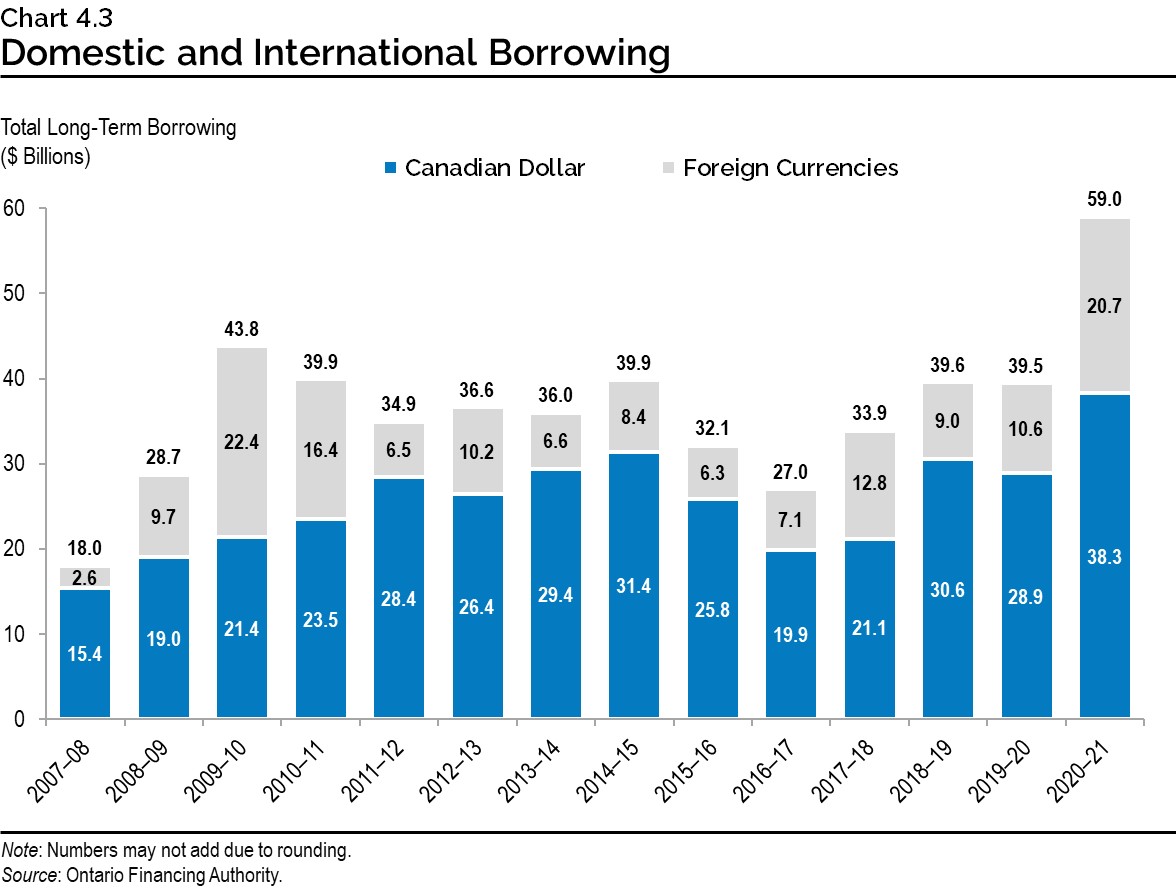
Chart 4.3: Domestic and International Borrowing
Ontario’s total long-term borrowing completed in 2020–21 is $59.0 billion — $38.3 billion was borrowed in the Canadian dollar market and $20.7 billion was borrowed in foreign currencies.
| Year | Canadian Dollar ($ Billions) | Foreign Currencies ($ Billions) | Total ($ Billions) |
|---|---|---|---|
| 2007–08 | 15.4 | 2.6 | 18.0 |
| 2008–09 | 19.0 | 9.7 | 28.7 |
| 2009–10 | 21.4 | 22.4 | 43.8 |
| 2010–11 | 23.5 | 16.4 | 39.9 |
| 2011–12 | 28.4 | 6.5 | 34.9 |
| 2012–13 | 26.4 | 10.2 | 36.6 |
| 2013–14 | 29.4 | 6.6 | 36.0 |
| 2014–15 | 31.4 | 8.4 | 39.9 |
| 2015–16 | 25.8 | 6.3 | 32.1 |
| 2016–17 | 19.9 | 7.1 | 27.0 |
| 2017–18 | 21.1 | 12.8 | 33.9 |
| 2018–19 | 30.6 | 9.0 | 39.6 |
| 2019–20 | 28.9 | 10.6 | 39.5 |
| 2020–21 | 38.3 | 20.7 | 59.0 |
Note: Numbers may not add due to rounding.
Source: Ontario Financing Authority.
Chart 4.4: Green Bond Allocation by Framework Category
A total of $8.0 billion in Green Bond funding has provided funding for 27 projects. Seven of those projects are under the Clean Transportation framework category and have received 72 per cent of the funding. Nineteen projects are under the Energy Efficiency and Conservation category and have received 25 per cent of the funding. One project is under the Climate Adaptation and Resilience category and has received three per cent of the funding.
Source: Ontario Financing Authority.
Chart 4.5: Ontario’s Green Bond Issues
Since 2014, Ontario has issued Green Bonds totalling $8.0 billion.
| 2014–15 | 2015–16 | 2016–17 | 2017–18 | 2018–19 | 2019–20 | 2020–21 | |
|---|---|---|---|---|---|---|---|
| Green Bond Issues ($) | $500 million | $750 million | $800 million | $1.0 billion | $950 million | $1.25 billion | $2.75 billion |
Source: Ontario Financing Authority.
Chart 4.6: Effective Interest Rate (Weighted Average) on Total Debt
As of January 31, 2021, the effective interest rate (calculated as a weighted average) for fiscal year end is forecast to be 3.0 per cent on the province’s total debt.
| Year | Effective Interest Rate (%) |
|---|---|
| 1990–91 | 10.9 |
| 1991–92 | 10.7 |
| 1992–93 | 10.1 |
| 1993–94 | 9.5 |
| 1994–95 | 9.8 |
| 1995–96 | 9.4 |
| 1996–97 | 9.0 |
| 1997–98 | 9.0 |
| 1998–99 | 8.6 |
| 1999–00 | 8.4 |
| 2000–01 | 8.2 |
| 2001–02 | 7.6 |
| 2002–03 | 7.2 |
| 2003–04 | 6.7 |
| 2004–05 | 6.4 |
| 2005–06 | 6.1 |
| 2006–07 | 6.0 |
| 2007–08 | 5.8 |
| 2008–09 | 5.2 |
| 2009–10 | 4.6 |
| 2010–11 | 4.5 |
| 2011–12 | 4.4 |
| 2012–13 | 4.1 |
| 2013–14 | 3.9 |
| 2014–15 | 3.7 |
| 2015–16 | 3.6 |
| 2016–17 | 3.5 |
| 2017–18 | 3.6 |
| 2018–19 | 3.6 |
| 2019–20 | 3.4 |
| 2020–21 | 3.0 |
Sources: Public Accounts of Ontario (1990–1991 to 2019–2020) and Ontario Financing Authority.
Chart 4.7: Average Annual Ontario Borrowing Rates
| Year | Actuals (%) | 2021 Budget (%) |
|---|---|---|
| 2009–10 | 3.27 | – |
| 2010–11 | 3.42 | – |
| 2011–12 | 3.07 | – |
| 2012–13 | 2.50 | – |
| 2013–14 | 2.93 | – |
| 2014–15 | 2.67 | – |
| 2015–16 | 2.25 | – |
| 2016–17 | 2.09 | – |
| 2017–18 | 2.31 | – |
| 2018–19 | 2.81 | – |
| 2019–20 | 2.15 | – |
| 2020–21 | – | 1.60 |
| 2021–22 | – | 1.90 |
| 2022–23 | – | 2.40 |
| 2023–24 | – | 3.20 |
Sources: Public Accounts of Ontario (2009–2010 to 2019–2020)and Ontario Financing Authority.
Chart 4.8: Interest on Debt Expense
| Year | 2019 Budget Forecast ($ Billions) | 2020 Budget Forecast ($ Billions) | 2021 Budget Forecast ($ Billions) |
|---|---|---|---|
| 2018–19 | 12.4* | – | – |
| 2019–20 | 13.3 | 12.5* | – |
| 2020–21 | 13.7 | 12.5 | 12.5 |
| 2021–22 | 14.4 | 13.2 | 13.1 |
| 2022–23 | 14.9 | 13.9 | 13.7 |
| 2023–24 | 15.5 | – | 14.6 |
*Actuals after Budgets were tabled.
Source: Ontario Ministry of Finance.
Chart 4.9: Weighted-Average Term of Borrowings
The average term of Ontario’s debt portfolio has been extended from 9.7 years in 2009–10 to 10.7 years in 2020–21. The weighted-average borrowing term for 2020–21 was 11.7 years as of March 5, 2021.
| 2009–10 | 2010–11 | 2011–12 | 2012–13 | 2013–14 | 2014–15 | 2015–16 | 2016–17 | 2017–18 | 2018–19 | 2019–20 | 2020–21 | |
|---|---|---|---|---|---|---|---|---|---|---|---|---|
| Weighted-Average Borrowing Term (Years) | 8.1 | 12.8 | 13.0 | 12.4 | 13.6 | 14.1 | 14.2 | 13.9 | 12.1 | 12.9 | 14.5 | 11.7 |
| Debt Portfolio Average Term (Years) | 9.7 | 10.0 | 10.1 | 10.1 | 10.4 | 10.7 | 10.9 | 10.9 | 10.7 | 10.7 | 10.9 | 10.7 |
Note: The debt portfolio average term is on a forecast basis to fiscal year end as of January 31, 2021.
Source: Ontario Financing Authority.
Chart 4.10: Average Unrestricted Liquid Reserve Levels
Average unrestricted liquid reserve levels are forecast to be $45.4 billion as of January 31, 2021.
| Year | Average Unrestricted Liquid Reserve Levels ($ billions) |
|---|---|
| 2009–10 | 14.4 |
| 2010–11 | 19.4 |
| 2011–12 | 20.2 |
| 2012–13 | 23.3 |
| 2013–14 | 24.9 |
| 2014–15 | 23.6 |
| 2015–16 | 21.7 |
| 2016–17 | 21.1 |
| 2017–18 | 30.1 |
| 2018–19 | 32.7 |
| 2019–20 | 32.3 |
| 2020–21 | 45.4 |
Source: Ontario Financing Authority.
Chart 4.11: Net Debt-to-GDP
Ontario’s net debt-to-GDP ratio is forecast at 48.8 per cent in 2021–22.
| Year | Net Debt-to-GDP (%) | Faster Growth Scenario (%) | Slower Growth Scenario (%) |
|---|---|---|---|
| 1990–91 | 13.4 | – | – |
| 1991–92 | 17.1 | – | – |
| 1992–93 | 21.1 | – | – |
| 1993–94 | 26.6 | – | – |
| 1994–95 | 28.3 | – | – |
| 1995–96 | 30.1 | – | – |
| 1996–97 | 31.2 | – | – |
| 1997–98 | 30.5 | – | – |
| 1998–99 | 29.4 | – | – |
| 1999–00 | 32.1 | – | – |
| 2000–01 | 29.3 | – | – |
| 2001–02 | 28.2 | – | – |
| 2002–03 | 26.8 | – | – |
| 2003–04 | 27.5 | – | – |
| 2004–05 | 26.8 | – | – |
| 2005–06 | 27.8 | – | – |
| 2006–07 | 27.1 | – | – |
| 2007–08 | 26.6 | – | – |
| 2008–09 | 27.8 | – | – |
| 2009–10 | 32.3 | – | – |
| 2010–11 | 34.5 | – | – |
| 2011–12 | 36.6 | – | – |
| 2012–13 | 38.2 | – | – |
| 2013–14 | 39.7 | – | – |
| 2014–15 | 40.5 | – | – |
| 2015–16 | 40.3 | – | – |
| 2016–17 | 39.7 | – | – |
| 2017–18 | 39.3 | – | – |
| 2018–19 | 39.4 | – | – |
| 2019–20 | 39.6 | – | – |
| 2020–21 | 47.1 | 47.1 | 47.1 |
| 2021–22 | 48.8 | 47.6 | 49.4 |
| 2022–23 | 49.6 | 47.8 | 51.1 |
| 2023–24 | 50.2 | 47.7 | 52.2 |
Sources: Statistics Canada and Ontario Ministry of Finance.
Chart 4.12: Net Debt-to-Revenue
Ontario’s net debt-to-revenue ratio is forecast to be 286 per cent in 2021–22.
| Year | Net Debt-to-Revenue Ratio (%) | Faster Growth Scenario (%) | Slower Growth Scenario (%) |
|---|---|---|---|
| 1990–91 | 78 | – | |
| 1991–92 | 104 | – | |
| 1992–93 | 126 | – | |
| 1993–94 | 157 | – | |
| 1994–95 | 168 | – | |
| 1995–96 | 176 | – | |
| 1996–97 | 187 | – | |
| 1997–98 | 184 | – | |
| 1998–99 | 182 | – | |
| 1999–00 | 189 | – | |
| 2000–01 | 183 | – | |
| 2001–02 | 183 | – | |
| 2002–03 | 177 | – | |
| 2003–04 | 188 | – | |
| 2004–05 | 170 | – | |
| 2005–06 | 162 | – | |
| 2006–07 | 153 | – | |
| 2007–08 | 146 | – | |
| 2008–09 | 164 | – | |
| 2009–10 | 189 | – | |
| 2010–11 | 192 | – | |
| 2011–12 | 208 | – | |
| 2012–13 | 216 | – | |
| 2013–14 | 225 | – | |
| 2014–15 | 234 | – | |
| 2015–16 | 225 | – | |
| 2016–17 | 223 | – | |
| 2017–18 | 215 | – | |
| 2018–19 | 220 | – | |
| 2019–20 | 226 | – | |
| 2020–21 | 263 | 263 | 263 |
| 2021–22 | 286 | 279 | 290 |
| 2022–23 | 297 | 285 | 308 |
| 2023–24 | 301 | 284 | 318 |
Sources: Public Accounts of Ontario (1990–1991 to 2019–2020), and Ontario Financing Authority.
Chart 4.13: Interest on Debt-to-Revenue
Ontario’s interest on debt-to-revenue ratio is forecast to be 8.5 per cent in 2021–22.
| Year | Interest on Debt-to-Revenue Ratio (%) | Faster Growth Scenario (%) | Slower Growth Scenario (%) |
|---|---|---|---|
| 1990–91 | 7.7 | – | – |
| 1991–92 | 8.8 | – | – |
| 1992–93 | 10.8 | – | – |
| 1993–94 | 13.9 | – | – |
| 1994–95 | 14.5 | – | – |
| 1995–96 | 14.6 | – | – |
| 1996–97 | 14.8 | – | – |
| 1997–98 | 14.2 | – | – |
| 1998–99 | 14.3 | – | – |
| 1999–00 | 15.5 | – | – |
| 2000–01 | 15.0 | – | – |
| 2001–02 | 14.2 | – | – |
| 2002–03 | 12.9 | – | – |
| 2003–04 | 12.9 | – | – |
| 2004–05 | 11.1 | – | – |
| 2005–06 | 9.7 | – | – |
| 2006–07 | 8.9 | – | – |
| 2007–08 | 8.4 | – | – |
| 2008–09 | 8.7 | – | – |
| 2009–10 | 8.9 | – | – |
| 2010–11 | 8.8 | – | – |
| 2011–12 | 9.1 | – | – |
| 2012–13 | 9.0 | – | – |
| 2013–14 | 9.1 | – | – |
| 2014–15 | 8.9 | – | – |
| 2015–16 | 8.5 | – | – |
| 2016–17 | 8.3 | – | – |
| 2017–18 | 7.9 | – | – |
| 2018–19 | 8.1 | – | – |
| 2019–20 | 8.0 | – | – |
| 2020–21 | 8.2 | 8.2 | 8.2 |
| 2021–22 | 8.5 | 8.4 | 8.6 |
| 2022–23 | 8.6 | 8.3 | 8.8 |
| 2023–24 | 8.7 | 8.3 | 9.1 |
Sources: Public Accounts of Ontario (1990–1991 to 2019–2020), and Ontario Financing Authority.