Introduction
As the ongoing fight against the COVID‑19 pandemic continues, the government remains focused on protecting people’s health and the economy. The government is also committed to ensuring a strong economic and fiscal recovery, while continuing to invest in critical public services.
Since the onset of the pandemic last year, the government has taken decisive action to ensure that people, jobs and employers most heavily impacted by the COVID‑19 pandemic are supported. Through the actions announced as part of the 2021 Budget, the government is committing an additional $6.1 billion to the fight against COVID‑19, bringing the Province’s total projected COVID‑19 response to $51 billion over four years.
Ontario is projecting a $38.5 billion deficit in 2020‑21. Over the medium term, the government projects steadily declining deficits of $33.1 billion in 2021–22, $27.7 billion in 2022–23 and $20.2 billion in 2023–24.
Due to the increase in the Province’s investments in capital assets, the net debt-to-GDP ratio is projected to be 47.1 per cent in 2020‑21, 0.1 percentage point higher than the 47.0 per cent forecast presented in the 2020 Budget. Ontario is projecting increasing net debt-to-GDP ratios over the medium-term outlook, with a gradually slower rate of increase over this period.
| Actual 2019–20 |
Interim1 2020‑21 |
Medium-Term Outlook 2021–22 |
Medium-Term Outlook 2022–23 |
Medium-Term Outlook 2023–24 |
|
|---|---|---|---|---|---|
| Revenue | 156.1 | 151.8 | 154.0 | 160.0 | 167.0 |
| Expense — Programs2 | 152.3 | 177.8 | 173.0 | 172.5 | 171.1 |
| Expense — Interest on Debt | 12.5 | 12.5 | 13.1 | 13.7 | 14.6 |
| Total Expense | 164.8 | 190.3 | 186.1 | 186.2 | 185.6 |
| Surplus/(Deficit) Before Reserve | (8.7) | (38.5) | (32.1) | (26.2) | (18.7) |
| Reserve | – | – | 1.0 | 1.5 | 1.5 |
| Surplus/(Deficit) | (8.7) | (38.5) | (33.1) | (27.7) | (20.2) |
| Net Debt as a Per Cent of GDP | 39.6% | 47.1% | 48.8% | 49.6% | 50.2% |
| Accumulated Deficit as a Per Cent of GDP | 25.3% | 31.1% | 33.0% | 33.9% | 34.4% |
Table 3.1 footnotes:
[1] Interim represents the 2021 Budget projection for the 2020‑21 fiscal year.
[2] For a breakout of COVID‑19 time-limited funding see Table 3.8.
Note: Numbers may not add due to rounding.
Sources: Ontario Treasury Board Secretariat and Ontario Ministry of Finance.
2020‑21 Interim Fiscal Performance
Ontario’s 2020‑21 deficit is projected to be $38.5 billion — unchanged from the outlook published in the 2020 Budget.
The 2021 Budget is projecting revenues in 2020‑21 to be $151.8 billion, $0.7 billion higher than forecast in the 2020 Budget.
Program expense is projected to be $177.8 billion, $3.2 billion higher than the 2020 Budget forecast, primarily due to investment in hospitals, long-term care homes and supports for employers.
Ontario is forecast to pay $12.5 billion in interest costs in 2020‑21, unchanged from the forecast in the 2020 Budget. The net debt-to-GDP ratio in 2020‑21 increased slightly as a result of increased investments in capital assets.
The 2020 Budget also maintained a $2.5 billion reserve to protect the fiscal plan against unforeseen adverse changes in Ontario’s revenue and expense forecasts for the remainder of the fiscal year. The reserve was drawn down by $2.0 billion in the 2020‑21 Third Quarter Finances and the remaining $500 million has been drawn down at interim to support the government’s ongoing response to the pandemic.
| 2020 Budget | Interim1 2020‑21 |
In-Year Change | |
|---|---|---|---|
| Revenue | 151,074 | 151,813 | 739 |
| Expense — Programs | 174,586 | 177,825 | 3,239 |
| Expense — Interest on Debt | 12,456 | 12,456 | – |
| Total Expense | 187,042 | 190,281 | 3,239 |
| Surplus/(Deficit) Before Reserve | (35,968) | (38,468) | (2,500) |
| Reserve | 2,500 | – | (2,500) |
| Surplus/(Deficit) | (38,468) | (38,468) | – |
Table 3.2 footnotes:
[1] Interim represents the 2021 Budget projection for the 2020‑21 fiscal year.
Note: Numbers may not add due to rounding.
Sources: Ontario Treasury Board Secretariat and Ontario Ministry of Finance.
Revenue
The 2020‑21 total revenue outlook is $151.8 billion, $0.7 billion higher than projected in the 2020 Budget.
| Interim1 2020‑21 |
|
|---|---|
| 2020 Budget Total Revenue | 151,074 |
| Total Revenue Changes in the 2020‑21 Third Quarter Finances | 612 |
| Revenue Changes since the 2020‑21 Third Quarter Finances — Sales Tax | 45 |
| Revenue Changes since the 2020‑21 Third Quarter Finances — Land Transfer Tax | 43 |
| Revenue Changes since the 2020‑21 Third Quarter Finances — Employer Health Tax | 39 |
| Total Revenue Changes since the 2020 Budget | 739 |
| 2021 Budget Total Revenue Outlook | 151,813 |
Table 3.3 footnotes:
[1] Interim represents the 2021 Budget projection for the 2020‑21 fiscal year.
Note: Numbers may not add due to rounding.
Source: Ontario Ministry of Finance.
In the 2020‑21 Third Quarter Finances, the revenue forecast increased by $612 million due to higher taxation revenues, Government of Canada transfers and net income from Government Business Enterprises (GBEs).
The 2020‑21 revenue forecast has increased since the 2020‑21 Third Quarter Finances due to higher-than-expected tax revenues in January for Sales Tax, Land Transfer Tax and Employer Health Tax.
The 2020‑21 revenues are currently forecast to be $739 million higher compared to the 2020 Budget. This includes higher taxation revenues of $1,637 million, mainly due to a smaller-than-projected economic decline in 2020 than the prudent planning assumptions reported in the 2020 Budget. The forecast for Government of Canada transfers is higher by $385 million mainly reflecting increased federal funding of $420 million under the Workforce Development Agreements. The outlook for net income from GBEs is higher by $306 million due to increased forecasts for earnings from the Ontario Lottery and Gaming Corporation (OLG), Liquor Control Board of Ontario (LCBO), Ontario Power Generation (OPG) and Hydro One Ltd. All other non-tax revenues combined are $1,589 million lower, largely due to lower third-party revenues from hospitals, school boards and colleges, and lower revenue from other consolidated government agencies.
Expense
The 2020‑21 total expense outlook is $190.3 billion, $3.2 billion higher than the 2020 Budget forecast as a result of additional investments to protect people’s health and the economy of Ontario.
| Interim1 2020‑21 |
|
|---|---|
| 2020 Budget Total Expense | 187,042 |
| Total Expense Changes in the 2020‑21 Third Quarter Finances | 2,612 |
| Program Expense Changes since the 2020‑21 Third Quarter Finances — Protecting People’s Health — Updates to Health Sector Funding | 684 |
| Program Expense Changes since the 2020‑21 Third Quarter Finances — Protecting People’s Health — Procurement of Personal Protective Equipment and Critical Supplies and Equipment | 20 |
| Program Expense Changes since the 2020‑21 Third Quarter Finances — Protecting People’s Health — Additional Funding for Retirement Homes | 5 |
| Program Expense Changes since the 2020‑21 Third Quarter Finances — Total Protecting People’s Health | 709 |
| Program Expense Changes since the 2020‑21 Third Quarter Finances — Protecting Our Economy — Ontario Small Business Support Grant | 2,000 |
| Program Expense Changes since the 2020‑21 Third Quarter Finances — Protecting Our Economy — Ontario COVID‑19 Child Benefit | 980 |
| Program Expense Changes since the 2020‑21 Third Quarter Finances — Protecting Our Economy — Municipal Operating Support | 500 |
| Program Expense Changes since the 2020‑21 Third Quarter Finances — Protecting Our Economy — Maintaining Homelessness Supports through the Social Services Relief Fund | 255 |
| Program Expense Changes since the 2020‑21 Third Quarter Finances — Protecting Our Economy — Additional Provincial Funding for Municipal Transit | 150 |
| Program Expense Changes since the 2020‑21 Third Quarter Finances — Protecting Our Economy — Proposed Temporary Ontario Jobs Training Tax Credit | 65 |
| Program Expense Changes since the 2020‑21 Third Quarter Finances — Protecting Our Economy — Proposed Enhancement to the CARE Tax Credit for 2021 | 20 |
| Program Expense Changes since the 2020‑21 Third Quarter Finances — Protecting Our Economy — All Other Changes | 29 |
| Program Expense Changes since the 2020‑21 Third Quarter Finances — Total Protecting Our Economy | 3,999 |
| Program Expense Changes since the 2020‑21 Third Quarter Finances — Other Changes — Re-profiled Allocation of the Temporary Tourism Measure from 2020‑21 to 2021–22 | (30) |
| Program Expense Changes since the 2020‑21 Third Quarter Finances — Other Changes — All Other Changes | (63) |
| Program Expense Changes since the 2020‑21 Third Quarter Finances — Total Other Changes | (93) |
| Program Expense Changes since the 2020‑21 Third Quarter Finances — Drawdown of the Standard Contingency Fund to Offset Spending | (3,988) |
| Total Program Expense Changes since the 2020‑21 Third Quarter Finances | 627 |
| Interest on Debt Change since the 2020‑21 Third Quarter Finances | – |
| Total Expense Changes since the 2020‑21 Third Quarter Finances | 627 |
| 2021 Budget Total Expense Outlook | 190,281 |
Table 3.4 footnotes:
[1] Interim represents the 2021 Budget projection for the 2020‑21 fiscal year.
Note: Numbers may not add due to rounding.
Sources: Ontario Treasury Board Secretariat and Ontario Ministry of Finance.
The following key in-year expense changes are projected relative to the 2020‑21 Third Quarter Finances:
- $684 million primarily due to investments to support hospitals which have experienced reduced third-party revenues due to COVID‑19, as well as adjustments to capital grants and consolidations. This is in addition to support being provided to the hospital sector to address working funds deficits;
- An additional $20 million for the procurement of personal protective equipment and other critical supplies and equipment to support frontline staff in public sectors during the pandemic;
- $5 million in one-time COVID‑19 funding to support older adults in retirements homes;
- $2.0 billion in additional support to businesses, including $300 million to top-up the Ontario Small Business Support Grant to reflect the updated forecast for program demand, and $1.7 billion in support to businesses through a second payment of the Ontario Small Business Support Grant;
- $980 million in time-limited funding through the Ontario COVID‑19 Child Benefit, in addition to the $868 million provided since March 2020. The additional funding will help cover any additional costs that families are facing due to COVID‑19. This means over $1.8 billion provided directly to support families;
- Nearly $1 billion in additional provincial financial relief provided to municipalities, on top of the $4 billion in assistance that has been provided through the historic federal–provincial Safe Restart Agreement, including:
- $500 million in additional provincial funding to support municipal operating pressures and recovery in 2021;
- $255 million in new provincial funding through the Social Services Relief Fund to support municipal service managers and Indigenous program partners in immediately responding to rising COVID‑19 caseloads in shelter settings. This builds on the $510 million provided through the Social Services Relief Fund in 2020‑21 that ensured the continuity of critical supports for vulnerable people based on local need; and
- $150 million in additional provincial funding to support municipal transit systems providing reliable transportation services during the pandemic, which in some cases have experienced a 90 per cent decrease in ridership and revenue.
- $65 million to help workers with their training expenses through a proposed temporary Ontario Jobs Training Tax Credit for 2021; and
- $20 million to further support families with their child care expenses through a proposed enhancement to the CARE tax credit for 2021.
Other changes include:
- Fiscal reprofiling of the temporary tourism measure to 2021–22, in light of public health guidelines on travel safety; and
- All other changes include technical adjustments such as accounting changes for consolidated entities.
Interest on Debt expense is projected to be $12.5 billion, unchanged from the forecast in the 2020‑21 Third Quarter Finances.
Fiscal Prudence
To protect the health of the people of Ontario, and support families, employers and jobs during the pandemic, the Province made available time-limited pandemic response funding and extraordinary contingencies of $13.3 billion in 2020‑21, as presented in the 2020 Budget. This funding is tracked under the categories of COVID‑19 Health Sector Expense, the COVID‑19 Health Contingency Fund and the Support for People and Jobs Fund. The balances in these funds have been fully allocated as of the 2020‑21 Third Quarter Finances as part of the government’s effort to combat the COVID‑19 pandemic and support the recovery of the province.
The Fiscal Sustainability, Transparency and Accountability Act, 2019 (FSTAA) requires Ontario’s fiscal plan to incorporate prudence in the form of a reserve to protect the fiscal outlook against unforeseen adverse changes in the province’s revenue and expense, including those resulting from changes in Ontario’s economic performance. The reserve has been drawn down at interim to support the government’s ongoing response to the pandemic. Additionally, the standard Contingency Fund is maintained to help mitigate expense risks — for example, in cases where health and safety may be compromised, and which may otherwise adversely affect Ontario’s fiscal performance. The standard Contingency Fund was $3.0 billion at the time of the 2020 Budget, $4.0 billion as of the 2020‑21 Third Quarter Finances and has now been fully allocated.
Medium-Term Fiscal Plan
Ontario is projecting deficits of $33.1 billion in 2021–22, $27.7 billion in 2022–23, and $20.2 billion in 2023–24.
Over the medium term, revenue is forecast to increase from $156.1 billion in 2019–20 to $167.0 billion in 2023–24, while total expense is projected to increase from $164.8 billion to $185.6 billion over the same period.
Medium-Term Revenue Outlook
| Actual 2019–20 |
Interim1 2020‑21 |
Medium-Term Outlook 2021–22 |
Medium-Term Outlook 2022–23 |
Medium-Term Outlook 2023–24 |
|
|---|---|---|---|---|---|
| Revenue — Personal Income Tax | 37.7 | 35.9 | 36.4 | 37.4 | 39.1 |
| Revenue — Sales Tax | 28.6 | 26 | 27.6 | 30.2 | 31.9 |
| Revenue — Corporations Tax | 15.4 | 11.4 | 14.4 | 14.8 | 15.4 |
| Revenue — Ontario Health Premium | 4.1 | 4.0 | 4.1 | 4.2 | 4.4 |
| Revenue — Education Property Tax | 6.2 | 6.0 | 5.8 | 5.7 | 5.7 |
| Revenue — All Other Taxes | 16.3 | 15.8 | 16.6 | 16.6 | 16.9 |
| Total Taxation Revenue | 108.3 | 99.1 | 104.8 | 109.1 | 113.5 |
| Government of Canada | 25.4 | 33.7 | 27.4 | 27.7 | 28.7 |
| Income from Government Business Enterprises | 5.9 | 3.9 | 4.5 | 5.5 | 6.6 |
| Other Non-Tax Revenue | 16.5 | 15.1 | 17.2 | 17.9 | 18.3 |
| Total Revenue | 156.1 | 151.8 | 154.0 | 160.0 | 167.0 |
Table 3.5 footnotes:
[1] Interim represents the 2021 Budget projection for the 2020‑21 fiscal year.
Note: Numbers may not add due to rounding.
Source: Ontario Ministry of Finance.
The taxation revenue forecast reflects the outlook for the economy, experience from past periods of economic recession and recovery, and government tax policy commitments. For an overview of the province’s economic planning assumptions, see Chapter 2: Economic Performance and Outlook for more details.
The primary driver of the forecast for Personal Income Tax (PIT) revenue is the outlook for growth in the compensation of employees. Revenues in 2020‑21 and 2021–22 also reflect projected Canada Emergency Response Benefit and Canada Recovery Benefit payments that have been deemed taxable by the federal government. From 2020‑21 to 2023–24, PIT revenue is projected to grow at an average annual rate of 3.0 per cent.
The Sales Tax revenue projection is based primarily on the forecast for household consumption spending. Sales Tax revenue is projected to grow at an average annual rate of 7.0 per cent from 2020‑21 to 2023–24.
The forecast for Corporations Tax revenue is driven by the projected net operating surplus of corporations. Corporations Tax revenue is projected to grow at an average annual rate of 10.5 per cent from 2020‑21 to 2023–24.
The Ontario Health Premium revenue forecast is based primarily on the outlook for the compensation of employees. Ontario Health Premium revenue is projected to increase at an average annual rate of 3.6 per cent from 2020‑21 to 2023–24.
Education Property Tax revenue is projected to decrease at an average annual rate of 1.5 per cent from 2020‑21 to 2023–24. This is largely due to the impact of the previously announced municipal option to target tax relief to small businesses and the reduction in Business Education Tax (BET) rates in 2021, partially offset by growth in the property assessment base resulting from new construction activities.
Revenues from All Other Taxes are projected to increase at an average annual rate of 2.2 per cent from 2020‑21 to 2023–24. This includes revenues from the Employer Health Tax, Land Transfer Tax, Beer, Wine and Spirits Taxes and volume-based taxes such as the Gasoline Tax, Fuel Tax and Tobacco Tax.
The forecast for Government of Canada transfers is based on existing federal–provincial funding agreements and formulas. In the medium term, the outlook for federal transfers is mainly driven by projections of the Canada Health Transfer, Canada Social Transfer, funding for infrastructure projects, labour market programs and direct transfers to the Broader Public Sector. Revenues in 2020‑21 reflect $7.4 billion in one-time federal funding related to the COVID‑19 pandemic. Federal transfers are projected to decrease at an average annual rate of 5.3 per cent from 2020‑21 to 2023–24. The forecast does not include any amounts for Fiscal Stabilization for which the province may be eligible to apply.
The outlook for Income from Government Business Enterprises (GBEs) is based on Ontario Ministry of Finance estimates for Hydro One Ltd. and projections provided by Ontario Power Generation, the Ontario Cannabis Store, the Liquor Control Board of Ontario and the Ontario Lottery and Gaming Corporation (OLG). Revenues from GBEs are projected to increase at an average annual rate of 19.5 per cent from 2020‑21 to 2023–24. The strong average annual growth mainly reflects the recovery of OLG net income that was impacted by the shutdown of casinos in 2020‑21 due to the COVID‑19 pandemic.
The forecast for Other Non-Tax Revenue is based on projections provided by government ministries and provincial agencies. The outlook for Other Non-Tax revenues is projected to increase at an average annual rate of 6.5 per cent from 2020‑21 to 2023–24.
Risks to the Revenue Outlook
There are a variety of risks to the economic planning assumptions underlying the revenue forecast, as outlined in Chapter 2: Economic Performance and Outlook. Table 3.6 highlights some of the key risks and sensitivities to the 2021–22 revenue forecast that could arise from unexpected changes in economic conditions. These are only estimates and actual results can vary. The risks identified are based on factors that are considered to have the most material impact on the largest revenue sources. In the context of 2021–22, these sensitivities reflect experience during past post‑recession economic recoveries.
| Economic Factors | Revenue Sources | 2021–22 Sensitivities |
|---|---|---|
| Nominal GDP | Total Taxation Revenue | $1,100 million revenue change for each percentage point change in nominal GDP growth. This can vary significantly, depending on the composition and source of changes in GDP growth. |
| Compensation of Employees | Personal Income Tax, Ontario Health Premium and Employer Health Tax | $550 million revenue change for each percentage point change in growth in compensation of employees. |
| Household Consumption Expenditures | Harmonized Sales Tax | $215 million revenue change for each percentage point change in growth of household consumption expenditures. |
| Net Operating Surplus of Corporations | Corporations Tax | $117 million revenue change for each percentage point change in growth in net operating surplus of corporations. |
| Housing Resales and Resale Prices | Land Transfer Tax | $39 million revenue change for each percentage point change in growth of either the number or prices of housing resales. |
| Ontario Population Share | Canada Health Transfer | $43 million revenue change for each one‑tenth of a percentage point change in Ontario’s population share. |
| Ontario Population Share | Canada Social Transfer | $15 million revenue change for each one‑tenth of a percentage point change in Ontario’s population share. |
Table 3.6 footnotes:
Source: Ontario Ministry of Finance.
Revenue Outlook Scenarios
In order to illustrate the high degree of economic uncertainty in the current environment, the Ontario Ministry of Finance has developed two plausible alternative scenarios that the economy could take over the next several years. See Chapter 2: Economic Performance and Outlook for more details. Based on the two alternative economic scenarios, two taxation revenue scenarios were developed, representing reasonable paths intended to illustrate a broader range of possible outcomes.
| 2021–22p | 2022–23p | 2023–24p | |
|---|---|---|---|
| Faster Growth Scenario | 107.6 | 113.4 | 119.3 |
| Planning Projection | 104.8 | 109.1 | 113.5 |
| Slower Growth Scenario | 103.0 | 105.3 | 108.4 |
Table 3.7 footnotes:
p = Ontario Ministry of Finance planning projection and alternative scenarios
Source: Ontario Ministry of Finance.
In the Faster Growth scenario, total taxation revenue is $5.8 billion higher in 2023–24 than the planning projection, while in the Slower Growth scenario, total taxation revenue is $5.1 billion lower.
Medium-Term Expense Outlook
Ontario’s program expense outlook is projected to grow from $152.3 billion in 2019–20 to $171.1 billion in 2023–24. This reflects the government’s ongoing commitment to protect people’s health and to support the economy of Ontario.
| Actual 2019–20 |
Interim1 2020‑21 |
Medium-Term Outlook 2021–22 |
Medium-Term Outlook 2022–23 |
Medium-Term Outlook 2023–24 |
|
|---|---|---|---|---|---|
| Base Programs2 — Health Sector | 63.7 | 66.7 | 69.8 | 70.6 | 72.0 |
| Base Programs3 — Education Sector4 | 30.2 | 30.6 | 31.3 | 31.4 | 31.5 |
| Base Programs5 — Postsecondary Education Sector | 10.5 | 10.3 | 10.7 | 11.0 | 11.2 |
| Base Programs6 — Children’s and Social Services Sector | 17.1 | 17.7 | 17.8 | 18.0 | 18.1 |
| Base Programs7 — Justice Sector | 4.7 | 4.6 | 4.8 | 4.8 | 4.7 |
| Base Programs8 — Other Programs | 26.1 | 27.8 | 31.9 | 34.0 | 33.5 |
| Total Base Programs | 152.3 | 157.7 | 166.3 | 169.7 | 171.1 |
| COVID‑19 Time-Limited Funding | – | 20.1 | 6.7 | 2.8 | – |
| Total Programs | 152.3 | 177.8 | 173.0 | 172.5 | 171.1 |
| Interest on Debt | 12.5 | 12.5 | 13.1 | 13.7 | 14.6 |
| Total Expense | 164.8 | 190.3 | 186.1 | 186.2 | 185.6 |
Table 3.8 footnotes:
[1] Interim represents the 2021 Budget projection for the 2020‑21 fiscal year.
[2], [3], [5], [6], [7], [8] For presentation purposes in the 2021 Budget, one-time COVID‑19 related spending has been included within COVID‑19 Time-Limited Funding. This funding includes a one-time COVID‑19 Health Sector expense of $8.3 billion in 2020‑21, funding allocated from the Support for People and Jobs Fund, and other time-limited tax, energy and health care initiatives. The change in presentation does not impact ministry allocations or ministry structure(s) to be presented in the 2021–22 Expenditure Estimates. For details on time-limited funding and contingencies, see Table 3.9.
[4] Excludes Teachers’ Pension Plan, which is included in Other Programs.
Note: Numbers may not add due to rounding.
Sources: Ontario Treasury Board Secretariat and Ontario Ministry of Finance.
As part of Ontario’s effort to protect people’s health and the economy of Ontario, the government has made available COVID‑19 Time-Limited Funding to combat the pandemic and support the recovery of the province. This funding is presented separately in order to transparently capture the temporary nature of these investments.
On top of these temporary COVID‑19 related initiatives, the government continues to invest in programs that serve the people of Ontario. Over the medium-term outlook, base program expense is projected to increase every year, growing at an average annual rate of 3.0 per cent from 2019–20 to 2023–24.
Highlights of the changes to program expense outlook over the medium term include the following:
- Base Health sector expense is projected to increase from $63.7 billion in 2019–20 to $72.0 billion in 2023–24. Key investments include:
- Providing $4.9 billion in funding over four years to implement Ontario’s Long-Term Care Staffing Plan, including an increase in average daily direct care per resident to four hours;
- Providing the hospital sector with an additional $778 million in 2021–22 for investments to care for a growing and aging population, increase hospital capacity, provide additional clinical services and support specialty psychiatric hospitals, specialty children hospitals and small hospitals. This is in addition to the $760 million to care for COVID‑19 and other patients with added capacity of more than 3,100 hospital beds, and an additional $300 million to reduce the surgical backlog on top of previous investments;
- Investing an additional $602.2 million in 2021–22 in the Ontario Public Drug Program to support greater utilization, higher drug costs and the increase in the number of eligible recipients;
- $309.3 million over three years for additional operating funds for long-term care homes;
- $246 million over four years for renovations in long-term care homes to improve infection prevention and control, through measures such as upgrades to support physical distancing, facility repairs and updating ventilation systems, including air conditioning;
- Providing $234.9 million over three years to ensure the people of Ontario have access to blood products required to treat a variety of conditions including burns, bleeding disorders, liver diseases and many types of cancer;
- Investing $183 million over three years to support additional mental health and addiction services, taking a whole-of-government approach; and
- $160 million over three years to expand the Community Paramedicine for Long-Term Care program to allow seniors on long-term care waitlists to stay safe while living in the comfort of their own homes.
- Base Education sector expense is projected to increase from $30.2 billion in 2019–20 to $31.5 billion in 2023–24. Key investments include:
- Incorporating enrollment increases and the terms of the three-year central agreements with teachers and education workers ratified in 2019 and 2020.
- Base Postsecondary Education sector expense is projected to increase from $10.5 billion in
2019–20 to $11.2 billion in 2023–24. Key investments in this sector include:
- $59.5 million over three years for the government’s first micro-credentials strategy;
- $21.4 million over two years to provide students with more flexible and accessible virtual learning options; and
- Maintaining the financial sustainability of the Ontario Student Assistance Program.
- Base Children’s and Social Services sector expense is projected to increase from $17.1 billion in 2019–20 to $18.1 billion in 2023–24. Key investments include:
- $526 million in 2021–22 for social assistance as the government supports a sustainable and modern recovery and renewal plan that gives recipients a path to jobs, greater independence and improved outcomes;
- $361 million in 2021–22 for Developmental Services to continue to support clients currently in service and new high-risk clients; and
- $60 million annually, beginning in 2021–22, for Early Intervention and Special Needs to significantly reduce waitlists by increasing access to existing clinical assessment and rehabilitation programs.
- Base Justice sector expense is projected to remain stable at $4.7 billion between 2019–20 and 2023–24. Key investments include:
- $28.5 million over four years to implement a new case management system for Tribunals Ontario, which will provide comprehensive online dispute resolution services and enhance parties’ ability to monitor cases online. This initiative is part of a broader justice modernization strategy which will support a more accessible, responsive and resilient justice system by establishing new and innovative ways of delivering services in person and online;
- $18.2 million over three years to support ending violence against Indigenous women and girls by providing resources for First Nations police services as well as culturally responsive programming for Indigenous women in the correctional system;
- $12.5 million over three years to enhance the capacity of Ontario Provincial Police (OPP) mental health services, which will help frontline OPP officers gain better access to the supports they need;
- $8.4 million over three years for the Crisis Call Diversion Program, which will include embedding mental health crisis experts and specialists in OPP communication centres to enhance response for individuals experiencing a mental health crisis; and
- $2.1 million over three years to support program enhancements for victim services.
- Base Other Programs sector expense is projected to increase from $26.1 billion in 2019–20 to $33.5 billion in 2023–24. Key investments include:
- Investing an additional annual $1.1 billion by 2023–24 to provide electricity price relief, which includes shifting a portion of wind, solar and bioenergy costs from consumers’ electricity bills to the Province as announced in the 2020 Budget, as well as forecasted increases across various other electricity relief programs for eligible consumers;
- Investing $100 million in each year from 2021–22 to 2023–24 for a total of $300 million in the Invest Ontario Fund to support investments in key sectors of the economy; and
- Investing more than $36 million over three years to support the launch of the Ontario Vehicle Innovation Network.
- COVID‑19 Time-Limited Funding includes key investments such as:
- Through the Safe Restart Agreement, Ontario and the federal government are providing $4 billion in 2020‑21 in urgently needed one-time assistance to Ontario’s 444 municipalities and 110 transit systems to help local governments address municipal operating pressures and maintain critical services such as public transit;
- An investment of $2.3 billion in 2021–22 for Ontario’s Testing Strategy to help contain the COVID‑19 virus, protect lives and allow economic activity to continue in the safest way possible;
- Nearly $1.5 billion in time-limited financial support directly through the Support for Learners and the Ontario COVID‑19 Child Benefit. Including the support provided since March 2020, families would receive over $1.8 billion to help offset added costs of COVID‑19;
- More than $1 billion, beginning in 2020‑21 to support the administration, distribution and rollout of Ontario’s COVID‑19 vaccination campaign, including $50 million to support COVID‑19 vaccinations in First Nations and urban Indigenous communities;
- Nearly $1 billion in additional financial relief provided to municipalities, including:
- $500 million in additional provincial funding to support municipal operating pressures and recovery in 2021;
- $255 million in new provincial funding through the Social Services Relief Fund to support municipal service managers and Indigenous program partners in immediately responding to rising COVID‑19 caseloads in shelter settings. This builds on the $510 million provided through the Social Services Relief Fund in 2020‑21 that ensured the continuity of critical supports for vulnerable people based on local need; and,
- $150 million in additional provincial funding to support municipal transit systems providing reliable transportation services during the pandemic, which in some cases have experienced a 90 per cent decrease in ridership and revenue.
- An additional $760 million in 2021–22 to support hospitals in the response to COVID‑19;
- Approximately $650 million to support the continued COVID‑19 response and recovery in long‑term care homes, including prevention and containment measures, and to support homes impacted by changes in occupancy and that are facing COVID‑19 related pressures. This is in addition to $1.38 billion previously provided to long-term care homes, bringing Ontario’s total support since the beginning of the pandemic to over $2 billion;
- $407 million in 2020‑21 for the procurement of personal protective equipment and other critical supplies and equipment to support frontline staff in the education and public sectors through the pandemic;
- $260 million to help workers with their training expenses through a proposed temporary Ontario Jobs Training Tax Credit over 2020‑21 and 2021–22;
- $75 million to further support families with their child care expenses through the proposed enhancement to the CARE tax credit for 2021.
The total expense outlook includes interest on debt expense, which is projected to grow from $12.5 billion in 2020‑21 to $14.6 billion in 2023–24, due to the increase in debt required to fund deficits as well as investments in capital assets.
Prudence
In keeping with responsible fiscal practices, Ontario’s revenue outlook is based on prudent economic planning projections, as discussed in Chapter 2: Economic Performance and Outlook.
Ontario incorporates prudence in the form of a reserve to protect the fiscal outlook against unforeseen adverse changes in the province’s revenue and expense, including those resulting from changes in Ontario’s economic performance. The reserve has been set at $1.0 billion in 2021–22, and $1.5 billion in each of 2022–23 and 2023–24. In addition, standard Contingency Funds are maintained to help mitigate expense risks — for example, in cases where health and safety may be compromised, and which may otherwise adversely affect Ontario’s fiscal performance. The standard Contingency Fund in 2021–22 is set at $2.1 billion.
As part of the government’s effort to combat the pandemic and support the recovery of the province, funding previously tracked under the One-Time COVID‑19 Health Sector Expense, COVID‑19 Health Contingency Fund, Pandemic Fund and Support for People and Jobs Fund has been fully allocated for the 2020‑21 and 2021–22 fiscal years. For 2022–23, a balance of $2.0 billion remains available in the Pandemic Fund, and $0.8 billion in the Support for People and Jobs Fund. See Table 3.9 for additional details.
The government has also committed other COVID‑19 Time-Limited Funding to further protect people and jobs. With these new investments, the total funding provided for time-limited pandemic response and extraordinary contingencies is $20.1 billion in 2020‑21, $6.7 billion in 2021–22 and $2.8 billion in 2022–23. This funding is reflected within COVID‑19 Time-Limited Funding of the expense outlook.
| Interim1 2020‑21 |
Medium-Term Outlook 2021–22 |
Medium-Term Outlook 2022–23 |
Medium-Term Outlook 2023–24 |
|
|---|---|---|---|---|
| COVID‑19 Time-Limited Funding and Extraordinary Contingencies — One-Time COVID‑19 Health Sector Expense | 3,052 | – | – | – |
| COVID‑19 Time-Limited Funding and Extraordinary Contingencies — COVID‑19 Health Contingency Fund | 5,294 | – | – | – |
| COVID‑19 Time-Limited Funding and Extraordinary Contingencies — Pandemic Fund | – | 4,000 | 2,000 | – |
| COVID‑19 Time-Limited Funding and Extraordinary Contingencies — Support for People and Jobs Fund | 4,966 | 1,000 | 800 | – |
| COVID‑19 Time-Limited Funding and Extraordinary Contingencies — Other COVID‑19 Time-Limited Funding | 6,793 | 1,730 | 25 | – |
| Total COVID‑19 Time-Limited Funding and Extraordinary Contingencies | 20,104 | 6,730 | 2,825 | – |
| Remaining Balances as of the 2021 Budget — COVID‑19 Health Contingency Fund | – | – | – | – |
| Remaining Balances as of the 2021 Budget — Pandemic Fund | – | – | 2,000 | – |
| Remaining Balances as of the 2021 Budget — Support for People and Jobs Fund | – | – | 800 | – |
| Total Remaining Balances as of the 2021 Budget | – | – | 2,800 | – |
Table 3.9 footnotes:
[1] Interim represents the 2021 Budget projection for the 2020‑21 fiscal year.
Note: Numbers may not add due to rounding.
Sources: Ontario Treasury Board Secretariat and Ontario Ministry of Finance.
Risks to the Expense Outlook
Table 3.10 provides a summary of key expense risks and sensitivities that could result from unexpected changes in economic conditions and program demands. A change in these factors could affect total expense and the public sector, causing variances in the overall fiscal forecast. These sensitivities are examples of possible effects and can vary, depending on the nature and composition of potential risks.
| Program/Sector | 2021–22 Assumption | 2021–22 Sensitivities |
|---|---|---|
| Health Sector (base)1 | Annual growth of 4.6 per cent | One per cent change in health spending: $697.8 million |
| Hospital Costs (base)2 | Annual growth of 3.4 per cent | One per cent change in hospital costs: $203.7 million |
| COVID‑19 Testing | Cost per additional 10,000 diagnostic tests/day | Additional 10,000 COVID‑19 diagnostic tests: $0.46 million/day3 |
| Drug Programs (base) | Annual growth of 12.2 per cent4 | One per cent change in program expenditure of drug programs: $54.4 million |
| Ontario Health Insurance Plan (OHIP) (base) | Annual growth of 3.7 per cent | One per cent change in OHIP expense: $169.0 million |
| Long-Term Care Homes | 78,330 long-term care home beds. Average provincial annual operating cost per bed in a long-term care home: $73,587 |
One per cent change in number of beds: approximately $57.6 million5 |
| Home Care6 | Approximately 33.9 million hours of personal support services | One per cent change in hours of personal support services: approximately $13.3 million |
| Home Care7 | Approximately 9.2 million nursing and therapy visits and 2.5 million nursing shifts | One per cent change in all nursing and therapy visits: approximately $9.1 million |
| Elementary and Secondary Schools | Approximately 2,016,000 average daily pupil enrolment |
One per cent enrolment change: approximately $170 million |
| Ontario Works8 | 252,300 average annual caseload | One per cent caseload change: approximately $28 million |
| Ontario Disability Support Program9 | 395,400 average annual caseload | One per cent caseload change: approximately $58 million |
| Interest on Debt | Average cost of borrowing in 2021–22 is forecast to be 1.90 per cent | In the first full year, the impact of a 100 basis-point change in borrowing rates is forecast to be over $750 million |
Table 3.10 footnotes:
[1] Health Sector Expense includes funding from the Ontario Ministry of Health and the Ontario Ministry of Long-Term Care.
[2] Hospital costs are based on hospital operating transfer payments and exclude one-time funding for COVID‑19 and consolidations.
[3] Estimated cost per day is based on an average of $45.50 per test for tests conducted by the diagnostic lab network between October 2020 and December 2020. Tests processed outside of the network are more expensive on a per-test basis.
[4] 2020‑21 allocation of $4,852.0 million adjusted for COVID‑19 expenses versus 2021–22 Preliminary Budget of $5,442.4 million.
[5] Based on Long-Term Care Transfer Payment 2021–22 Plan of $5,764.04 million (excludes consolidation adjustments).
[6], [7] Home Care statistics are based on 2019–20 data and estimates.
[8], [9] Expense sensitivities for Ontario Works and the Ontario Disability Support Program include estimates of the impact of the federal extension of the maximum number of weeks people can access federal benefits.
Sources: Ontario Treasury Board Secretariat, Ontario Ministry of Finance and Ontario Ministry of Long-Term Care.
Transparency and Risks
Ontario is committed to being open and transparent about the state of its finances. This principle is reflected in the Fiscal Sustainability, Transparency and Accountability Act, 2019 (FSTAA),which stipulates that Ontario’s fiscal policy should be based on cautious assumptions.
While updates to the government’s finances are informed by the latest information available, key information still to be received over the remainder of the fiscal year may have further upside and downside risks, which could materially affect the fiscal outlook. Revenue could be affected by changes in the economy, while expenses could be impacted by changes in the utilization of large demand-driven programs.
As a matter of fiscal risk management practices, risks are monitored throughout the fiscal year by the Treasury Board, with the goal of ensuring that robust and prudent methodologies are used to develop forecasts. Other important risk management tools include closely tracking the pace of implementation of initiatives and proactively identifying emerging program and policy risks. Comprehensive analysis of known risks informs the fiscal planning processes, including the development of plans to mitigate and manage fiscal risks, as well as integrating risks into medium-term fiscal projections when appropriate.
In addition to the key demand sensitivities and economic risks to the fiscal plan, there are risks stemming from the government’s contingent liabilities. Whether future events will result in these becoming actual liabilities for the province is beyond the direct control of the government. For example, losses could result from legal settlements, defaults on project agreements, or a call on loan or funding guarantees. Provisions for losses that are likely to occur and can be reasonably estimated are expensed and reported as liabilities in the province’s financial statements. Any significant contingent liabilities related to the 2020‑21 fiscal year will be disclosed as part of the Public Accounts of Ontario 2020–2021, to be released later this year.
Details of Ontario’s Finances
| Actual 2018–19 |
Actual 2019–20 |
Interim1 2020‑21 |
Plan 2021–22 |
|
|---|---|---|---|---|
| Taxation Revenue — Personal Income Tax | 35,381 | 37,743 | 35,876 | 36,351 |
| Taxation Revenue — Sales Taxes | 27,804 | 28,619 | 26,042 | 27,632 |
| Taxation Revenue — Corporations Tax | 16,606 | 15,414 | 11,435 | 14,389 |
| Taxation Revenue — Education Property Tax | 6,171 | 6,179 | 6,000 | 5,754 |
| Taxation Revenue — Employer Health Tax | 6,544 | 6,731 | 6,480 | 6,445 |
| Taxation Revenue — Ontario Health Premium | 3,819 | 4,059 | 3,958 | 4,141 |
| Taxation Revenue — Gasoline Tax | 2,709 | 2,783 | 2,120 | 2,421 |
| Taxation Revenue — Land Transfer Tax | 2,761 | 3,067 | 3,481 | 3,890 |
| Taxation Revenue — Tobacco Tax | 1,241 | 1,118 | 1,103 | 1,060 |
| Taxation Revenue — Fuel Tax | 774 | 807 | 711 | 814 |
| Taxation Revenue — Beer, Wine and Spirits Taxes | 607 | 582 | 615 | 618 |
| Taxation Revenue — Electricity Payments in Lieu of Taxes | 435 | 505 | 557 | 454 |
| Taxation Revenue — Ontario Portion of the Federal Cannabis Excise Duty | 19 | 48 | 140 | 245 |
| Taxation Revenue — Other Taxes | 653 | 623 | 581 | 605 |
| Taxation Revenue — Total | 105,524 | 108,278 | 99,099 | 104,819 |
| Government of Canada — Canada Health Transfer | 14,852 | 15,640 | 16,208 | 16,737 |
| Government of Canada — Canada Social Transfer | 5,451 | 5,650 | 5,815 | 6,005 |
| Government of Canada — Equalization | 963 | – | – | – |
| Government of Canada — Infrastructure Programs | 605 | 400 | 1,025 | 1,086 |
| Government of Canada — Labour Market Programs | 1,015 | 1,054 | 1,521 | 1,316 |
| Government of Canada — Social Housing Agreement | 394 | 484 | 331 | 299 |
| Government of Canada — Other Federal Payments | 1,420 | 1,756 | 8,450 | 1,577 |
| Government of Canada — Direct Transfers to Broader Public-Sector Organizations | 390 | 414 | 395 | 424 |
| Government of Canada —Total | 25,090 | 25,398 | 33,745 | 27,444 |
| Income from Government Business Enterprises — Liquor Control Board of Ontario | 2,276 | 2,402 | 2,452 | 2,435 |
| Income from Government Business Enterprises — Ontario Power Generation Inc./Hydro One Ltd. | 772 | 1,167 | 1,034 | 670 |
| Income from Government Business Enterprises — Ontario Lottery and Gaming Corporation | 2,464 | 2,309 | 300 | 1,266 |
| Income from Government Business Enterprises — Ontario Cannabis Store | (42) | 19 | 70 | 170 |
| Income from Government Business Enterprises —Total | 5,470 | 5,897 | 3,856 | 4,541 |
| Other Non-Tax Revenue —Fees, Donations and Other Revenues from Hospitals, School Boards and Colleges | 9,237 | 9,281 | 8,353 | 9,758 |
| Other Non-Tax Revenue — Vehicle and Driver Registration Fees | 1,991 | 2,055 | 2,065 | 2,096 |
| Other Non-Tax Revenue — Miscellaneous Other Non-Tax Revenue | 1,873 | 1,222 | 1,241 | 1,322 |
| Other Non-Tax Revenue — Other Fees and Licences | 1,088 | 1,156 | 1,042 | 1,208 |
| Other Non-Tax Revenue — Sales and Rentals | 1,477 | 1,369 | 754 | 1,402 |
| Other Non-Tax Revenue — Reimbursements | 998 | 1,005 | 1,174 | 1,031 |
| Other Non-Tax Revenue — Royalties | 251 | 283 | 342 | 284 |
| Other Non-Tax Revenue — Power Supply Contract Recoveries | 173 | 122 | 114 | 102 |
| Other Non-Tax Revenue — Net Reduction of Power Purchase Contracts | 41 | 30 | 28 | 5 |
| Other Non-Tax Revenue — Electricity Debt Retirement Charge2 | 15 | – | – | – |
| Other Non-Tax Revenue — Carbon Allowance Proceeds | 472 | – | – | – |
| Other Non-Tax Revenue —Total | 17,616 | 16,523 | 15,113 | 17,208 |
| Total Revenue | 153,700 | 156,096 | 151,813 | 154,012 |
Table 3.11 footnotes:
[1] Interim represents the 2021 Budget projection for the 2020‑21 fiscal year.
[2] The Debt Retirement Charge cost was removed from residential electricity users’ electricity bills as of January 1, 2016, and for all other consumers as of April 1, 2018. Residual revenues recorded afterwards due to higher-than-expected amounts received following the 2017–18 year-end, compared to the estimated accrual amounts in 2017–18.
Note: Numbers may not add due to rounding.
Source: Ontario Ministry of Finance.
| Ministry Expense | Actual 2018–19 |
Actual 2019–20 |
Interim2 2020‑21 |
Plan 2021–22 |
|---|---|---|---|---|
| Agriculture, Food and Rural Affairs (Base) | 328 | 297 | 301 | 310.9 |
| Agriculture, Food and Rural Affairs — Federal–Provincial Infrastructure Programs3 | 96 | 94 | – | – |
| Agriculture, Food and Rural Affairs — Municipal Infrastructure Program Investments4 | 257 | 222 | – | – |
| Agriculture, Food and Rural Affairs — Demand-Driven Risk Management and Time-Limited Programs5 | 383 | 518 | 392 | 417.2 |
| Agriculture, Food and Rural Affairs — COVID‑19 Time-Limited Funding6 | – | – | 83 | 26.2 |
| Agriculture, Food and Rural Affairs (Total) | 1,064 | 1,130 | 777 | 754.3 |
| Attorney General (Base) | 1,757 | 1,734 | 1,645 | 1,675.0 |
| Attorney General — Statutory Appropriations – Crown Liability and Proceedings Act, 2019 | 17 | 192 | 26 | – |
| Attorney General — COVID‑19 Time-Limited Funding7 | – | – | 32 | – |
| Attorney General (Total) | 1,774 | 1,927 | 1,703 | 1,675.0 |
| Board of Internal Economy (Total) | 371 | 257 | 280 | 273.0 |
| Children, Community and Social Services (Base) | 16,782 | 17,070 | 17,736 | 17,841.5 |
| Children, Community and Social Services — COVID‑19 Time-Limited Funding8 | – | – | 88 | 69.1 |
| Children, Community and Social Services (Total) | 16,782 | 17,070 | 17,824 | 17,910.6 |
| Colleges and Universities (Base) | 9,029 | 9,220 | 9,375 | 9,312.8 |
| Colleges and Universities — Student Financial Assistance | 2,043 | 1,296 | 895 | 1,352.4 |
| Colleges and Universities — Time-Limited Infrastructure Funding under the Strategic Investment Fund | 119 | 2 | – | – |
| Colleges and Universities — COVID‑19 Time-Limited Funding9 | – | – | – | 12.7 |
| Colleges and Universities (Total) | 11,191 | 10,519 | 10,270 | 10,677.9 |
| Economic Development, Job Creation and Trade (Base) | 354 | 315 | 358 | 377.5 |
| Economic Development, Job Creation and Trade — Time-Limited Investments | 430 | 263 | 262 | 214.1 |
| Economic Development, Job Creation and Trade — COVID‑19 Time-Limited Funding10 | – | – | 3,508 | 293.7 |
| Economic Development, Job Creation and Trade (Total) | 783 | 579 | 4,128 | 885.3 |
| Education (Base) | 28,742 | 30,177 | 30,561 | 31,263.0 |
| Education — Teachers’ Pension Plan11 | 1,678 | 1,570 | 1,608 | 1,630.9 |
| Education — COVID‑19 Time-Limited Funding12 | – | – | 1,573 | 59.3 |
| Education (Total) | 30,420 | 31,748 | 33,742 | 32,953.2 |
| Energy, Northern Development and Mines (Base)13 | 1,361 | 1,099 | 1,034 | 1,083.8 |
| Energy, Northern Development and Mines — Electricity Cost Relief Programs | 4,243 | 5,484 | 5,903 | 6,493.6 |
| Energy, Northern Development and Mines — COVID‑19 Time-Limited Funding14 | – | – | 460 | 62.0 |
| Energy, Northern Development and Mines (Total) | 5,604 | 6,583 | 7,396 | 7,639.5 |
| Environment, Conservation and Parks (Base) | 459 | 612 | 628 | 684.3 |
| Environment, Conservation and Parks — Time-Limited Investments | 223 | 2 | 0 | – |
| Environment, Conservation and Parks — COVID‑19 Time-Limited Funding15 | – | – | 15 | 2.3 |
| Environment, Conservation and Parks (Total) | 682 | 614 | 643 | 686.6 |
| Executive Offices (Base) | 33 | 32 | 38 | 39.9 |
| Executive Offices — Time-Limited Assistance | – | – | 2 | – |
| Executive Offices (Total) | 33 | 32 | 40 | 39.9 |
| Finance (Base) | 883 | 804 | 804 | 850.9 |
| Finance — Investment Management Corporation of Ontario16 | 67 | 88 | 141 | 185.4 |
| Finance — Ontario Municipal Partnership Fund | 510 | 503 | 502 | 501.9 |
| Finance — Power Supply Contract Costs | 173 | 122 | 114 | 102.2 |
| Finance — COVID‑19 Response: Support for People and Jobs Fund | – | – | – | – |
| Finance — COVID‑19 Time-Limited Funding17 | – | – | 376 | 35.0 |
| Finance (Total) | 1,633 | 1,518 | 1,937 | 1,675.4 |
| Francophone Affairs (Base) | 6 | 5 | 6 | 6.5 |
| Francophone Affairs — COVID‑19 Time-Limited Funding18 | – | – | 1 | 2.3 |
| Francophone Affairs (Total) | 6 | 5 | 7 | 8.8 |
| Government and Consumer Services (Base) | 706 | 683 | 717 | 743.4 |
| Government and Consumer Services — Realty | 1,012 | 924 | 1,234 | 1,144.6 |
| Government and Consumer Services — COVID‑19 Time-Limited Funding19 | – | – | 407 | – |
| Government and Consumer Services (Total) | 1,718 | 1,607 | 2,359 | 1,887.9 |
| Health (Total)20 | 57,566 | 59,286 | 61,159 | 64,016.7 |
| COVID‑19 Health Response21 | – | – | 8,410 | 5,144.1 |
| Heritage, Sport, Tourism and Culture Industries (Base) | 934 | 907 | 889 | 1,016.2 |
| Heritage, Sport, Tourism and Culture Industries — Ontario Cultural Media Tax Credits | 588 | 656 | 512 | 602.1 |
| Heritage, Sport, Tourism and Culture Industries — Ontario Cultural Media Tax Credits – Amounts Related to Prior Years | 40 | 80 | 65 | – |
| Heritage, Sport, Tourism and Culture Industries — COVID‑19 Time-Limited Funding22 | – | – | 66 | 205.4 |
| Heritage, Sport, Tourism and Culture Industries (Total) | 1,562 | 1,643 | 1,531 | 1,823.8 |
| Indigenous Affairs (Base) | 75 | 71 | 83 | 85.5 |
| Indigenous Affairs — One-Time Investments including Settlements | 215 | 16 | 165 | – |
| Indigenous Affairs — COVID‑19 Time-Limited Funding23 | – | – | 14 | 4.0 |
| Indigenous Affairs (Total) | 289 | 86 | 261 | 89.5 |
| Infrastructure (Base) | 161 | 81 | 155 | 365.4 |
| Infrastructure — Federal–Provincial Infrastructure Programs24 | 352 | 160 | 235 | 590.0 |
| Infrastructure — Waterfront Toronto Revitalization (Port Lands Flood Protection) | – | 116 | 103 | 155.6 |
| Infrastructure — Municipal Infrastructure Program Investments25 | – | – | 198 | 200.0 |
| Infrastructure — COVID‑19 Time-Limited Funding26 | – | – | – | 233.5 |
| Infrastructure (Total) | 512 | 358 | 691 | 1,544.5 |
| Labour, Training and Skills Development (Base) | 175 | 121 | 154 | 175.1 |
| Labour, Training and Skills Development — Training Tax Credits (Co-operative Education and Apprenticeship Training)27 | 183 | 152 | 98 | 88.9 |
| Labour, Training and Skills Development — Demand-Driven Employment and Training Programs | 943 | 922 | 1,473 | 1,169.3 |
| Labour, Training and Skills Development — COVID‑19 Time-Limited Funding28 | – | – | 65 | 288.0 |
| Labour, Training and Skills Development (Total) | 1,301 | 1,194 | 1,790 | 1,721.3 |
| Long-Term Care (Total)29 | 4,329 | 4,423 | 5,582 | 5,764.0 |
| Municipal Affairs and Housing (Base) | 474 | 540 | 483 | 512.3 |
| Municipal Affairs and Housing — Safe Restart Agreement30 | – | – | 1,900 | – |
| Municipal Affairs and Housing — Time-Limited Investments | 636 | 317 | 255 | 349.2 |
| Municipal Affairs and Housing — Social Housing Agreement – Payments to Service Managers31 | 367 | 341 | 314 | 284.5 |
| Municipal Affairs and Housing — COVID‑19 Time-Limited Funding32 | – | – | 797 | 286.3 |
| Municipal Affairs and Housing (Total) | 1,477 | 1,197 | 3,749 | 1,432.3 |
| Natural Resources and Forestry (Base) | 500 | 529 | 556 | 573.4 |
| Natural Resources and Forestry — Emergency Forest Firefighting | 208 | 136 | 120 | 100.0 |
| Natural Resources and Forestry (Total) | 708 | 665 | 676 | 673.3 |
| Seniors and Accessibility (Base) | 51 | 52 | 56 | 66.5 |
| Seniors and Accessibility — Time-Limited Investments | – | – | 126 | 9.1 |
| Seniors and Accessibility — COVID‑19 Time-Limited Funding33 | – | – | 26 | 6.0 |
| Seniors and Accessibility (Total) | 51 | 52 | 209 | 81.7 |
| Solicitor General (Base) | 2,670 | 2,763 | 2,923 | 3,096.4 |
| Solicitor General — COVID‑19 Time-Limited Funding34 | – | – | 48 | – |
| Solicitor General (Total) | 2,670 | 2,763 | 2,971 | 3,096.4 |
| Transportation (Base)35 | 4,536 | 4,950 | 5,016 | 5,529.9 |
| Transportation — Safe Restart Agreement | – | – | 2,000 | – |
| Transportation — Federal–Provincial Infrastructure Programs | 297 | 188 | 755 | 702.9 |
| Transportation — COVID‑19 Time-Limited Funding36 | – | – | 175 | – |
| Transportation (Total) | 4,833 | 5,138 | 7,946 | 6,232.8 |
| Treasury Board Secretariat (Base) | 227 | 214 | 344 | 454.8 |
| Treasury Board Secretariat — Employee and Pensioner Benefits37 | 1,165 | 1,665 | 1,340 | 1,766.5 |
| Treasury Board Secretariat — Operating Contingency Fund | – | – | – | 1,915.1 |
| Treasury Board Secretariat — Capital Contingency Fund | – | – | – | 165.3 |
| Treasury Board Secretariat — COVID‑19 Time-Limited Funding38 | – | – | 60 | – |
| Treasury Board Secretariat (Total) | 1,392 | 1,879 | 1,744 | 4,301.7 |
| Interest on Debt39 | 12,384 | 12,495 | 12,456 | 13,130.1 |
| Total Expense | 161,135 | 164,768 | 190,281 | 186,119.5 |
Table 3.12 footnotes:
[1] Numbers reflect current ministry structure.
[2] Interim represents the 2021 Budget projection for the 2020‑21 fiscal year.
[3], [4], [24], [25] Municipal and Federal-Provincial Infrastructure Program delivery transferred from the Ontario Ministry of Agriculture, Food and Rural Affairs to the Ontario Ministry of Infrastructure in 2020‑21.
[5] The 2019–20 amount includes extraordinary production insurance payout of $175 million above annual forecast due to 2019 crop conditions.
[6], [7], [8], [9], [10], [12], [14], [15], [17], [18], [19], [21], [22], [23], [26], [28], [32], [33], [34], [36], [38] One-time COVID‑19 related spending has been presented as part of COVID‑19 Time-Limited Funding, see Table 3.8. For details on time-limited funding and contingencies, see Table 3.9.
[11], [37] Numbers reflect the pension expense that was calculated based on recommendations of the Independent Financial Commission of Inquiry, as described in Note 19 to the Consolidated Financial Statements in Public Accounts of Ontario 2017–2018.
[13], [35] Ontario Northland Transportation Commission transferred from the Ontario Ministry of Energy, Northern Development and Mines to the Ontario Ministry of Transportation beginning in 2019–20.
[16] Based on the requirements of Public Sector Accounting Standards, the Province consolidates the Investment Management Corporation of Ontario into the Ontario Ministry of Finance.
[20] Includes accounting adjustments tied primarily to grants provided for infrastructure projects and other related investments.
[27] The Co-operative Education Tax Credit remains in effect. The Apprenticeship Training Tax Credit is eliminated for eligible apprenticeship programs that commenced on or after November 15, 2017. 2018–19 to 2020‑21 include tax credit amounts related to prior years.
[29] Ontario Ministry of Long-Term Care total includes expenses incurred by Ontario Health for funding for long-term care. These amounts will be consolidated in the total expense of the Ontario Ministry of Health, including $4.2 billion in 2020‑21 and $5.6 billion in 2021–22.
[30] Safe Restart Funding to municipalities includes an additional $100 million for public health in 2019–20 and 2020‑21, not included in this table.
[31] The annual decline from 2018–19 to 2021–22 is mainly due to declining federal obligations, such as maturing mortgages, under the Social Housing Agreement.
[39] Interest on debt is net of interest capitalized during construction of tangible capital assets of $236 million in 2021–22.
Note: Numbers may not add due to rounding.
Sources: Ontario Treasury Board Secretariat and Ontario Ministry of Finance.
| Sector | Total Infrastructure Expenditures Interim1, 2 2020‑21 |
2021–22 Plan Investment in Capital Assets3 |
2021–22 Plan Transfers and Other Infrastructure Expenditures4 |
2021–22 Plan Total Infrastructure Expenditures |
|---|---|---|---|---|
| Transportation — Transit | 5,434 | 4,216 | 1,426 | 5,642 |
| Transportation — Provincial Highways | 2,912 | 2,406 | 186 | 2,592 |
| Transportation — Other Transportation, Property and Planning | 228 | 107 | 75 | 182 |
| Health — Hospitals | 2,671 | 1,616 | 3 | 1,619 |
| Health — Other Health | 283 | 60 | 244 | 304 |
| Education | 2,241 | 3,285 | 10 | 3,295 |
| Postsecondary Education — Colleges and Other | 899 | 829 | 64 | 893 |
| Postsecondary Education — Universities | 90 | – | 93 | 93 |
| Social | 267 | 18 | 310 | 328 |
| Justice | 433 | 877 | 105 | 983 |
| Other Sectors5 | 1,731 | 1,027 | 1,664 | 2,691 |
| Total Infrastructure Expenditures | 17,190 | 14,442 | 4,181 | 18,623 |
| Less: Other Partner Funding6 | 2,294 | 1,765 | – | 1,765 |
| Total7 | 14,896 | 12,677 | 4,181 | 16,858 |
Table 3.13 footnotes:
[1] Interim represents the 2021 Budget projection for the 2020‑21 fiscal year.
[2] Includes provincial investment in capital assets of $11.9 billion.
[3] Includes $236 million in interest capitalized during construction.
[4] Includes transfers to municipalities, universities and non-consolidated agencies.
[5] Includes government administration, natural resources, and the culture and tourism industries.
[6] Other Partner Funding refers to third-party investments primarily in hospitals, colleges and schools.
[7] Includes Federal/Municipal contributions to provincial infrastructure investments.
Note: Numbers may not add due to rounding.
Source: Ontario Treasury Board Secretariat.
| 2012–13 | 2013–14 | 2014–15 | 2015–16 | 2016–17 | 2017–18 | 2018–19 | Actual 2019–20 |
Interim3 2020‑21 |
Plan 2021–22 |
|
|---|---|---|---|---|---|---|---|---|---|---|
| Revenue | 120,319 | 122,955 | 126,152 | 136,148 | 140,734 | 150,594 | 153,700 | 156,096 | 151,813 | 154,012 |
| Expense — Programs | 120,103 | 123,330 | 126,199 | 129,905 | 131,460 | 142,363 | 148,751 | 152,273 | 177,825 | 172,989 |
| Expense — Interest on Debt4 | 10,878 | 11,155 | 11,221 | 11,589 | 11,709 | 11,903 | 12,384 | 12,495 | 12,456 | 13,130 |
| Total Expense | 130,981 | 134,485 | 137,420 | 141,494 | 143,169 | 154,266 | 161,135 | 164,768 | 190,281 | 186,120 |
| Reserve | – | – | – | – | – | – | – | – | – | 1,000 |
| Surplus/(Deficit) | (10,662) | (11,530) | (11,268) | (5,346) | (2,435) | (3,672) | (7,435) | (8,672) | (38,468) | (33,108) |
| Net Debt | 259,947 | 276,169 | 294,557 | 306,357 | 314,077 | 323,834 | 338,496 | 353,332 | 399,463 | 439,844 |
| Accumulated Deficit | 174,256 | 184,835 | 196,665 | 203,014 | 205,939 | 209,023 | 216,642 | 225,764 | 264,232 | 297,340 |
| Gross Domestic Product (GDP) at Market Prices | 680,791 | 696,192 | 727,042 | 760,435 | 790,749 | 824,979 | 859,079 | 891,811 | 848,997 | 901,856 |
| Primary Household Income | 459,895 | 473,807 | 490,423 | 512,570 | 520,486 | 541,501 | 567,492 | 591,527 | 587,305 | 609,623 |
| Population — July (000s)5 | 13,391 | 13,511 | 13,618 | 13,707 | 13,875 | 14,070 | 14,309 | 14,545 | 14,734 | 14,936 |
| Net Debt per Capita (dollars) | 19,413 | 20,441 | 21,631 | 22,350 | 22,636 | 23,016 | 23,657 | 24,293 | 27,112 | 29,448 |
| Household Income per Capita (dollars) | 34,345 | 35,069 | 36,014 | 37,394 | 37,511 | 38,486 | 39,661 | 40,670 | 39,861 | 40,815 |
| Net Debt as a Per Cent of Revenue | 216.0% | 224.6% | 233.5% | 225.0% | 223.2% | 215.0% | 220.2% | 226.4% | 263.1% | 285.6% |
| Interest on Debt as a Per Cent of Revenue | 9.0% | 9.1% | 8.9% | 8.5% | 8.3% | 7.9% | 8.1% | 8.0% | 8.2% | 8.5% |
| Net Debt as a Per Cent of GDP | 38.2% | 39.7% | 40.5% | 40.3% | 39.7% | 39.3% | 39.4% | 39.6% | 47.1% | 48.8% |
| Accumulated Deficit as a Per Cent of GDP | 25.6% | 26.5% | 27.1% | 26.7% | 26.0% | 25.3% | 25.2% | 25.3% | 31.1% | 33.0% |
Table 3.14 footnotes:
[1] Amounts reflect a change in pension expense that was calculated based on recommendations of the Independent Financial Commission of Inquiry, as described in Note 19 to the Consolidated Financial Statements, in Public Accounts of Ontario 2017–2018. Amounts for net debt and accumulated deficit also reflect this change.
[2] Revenues and expenses have been restated to reflect the following fiscally neutral changes: i) revised presentation of education property taxes to be included in the taxation revenues; ii) reclassification of certain Government Business Enterprises to other government organizations; iii) reclassification of a number of tax measures that provide a financial benefit through the tax system to be reported as expenses; and iv) change in presentation of third-party revenue for hospitals, school boards and colleges to be reported as revenue.
[3] Interim represents the 2021 Budget projection for the 2020‑21 fiscal year.
[4] Interest on debt is net of interest capitalized during construction of tangible capital assets of $165 million in 2015–16, $159 million in 2016–17, $157 million in 2017–18, $175 million in 2018–19, $245 million in 2019–20, $234 million in 2020‑21 and $236 million in 2021–22.
[5] Population figures are for July 1 of the fiscal year indicated (i.e., for 2012–13, the population on July 1, 2012 is shown).
Note: Numbers may not add due to rounding.
Sources: Statistics Canada, Ontario Treasury Board Secretariat and Ontario Ministry of Finance.
Chart Descriptions
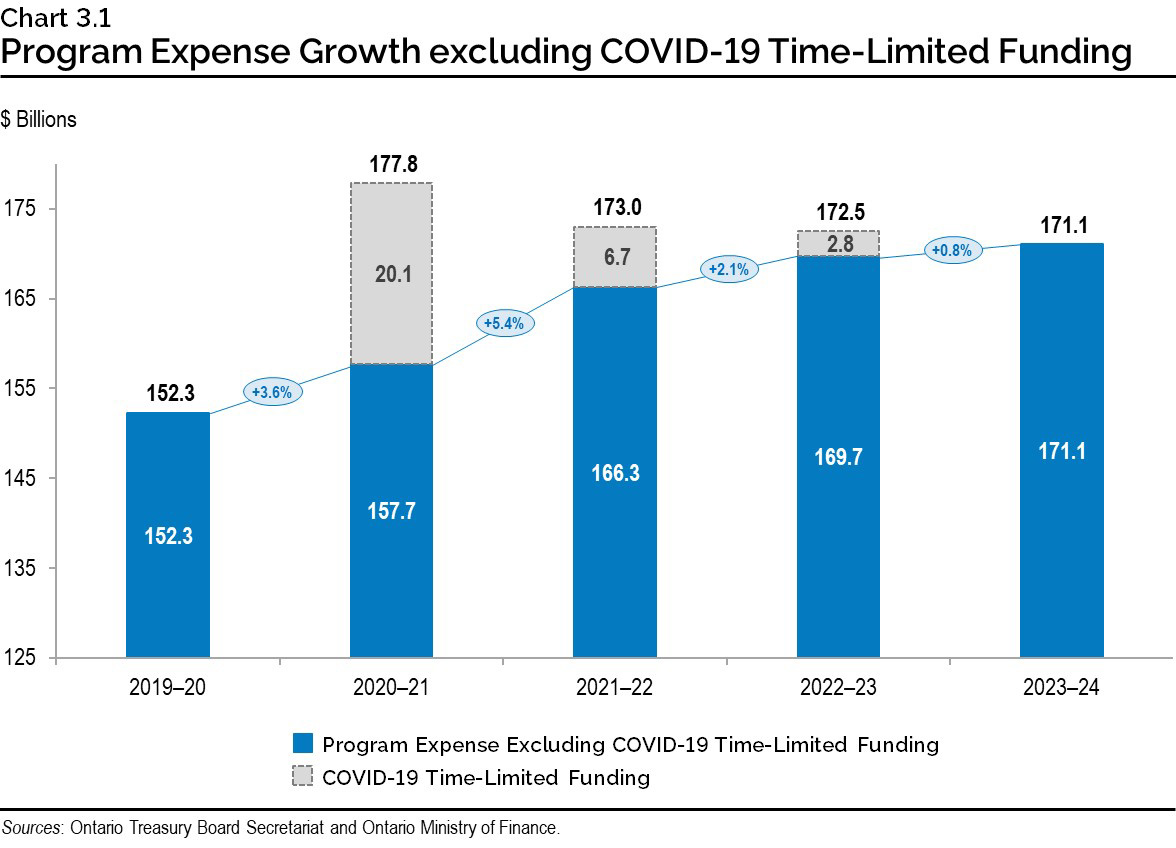
Chart 3.1: Program Expense Growth excluding COVID‑19 Time-Limited Funding
The stacked bar chart shows program expense growth from 2019–20 to 2023–24, excluding COVID‑19 Time-Limited Funding. Program expense, excluding COVID‑19 Time-Limited Funding, is $152.3 billion in 2019–20, $157.7 billion in 2020‑21, $166.3 billion in 2021–22, $169.7 billion in 2022–23, and $171.1 billion in 2023–24. This represents annual year-over-year growth rates of 3.6 percent, 5.4 per cent, 2.1 per cent and 0.8 per cent, respectively.
There are only three years from 2019–20 to 2023–24 where COVID‑19 Time-Limited Funding is included in total program expense. In 2020‑21, COVID‑19 Time-Limited Funding of $20.1 billion increases total program expense to $177.8 billion. In 2021–22, COVID‑19 Time Limited Funding of $6.7 billion increases total program expense to $173.0 billion. In 2022–23, COVID‑19 Time-Limited Funding of $2.8 billion increases total program expense to $172.5 billion.
Sources: Ontario Treasury Board Secretariat and Ontario Ministry of Finance.
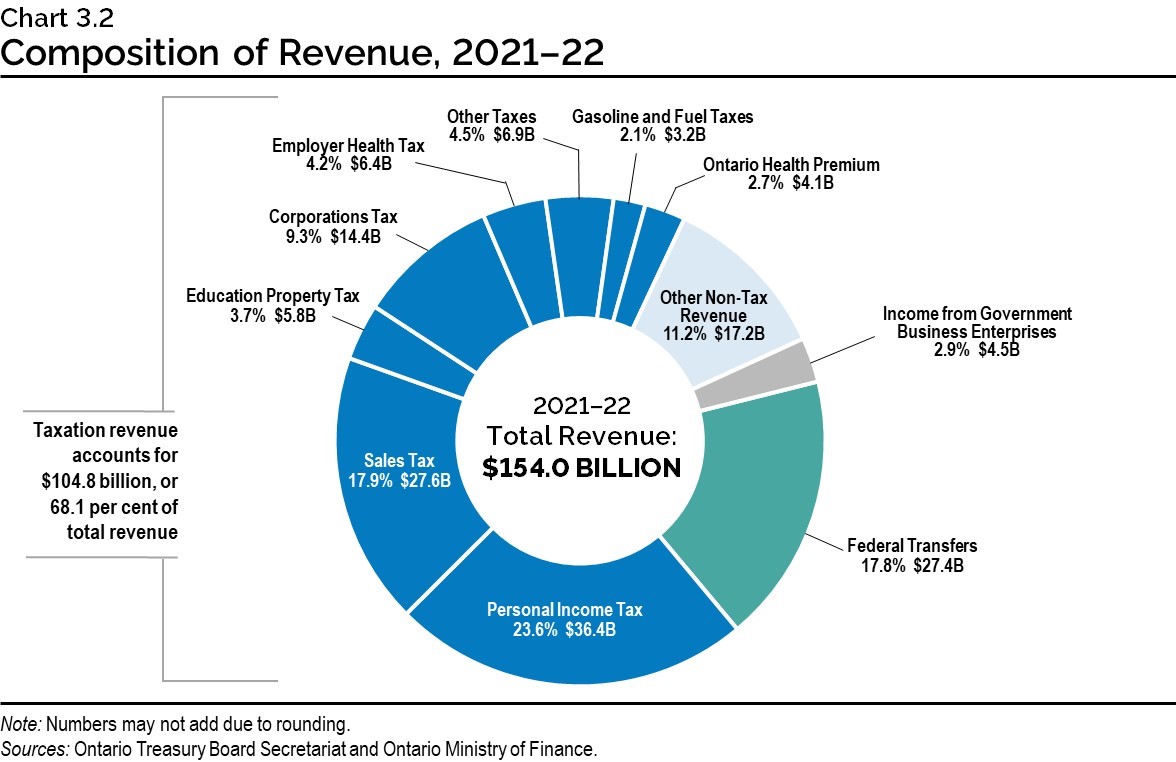
Chart 3.2: Composition of Revenue, 2021–22
The pie chart shows the composition of Ontario’s revenue in 2021–22, which is projected to be $154.0 billion. The largest taxation revenue source is Personal Income Tax revenue at $36.4 billion, accounting for 23.6 per cent of total revenue. This is followed by Sales Tax at $27.6 billion, or 17.9 per cent of total revenue; and Corporations Tax at $14.4 billion, or 9.3 per cent of total revenue. Other components of taxation revenue include Education Property Tax at $5.8 billion, or 3.7 per cent of total revenue; Employer Health Tax at $6.4 billion, or 4.2 per cent; Gasoline and Fuel Taxes at $3.2 billion, or 2.1 per cent; the Ontario Health Premium at $4.1 billion, or 2.7 per cent; and Other Taxes at $6.9 billion, or 4.5 per cent of total revenue.
Total taxation revenue accounts for $104.8 billion, or 68.1 per cent of total revenue.
The other major non-taxation sources of revenue are Federal Transfers of $27.4 billion, or 17.8 per cent of total revenue; Income from Government Business Enterprises at $4.5 billion, or 2.9 per cent of total revenue; and various Other Non-Tax Revenue at $17.2 billion, or 11.2 per cent of total revenue.
Note: Numbers may not add due to rounding.
Source: Ontario Treasury Board Secretariat and Ontario Ministry of Finance.
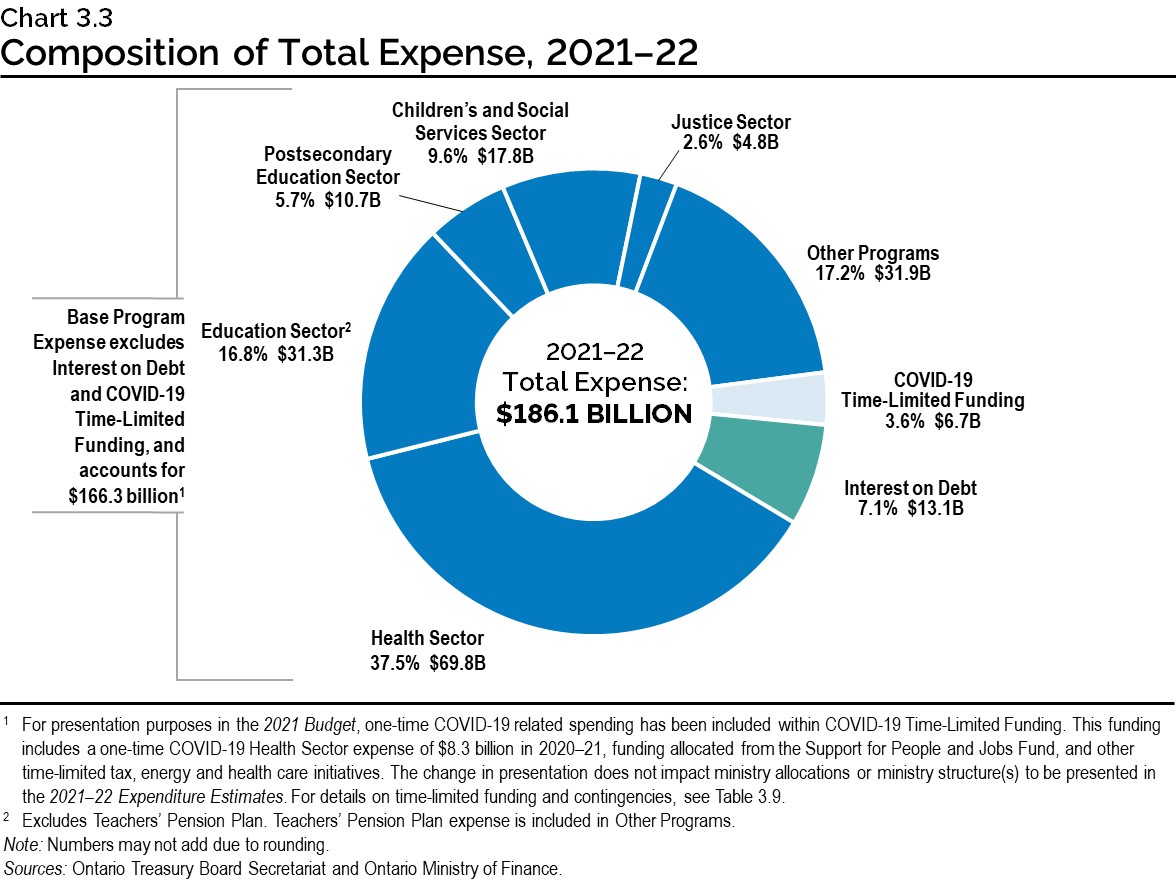
Chart 3.3: Composition of Total Expense, 2021–22
The pie chart shows the share of Ontario’s total expense and dollar amounts by sector in 2021–22.
Total expense in 2021–22 is projected to be $186.1 billion.
The largest expense is the Health Sector at $69.8 billion, accounting for 37.5 per cent of total expense.
The remaining sectors of total expense include the Education Sector at $31.3 billion or 16.8 per cent; the Postsecondary Education Sector2 at $10.7 billion or 5.7 per cent; the Children’s and Social Services Sector at $17.8 billion or 9.6 per cent; the Justice Sector at $4.8 billion or 2.6 per cent; Other Programs at $31.9 billion or 17.2 per cent; and COVID‑19 Time-Limited Funding at $6.7 billion or 3.6 per cent. Interest on Debt, included as part of Total Expense, is $13.1 billion or 7.1 per cent.
Base Program Expense excludes Interest on Debt and COVID‑19 Time-Limited Funding and accounts for $166.3 billion1
[1] For presentation purposes in the 2021 Budget, one-time COVID‑19 related spending has been included within COVID‑19 Time-Limited Funding. This funding includes a one-time COVID‑19 Health Sector expense of $8.3 billion in 2020‑21, funding allocated from the Support for People and Jobs Fund, and other time-limited tax, energy and health care initiatives. The change in presentation does not impact ministry allocations or ministry structure(s) to be presented in the 2021–22 Expenditure Estimates. For details on time-limited funding and contingencies, see Table 3.9.
[2] Excludes Teachers’ Pension Plan. Teachers’ Pension Plan expense is included in Other Programs.
Note: Numbers may not add due to rounding.
Sources: Ontario Treasury Board Secretariat and Ontario Ministry of Finance.