Introduction
As of September 2021, employment was 8,600 net jobs above its pre-COVID‑19 level. Most other major economic indicators have recovered to be close to, or even above, pre-COVID‑19 levels. Since the beginning of the pandemic, the Province has stepped forward with unprecedented support to protect people’s health and the economy. For more information on further actions being taken by Ontario, see Chapter 1: Build Ontario.
Ontario’s real gross domestic product (GDP) is projected to rise 4.3 per cent in 2021, 4.5 per cent in 2022, 2.6 per cent in 2023 and 2.0 per cent in 2024. For the purposes of prudent fiscal planning, these projections were set slightly below the average of private‐sector forecasts.
| 2020 | 2021p | 2022p | 2023p | 2024p | |
|---|---|---|---|---|---|
| Real GDP Growth | (5.1) | 4.3 | 4.5 | 2.6 | 2.0 |
| Nominal GDP Growth | (4.6) | 9.0 | 6.6 | 4.6 | 4.1 |
| Employment Growth | (4.8) | 4.3 | 3.3 | 2.0 | 1.5 |
| CPI Inflation | 0.7 | 3.1 | 2.6 | 2.1 | 1.9 |
Table 2.1 footnotes:
p = Ontario Ministry of Finance planning projection based on external sources.
Sources: Statistics Canada and Ontario Ministry of Finance.
Recent Economic Performance
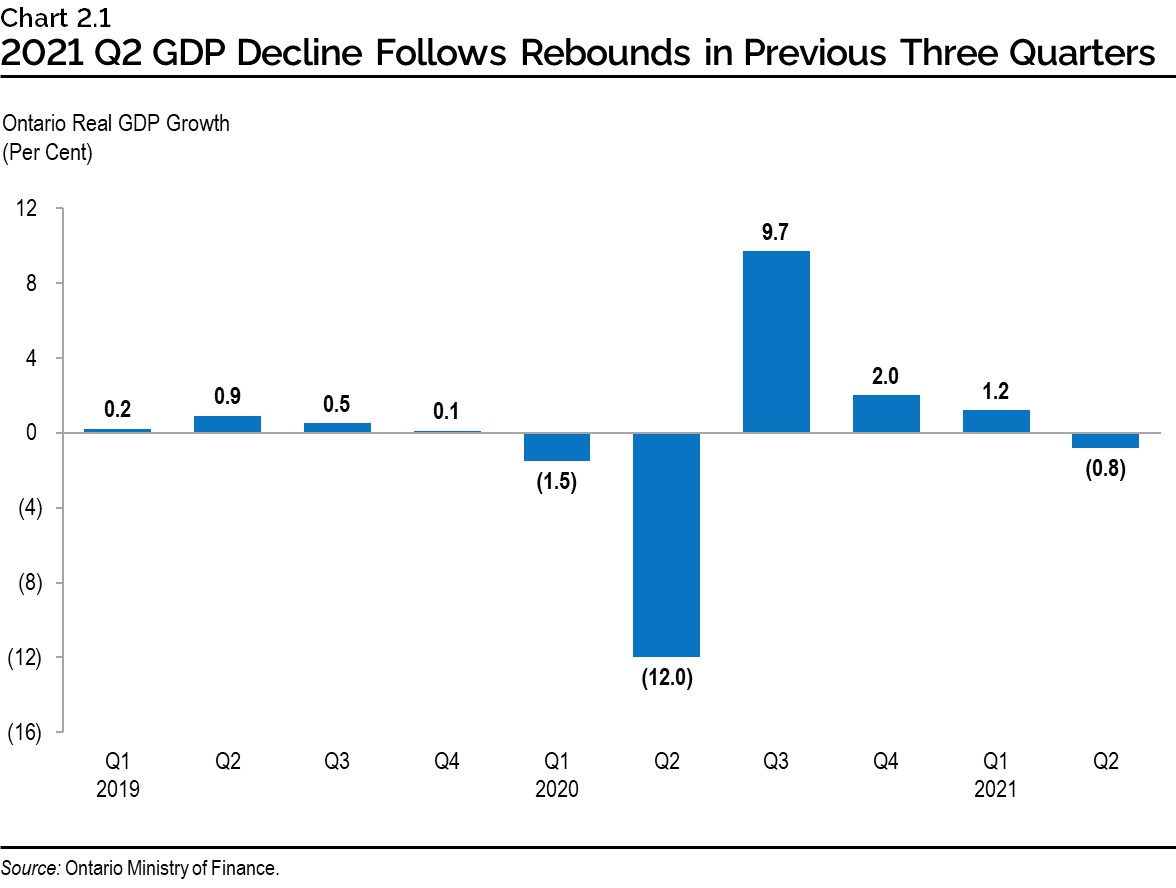
Economies around the world, including Canada’s, have experienced a significant rebound from the unprecedented impacts of the COVID‑19 pandemic. Following three consecutive quarterly increases, Canadian real GDP unexpectedly declined in the second quarter of 2021 by 0.3 per cent, as the country experienced the third wave of the pandemic and exports were affected by ongoing supply chain disruptions. Ontario’s real GDP decreased by 0.8 per cent in the second quarter of 2021, following a 1.2 per cent increase in the first quarter, largely driven by lower exports and housing activity. As of the second quarter, Ontario’s real GDP was 2.5 per cent below the pre-pandemic level.
Recovery in Employment
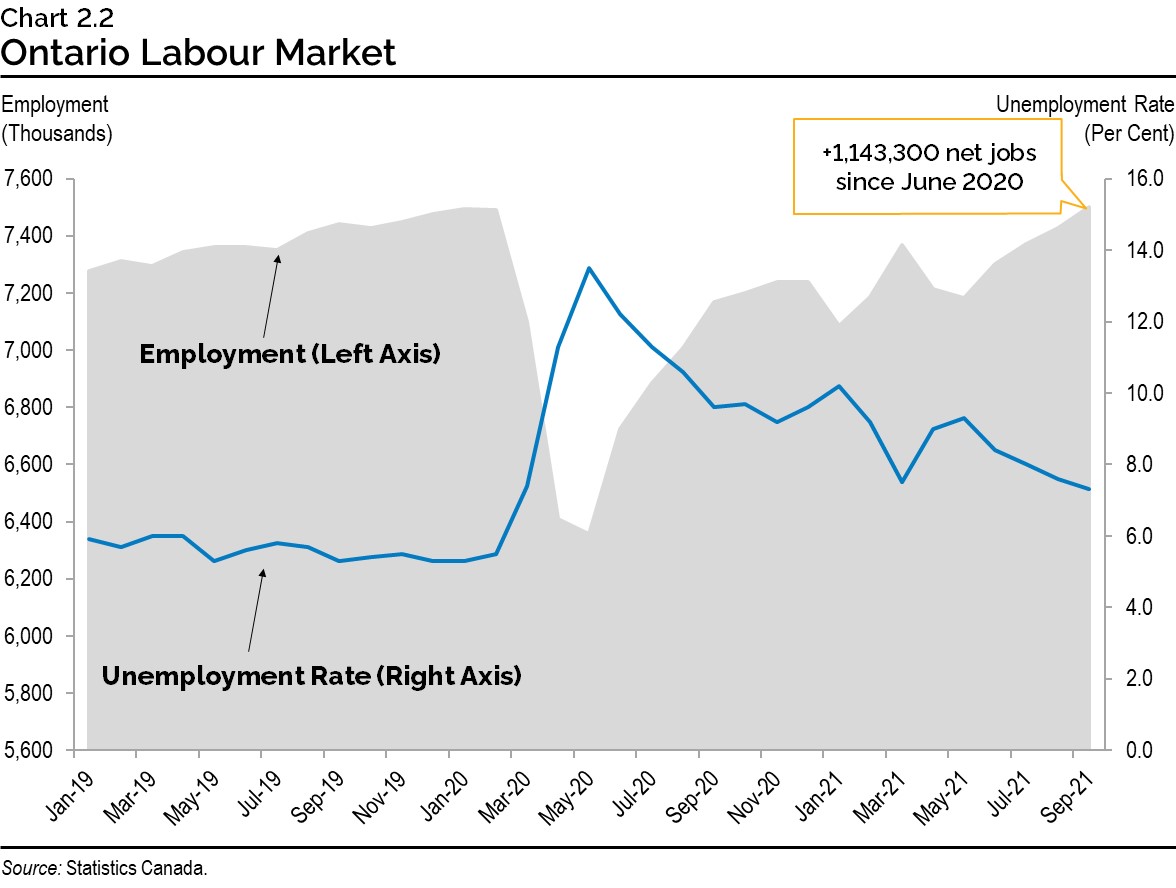
Between May and September 2021, the province added a total of 315,900 net jobs reflecting the reopening of the economy. Employment has increased by over 1.1 million net jobs since June 2020 and has recovered to 8,600 net jobs or 0.1 per cent above the February 2020 pre-pandemic level. Ontario’s employment recovery has exceeded that of Canada and the United States relative to the pre-pandemic level. Ontario’s unemployment rate of 7.3 per cent in September is still elevated compared to the pre-recession rate of 5.5 per cent in February 2020, as labour force growth has outpaced employment growth.
Rebound in Key Ontario Economic Indicators
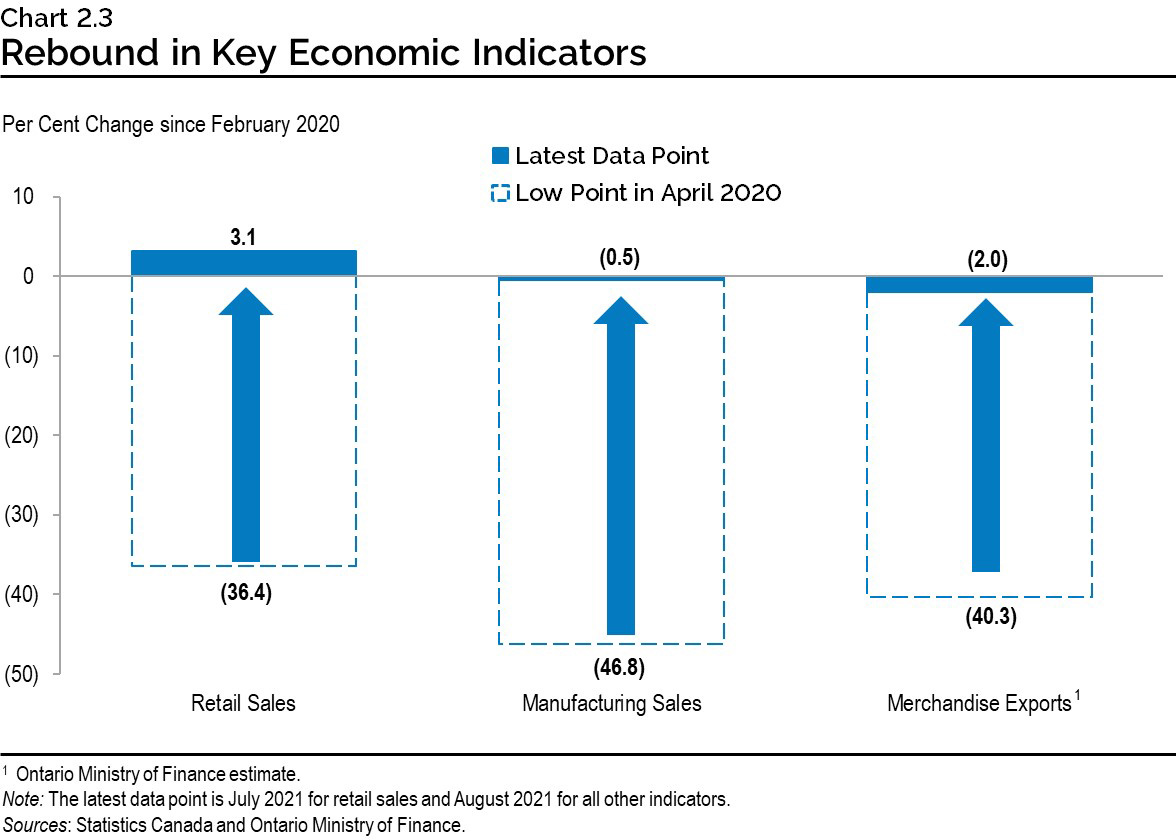
Key economic indicators such as retail and manufacturing sales and merchandise exports have also rebounded significantly, but the recovery has been uneven. Strength in the first quarter of 2021 was followed by challenges during the second quarter, which coincided with the third wave of the pandemic and global supply chain disruptions. As of the most recent data available, retail sales are now above their pre-pandemic level, while manufacturing sales and merchandise exports are close to pre-pandemic levels.
Economic Outlook
The Ontario Ministry of Finance regularly consults with private-sector economists and continually tracks their forecasts to inform the government’s planning assumptions. Private-sector economists are projecting that Ontario’s economy will grow over the next four years.
On August 31, 2021, Statistics Canada released data that reported an unexpected decline in Canada’s real GDP in the second quarter of 2021. The weaker-than-expected second quarter results led private-sector forecasters to revise their outlook for 2021 Ontario real GDP growth substantially lower. Among the private-sector forecasts that have been updated since August 31, the average of projected real GDP growth for 2021 is 4.6 per cent, with forecasts ranging from 4.3 per cent to 5.0 per cent. For prudent fiscal planning purposes, the Ontario Ministry of Finance’s real GDP growth projections are set below the average of private-sector forecasts in each year of the projection period. For 2021, the planning assumption for real GDP growth is 4.3 per cent, 0.3 percentage points below the average of forecasts updated since August 31, 2021.
| 2021 | 2022 | 2023 | 2024 | |
|---|---|---|---|---|
| Quantitative Economic Decisions, Inc. (July) | 7.2 | 4.1 | 2.7 | 2.5 |
| The Conference Board of Canada (August) | 6.7 | 4.1 | 1.1 | 1.5 |
| Stokes Economics (August) | 5.1 | 4.9 | 2.3 | 1.8 |
| Central 1 Credit Union (September) | 4.3 | 4.9 | 2.7 | – |
| CIBC Capital Markets (September) | 4.6 | 4.3 | 2.9 | – |
| Desjardins Group (September) | 4.5 | 4.2 | 2.5 | 2.0 |
| Laurentian Bank Securities (September) | 4.5 | 4.8 | 3.7 | – |
| National Bank of Canada (September) | 4.8 | 4.2 | – | – |
| Royal Bank of Canada (September) | 5.0 | 4.5 | – | – |
| Scotiabank (September) | 4.3 | 4.0 | 3.1 | – |
| TD Bank Group (September) | 4.4 | 5.0 | 2.8 | – |
| University of Toronto (September) | 4.8 | 5.3 | 3.3 | 2.7 |
| BMO Capital Markets (October) | 4.5 | 4.9 | – | – |
| Private-Sector Survey Average | 5.0 | 4.6 | 2.7 | 2.1 |
| Ontario’s Planning Assumption | 4.3 | 4.5 | 2.6 | 2.0 |
Table 2.2 footnotes:
Sources: Ontario Ministry of Finance Survey of Forecasters (October 1, 2021) and Ontario Ministry of Finance.
The Ministry of Finance’s real GDP planning projection incorporates a moderate degree of prudence due to continued economic risks related to the pandemic. Additional risk exists around the outlook for nominal GDP in 2021 related to uncertainty around GDP inflation. Among private-sector forecasts that have been updated since August 31, the average projected nominal GDP growth for 2021 is 10.1 per cent, with forecasts ranging from 8.7 per cent to 12.2 per cent. For prudent fiscal planning purposes, the Ontario Ministry of Finance’s nominal GDP growth projections are set below the average of private-sector forecasts in each year of the projection period. For 2021, the planning assumption for nominal GDP growth is 9.0 per cent, 1.1 percentage points below the average of forecasts updated since August 31, 2021, to reflect the relatively higher degree of uncertainty around the nominal GDP forecast.
| 2021 | 2022 | 2023 | 2024 | |
|---|---|---|---|---|
| Quantitative Economic Decisions, Inc. (July) | 12.0 | 6.9 | 5.4 | 5.1 |
| The Conference Board of Canada (August) | 12.9 | 5.7 | 2.5 | 3.3 |
| Stokes Economics (August) | 9.0 | 6.7 | 3.9 | 3.3 |
| Central 1 Credit Union (September) | 9.0 | 7.5 | 4.8 | – |
| CIBC Capital Markets (September) | 9.6 | 5.6 | 4.2 | – |
| Desjardins Group (September) | 9.8 | 6.4 | – | – |
| Laurentian Bank Securities (September) | 12.2 | 7.8 | 5.6 | – |
| National Bank of Canada (September) | 8.7 | 5.2 | – | – |
| Royal Bank of Canada (September) | 10.1 | 6.7 | – | – |
| Scotiabank (September) | 11.1 | 6.1 | 5.6 | – |
| TD Bank Group (September) | 9.9 | 7.9 | 4.8 | – |
| University of Toronto (September) | 11.5 | 7.1 | 5.5 | 4.9 |
| BMO Capital Markets (October) | 9.5 | 7.2 | – | – |
| Private-Sector Survey Average | 10.4 | 6.7 | 4.7 | 4.2 |
| Ontario’s Planning Assumption | 9.0 | 6.6 | 4.6 | 4.1 |
Table 2.3 footnotes:
Sources: Ontario Ministry of Finance Survey of Forecasters (October 1, 2021) and Ontario Ministry of Finance.
Since 1992, the year after the Bank of Canada adopted a two per cent Consumer Price Index (CPI) inflation target, Ontario GDP inflation has averaged 1.5 per cent annually and remained relatively stable with modest fluctuations over this period between a low of 0.4 per cent in 1992, and a high of 3.3 per cent in 2007. In 2021, the average of recently updated private-sector forecasts for GDP inflation is 5.5 per cent. This growth is significantly higher than the average historical experience and would be the fastest pace of GDP inflation since 1988.
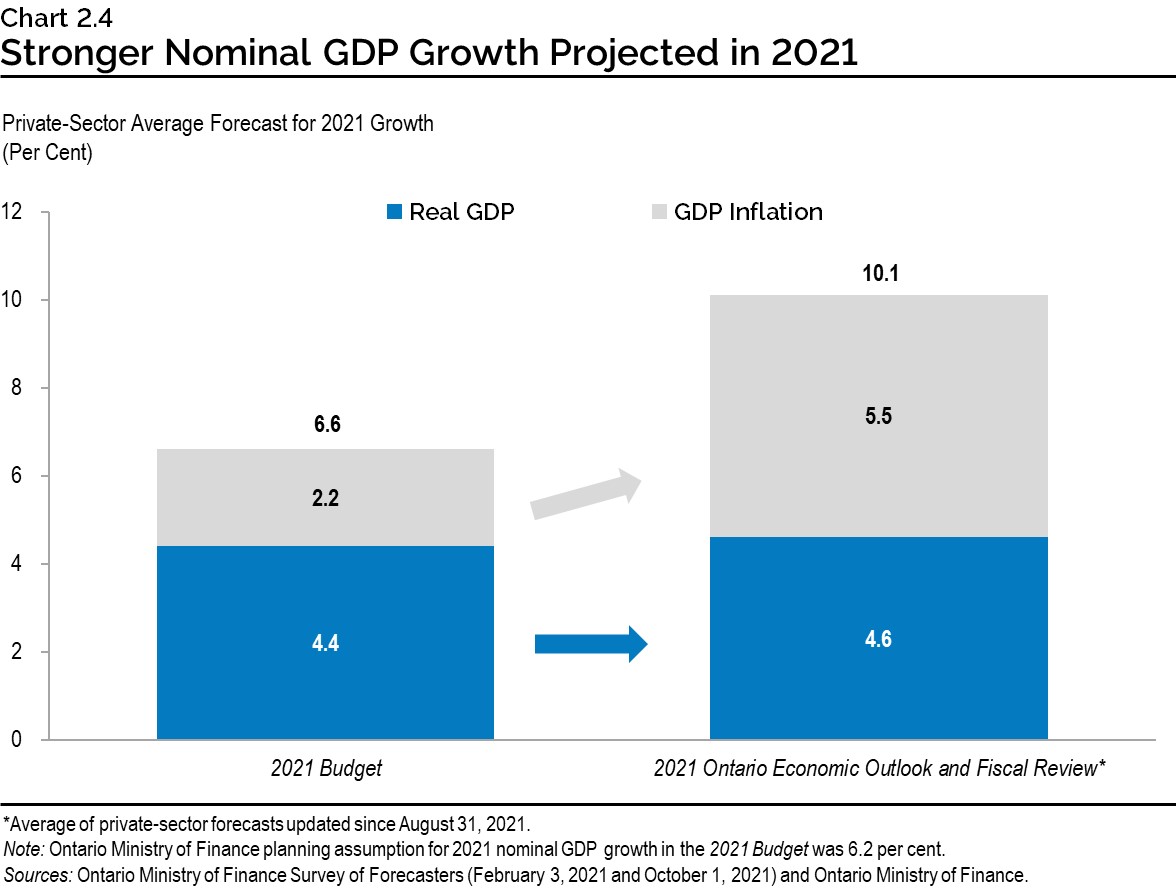
Since the time of the 2021 Budget, private-sector expectations for 2021 real GDP growth have risen modestly, while expectations for GDP inflation have risen much more sharply and contributed significantly to a large upward revision to 2021 nominal GDP growth expectations. At the time of the 2021 Budget, the private-sector average for 2021 real GDP growth was 4.4 per cent and for nominal GDP growth it was 6.6 per cent. The current average of recently updated forecasts is for 2021 real GDP growth of 4.6 per cent, a 0.2 percentage point increase compared to the 2021 Budget. However, the current average of recently updated forecasts is for 2021 nominal GDP growth of 10.1 per cent, a 3.5 percentage point increase compared to the 2021 Budget. The revision to the 2021 nominal GDP outlook is significant as it provides a broad measure of growth expected in the provincial tax base.
GDP inflation is the main factor contributing to the upward revision to the private-sector average of recently updated forecasts for 2021 nominal GDP growth. This stronger GDP inflation reflects economy-wide price increases, including for business investment, consumption and exports.
Global Economic Environment
Global economic growth expectations have improved since the beginning of the year as COVID‑19 vaccinations continue to progress, accompanied by the easing of public health restrictions. According to the International Monetary Fund, world real GDP is forecast to grow 5.9 per cent in 2021, followed by 4.9 per cent growth in 2022.
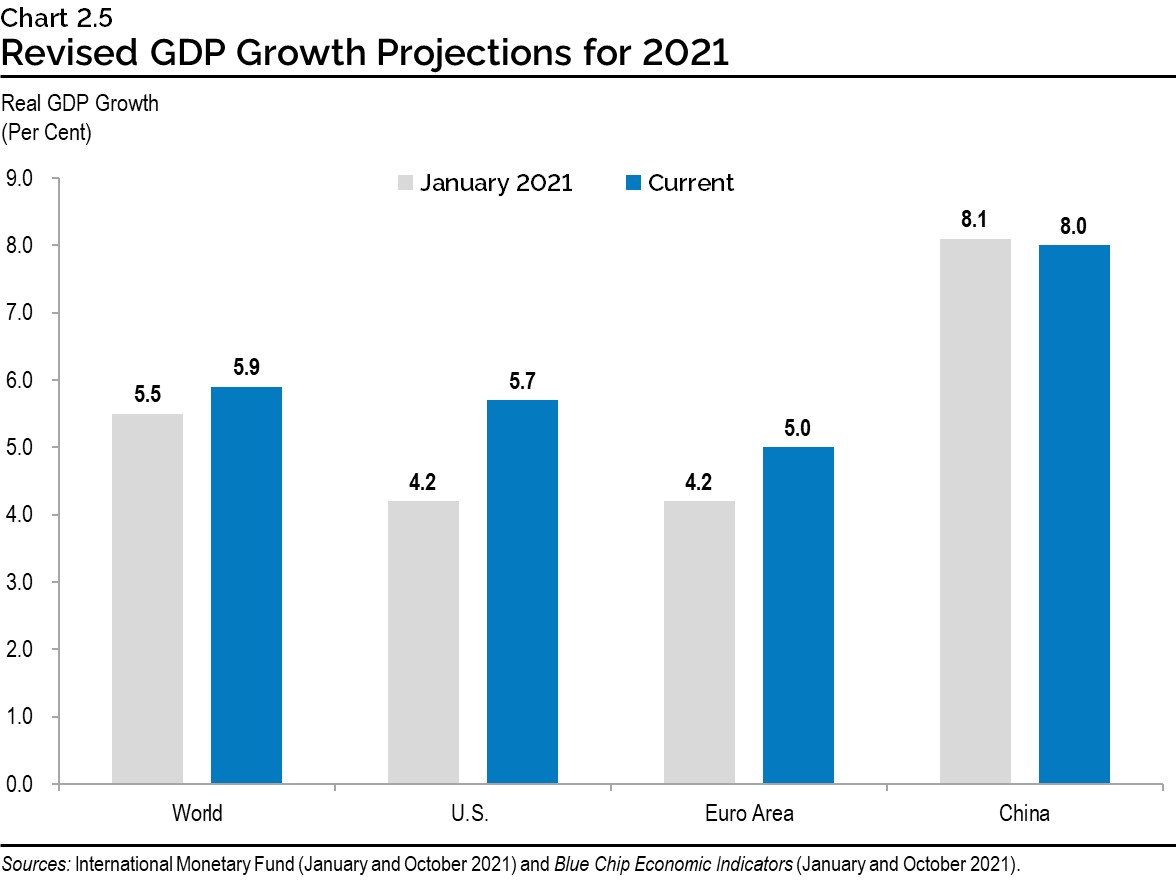
The U.S. economic recovery has been robust, with real GDP exceeding its pre-pandemic level in the second quarter of 2021. U.S. real GDP is expected to grow 5.7 per cent in 2021 and 4.1 per cent in 2022. Euro area real GDP growth is expected to be 5.0 per cent in 2021 and 4.3 per cent in 2022. China’s real GDP is projected to rise 8.0 per cent in 2021, before moderating to a 5.6 per cent increase in 2022.
Key central banks have continued to support economic recovery by maintaining accommodative monetary policies, including low policy interest rates and quantitative easing. Recent improvements in economic growth as well as rising inflation have raised expectations that central banks will begin tightening monetary policies.
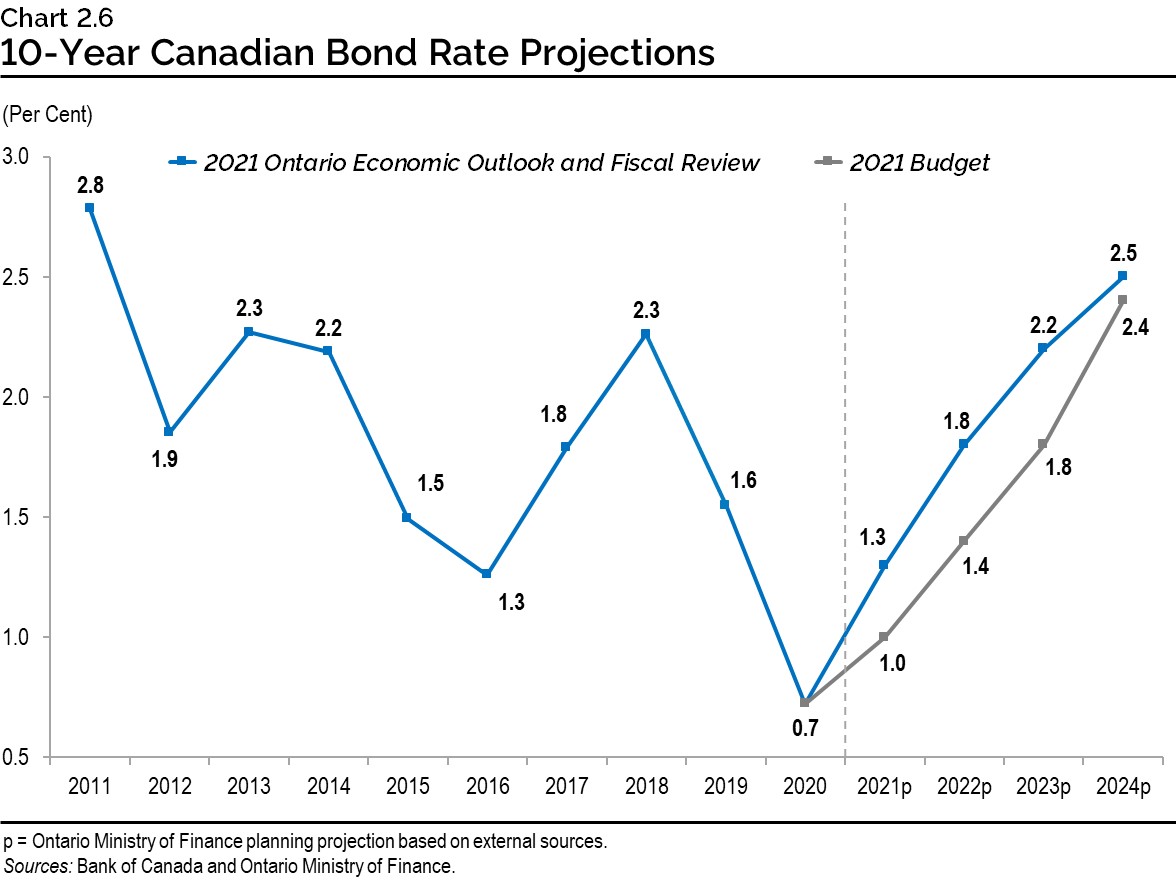
Several central banks have begun to signal a slowing of their asset purchase programs in the near future and that policy interest rates may increase in 2022 as economic activity normalizes. As central banks begin to increase their policy interest rates, government bond rates are expected to trend upwards. The Canadian three-month treasury bill rate is expected to rise from 0.1 per cent in 2021 to 1.3 per cent by 2024. Similarly, the Canadian 10-year government bond rate is expected to rise from 1.3 per cent in 2021 to 2.5 per cent by 2024. Projected bond rates are slightly higher than at the time of the 2021 Budget, reflecting stronger economic growth and higher price inflation.
Strong global demand and tight supply conditions have supported an increase in West Texas Intermediate (WTI) crude oil prices, which are forecast to rise from an annual average of US$39 per barrel in 2020 to an average of about US$65 per barrel over the 2021 to 2024 period. The Canadian dollar is expected to average just over 80 cents US over the projection period.
| 2020 | 2021p | 2022p | 2023p | 2024p | |
|---|---|---|---|---|---|
| World Real GDP Growth (Per Cent) | (3.1) | 5.9 | 4.9 | 3.6 | 3.4 |
| U.S. Real GDP Growth (Per Cent) | (3.4) | 5.7 | 4.1 | 2.5 | 2.1 |
| West Texas Intermediate (WTI) Crude Oil ($US per Barrel) | 39 | 65 | 67 | 64 | 63 |
| Canadian Dollar (Cents US) | 74.6 | 80.0 | 80.0 | 80.0 | 80.5 |
| Three-Month Treasury Bill Rate1 (Per Cent) | 0.4 | 0.1 | 0.3 | 0.9 | 1.3 |
| 10-Year Government Bond Rate2 (Per Cent) | 0.7 | 1.3 | 1.8 | 2.2 | 2.5 |
Table 2.4 footnotes:
p = Ontario Ministry of Finance planning projection based on external sources.
[1], [2] Government of Canada interest rates.
Sources: International Monetary Fund World Economic Outlook (October 2021); U.S. Bureau of Economic Analysis; U.S. Energy Information Administration; Bank of Canada; Blue Chip Economic Indicators (October 2021); and Ontario Ministry of Finance Survey of Forecasters.
Details of Ontario’s Economic Outlook
The Ontario Ministry of Finance projects that Ontario real GDP will grow by 4.3 per cent in 2021. Real GDP is then projected to rise by 4.5 per cent in 2022, 2.6 per cent in 2023 and 2.0 per cent in 2024. Table 2.5 provides details of the Ontario Ministry of Finance’s economic outlook over the forecast period.
| 2020 | 2021p | 2022p | 2023p | 2024p | |
|---|---|---|---|---|---|
| Real Gross Domestic Product | (5.1) | 4.3 | 4.5 | 2.6 | 2.0 |
| Nominal Gross Domestic Product | (4.6) | 9.0 | 6.6 | 4.6 | 4.1 |
| Compensation of Employees | (1.5) | 6.3 | 4.7 | 4.7 | 4.1 |
| Net Operating Surplus — Corporations | (7.7) | 30.6 | 9.1 | 1.5 | 3.3 |
| Nominal Household Consumption | (6.0) | 6.2 | 7.6 | 4.8 | 4.3 |
| Other Economic Indicators — Employment | (4.8) | 4.3 | 3.3 | 2.0 | 1.5 |
| Other Economic Indicators — Job Creation (000s) | (355) | 304 | 242 | 151 | 116 |
| Other Economic Indicators — Unemployment Rate (Per Cent) | 9.6 | 8.2 | 6.6 | 6.2 | 6.1 |
| Other Economic Indicators — Consumer Price Index | 0.7 | 3.1 | 2.6 | 2.1 | 1.9 |
| Other Economic Indicators — Housing Starts (000s) | 81.3 | 95.0 | 81.0 | 82.0 | 85.0 |
| Other Economic Indicators — Home Resales | 8.8 | 15.1 | (14.7) | 1.3 | 0.8 |
| Other Economic Indicators — Home Resale Prices | 16.0 | 19.0 | 0.0 | 0.5 | 2.0 |
| Key External Variables — U.S. Real Gross Domestic Product | (3.4) | 5.7 | 4.1 | 2.5 | 2.1 |
| Key External Variables — WTI Crude Oil ($US per Barrel) | 39 | 65 | 67 | 64 | 63 |
| Key External Variables — Canadian Dollar (Cents US) | 74.6 | 80.0 | 80.0 | 80.0 | 80.5 |
| Key External Variables — Three-Month Treasury Bill Rate1 | 0.4 | 0.1 | 0.3 | 0.9 | 1.3 |
| Key External Variables — 10-Year Government Bond Rate2 | 0.7 | 1.3 | 1.8 | 2.2 | 2.5 |
Table 2.5 footnotes:
p = Ontario Ministry of Finance planning projection.
[1], [2] Government of Canada interest rates (per cent).
Sources: Statistics Canada; Canada Mortgage and Housing Corporation; Canadian Real Estate Association; Bank of Canada; United States Bureau of Economic Analysis; Blue Chip Economic Indicators (October 2021); U.S. Energy Information Administration; and Ontario Ministry of Finance.
Employment
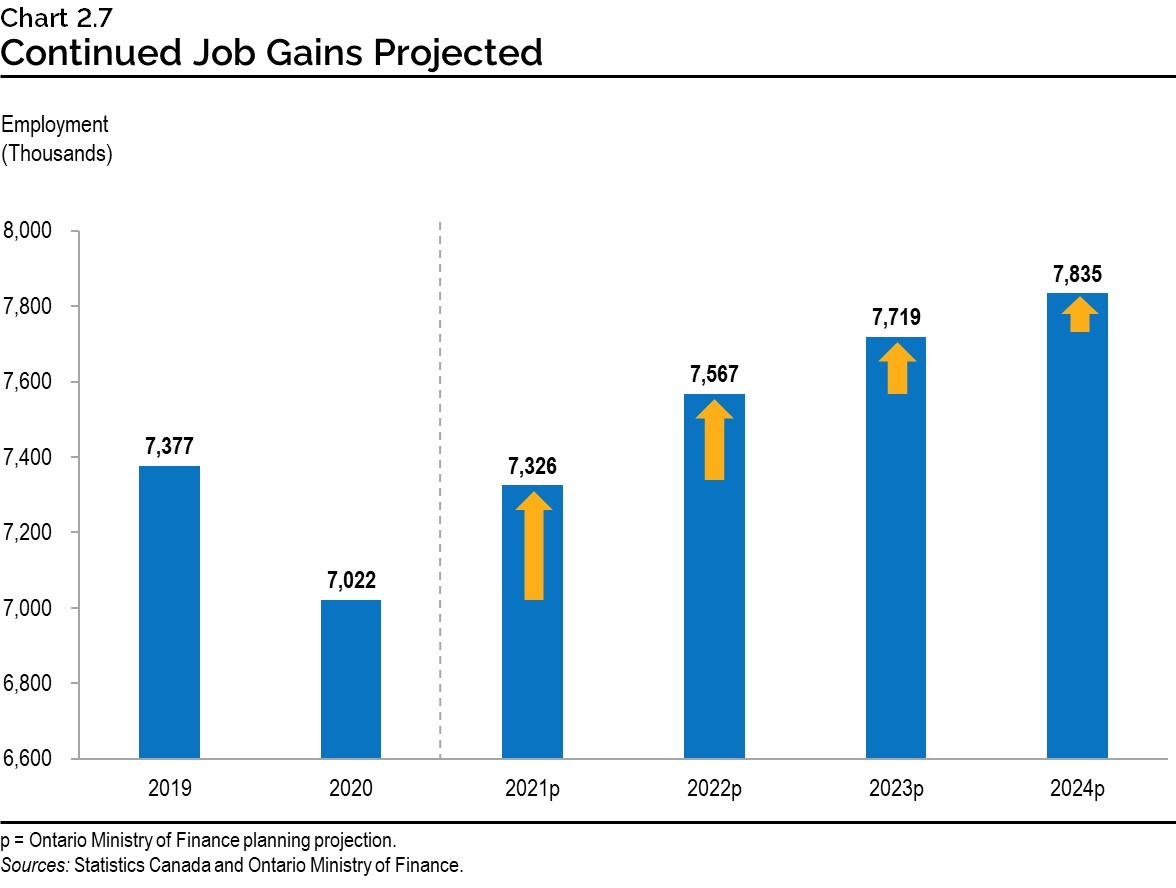
Job creation is expected to continue as economic activity strengthens and business sentiment improves. The level of employment surpassed the pre-pandemic level in September. On an annual basis, more than 300,000 net new jobs are expected in 2021 compared to 2020. Job gains are expected to continue over the projection period, resulting in over half a million more jobs by 2024.
Household Incomes and Spending
Strong gains in employment are projected to support labour and household income growth. Compensation of employees is projected to rise 4.9 per cent on average, annually, over the 2021 to 2024 period. Strong growth in household income is projected to support robust gains in household consumption spending. As well, consumer spending will benefit from high levels of household savings and pent-up demand during the COVID‑19 pandemic. Consumption growth is expected to moderate over time as pent-up demand eases, excess savings are drawn down and interest rates rise. Household consumption spending is projected to rise 5.7 per cent on average, annually, over the projection period.
Consumer Price Inflation
Ontario, like many other jurisdictions, has experienced unusually high CPI inflation in 2021. This, in part, reflects prices rebounding for goods and services that experienced a decline during the initial stages of the pandemic. For example, after declining for most of 2020, gasoline prices have rebounded as demand returned and oil supply remained tight, contributing close to one percentage point to year-over-year CPI inflation for much of 2021.
Global supply chain disruptions have also driven prices for some goods higher. For example, the global shortage of semiconductor chips contributed to higher vehicle prices, and supply chain bottlenecks put upward pressure on costs for household appliances. There is considerable uncertainty around how long these supply chain issues will persist, but these price pressures, along with other factors, are expected to ease over time.
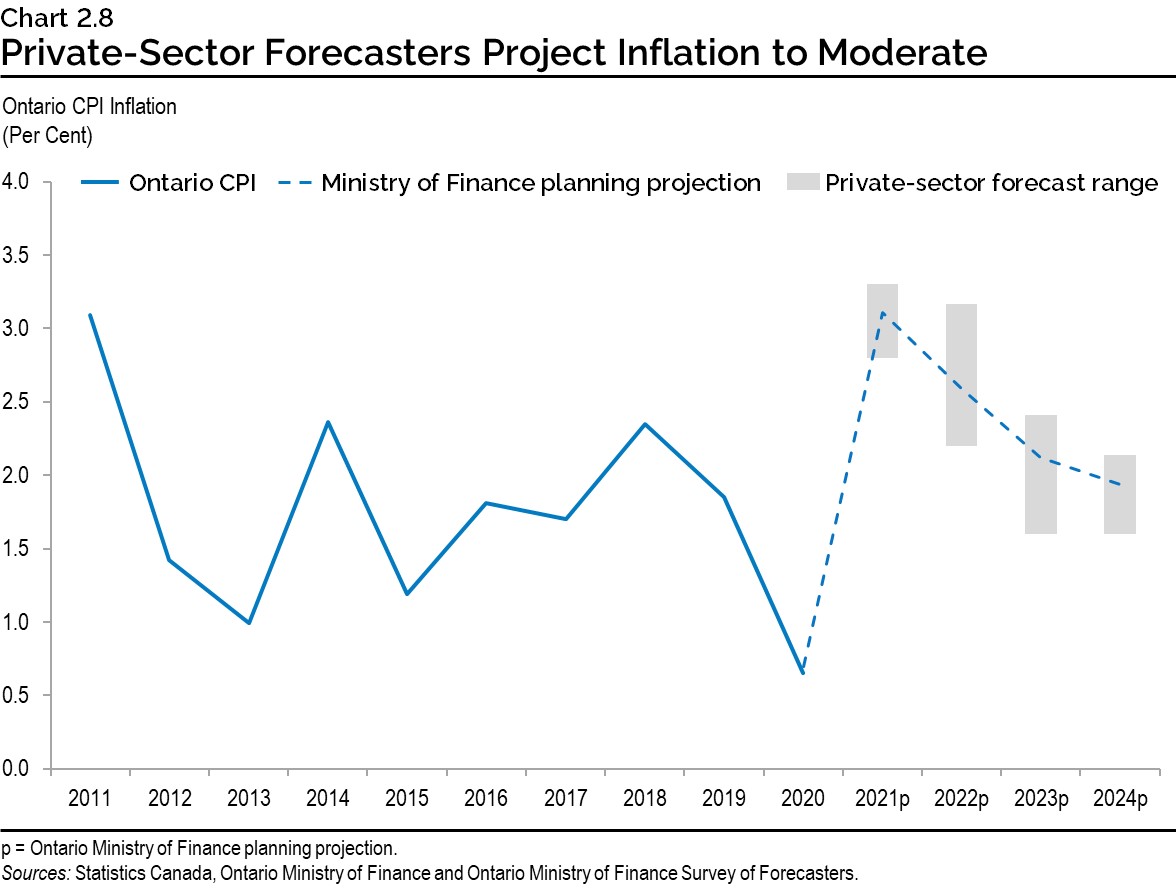
CPI inflation is projected to ease from 3.1 per cent in 2021 to 2.6 per cent in 2022 and is projected to return close to the Bank of Canada’s inflation target of 2.0 per cent in 2023 and 2024. There are a range of views on inflation, but private-sector economists, on average, expect inflation to slow to around 2.0 per cent in 2023 and 2024. Similarly, investors expect inflation to be below 2.0 per cent over the long term, which is implied by the difference in current real and nominal Canadian government bond yields. The Ontario Ministry of Finance will continue to closely monitor inflation given the current uncertainty, as well as the potential impact on the province’s finances and economy.
Housing
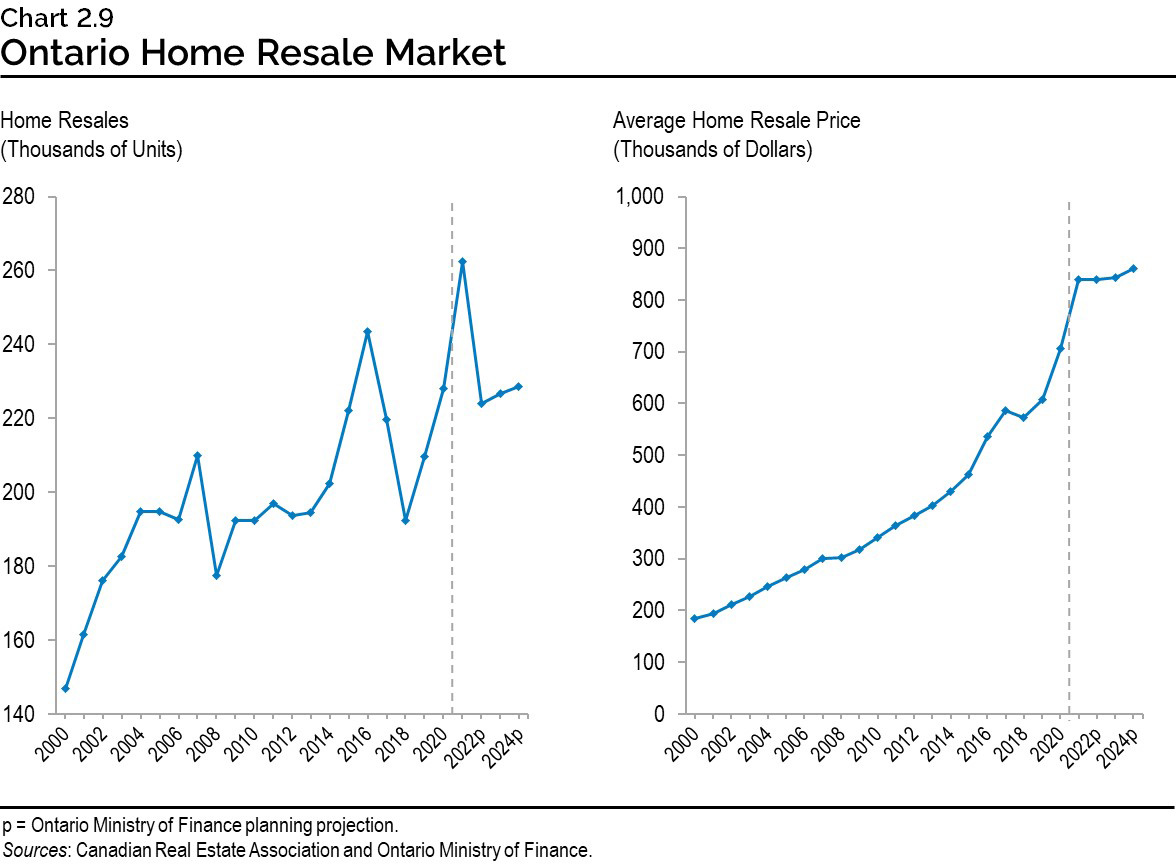
Strong demand for housing supported by low interest rates, higher overall disposable incomes, limited resale listings and shifting home preferences contributed to rising home resales and prices in Ontario over the last year. By March 2021, home resales reached a record high. Activity in the housing market subsequently moderated, with home resales declining 33.3 per cent by September from the March peak. The average home resale price has increased strongly since the start of the pandemic. By September 2021, the average home resale price in Ontario was 31.4 per cent higher than the February 2020 pre-pandemic level.
Strong momentum early in the year is expected to contribute to a 15.1 per cent rise in annual home resales in 2021. Sales are projected to decline 14.7 per cent in 2022, as activity is expected to return to levels consistent with fundamental drivers of housing demand, such as population growth. The average home resale price is expected to increase 19.0 per cent in 2021, before moderating over the 2022 to 2024 period.
Risks to the Outlook
The COVID‑19 pandemic remains a significant source of uncertainty for the global economy. Despite rising vaccination rates, the future path of the pandemic globally remains uncertain due to risks around the emergence of new variants of the virus.
Central banks around the world continue to pursue accommodative monetary policies to help support the economic recovery. Several central banks have begun to signal future tightening of monetary policy. Based on recent statements, the U.S. Federal Reserve, the European Central Bank and the Bank of Canada continue to view current higher inflation as temporary. If high inflation proves to be more persistent, there is a risk that central banks will react by tightening monetary policy more quickly than expected, which may slow economic growth.
As a result of the pandemic, significant challenges have emerged in supply chains around the world, leading to shipping delays and rising costs. For example, difficulties in sourcing semiconductors have led to significant production disruptions in the auto industry. A worsening of these conditions could result in further production disruptions.
Lower than expected growth in the United States, as suggested by some recent indicators, is a downside risk for the Ontario economy. However, more robust U.S. economic growth as a result of COVID‑19 infections receding or significant new U.S. fiscal stimulus would support stronger U.S. demand, which could boost Ontario’s exports and economic growth.
Table 2.6 displays current estimates of the impact of sustained changes in key external factors on Ontario’s real GDP, assuming other external factors are unchanged. The relatively wide range of estimated impacts reflects the uncertainty regarding how the economy could respond to these changes in external conditions.
| Change in Real GDP Growth First Year |
Change in Real GDP Growth Second Year |
|
|---|---|---|
| Canadian Dollar Depreciates by Five Cents US | +0.1 to +0.7 | +0.2 to +0.8 |
| Crude Oil Prices Decrease by $10 US per Barrel | +0.1 to +0.3 | +0.1 to +0.3 |
| U.S. Real GDP Growth Increases by One Percentage Point | +0.2 to +0.6 | +0.3 to +0.7 |
| Canadian Interest Rates Increase by One Percentage Point | (0.1) to (0.5) | (0.2) to (0.6) |
Table 2.6 footnotes:
Source: Ontario Ministry of Finance.
Revisions to the Outlook Since the 2021 Budget
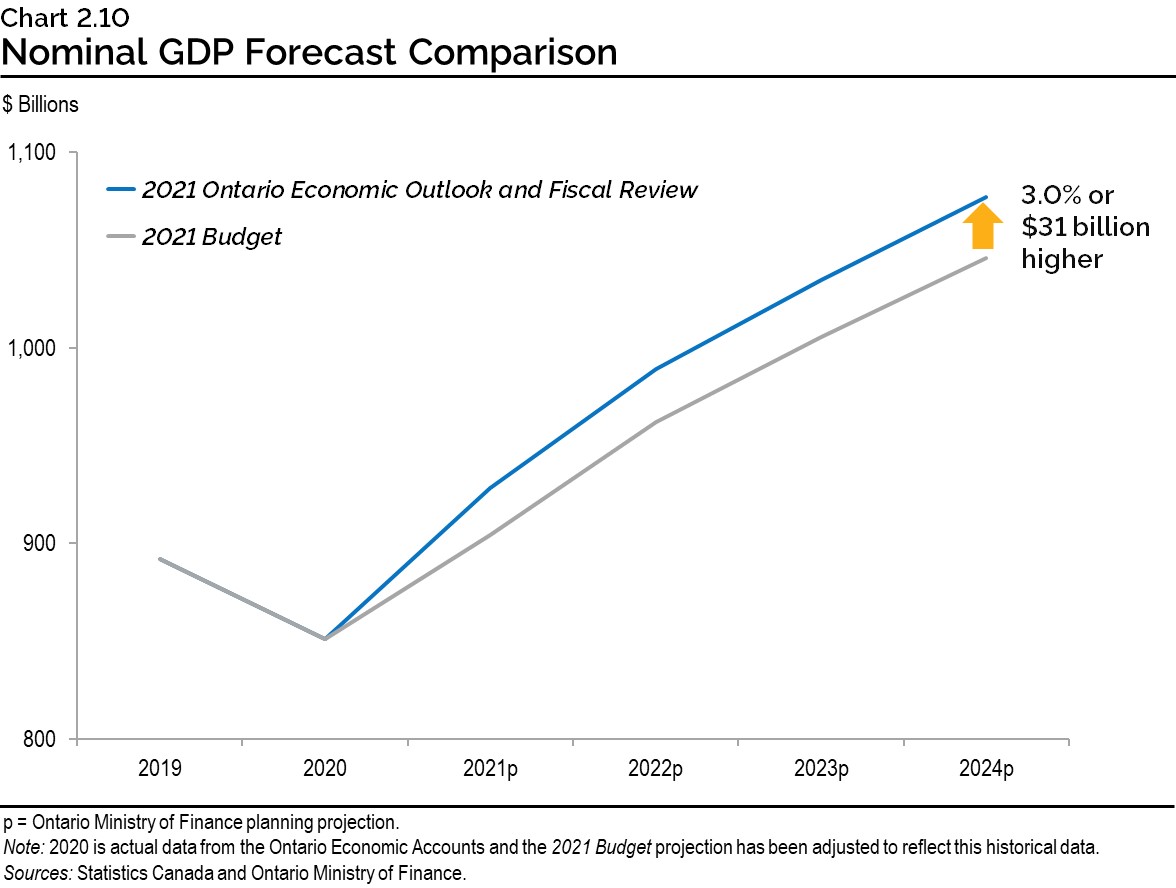
The most significant revision to the outlook since the 2021 Budget is the projection for nominal GDP. The 2021 Budget projected that between 2021 and 2024, Ontario nominal GDP would rise by 23 per cent. The current planning projection assumes that nominal GDP will rise by 27 per cent over the same period. By 2024, nominal GDP is projected to be 3.0 per cent or $31 billion higher than was projected in the 2021 Budget.
Ontario’s real GDP decreased 5.1 per cent in 2020, less than the projected decline of 5.7 per cent in the 2021 Budget. Real GDP is projected to rise 4.3 per cent in 2021, a larger increase than the 4.0 per cent projected in the 2021 Budget. The outlook over the 2022 to 2024 period has been revised modestly higher compared to the projections in the 2021 Budget.
Other key changes since the 2021 Budget include:
- Stronger growth in the corporate net operating surplus in 2021 and 2022, followed by slower growth in 2023 and 2024;
- Faster CPI inflation between 2021 and 2023; and
- Stronger resale housing activity in 2021, followed by resales returning to normal levels in 2022.
| 2021p — 2021 Budget |
2021p — 2021 FES |
2022p — 2021 Budget |
2022p — 2021 FES |
2023p — 2021 Budget |
2023p — 2021 FES |
2024p — 2021 Budget |
2024p — 2021 FES |
|
|---|---|---|---|---|---|---|---|---|
| Real Gross Domestic Product | 4.0 | 4.3 | 4.3 | 4.5 | 2.5 | 2.6 | 2.0 | 2.0 |
| Nominal Gross Domestic Product | 6.2 | 9.0 | 6.4 | 6.6 | 4.5 | 4.6 | 4.0 | 4.1 |
| Compensation of Employees | 4.2 | 6.3 | 5.0 | 4.7 | 4.8 | 4.7 | 4.1 | 4.1 |
| Net Operating Surplus — Corporations | 8.0 | 30.6 | 7.4 | 9.1 | 4.4 | 1.5 | 4.2 | 3.3 |
| Nominal Household Consumption | 5.9 | 6.2 | 7.2 | 7.6 | 4.9 | 4.8 | 4.2 | 4.3 |
| Other Economic Indicators — Employment | 4.2 | 4.3 | 3.0 | 3.3 | 2.2 | 2.0 | 1.6 | 1.5 |
| Other Economic Indicators — Job Creation (000s) | 298 | 304 | 222 | 242 | 168 | 151 | 124 | 116 |
| Other Economic Indicators — Unemployment Rate (Per Cent) | 8.2 | 8.2 | 6.9 | 6.6 | 6.5 | 6.2 | 6.3 | 6.1 |
| Other Economic Indicators — Consumer Price Index | 1.7 | 3.1 | 2.0 | 2.6 | 2.0 | 2.1 | 2.0 | 1.9 |
| Other Economic Indicators — Housing Starts (000s) | 80.2 | 95.0 | 79.3 | 81.0 | 80.2 | 82.0 | 81.2 | 85.0 |
| Other Economic Indicators — Home Resales | 5.5 | 15.1 | (6.7) | (14.7) | 1.3 | 1.3 | 0.8 | 0.8 |
| Other Economic Indicators — Home Resale Prices | 7.5 | 19.0 | 0.0 | 0.0 | 0.5 | 0.5 | 2.0 | 2.0 |
| Key External Variables — U.S. Real Gross Domestic Product | 4.9 | 5.7 | 3.8 | 4.1 | 2.3 | 2.5 | 2.1 | 2.1 |
| Key External Variables — WTI Crude Oil ($US per Barrel) | 47 | 65 | 52 | 67 | 56 | 64 | 57 | 63 |
| Key External Variables — Canadian Dollar (Cents US) | 78.5 | 80.0 | 78.5 | 80.0 | 79.2 | 80.0 | 80.2 | 80.5 |
| Key External Variables — Three-Month Treasury Bill Rate1 | 0.2 | 0.1 | 0.2 | 0.3 | 0.5 | 0.9 | 1.1 | 1.3 |
| Key External Variables — 10-Year Government Bond Rate2 | 1.0 | 1.3 | 1.4 | 1.8 | 1.8 | 2.2 | 2.4 | 2.5 |
Table 2.7 footnotes:
p = Ontario Ministry of Finance planning projection.
[1], [2] Government of Canada interest rates (per cent).
Sources: Statistics Canada; Canada Mortgage and Housing Corporation; Canadian Real Estate Association; Bank of Canada; United States Bureau of Economic Analysis; Blue Chip Economic Indicators (October 2021); U.S. Energy Information Administration; and Ontario Ministry of Finance.
Economic Outlook Scenarios
While the planning assumptions for economic growth are reasonable and prudent based on available private-sector forecasts, there are a broad range of factors that could result in economic growth being relatively stronger or weaker. In the 2020 Budget, Ontario was one of the first governments in the country to provide economic scenarios in response to the uncertainty as a result of the COVID‑19 pandemic. Given the high degree of economic uncertainty, the Ontario Ministry of Finance has again developed Faster Growth and Slower Growth scenarios that the economy could take over the next several years to provide more transparency about the province’s economic outlook. These alternative scenarios should not be considered the best case or the worst case. Rather, they represent possible outcomes in this period of heightened uncertainty.
| 2021p | 2022p | 2023p | 2024p | |
|---|---|---|---|---|
| Faster Growth Scenario | 4.9 | 6.0 | 2.9 | 2.3 |
| Planning Projection | 4.3 | 4.5 | 2.6 | 2.0 |
| Slower Growth Scenario | 4.0 | 3.2 | 2.5 | 1.9 |
Table 2.8 footnotes:
p = Ontario Ministry of Finance planning projection and alternative scenarios.
Source: Ontario Ministry of Finance.
In the Planning Projection and the Slower Growth scenario, the level of real GDP surpasses its pre-pandemic level of the fourth quarter of 2019 in the first quarter of 2022. In the Faster Growth scenario, the pre-pandemic level of real GDP is reached in the fourth quarter of 2021. By the year 2024, the level of real GDP in the Faster Growth scenario is 2.6 per cent higher than in the Planning Projection, while in the Slower Growth scenario the level of real GDP is 1.7 per cent lower. To reflect the additional uncertainty related to the nominal GDP outlook, Faster Growth and Slower Growth scenarios are also presented for nominal GDP growth. These scenarios show a wider range over the next several years compared to real GDP scenarios due to heightened uncertainty around GDP inflation.
| 2021p | 2022p | 2023p | 2024p | |
|---|---|---|---|---|
| Faster Growth Scenario | 10.7 | 8.4 | 5.1 | 4.6 |
| Planning Projection | 9.0 | 6.6 | 4.6 | 4.1 |
| Slower Growth Scenario | 8.4 | 5.0 | 4.3 | 3.8 |
Table 2.9 footnotes:
p = Ontario Ministry of Finance planning projection and alternative scenarios.
Source: Ontario Ministry of Finance.
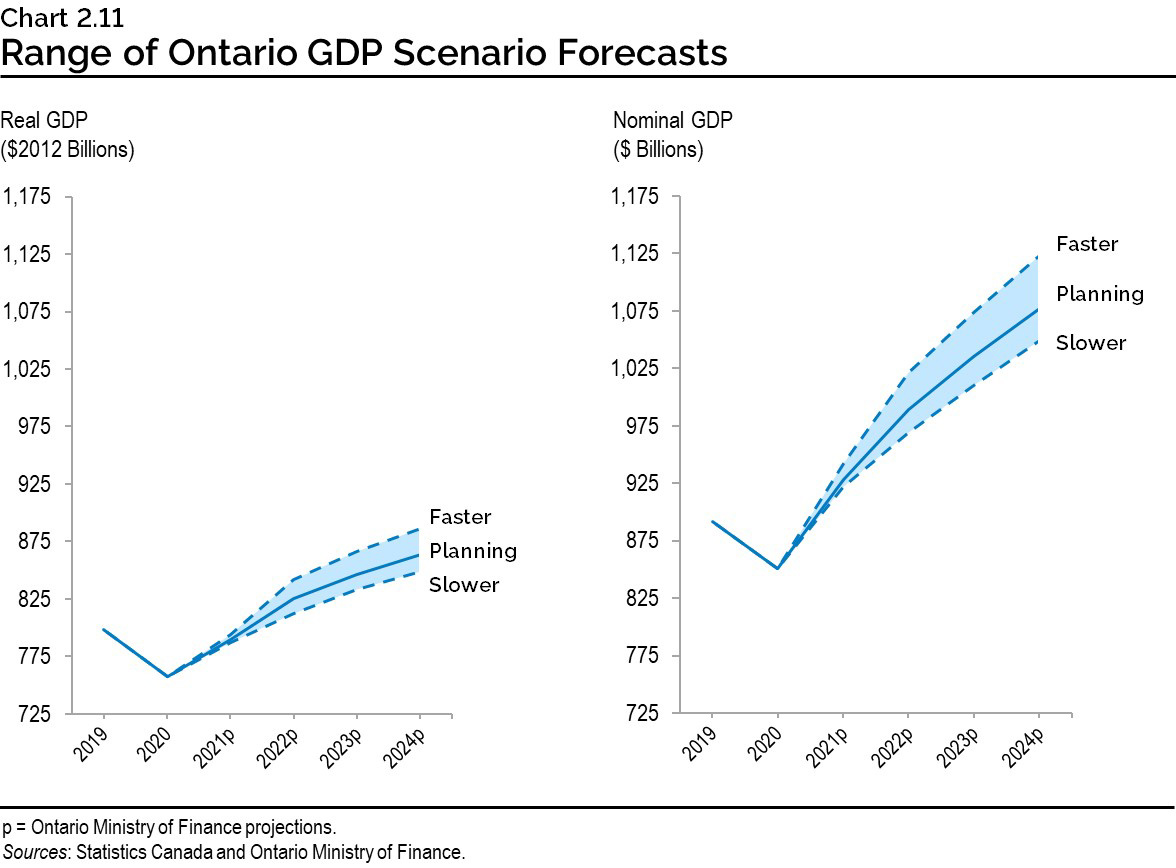
Chart Descriptions
Chart 2.1: 2021 Q2 GDP Decline Follows Rebounds in Previous Three Quarters
This bar chart illustrates the quarterly real gross domestic product growth in Ontario from the first quarter of 2019 to the second quarter of 2021. Real gross domestic product growth is as follows: 0.2 per cent in 2019 Q1; 0.9 per cent in 2019 Q2; 0.5 per cent in 2019 Q3; 0.1 per cent in 2019 Q4; (–1.5 per cent) in 2020 Q1; (–12.0 per cent) in 2020 Q2; 9.7 per cent in 2020 Q3; 2.0 per cent in 2020 Q4; 1.2 per cent in 2021 Q1 and (–0.8 per cent) in 2021 Q2.
Source: Ontario Ministry of Finance.
Chart 2.2: Ontario Labour Market
The chart shows Ontario’s monthly employment level as a shaded area and unemployment rate as a line from January 2019 to September 2021. The unemployment rate trended down from 5.9 per cent in early 2019 to 5.5 per cent in February 2020. It increased to 13.5 per cent in May 2020 and has since trended down to 9.2 per cent in November 2020, before increasing to 10.2 per cent in January 2021 and has since declined to 7.3 per cent in September 2021. Employment increased from about 7.3 million in January 2019 to about 7.5 million in February 2020; it then declined to 6.4 million in May 2020. In December 2020, employment increased to 7.2 million before declining to 7.1 million in January 2021 and increasing to 7.4 million in March 2021. Employment then declined to 7.2 million in May 2021 and has since increased to 7.5 million in September 2021. There is a callout box that states +1,143,300 net jobs since June 2020.
Source: Statistics Canada.
Chart 2.3: Rebound in Key Economic Indicators
This chart illustrates the per cent change in key economic indicators between February 2020 and the latest data point as solid bars and between February 2020 and the 2020 low as dashed bars. Changes from February 2020 are as follows: Retail sales were 36.4 per cent lower in April 2020 and 3.1 per cent higher in July 2021; Manufacturing sales were 46.8 per cent lower in April 2020 and 0.5 per cent lower in August 2021; Merchandise Exports1 were 40.3 per cent lower in April 2020 and 2.0 per cent lower in August 2021.
1 Ontario Ministry of Finance estimate.
Note: The latest data point is July 2021 for retail sales and August 2021 for all other indicators.
Sources: Statistics Canada and Ontario Ministry of Finance.
Chart 2.4: Stronger Nominal GDP Growth Projected in 2021
The left bar shows the private-sector average growth rate for 2021 real GDP growth was 4.4 per cent and 2.2 per cent for GDP inflation at the time of 2021 Budget. This resulted in a private-sector average for 2021 nominal GDP growth of 6.6 per cent. The right bar shows the current average of recently updated forecasts* is for 2021 real GDP growth of 4.6 per cent, a 0.2 percentage point increase compared to the 2021 Budget. However, the current average of recently updated forecasts is for 2021 GDP inflation of 5.5 per cent, a 3.3 percentage point increase compared to the 2021 Budget. This resulted in a private-sector average for 2021 nominal GDP growth of 10.1 per cent.
*Average of private-sector forecasts updated since August 31, 2021.
Note: Ontario Ministry of Finance planning assumption for 2021 nominal GDP growth in the 2021 Budget was 6.2 per cent.
Sources: Ontario Ministry of Finance Survey of Forecasters (February 3, 2021, and October 1, 2021) and Ontario Ministry of Finance.
Chart 2.5: Revised GDP Growth Projections for 2021
The bar chart shows January 2021 and current projections for 2021 real GDP growth for the world economy, United States, Euro Area and China. The revised real GDP growth projections for 2021 have improved from 5.5 per cent to 5.9 per cent for the world economy, from 4.2 per cent to 5.7 per cent for the United States, and from 4.2 per cent to 5.0 per cent for the Euro Area. For China, the real GDP growth projection has been revised down slightly from 8.1 per cent to 8.0 per cent.
Sources: International Monetary Fund (January and October 2021) and Blue Chip Economic Indicators (January and October 2021).
Chart 2.6: 10-Year Canadian Bond Rate Projections
The line chart shows the 10-year Canadian bond rate from 2011 to 2020. The highest rate shown was 2.8 per cent in 2011 and the lowest rate is 0.7 per cent in 2020. In other years, the rate ranged from 1.3 per cent to 2.3 per cent. The chart shows current projections of 1.3 per cent in 2021, 1.8 per cent in 2022, 2.2 per cent in 2023 and 2.5 per cent in 2024. These compare to 2021 Budget projections of 1.0 per cent in 2021, 1.4 per cent in 2022, 1.8 per cent in 2023 and 2.4 per cent in 2024.
Sources: Bank of Canada and Ontario Ministry of Finance.
Chart 2.7: Continued Job Gains Projected
This bar chart shows Ontario’s average annual employment from 2019 to 2020 and projections from 2021 to 2024. In addition, it shows employment gain projections represented by arrows from 2021 to 2024. Ontario’s average annual employment was 7.377 million in 2019 and decreased to 7.022 million in 2020. Employment in Ontario is projected to be 7.326 million in 2021, 7.567 million in 2022, 7.719 million in 2023 and 7.835 million in 2024.
Sources: Statistics Canada and Ontario Ministry of Finance.
Chart 2.8: Private-Sector Forecasters Project Inflation to Moderate
The chart shows Ontario’s CPI Inflation represented by a solid line from 2011 to 2020 and Ontario Ministry of Finance projections represented by a dotted line from 2021 to 2024. In addition, bars depict the range of private-sector forecasts from 2021 to 2024. Ontario’s CPI inflation was 3.1 per cent in 2011 and then was between 1.0 per cent to 2.4 per cent from 2012 to 2019. CPI inflation slowed to 0.7 per cent in 2020. The Ontario Ministry of Finance projects that Ontario’s CPI inflation will be 3.1 per cent in 2021, 2.6 per cent in 2022, 2.1 per cent in 2023 and 1.9 per cent in 2024. Private-sector forecasters project that Ontario’s CPI inflation will be in the range of 2.8 to 3.3 per cent in 2021 and in the range of 2.2 to 3.2 per cent in 2022 before moderating back to near two per cent in 2023 and 2024.
Sources: Statistics Canada, Ontario Ministry of Finance and Ontario Ministry of Finance Survey of Forecasters.
Chart 2.9: Ontario Home Resale Market
The first line chart on the left shows home resale units in Ontario from 2000 to 2020 and projections from 2021 to 2024. In 2000, Ontario home resales were 147,000 units and trended upward, peaking in 2016 at 244,000 units. Home resales then declined to 192,000 in 2018 before rising to 228,000 units in 2020. Home resales are projected to be 263,000 units in 2021, 224,000 units in 2022, 227,000 units in 2023 and 229,000 units in 2024.
The second line chart on the right shows the average home resale price in Ontario from the year 2000 to 2020 and projected price from 2021 to 2024. In 2000, the average home resale price was $184,000 and trended upwards, reaching $706,000 in 2020. The average home resale prices are projected to be $840,000 in 2021 and 2022, $844,000 in 2023 and $861,000 in 2024.
Sources: Canadian Real Estate Association and Ontario Ministry of Finance.
Chart 2.10: Nominal GDP Forecast Comparison
This line chart shows Ontario’s nominal GDP level from 2019 to 2020 and 2021 Budget and 2021 Ontario Economic Outlook and Fiscal Review projections from 2021 to 2024. Ontario nominal GDP was $891 billion in 2019 and $851 billion in 2020. The 2021 Ontario Economic Outlook and Fiscal Review projection is for nominal GDP to be $928 billion in 2021, $989 billion in 2022, $1,035 billion in 2023 and $1,077 billion in 2024. By 2024, nominal GDP is projected to be 3.0 per cent or $31 billion higher than was projected in the 2021 Budget.
Note: 2020 is actual data from the Ontario Economic Accounts and the 2021 Budget projection has been adjusted to reflect this historical data.
Sources: Statistics Canada and Ontario Ministry of Finance
Chart 2.11: Range of Ontario GDP Scenario Forecasts
The first line chart on the left shows Ontario real GDP in 2012 dollars from 2019 to 2020 and the Planning Projection from 2021 to 2024, along with Slower and Faster Growth scenario projections. Ontario real GDP was $798 billion in 2019 and $757 billion in 2020. The Planning Projection is for real GDP to grow from $789 billion in 2021 to $864 billion in 2024. The Slower Growth scenario projection is for real GDP to grow from $787 billion in 2021 to $849 billion in 2024. The Faster Growth scenario projection is for real GDP to grow from $794 billion in 2021 to $886 billion in 2024.
The second line chart on the right shows Ontario nominal GDP from 2019 to 2020 and the Planning Projection from 2021 to 2024, along with Slower and Faster Growth scenario projections. Ontario nominal GDP was $892 billion in 2019 and $851 billion in 2020. The Planning Projection is for nominal GDP to grow from $928 billion in 2021 to $1,077 billion in 2024. The Slower Growth scenario projection is for nominal GDP to grow from $923 billion in 2021 to $1,049 billion in 2024. The Faster Growth scenario projection is for nominal GDP to grow from $942 billion in 2021 to $1,123 billion in 2024.
Sources: Statistics Canada and Ontario Ministry of Finance.