Introduction
Protecting people’s health has been the government’s number one priority since the start of the pandemic. The government is working to protect Ontario’s progress in the fight against COVID‑19 while continuing the path to recovery driven by economic growth.
The 2021 Ontario Economic Outlook and Fiscal Review is reporting progress on the Province’s fiscal plan, with fiscal improvement in all years compared to the plan set out in the 2021 Budget.
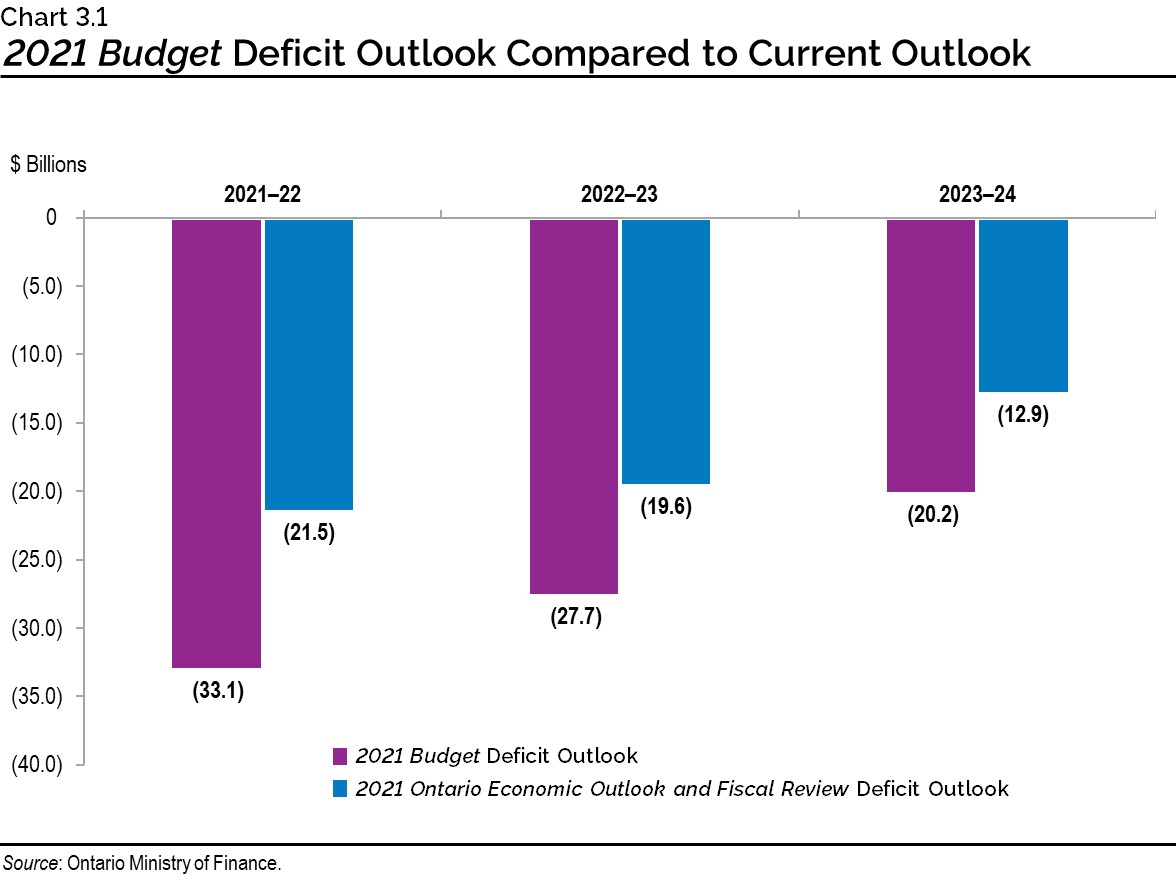
The government is now projecting a $21.5 billion deficit in 2021–22. Over the medium term, the government projects steadily declining deficits of $19.6 billion in 2022–23 and $12.9 billion in 2023–24.
The net debt-to-gross domestic product (GDP) ratio is projected to be 43.4 per cent in 2021–22, 5.4 percentage points lower than the 48.8 per cent forecast presented in the 2021 Budget. Over the medium-term outlook, the net debt-to-GDP ratio is also forecast to remain lower than the forecasts contained in the 2021 Budget.
| Actual 2020–21 |
Current Outlook 2021–22 |
Medium-Term Outlook 2022–23 |
Medium-Term Outlook 2023–24 |
|
|---|---|---|---|---|
| Revenue | 164.9 | 168.6 | 171.5 | 178.0 |
| Expense — Programs | 169.0 | 176.1 | 176.4 | 175.6 |
| Expense — Interest on Debt | 12.3 | 13.0 | 13.1 | 13.8 |
| Total Expense | 181.3 | 189.1 | 189.6 | 189.5 |
| Surplus/(Deficit) Before Reserve | (16.4) | (20.5) | (18.1) | (11.4) |
| Reserve | – | 1.0 | 1.5 | 1.5 |
| Surplus/(Deficit) | (16.4) | (21.5) | (19.6) | (12.9) |
| Net Debt as a Per Cent of GDP | 43.9% | 43.4% | 43.5% | 43.6% |
| Net Debt as a Per Cent of Revenue | 226.5% | 238.7% | 251.0% | 253.3% |
| Interest on Debt as Per Cent of Revenue | 7.4% | 7.7% | 7.7% | 7.8% |
Table 3.1 footnotes:
Note: Numbers may not add due to rounding.
Sources: Ontario Treasury Board Secretariat and Ontario Ministry of Finance.
Key Changes in 2021–22 Since the 2021 Budget
Ontario’s 2021–22 deficit is projected to be $21.5 billion — an improvement of $11.6 billion from the outlook published in the 2021 Budget.
Revenues in 2021–22 are projected to be $168.6 billion, $14.6 billion higher than forecast in the 2021 Budget. This increase is largely driven by higher-than-expected 2020 taxation revenues indicated by tax return processing and an increase in economic growth projected in 2021. This forecast is based on information available to October 1, 2021. Information arriving subsequent to that date will be reflected in future fiscal updates.
Program expense is projected to be $176.1 billion, $3.2 billion higher than the 2021 Budget forecast, primarily due to additional investments towards protecting Ontario’s progress against COVID‑19 and building Ontario’s future.
Ontario is forecast to pay $13.0 billion in interest costs in 2021–22, $0.2 billion lower than the forecast in the 2021 Budget.
The net debt-to-GDP ratio is now projected to be 43.4 per cent in 2021–22, 5.4 percentage points lower than the 48.8 per cent forecast in the 2021 Budget. The net debt-to-GDP ratio decreased due to lower than previously projected deficits and higher nominal GDP growth.
The 2021–22 outlook also maintains a $1.0 billion reserve, unchanged from the 2021 Budget, to protect the fiscal plan against unforeseen adverse changes in the Province’s revenue and expense forecasts for the remainder of the fiscal year.
| 2021 Budget | Current Outlook | In-Year Change | |
|---|---|---|---|
| Revenue | 154.0 | 168.6 | 14.6 |
| Expense — Programs | 173.0 | 176.1 | 3.2 |
| Expense — Interest on Debt | 13.1 | 13.0 | (0.2) |
| Total Expense | 186.1 | 189.1 | 3.0 |
| Surplus/(Deficit) Before Reserve | (32.1) | (20.5) | 11.6 |
| Reserve | 1.0 | 1.0 | – |
| Surplus/(Deficit) | (33.1) | (21.5) | 11.6 |
Table 3.2 footnotes:
Note: Numbers may not add due to rounding.
Sources: Ontario Treasury Board Secretariat and Ontario Ministry of Finance.
Revenue
The 2021–22 total revenue outlook is $168.6 billion, $14.6 billion higher than projected in the 2021 Budget and $11.7 billion higher than projected in the 2021–22 First Quarter Finances. The increase in the revenue forecast since the 2021–22 First Quarter Finances is mainly due to higher projected taxation revenues.
| 2021–22 | |
|---|---|
| 2021 Budget Total Revenue | 154,012 |
| Revenue Changes in the 2021–22 First Quarter Finances | 2,885 |
| Revenue Changes Since the 2021–22 First Quarter Finances — Personal Income Tax | 4,944 |
| Revenue Changes Since the 2021–22 First Quarter Finances — Sales Tax | 3,354 |
| Revenue Changes Since the 2021–22 First Quarter Finances — Corporations Tax | 2,041 |
| Revenue Changes Since the 2021–22 First Quarter Finances — Land Transfer Tax | 759 |
| Revenue Changes Since the 2021–22 First Quarter Finances — Ontario Health Premium | 325 |
| Revenue Changes Since the 2021–22 First Quarter Finances — Employer Health Tax | 225 |
| Revenue Changes Since the 2021–22 First Quarter Finances — Gasoline and Fuel Taxes | (629) |
| Revenue Changes Since the 2021–22 First Quarter Finances — All Other Taxes | 80 |
| Revenue Changes Since the 2021–22 First Quarter Finances — Total Taxation Revenue | 11,098 |
| Revenue Changes Since the 2021–22 First Quarter Finances — Government of Canada Transfers | 358 |
| Revenue Changes Since the 2021–22 First Quarter Finances — Government Business Enterprises | 120 |
| Revenue Changes Since the 2021–22 First Quarter Finances — Other Non-Tax Revenue | 145 |
| Total Revenue Changes Since the 2021–22 First Quarter Finances | 11,720 |
| Total Revenue Changes Since the 2021 Budget | 14,605 |
| 2021 Ontario Economic Outlook and Fiscal Review Total Revenue Outlook | 168,617 |
Table 3.3 footnotes:
Note: Numbers may not add due to rounding.
Source: Ontario Ministry of Finance.
Key changes in the revenue outlook compared with the 2021–22 First Quarter Finances forecast include:
- Personal Income Tax revenue is increased by $4,944 million mainly due to higher-than-expected revenues from the processing of 2020 tax returns and stronger growth in compensation of employees in 2021;
- Sales Tax revenue is increased by $3,354 million mainly due to higher forecast household consumption spending and housing completions;
- Corporations Tax revenue is increased by $2,041 million due to higher-than-projected revenues from the processing of 2020 tax returns and an increase in the forecast for growth in net operating surplus of corporations in 2021;
- Land Transfer Tax revenue is higher by $759 million mainly due to a substantial increase in projected home resales during 2021;
- Ontario Health Premium revenue is higher by $325 million due to higher-than-expected revenues from the processing of 2020 tax returns and stronger growth in compensation of employees in 2021;
- Employer Health Tax is increased by $225 million due to increased growth projected for compensation of employees in 2021;
- Gasoline and Fuel Taxes combined are decreased by $629 million due to lower projected fuel consumption volumes;
- All Other Taxes combined is increased by $80 million, which mainly consists of higher-than-expected revenues from Education Property Tax; Beer, Wine and Spirits Taxes; and Miscellaneous Other Taxes, partially offset by lower revenues from the Ontario portion of the Federal Cannabis Excise Duty;
- Government of Canada Transfers is increased by $358 million, mainly reflecting $150 million for early learning and child care and $194 million in Workforce Development Agreement funding that will be recognized in 2021–22 rather than 2020–21;
- Net income from Government Business Enterprises has increased by $120 million mainly due to an increase in Ontario Lottery and Gaming Corporation net income largely related to the reopening of casinos; and
- Other Non-Tax Revenues combined are higher by $145 million mainly due to an increase in revenue expected from the recovery of Prior-Year-Expenditures. This also reflects lower revenue from Vehicle and Driver Registration fees due to the extension of the current validity of many driver, vehicle and carrier products and services during the COVID‑19 pandemic.
Expense
The 2021–22 total expense outlook is $189.1 billion, $3.0 billion higher than the 2021 Budget and $787 million higher than the 2021–22 First Quarter Finances. The increase in total expense since the 2021–22 First Quarter Financesis mainly due to additional investments for infrastructure, health, education, seniors and providing support for jobs.
| 2021–22 | |
|---|---|
| 2021 Budget Total Expense | 186,120 |
| Total Expense Changes in the 2021–22 First Quarter Finances | 2,208 |
| Program Expense Changes Since the 2021–22 First Quarter Finances: Protecting Our Progress — Additional COVID‑19 Support for the 2021–22 School Year | 78 |
| Program Expense Changes Since the 2021–22 First Quarter Finances: Protecting Our Progress — Expansion of Home Care Initiatives | 61 |
| Program Expense Changes Since the 2021–22 First Quarter Finances: Protecting Our Progress — Support for Tourism Recovery Programs – Reconnect Festivals and Events | 30 |
| Program Expense Changes Since the 2021–22 First Quarter Finances: Protecting Our Progress — Expansion of Nursing and Personal Support Workforce | 20 |
| Program Expense Changes Since the 2021–22 First Quarter Finances: Protecting Our Progress — Increasing Inspectors for Long-Term Care Homes | 15 |
| Program Expense Changes Since the 2021–22 First Quarter Finances: Protecting Our Progress — COVID‑19 Supports in Licensed Retirement Homes | 11 |
| Program Expense Changes Since the 2021–22 First Quarter Finances: Protecting Our Progress — Proposed Extension of the Seniors’ Home Safety Tax Credit for 2022 | 10 |
| Program Expense Changes Since the 2021–22 First Quarter Finances: Protecting Our Progress — Pediatric Eating Disorder Supports | 8 |
| Program Expense Changes Since the 2021–22 First Quarter Finances: Protecting Our Progress — Additional Funding to Investigate Indian Residential School Burial Sites | 4 |
| Program Expense Changes Since the 2021–22 First Quarter Finances: Protecting Our Progress — Increase in Mental Health and Addictions Supports for Health Care Workers | 4 |
| Program Expense Changes Since the 2021–22 First Quarter Finances: Protecting Our Progress — Long-Term Care and Hospitals Data Integration | 4 |
| Program Expense Changes Since the 2021–22 First Quarter Finances: Protecting Our Progress — Racialized and Indigenous Support for Entrepreneurs (RAISE) Grant | 3 |
| Program Expense Changes Since the 2021–22 First Quarter Finances: Protecting Our Progress — All Other Changes | 65 |
| Program Expense Changes Since the 2021–22 First Quarter Finances: Total Protecting Our Progress | 311 |
| Program Expense Changes Since the 2021–22 First Quarter Finances: Building Ontario and Working for Workers — Support for Municipal Transit | 345 |
| Program Expense Changes Since the 2021–22 First Quarter Finances: Building Ontario and Working for Workers — Building Community Infrastructure | 200 |
| Program Expense Changes Since the 2021–22 First Quarter Finances: Building Ontario and Working for Workers — Proposed Extension of the Ontario Jobs Training Tax Credit for 2022 | 70 |
| Program Expense Changes Since the 2021–22 First Quarter Finances: Building Ontario and Working for Workers — Employment Services Transformation | 13 |
| Program Expense Changes Since the 2021–22 First Quarter Finances: Building Ontario and Working for Workers — Expanding Eligibility for Second Career | 5 |
| Program Expense Changes Since the 2021–22 First Quarter Finances: Building Ontario and Working for Workers — All Other Changes | 33 |
| Program Expense Changes Since the 2021–22 First Quarter Finances: Total Building Ontario and Working for Workers | 667 |
| Program Expense Changes Since the 2021–22 First Quarter Finances: Other Changes — Extending Temporary Wage Enhancement for Personal Support Workers | 922 |
| Program Expense Changes Since the 2021–22 First Quarter Finances: Other Changes — Top-Up to the Time-Limited COVID‑19 Fund | 500 |
| Program Expense Changes Since the 2021–22 First Quarter Finances: Other Changes — All Other Changes | 145 |
| Program Expense Changes Since the 2021–22 First Quarter Finances: Total Other Changes | 1,567 |
| Program Expense Changes Since the 2021–22 First Quarter Finances: Drawdown of the Standard Contingency Fund | (142) |
| Program Expense Changes Since the 2021–22 First Quarter Finances: Drawdown of the Time-Limited COVID‑19 Fund | (535) |
| Program Expense Changes Since the 2021–22 First Quarter Finances: Spending Accommodated Through Existing Fiscal Framework | (922) |
| Total Program Expense Changes Since the 2021–22 First Quarter Finances | 947 |
| Interest on Debt Change Since the 2021–22 First Quarter Finances | (159) |
| Total Expense Changes Since the 2021–22 First Quarter Finances | 787 |
| Total Expense Changes Since the 2021 Budget | 2,996 |
| 2021 Ontario Economic Outlook and Fiscal Review Total Expense Outlook | 189,115 |
Table 3.4 footnotes:
Note: Numbers may not add due to rounding.
Sources: Ontario Treasury Board Secretariat and Ontario Ministry of Finance.
Since the release of the 2021–22 First Quarter Finances, key changes to program expense projections primarily include the following:
- Additional resources to protect the progress against COVID‑19:
- $78 million towards COVID‑19 supports for the 2021–22 school year, including funding to enhance safety measures and learning recovery;
- $61 million to expand home care services to enable the transition of patients recovering from surgeries or living with complex conditions from hospitals, back into their homes, where they want to be;
- An additional $30 million for the Reconnect Festival and Event Program to further help the tourism industry recover;
- $20 million to support the front lines of the health care system by expanding the nursing and personal support workforce in critical areas of the health and long-term care system;
- $15 million to increase enforcement capacity in the long-term care sector including hiring additional inspectors;
- $11 million for COVID‑19 supports for residents in licensed retirement homes;
- $10 million for the proposed extension of the Seniors’ Home Safety Tax Credit for 2022;
- $8 million for pediatric eating disorder supports;
- An additional $4 million to work with Indigenous partners in support of reconciliation for the identification, investigation, protection and commemoration of Indian Residential School (IRS) burial sites across the province, building on previously announced funding of $10 million over three years;
- $4 million to expand mental health and addictions supports for health and long-term care workers;
- $3.5 million to implement a technology solution that will integrate the clinical information between hospitals and long-term care;
- $3 million for the Racialized and Indigenous Support for Entrepreneurs (RAISE) grant; and
- $65 million in all other changes to primarily address COVID‑19 impacts and strengthen the health care system.
- Additional investments towards building Ontario and working for workers include:
- $345 million in 2021–22 to support municipal transit systems as they recover from the COVID‑19 pandemic;
- An additional $200 million to increase support for municipal infrastructure;
- $70 million for the proposed extension of the Ontario Jobs Training Tax Credit for 2022;
- $13 million for an integrated employment services system, which transitions social assistance employment programs into Employment Ontario;
- $5 million to expand eligibility for the Second Career program to also support people in non‑traditional employment (e.g., gig workers, newcomers and people with disabilities) or who have limited prior work experience; and
- $33 million in all other changes for infrastructure investments, support for workers and jobs, and other initiatives.
- Other investments include:
- $922 million in funding for the 2021–22 portion of the government’s investment in ongoing temporary wage enhancements for personal support workers and direct support workers who deliver publicly funded personal support services in home and community care, long-term care, public hospitals and social services. This temporary wage enhancement will continue through March 31, 2022;
- An additional $500 million to the Time-Limited COVID‑19 Fund in 2021–22. As vaccination rates increase and the province fully reopens, the funding will help deploy resources where they are needed most and will also be available to support further recovery initiatives; and
- $145 million in all other changes.
Interest on Debt expense is projected to be $13.0 billion, lower than the $13.1 billion forecast in the 2021–22 First Quarter Finances.
Prudence
As reported in the 2021 Budget, the government fully allocated the extraordinary contingencies previously made available in 2021–22 to protect the health of the people of Ontario and support families, employers and jobs during the COVID‑19 pandemic. To maintain the flexibility necessary given the ongoing uncertainty related to the pandemic and the future pace of economic recovery, the Province allocated $2.2 billion to the Time-Limited COVID‑19 Fund in 2021–22 through the 2021–22 First Quarter Finances.
With the release of the 2021 Ontario Economic Outlook and Fiscal Review, the Province has allocated an additional $500 million to the Time-Limited COVID‑19 Fund in 2021–22. As vaccination rates increase and the province fully reopens, the funding will help deploy resources where they are needed most and will also be available to support further recovery initiatives. After accounting for the top-up and drawdowns from this fund since the 2021–22 First Quarter Finances, the net position of the Time-Limited COVID‑19 Fund remains at $2.2 billion in 2021–22. Standard Contingency Funds are also maintained to help mitigate expense risks — for example, in cases where health and safety may be compromised — that may otherwise adversely affect Ontario’s fiscal performance. The remaining standard Contingency Fund is currently projected at $1.4 billion for 2021–22.
The Fiscal Sustainability, Transparency and Accountability Act, 2019 requires Ontario’s fiscal plan to incorporate prudence in the form of a reserve to protect the fiscal outlook against unforeseen adverse changes in the Province’s revenue and expense, including those resulting from changes in Ontario’s economic performance. The 2021 Budget included a reserve of $1.0 billion in 2021–22, which has been maintained as part of the current fiscal outlook to ensure a prudent risk management approach, given uncertainties remaining in the fiscal outlook for 2021–22.
Medium-Term Fiscal Plan
The government is projecting deficits of $19.6 billion in 2022–23 and $12.9 billion in 2023–24. This represents an improvement of $8.1 billion in 2022–23 and $7.2 billion in 2023–24 since the 2021 Budget.
Over the medium term, revenue is forecast to increase from $168.6 billion in 2021–22 to $178.0 billion in 2023–24, while total expense is projected to increase from $189.1 billion to $189.5 billion over the same period.
Medium-Term Revenue Outlook
| Current Outlook 2021–22 |
Medium-Term Outlook 2022–23 |
Medium-Term Outlook 2023–24 |
|
|---|---|---|---|
| Revenue — Personal Income Tax | 41.3 | 42.4 | 44.0 |
| Revenue — Sales Tax | 31.0 | 33.2 | 34.9 |
| Revenue — Corporations Tax | 17.0 | 17.3 | 17.4 |
| Revenue — Ontario Health Premium | 4.5 | 4.6 | 4.7 |
| Revenue — Education Property Tax | 5.8 | 5.7 | 5.8 |
| Revenue — All Other Taxes | 17.3 | 17.3 | 17.6 |
| Total Taxation Revenue | 116.9 | 120.5 | 124.4 |
| Government of Canada | 29.7 | 27.7 | 28.7 |
| Income from Government Business Enterprises | 4.7 | 5.5 | 6.6 |
| Other Non-Tax Revenue | 17.3 | 17.8 | 18.2 |
| Total Revenue | 168.6 | 171.5 | 178.0 |
Table 3.5 footnotes:
Note: Numbers may not add due to rounding.
Source: Ontario Ministry of Finance.
The taxation revenue outlook reflects the impact of finalized 2020–21 results and the updated economic growth outlook since the 2021 Budget.
The primary driver of the forecast for Personal Income Tax (PIT) revenue is the outlook for growth in the compensation of employees. Revenues in 2021–22 also reflect projected Canada Recovery Benefits payments that have been deemed taxable by the federal government. Between 2021–22 and 2023–24, PIT revenue is projected to grow at an average annual rate of 3.2 per cent.
The Sales Tax revenue projection is based primarily on the outlook for household consumption spending. Sales Tax revenue is projected to grow at an average annual rate of 6.2 per cent between 2021–22 and 2023–24.
The forecast for Corporations Tax revenue is driven by the projection for net operating surplus of corporations. Corporations Tax revenue is projected to grow at an average annual rate of 1.4 per cent between 2021–22 and 2023–24.
The Ontario Health Premium revenue forecast is based primarily on the outlook for growth in the compensation of employees. Ontario Health Premium revenue is projected to increase at an average annual rate of 3.1 per cent between 2021–22 and 2023–24.
Education Property Tax revenue is based primarily on the outlook for growth in the property assessment base resulting from new construction activities. Revenues are projected to remain relatively stable from 2021–22 to 2023–24, with assessment growth offset by the impact of previously announced measures, including the reduction in Business Education Tax (BET) rates.
Revenues from All Other Taxes are projected to increase at an average annual rate of 0.7 per cent between 2021–22 and 2023–24. This includes revenues from the Employer Health Tax; Land Transfer Tax; Beer, Wine and Spirits Taxes; and volume-based taxes such as the Gasoline Tax, Fuel Tax and Tobacco Tax.
The forecast for Government of Canada transfers is based on existing federal–provincial funding agreements and formulas. Federal transfers are projected to decrease at an average annual rate of 1.7 per cent from 2021–22 to 2023–24, mainly due to one-time funding of $2.4 billion related to COVID‑19 that ends in 2021–22.
The outlook for Income from Government Business Enterprises (GBEs) is based on Ontario Ministry of Finance estimates for Hydro One Ltd. (Hydro One) and projections provided by Ontario Power Generation (OPG), the Ontario Cannabis Store (OCS), the Liquor Control Board of Ontario (LCBO) and the Ontario Lottery and Gaming Corporation (OLG). Net incomes of GBEs are projected to increase at an average annual rate of 19.2 per cent from 2021–22 to 2023–24. The strong growth mainly reflects the recovery of OLG net income that has been impacted by the prior closure of casinos to protect public health in response to the COVID‑19 pandemic.
The forecast for Other Non-Tax Revenue is based on projections provided by government ministries and provincial agencies. The outlook for Other Non-Tax revenues is projected to increase at an average annual rate of 2.6 per cent from 2021–22 to 2023–24 largely due to the expected increase in third-party revenues of hospitals, school boards and colleges that are reflected in the province’s financial statements.
Revenue Outlook Scenarios
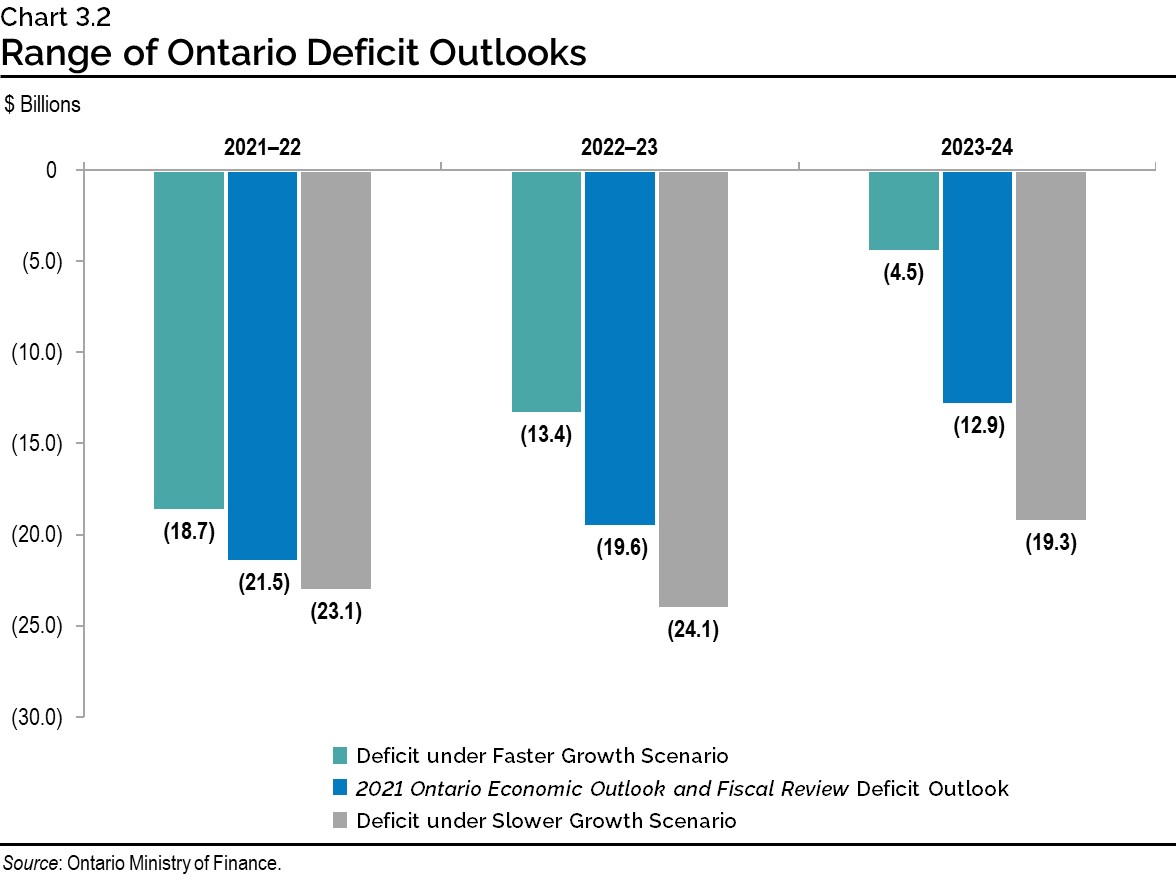
To illustrate heightened economic uncertainty, the Ontario Ministry of Finance has developed two plausible alternative scenarios that the economy could take over the next several years. See Chapter 2: Economic Performance and Outlook for more details. Based on the two alternative nominal GDP economic scenarios, two taxation revenue scenarios were developed. These Faster Growth and Slower Growth scenarios each represent a reasonable path intended to illustrate a broader range of possible outcomes but should not be considered as the best case or the worst case.
| 2021–22p | 2022–23p | 2023–24p | |
|---|---|---|---|
| Faster Growth Scenario | 119.6 | 126.4 | 132.3 |
| Planning Projection | 116.9 | 120.5 | 124.4 |
| Slower Growth Scenario | 115.3 | 116.0 | 118.5 |
Table 3.6 footnotes:
p = Ontario Ministry of Finance Planning Projection and alternative scenarios.
Source: Ontario Ministry of Finance.
In the Faster Growth scenario, total taxation revenue over the medium term is $7.9 billion higher in 2023–24 than the Planning Projection, while in the Slower Growth scenario, total taxation revenue is $5.9 billion dollars lower.
In the event that the alternative economic scenarios materialize, as opposed to the Planning Projection, Ontario’s fiscal plan would also change as a result.
Under the Faster Growth scenario, the deficit outlook may improve to $18.7 billion in 2021–22, $13.4 billion in 2022–23, and $4.5 billion in 2023–24. However, if the Slower Growth scenario takes place instead, the deficit outlook may deteriorate to $23.1 billion in 2021–22, $24.1 billion in 2022–23, and $19.3 billion in 2023–24.
Medium-Term Expense Outlook
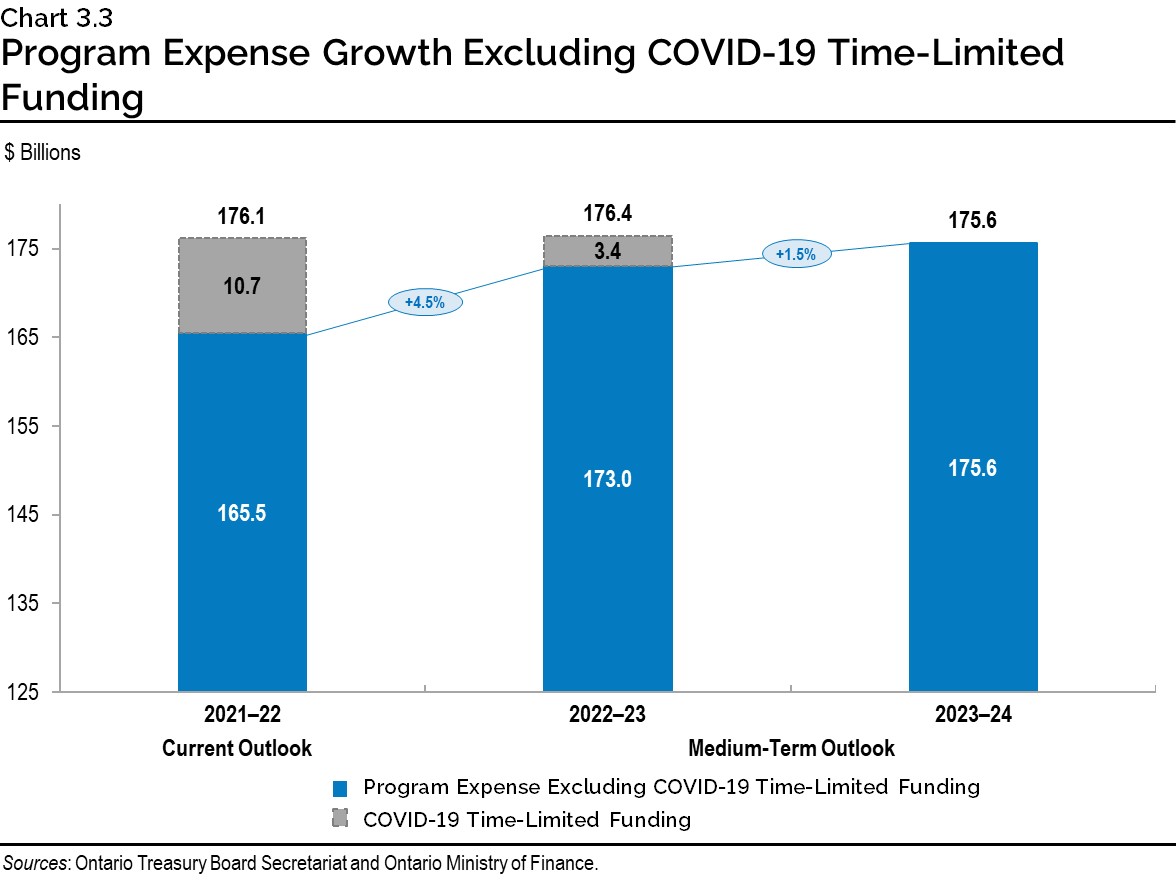
The Province’s program expense outlook is projected to decline from $176.1 billion in 2021–22 to $175.6 billion in 2023–24 as COVID‑19 Time-Limited Funding is projected to be phased out by 2023–24. Base program expense is projected to increase by $10.2 billion over the same period.
| Current Outlook 2021–22 |
Medium-Term Outlook 2022–23 |
Medium-Term Outlook 2023–24 |
|
|---|---|---|---|
| Base Programs1 — Health Sector | 69.9 | 71.6 | 73.2 |
| Base Programs2 — Education Sector3 | 30.8 | 31.3 | 31.5 |
| Base Programs4 — Postsecondary Education Sector | 10.7 | 11.0 | 11.2 |
| Base Programs5 — Children’s and Social Services Sector | 17.8 | 18.0 | 18.1 |
| Base Programs6 — Justice Sector | 4.8 | 4.8 | 4.8 |
| Base Programs7 — Other Programs | 31.5 | 36.3 | 36.8 |
| Total Base Programs | 165.5 | 173.0 | 175.6 |
| COVID‑19 Time-Limited Funding | 10.7 | 3.4 | – |
| Total Programs | 176.1 | 176.4 | 175.6 |
| Interest on Debt | 13.0 | 13.1 | 13.8 |
| Total Expense | 189.1 | 189.6 | 189.5 |
Table 3.7 footnotes:
[1], [2], [4], [5], [6], [7] For presentation purposes beginning in the 2021 Budget, one-time COVID‑19-related spending has been included within COVID‑19 Time-Limited Funding. The change in presentation does not impact ministry allocations or ministry structure(s) to be presented in the 2021–22 Expenditure Estimates. For details on time-limited funding and contingencies, see Table 3.8.
[3] Excludes Teachers’ Pension Plan, which is included in Other Programs.
Note: Numbers may not add due to rounding.
Sources: Ontario Treasury Board Secretariat and Ontario Ministry of Finance.
With the health and safety of the people of Ontario as the top priority, the government has made available COVID‑19 Time-Limited Funding to protect the progress against COVID‑19. This funding is presented separately to transparently capture the temporary nature of these investments.
On top of these temporary COVID‑19-related initiatives, the government continues to invest in programs that serve the people of Ontario. Over the medium-term outlook, base program expense is projected to increase every year, growing at an average annual rate of 3.0 per cent from 2021–22 to 2023–24.
Highlights of changes to the program expense outlook over the medium term primarily since the 2021 Budget include the following:
- Base Health Sector expense is projected to increase from $69.9 billion in 2021–22 to $73.2 billion in 2023–24. Key investments include:
- $1.5 billion in additional funding over two years to support sector growth;
- $233 million over three years to strengthen health human resources by expanding the nursing and personal support workforce in critical areas of the health and long-term care system;
- $72 million over three years to increase enforcement capacity including hiring 156 additional inspectors by 2022–23;
- $29 million over two years, starting in 2022–23, to hire additional nurse practitioners in the long-term care sector;
- $17 million over two years, starting in 2022–23, to increase access to dental services for eligible low-income seniors; and
- $12 million over two years, beginning in 2021–22, to expand mental health and addictions support for health and long-term care workers.
- Base Education Sector expense is projected to increase from $30.8 billion in 2021–22 to $31.5 billion in 2023–24. Key investments include:
- $263 million over three years related to additional funding from the renewal of the Canada-Ontario Early Learning and Child Care Agreement, including one-time federal support for the Province’s ongoing early childhood educator recruitment and retention efforts; and
- Providing funding to school boards due to forecasted enrolment increases.
- Base Postsecondary Education Sector expense is projected to increase from $10.7 billion in 2021–22 to $11.2 billion in 2023–24. Key investments include:
- $48 million over two years for key research supports for the Perimeter Institute, the Sudbury Neutrino Observatory Laboratory (SNOLAB), and the Advanced Research Computing facilities; and
- Maintaining the financial sustainability of the Ontario Student Assistance Program (OSAP).
- Base Children’s and Social Services Sector expense is projected to increase from $17.8 billion in 2021–22 to $18.1 billion in 2023–24. Key investments include:
- $60 million annually, beginning in 2021–22, for Early Intervention and Special Needs to significantly reduce waitlists for children and youth and increase their access to clinical assessment and rehabilitation programs; and
- $32 million over three years, beginning in 2021–22, to enable more people with developmental disabilities to access community housing and to support victims of domestic violence and survivors of human trafficking in finding affordable housing.
- Base Justice Sector expense is projected to remain at about $4.8 billion from 2021–22 to 2023–24.
- Base Other Programs Sector expense is projected to increase from $31.5 billion in 2021–22 to $36.8 billion in 2023–24. Key investments include:
- Almost $2 billion over three years beginning in 2021–22 for investments in broadband infrastructure to provide every region in Ontario with access to reliable high-speed internet by the end of 2025;
- Supports made available in 2021–22 for the costs of the Ontario COVID‑19 Worker Income Protection Benefit to ensure workers can stay home if they are sick;
- An additional $90 million over three years for the Skilled Trades Strategy to help break the stigma, simplify the system and encourage employer participation in apprenticeships; and
- Similar to the successful approach used to combat the pandemic and support Ontario’s recovery, the Other Programs Sector includes fiscal flexibility that may be reallocated across government programs to navigate risks that may arise over the medium term.
- COVID‑19 Time-Limited Funding primarily includes key additional investments such as:
- $701 million in 2021–22 and $400 million in 2022–23 in COVID‑19 support for the 2021–22 school year;
- $297 million over two years to expand home care services to enable the transition of patients recovering from surgeries or living with complex conditions from hospitals, back into their homes, where they want to be;
- $307 million in 2021–22 through the Social Services Relief Fund and community housing programs to support municipal service managers and Indigenous program partners to deliver critical services during the COVID‑19 pandemic; and
- $17 million over two years to implement an Ontario-made technology solution that will integrate the clinical information between hospitals and long-term care to avoid re-admissions, share information with families, and ensure vulnerable seniors get the highest-quality care possible.
- The total expense outlook includes interest on debt expense, which is projected to increase from $13.0 billion in 2021–22 to $13.8 billion in 2023–24.
Prudence
In keeping with sound fiscal practices, the Province’s revenue outlook is based on prudent economic planning projections, as discussed in Chapter 2: Economic Performance and Outlook.
Ontario incorporates prudence in the form of a reserve to protect the fiscal outlook against unforeseen adverse changes in the Province’s revenue and expense, including those resulting from changes in Ontario’s economic performance. The reserve has been set at $1.5 billion in each of 2022–23 and 2023–24, unchanged from the 2021 Budget. In addition, standard Contingency Funds are maintained to help mitigate expense risks — for example, in cases where health and safety may be compromised, and which may otherwise adversely affect Ontario’s fiscal performance.
To maintain the flexibility necessary given the ongoing uncertainty related to the pandemic and the future pace of economic recovery, the Province has made available time-limited funding and extraordinary contingencies through the Time-Limited COVID‑19 Fund. Funding previously tracked under the Pandemic Fund and the Support for People and Jobs Fund in 2022–23 has been reallocated towards the Time-Limited COVID‑19 Fund, which will help deploy resources where they are needed most. The balances remaining in this fund will also be available to support further recovery initiatives.
| Current Outlook 2021–22 |
Medium-Term Outlook 2022–23 |
Medium-Term Outlook 2023–24 |
|
|---|---|---|---|
| COVID‑19 Time-Limited Funding and Extraordinary Contingencies — Pandemic Fund1 | 4,000 | – | – |
| COVID‑19 Time-Limited Funding and Extraordinary Contingencies — Support for People and Jobs Fund2 | 1,000 | – | – |
| COVID‑19 Time-Limited Funding and Extraordinary Contingencies — Time-Limited COVID‑19 Fund | 2,700 | 2,800 | – |
| COVID‑19 Time-Limited Funding and Extraordinary Contingencies — Other COVID‑19 Time-Limited Funding | 2,977 | 624 | – |
| Total COVID‑19 Time-Limited Funding and Extraordinary Contingencies | 10,677 | 3,424 | – |
| Remaining Balances as of the 2021 Ontario Economic Outlook and Fiscal Review — Pandemic Fund3 | – | – | – |
| Remaining Balances as of the 2021 Ontario Economic Outlook and Fiscal Review — Support for People and Jobs Fund4 | – | – | – |
| Remaining Balances as of the 2021 Ontario Economic Outlook and Fiscal Review — Time-Limited COVID‑19 Fund | 2,165 | 2,290 | – |
| Total Remaining Balances as of the 2021 Ontario Economic Outlook and Fiscal Review | 2,165 | 2,290 | – |
Table 3.8 footnotes:
[1], [2], [3], [4] Funding previously tracked under the Pandemic Fund and Support for People and Jobs Fund in 2022–23 has been reallocated towards the Time-Limited COVID‑19 Fund and these funds had been fully allocated for 2021–22 in the 2021 Budget.
Note: Numbers may not add due to rounding.
Sources: Ontario Treasury Board Secretariat and Ontario Ministry of Finance.
Transparency and Risks
The government is committed to being open and transparent about the state of Ontario’s finances. This principle is reflected in the Fiscal Sustainability, Transparency and Accountability Act, 2019, which stipulates that Ontario’s fiscal policy should be based on cautious assumptions.
While mid-year updates to the government’s finances are informed by the latest information available, key information still to be received over the remainder of the fiscal year may have further upside and downside risks, which could materially affect the fiscal outlook. Revenue could be affected by changes in the economy, while expenses could be impacted by changes in utilization of large demand-driven programs.
As a matter of transparent fiscal management, financial pressures are monitored throughout the fiscal year by the Ontario Treasury Board Secretariat, with the goal of ensuring that robust and prudent methodologies are used to develop forecasts. Other important risk management tools include closely tracking the pace of implementation of initiatives and proactively identifying emerging program and policy risks. Comprehensive analysis of known pressures informs the fiscal planning processes, including the development of plans to mitigate and manage fiscal pressures, as well as maintaining adequate contingencies as part of the medium-term fiscal projections.
In addition to the key demand sensitivities and economic risks to the fiscal plan, there are risks stemming from the government’s contingent liabilities. Whether future events will result in actual liabilities for the province is beyond the direct control of the government. For example, losses could result from legal settlements, defaults on projects, or a call on loan or funding guarantees. Provisions for losses that are likely to occur and can be reasonably estimated are expensed and reported as liabilities in the Province’s financial statements. Any significant contingent liabilities related to the 2020–21 fiscal year have been disclosed as part of the Public Accounts of Ontario 2020–2021 released in September.
Details of Ontario’s Finances
| Actual 2018–19 |
Actual 2019–20 |
Actual 2020–21 |
Current Outlook 2021–22 |
|
|---|---|---|---|---|
| Taxation Revenue — Personal Income Tax | 35,381 | 37,743 | 40,333 | 41,295 |
| Taxation Revenue — Sales Taxes | 27,804 | 28,619 | 26,576 | 30,986 |
| Taxation Revenue — Corporations Tax | 16,606 | 15,414 | 17,775 | 16,980 |
| Taxation Revenue — Education Property Tax | 6,171 | 6,179 | 6,040 | 5,818 |
| Taxation Revenue — Employer Health Tax | 6,544 | 6,731 | 6,537 | 6,670 |
| Taxation Revenue — Ontario Health Premium | 3,819 | 4,059 | 4,330 | 4,466 |
| Taxation Revenue — Gasoline Tax | 2,709 | 2,783 | 1,898 | 1,914 |
| Taxation Revenue — Land Transfer Tax | 2,761 | 3,067 | 3,698 | 5,049 |
| Taxation Revenue — Tobacco Tax | 1,241 | 1,118 | 1,099 | 1,056 |
| Taxation Revenue — Fuel Tax | 774 | 807 | 686 | 692 |
| Taxation Revenue — Beer, Wine and Spirits Taxes | 607 | 582 | 624 | 649 |
| Taxation Revenue — Electricity Payments in Lieu of Taxes | 435 | 505 | 563 | 454 |
| Taxation Revenue — Ontario Portion of the Federal Cannabis Excise Duty | 19 | 48 | 106 | 185 |
| Taxation Revenue — Other Taxes | 653 | 623 | 619 | 654 |
| Taxation Revenue — Total | 105,524 | 108,278 | 110,884 | 116,867 |
| Government of Canada — Canada Health Transfer | 14,852 | 15,640 | 16,206 | 16,737 |
| Government of Canada — Canada Social Transfer | 5,451 | 5,650 | 5,815 | 6,005 |
| Government of Canada — Equalization | 963 | – | – | – |
| Government of Canada — Infrastructure Programs | 605 | 400 | 626 | 1,086 |
| Government of Canada — Labour Market Programs | 1,015 | 1,054 | 1,323 | 1,523 |
| Government of Canada — Social Housing Agreement | 394 | 484 | 338 | 299 |
| Government of Canada — Other Federal Payments | 1,420 | 1,756 | 9,157 | 3,675 |
| Government of Canada — Direct Transfers to Broader Public-Sector Organizations | 390 | 414 | 459 | 424 |
| Government of Canada — Total | 25,090 | 25,398 | 33,924 | 29,749 |
| Income from Government Business Enterprises — Liquor Control Board of Ontario | 2,276 | 2,402 | 2,539 | 2,435 |
| Income from Government Business Enterprises — Ontario Power Generation Inc./Hydro One Ltd. | 772 | 1,167 | 2,044 | 670 |
| Income from Government Business Enterprises — Ontario Lottery and Gaming Corporation | 2,464 | 2,309 | 359 | 1,401 |
| Income from Government Business Enterprises — Ontario Cannabis Store | (42) | 19 | 67 | 155 |
| Income from Government Business Enterprises — Total | 5,470 | 5,897 | 5,009 | 4,661 |
| Other Non-Tax Revenue — Fees, Donations and Other Revenues from Hospitals, School Boards and Colleges | 9,237 | 9,281 | 7,790 | 9,758 |
| Other Non-Tax Revenue — Vehicle and Driver Registration Fees | 1,991 | 2,055 | 1,952 | 2,040 |
| Other Non-Tax Revenue — Miscellaneous Other Non-Tax Revenue | 1,873 | 1,222 | 1,857 | 1,547 |
| Other Non-Tax Revenue — Other Fees and Licences | 1,088 | 1,156 | 1,017 | 1,207 |
| Other Non-Tax Revenue — Sales and Rentals | 1,477 | 1,369 | 680 | 1,402 |
| Other Non-Tax Revenue — Reimbursements | 998 | 1,005 | 1,277 | 1,031 |
| Other Non-Tax Revenue — Royalties | 251 | 283 | 359 | 284 |
| Other Non-Tax Revenue — Power Supply Contract Recoveries | 173 | 122 | 116 | 66 |
| Other Non-Tax Revenue — Net Reduction of Power Purchase Contracts | 41 | 30 | 28 | 5 |
| Other Non-Tax Revenue — Carbon Allowance Proceeds | 472 | – | – | – |
| Other Non-Tax Revenue — Electricity Debt Retirement Charge1 | 15 | – | – | – |
| Other Non-Tax Revenue — Total | 17,616 | 16,523 | 15,076 | 17,341 |
| Total Revenue | 153,700 | 156,096 | 164,893 | 168,617 |
Table 3.9 footnotes:
[1] The Debt Retirement Charge cost was removed from residential electricity users’ electricity bills as of January 1, 2016 and for all other consumers as of April 1, 2018. Residual revenues were recorded afterwards due to higher-than-expected amounts received following the 2017–18 year-end, compared with the estimated accrual amounts in 2017–18.
Note: Numbers may not add due to rounding.
Source: Ontario Ministry of Finance.
| Ministry Expense | Actual 2018–19 |
Actual 2019–20 |
Actual 2020–21 |
Current Outlook 2021–22 |
|---|---|---|---|---|
| Agriculture, Food and Rural Affairs (Base) | 328 | 297 | 289 | 312.0 |
| Agriculture, Food and Rural Affairs — Federal–Provincial Infrastructure Programs2 | 96 | 94 | – | – |
| Agriculture, Food and Rural Affairs — Municipal Infrastructure Program Investments3 | 257 | 222 | – | – |
| Agriculture, Food and Rural Affairs — Demand-Driven Risk Management and Time-Limited Programs4 | 383 | 518 | 458 | 417.6 |
| Agriculture, Food and Rural Affairs — COVID‑19 Time-Limited Funding5 | – | – | 41 | 26.2 |
| Agriculture, Food and Rural Affairs (Total) | 1,064 | 1,130 | 788 | 755.7 |
| Attorney General (Base) | 1,757 | 1,734 | 1,581 | 1,686.7 |
| Attorney General — Statutory Appropriations — Crown Liability and Proceedings Act, 2019 | 17 | 192 | 60 | – |
| Attorney General — One-time Accounting Adjustment for the Victim Fine Surcharges Program | – | – | 196 | – |
| Attorney General — COVID‑19 Time-Limited Funding6 | – | – | 71 | – |
| Attorney General (Total) | 1,774 | 1,927 | 1,908 | 1,686.7 |
| Board of Internal Economy (Total) | 371 | 257 | 248 | 273.0 |
| Children, Community and Social Services (Base) | 16,782 | 17,070 | 16,996 | 17,843.0 |
| Children, Community and Social Services — COVID‑19 Time-Limited Funding7 | – | – | 440 | 78.0 |
| Children, Community and Social Services (Total) | 16,782 | 17,070 | 17,436 | 17,920.9 |
| Colleges and Universities (Base) | 9,029 | 9,220 | 8,767 | 9,312.8 |
| Colleges and Universities — Student Financial Assistance | 2,043 | 1,296 | 766 | 1,352.4 |
| Colleges and Universities — Time-Limited Infrastructure Funding under the Strategic Investment Fund | 119 | 2 | – | – |
| Colleges and Universities — COVID‑19 Time-Limited Funding8 | – | – | 292 | 21.4 |
| Colleges and Universities (Total) | 11,191 | 10,519 | 9,826 | 10,686.6 |
| Economic Development, Job Creation and Trade (Base) | 354 | 315 | 391 | 377.5 |
| Economic Development, Job Creation and Trade — Time-Limited Investments | 430 | 263 | 187 | 215.4 |
| Economic Development, Job Creation and Trade — Bad Debt Expense | – | – | 211 | – |
| Economic Development, Job Creation and Trade — COVID‑19 Time-Limited Funding9 | – | – | 3,106 | 344.7 |
| Economic Development, Job Creation and Trade (Total) | 783 | 579 | 3,896 | 937.6 |
| Education (Base) | 28,742 | 30,177 | 28,390 | 30,796.0 |
| Education — Teachers’ Pension Plan10 | 1,678 | 1,570 | 1,607 | 1,630.9 |
| Education — COVID‑19 Time-Limited Funding11 | – | – | 2,885 | 760.0 |
| Education (Total) | 30,420 | 31,748 | 32,881 | 33,186.9 |
| Energy, Northern Development and Mines (Base)12 | 1,361 | 1,099 | 897 | 1,084.0 |
| Energy, Northern Development and Mines — Electricity Cost-Relief Programs | 4,243 | 5,484 | 5,539 | 6,476.6 |
| Energy, Northern Development and Mines — COVID‑19 Time-Limited Funding13 | – | – | 906 | 187.2 |
| Energy, Northern Development and Mines (Total) | 5,604 | 6,583 | 7,342 | 7,747.8 |
| Environment, Conservation and Parks (Base) | 459 | 612 | 632 | 684.3 |
| Environment, Conservation and Parks — Time-Limited Investments | 223 | 2 | – | – |
| Environment, Conservation and Parks — COVID‑19 Time-Limited Funding14 | – | – | 3 | 12.9 |
| Environment, Conservation and Parks (Total) | 682 | 614 | 636 | 697.2 |
| Executive Offices (Base) | 33 | 32 | 32 | 40.4 |
| Executive Offices — Time-Limited Assistance | – | – | 2 | – |
| Executive Offices — COVID‑19 Time-Limited Funding15 | – | – | 6 | 3.0 |
| Executive Offices (Total) | 33 | 32 | 39 | 43.4 |
| Finance (Base) | 883 | 804 | 724 | 850.9 |
| Finance — Investment Management Corporation of Ontario16 | 67 | 88 | 128 | 185.4 |
| Finance — Ontario Municipal Partnership Fund | 510 | 503 | 502 | 501.9 |
| Finance — Power Supply Contract Costs | 173 | 122 | 116 | 65.6 |
| Finance — Time-Limited COVID‑19 Fund17 | – | – | – | 2,165.2 |
| Finance — COVID‑19 Time-Limited Funding18 | – | – | 440 | 170.0 |
| Finance (Total) | 1,633 | 1,518 | 1,910 | 3,939.0 |
| Francophone Affairs (Base) | 6 | 5 | 5 | 6.5 |
| Francophone Affairs — COVID‑19 Time-Limited Funding19 | – | – | 1 | 2.8 |
| Francophone Affairs (Total) | 6 | 5 | 6 | 9.3 |
| Government and Consumer Services (Base) | 706 | 683 | 627 | 752.3 |
| Government and Consumer Services — Realty | 1,012 | 924 | 1,099 | 1,144.6 |
| Government and Consumer Services — COVID‑19 Time-Limited Funding20 | – | – | 423 | – |
| Government and Consumer Services (Total) | 1,718 | 1,607 | 2,149 | 1,896.8 |
| Health (Total)21 | 57,566 | 59,286 | 59,875 | 64,089.1 |
| COVID‑19 Health Response22 | – | – | 5,082 | 5,206.1 |
| Heritage, Sport, Tourism and Culture Industries (Base) | 934 | 907 | 719 | 1,028.2 |
| Heritage, Sport, Tourism and Culture Industries — Ontario Cultural Media Tax Credits | 588 | 656 | 512 | 602.1 |
| Heritage, Sport, Tourism and Culture Industries — Ontario Cultural Media Tax Credits — Amounts Related to Prior Years | 40 | 80 | 65 | – |
| Heritage, Sport, Tourism and Culture Industries — COVID‑19 Time-Limited Funding23 | – | – | 120 | 188.3 |
| Heritage, Sport, Tourism and Culture Industries (Total) | 1,562 | 1,643 | 1,416 | 1,818.7 |
| Indigenous Affairs (Base) | 75 | 71 | 64 | 89.5 |
| Indigenous Affairs — One-Time Investments including Settlements | 215 | 16 | 149 | – |
| Indigenous Affairs — COVID‑19 Time-Limited Funding24 | – | – | 42 | 4.0 |
| Indigenous Affairs (Total) | 289 | 86 | 256 | 93.5 |
| Infrastructure (Base) | 161 | 81 | 154 | 372.9 |
| Infrastructure — Federal–Provincial Infrastructure Programs25 | 352 | 160 | 227 | 582.5 |
| Infrastructure — Waterfront Toronto Revitalization (Port Lands Flood Protection) | – | 116 | 103 | 155.6 |
| Infrastructure — Municipal Infrastructure Program Investments26 | – | – | 197 | 400.0 |
| Infrastructure — COVID‑19 Time-Limited Funding27 | – | – | – | 233.5 |
| Infrastructure (Total) | 512 | 358 | 682 | 1,744.5 |
| Labour, Training and Skills Development (Base) | 175 | 121 | 161 | 189.3 |
| Labour, Training and Skills Development — Training Tax Credits (Co-operative Education and Apprenticeship Training)28 | 183 | 152 | 98 | 88.9 |
| Labour, Training and Skills Development — Demand-Driven Employment and Training Programs | 943 | 922 | 1,142 | 1,171.2 |
| Labour, Training and Skills Development — COVID‑19 Time-Limited Funding29 | – | – | 33 | 579.4 |
| Labour, Training and Skills Development (Total) | 1,301 | 1,194 | 1,434 | 2,028.7 |
| Long-Term Care (Total)30 | 4,329 | 4,423 | 4,513 | 5,779.0 |
| Municipal Affairs and Housing (Base) | 474 | 540 | 485 | 480.9 |
| Municipal Affairs and Housing — Time-Limited Investments | 636 | 317 | 224 | 349.2 |
| Municipal Affairs and Housing — Social Housing Agreement — Payments to Service Managers31 | 367 | 341 | 313 | 284.5 |
| Municipal Affairs and Housing — COVID‑19 Time-Limited Funding32 | – | – | 2,707 | 317.7 |
| Municipal Affairs and Housing (Total) | 1,477 | 1,197 | 3,729 | 1,432.3 |
| Natural Resources and Forestry (Base) | 500 | 529 | 507 | 574.0 |
| Natural Resources and Forestry — One-Time Accounting Adjustment for Landfills | – | – | 202 | – |
| Natural Resources and Forestry — Emergency Forest Firefighting | 208 | 136 | 115 | 200.0 |
| Natural Resources and Forestry — COVID‑19 Time-Limited Funding33 | – | – | 13 | – |
| Natural Resources and Forestry (Total) | 708 | 665 | 837 | 774.0 |
| Seniors and Accessibility (Base) | 51 | 52 | 55 | 66.5 |
| Seniors and Accessibility — Time-Limited Investments | – | – | – | 9.1 |
| Seniors and Accessibility — COVID‑19 Time-Limited Funding34 | – | – | 151 | 27.0 |
| Seniors and Accessibility (Total) | 51 | 52 | 206 | 102.7 |
| Solicitor General (Base) | 2,670 | 2,763 | 2,825 | 3,122.4 |
| Solicitor General — COVID‑19 Time-Limited Funding35 | – | – | 94 | 4.0 |
| Solicitor General (Total) | 2,670 | 2,763 | 2,919 | 3,126.4 |
| Transportation (Base)36 | 4,536 | 4,950 | 4,668 | 5,541.6 |
| Transportation — Federal–Provincial Infrastructure Programs | 297 | 188 | 449 | 702.9 |
| Transportation — COVID‑19 Time-Limited Funding37 | – | – | 2,188 | 345.4 |
| Transportation (Total) | 4,833 | 5,138 | 7,306 | 6,589.9 |
| Treasury Board Secretariat (Base) | 227 | 214 | 217 | 411.4 |
| Treasury Board Secretariat — Employee and Pensioner Benefits38 | 1,165 | 1,665 | 1,485 | 1,766.5 |
| Treasury Board Secretariat — Operating Contingency Fund | – | – | – | 1,235.5 |
| Treasury Board Secretariat — Capital Contingency Fund | – | – | – | 165.3 |
| Treasury Board Secretariat — COVID‑19 Time-Limited Funding39 | – | – | 3 | – |
| Treasury Board Secretariat (Total) | 1,392 | 1,879 | 1,705 | 3,578.8 |
| Interest on Debt40 | 12,384 | 12,495 | 12,274 | 12,971.0 |
| Total Expense | 161,135 | 164,768 | 181,297 | 189,115.4 |
Table 3.10 footnotes:
[1] On June 18, 2021, the Premier announced changes to the Executive Council that led to the establishment of new ministries as well as the transfer of responsibilities between ministries. The corresponding changes to the new government structure will be reflected in future publications.
[2], [3], [25], [26] Municipal and Federal–Provincial Infrastructure Program delivery transferred from the Ontario Ministry of Agriculture, Food and Rural Affairs to the Ontario Ministry of Infrastructure in 2020–21.
[4] The 2019–20 amount includes extraordinary production insurance payout of $175 million above annual forecast due to 2019 crop conditions.
[5], [6], [7], [8], [9], [11], [13], [14], [15], [17], [18], [19], [20], [23], [24], [27], [29], [32], [33], [34], [35], [37], [39] One-time COVID‑19-related spending has been presented as part of COVID‑19 Time-Limited Funding; see Table 3.7. For details on time-limited funding and contingencies, see Table 3.8.
[10], [38] Numbers reflect the pension expense that was calculated based on recommendations of the Independent Financial Commission of Inquiry, as described in Note 19 to the Consolidated Financial Statements in Public Accounts of Ontario, 2017–2018.
[12], [36] Ontario Northland Transportation Commission transferred from the Ontario Ministry of Energy, Northern Development and Mines to the Ontario Ministry of Transportation beginning in 2020–21.
[16] Based on the requirements of Public Sector Accounting Standards, the Province consolidates the Investment Management Corporation of Ontario into the Ontario Ministry of Finance.
[21] Includes accounting adjustments tied primarily to grants provided for infrastructure projects and other related investments.
[22] For presentation purposes in the 2021 Economic Outlook and Fiscal Review, time-limited COVID‑19-related spending has been included separately instead of within the Ontario Ministry of Health and Ontario Ministry of Long-Term Care. This change in presentation does not impact ministry allocations, which reflect the ministry structure(s) presented in the 2021–22 Expenditure Estimates.
[28] The Co-operative Education Tax Credit remains in effect. The Apprenticeship Training Tax Credit is eliminated for eligible apprenticeship programs that commenced on or after November 15, 2017. Amounts from 2018–19 to 2020–21 include tax credit amounts related to prior years.
[30] Ontario Ministry of Long-Term Care total includes expenses incurred by Ontario Health for funding for long-term care. These amounts will be consolidated in the total expense of the Ontario Ministry of Health, including $4.2 billion in 2020–21 and $5.6 billion in 2021–22.
[31] The annual decline from 2018–19 to 2021–22 is mainly due to declining federal obligations, such as maturing mortgages, under the Social Housing Agreement.
[40] Interest on debt is net of interest capitalized during construction of tangible capital assets of $175 million in 2018–19, $245 million in 2019–20, $230 million in 2020–21 and $236 million in 2021–22.
Note: Numbers may not add due to rounding.
Sources: Ontario Treasury Board Secretariat and Ontario Ministry of Finance.
| Sector | Total Infrastructure Expenditures 2020–21 Actual1 |
2021–22 Current Outlook Investment in Capital Assets2,3 |
2021–22 Current Outlook Transfers and Other Infrastructure Expenditures4 |
2021–22 Current Outlook Total Infrastructure Expenditures |
|---|---|---|---|---|
| Transportation — Transit | 5,051 | 4,216 | 1,426 | 5,642 |
| Transportation — Provincial Highways | 2,653 | 2,487 | 186 | 2,673 |
| Transportation — Other Transportation, Property and Planning | 246 | 107 | 75 | 182 |
| Health — Hospitals | 2,866 | 1,616 | 3 | 1,619 |
| Health — Other Health | 254 | 60 | 244 | 304 |
| Education | 1,987 | 3,285 | 10 | 3,295 |
| Postsecondary Education — Colleges and Other | 311 | 829 | 64 | 893 |
| Postsecondary Education — Universities | 137 | – | 93 | 93 |
| Social | 288 | 18 | 310 | 328 |
| Justice | 260 | 886 | 105 | 991 |
| Other Sectors5 | 1,375 | 1,034 | 1,876 | 2,911 |
| Total Infrastructure Expenditures | 15,428 | 14,539 | 4,393 | 18,932 |
| Less: Other Partner Funding6 | 2,489 | 1,765 | – | 1,765 |
| Total7 | 12,939 | 12,774 | 4,393 | 17,167 |
Table 3.11 footnotes:
[1] Includes adjustments for the net book value of assets disposed during the year, as well as changes in valuation.
[2] Includes provincial investment in capital assets of $11.9 billion.
[3] Includes $236 million in interest capitalized during construction.
[4] Includes transfers to municipalities, universities and non-consolidated agencies.
[5] Includes broadband infrastructure, government administration, natural resources, and the culture and tourism industries.
[6] Other Partner Funding refers to third-party investments primarily in hospitals, colleges and schools.
[7] Includes Federal/Municipal contributions to provincial infrastructure investments.
Note: Numbers may not add due to rounding.
Source: Ontario Treasury Board Secretariat.
| 2012–13 | 2013–14 | 2014–15 | 2015–16 | 2016–17 | 2017–18 | 2018–19 | 2019–20 | Actual 2020–21 |
Current Outlook 2021–22 |
|
|---|---|---|---|---|---|---|---|---|---|---|
| Revenue | 120,319 | 122,955 | 126,152 | 136,148 | 140,734 | 150,594 | 153,700 | 156,096 | 164,893 | 168,617 |
| Expense — Programs | 120,103 | 123,330 | 126,199 | 129,905 | 131,460 | 142,363 | 148,751 | 152,273 | 169,023 | 176,144 |
| Expense — Interest on Debt3 | 10,878 | 11,155 | 11,221 | 11,589 | 11,709 | 11,903 | 12,384 | 12,495 | 12,274 | 12,971 |
| Total Expense | 130,981 | 134,485 | 137,420 | 141,494 | 143,169 | 154,266 | 161,135 | 164,768 | 181,297 | 189,115 |
| Reserve | – | – | – | – | – | – | – | – | – | 1,000 |
| Surplus/(Deficit) | (10,662) | (11,530) | (11,268) | (5,346) | (2,435) | (3,672) | (7,435) | (8,672) | (16,404) | (21,499) |
| Net Debt | 259,947 | 276,169 | 294,557 | 306,357 | 314,077 | 323,834 | 338,496 | 353,332 | 373,564 | 402,432 |
| Accumulated Deficit | 174,256 | 184,835 | 196,665 | 203,014 | 205,939 | 209,023 | 216,642 | 225,764 | 239,294 | 260,793 |
| Gross Domestic Product (GDP) at Market Prices | 680,791 | 696,192 | 727,042 | 760,435 | 790,749 | 824,979 | 859,079 | 891,811 | 851,176 | 928,122 |
| Primary Household Income | 459,895 | 473,807 | 490,423 | 512,570 | 520,486 | 541,501 | 567,492 | 591,527 | 588,381 | 619,513 |
| Population (000s) — July4 | 13,391 | 13,511 | 13,618 | 13,707 | 13,875 | 14,070 | 14,309 | 14,545 | 14,746 | 14,826 |
| Net Debt per Capita (dollars) | 19,413 | 20,441 | 21,631 | 22,350 | 22,636 | 23,016 | 23,657 | 24,293 | 25,334 | 27,143 |
| Household Income per Capita (dollars) | 34,345 | 35,069 | 36,014 | 37,394 | 37,511 | 38,486 | 39,661 | 40,670 | 39,902 | 41,785 |
| Net Debt as a Per Cent of Revenue | 216.0% | 224.6% | 233.5% | 225.0% | 223.2% | 215.0% | 220.2% | 226.4% | 226.5% | 238.7% |
| Interest on Debt as a Per Cent of Revenue | 9.0% | 9.1% | 8.9% | 8.5% | 8.3% | 7.9% | 8.1% | 8.0% | 7.4% | 7.7% |
| Net Debt as a Per Cent of GDP | 38.2% | 39.7% | 40.5% | 40.3% | 39.7% | 39.3% | 39.4% | 39.6% | 43.9% | 43.4% |
| Accumulated Deficit as a Per Cent of GDP | 25.6% | 26.5% | 27.1% | 26.7% | 26.0% | 25.3% | 25.2% | 25.3% | 28.1% | 28.1% |
Table 3.12 footnotes:
[1] Amounts reflect a change in pension expense that was calculated based on recommendations of the Independent Financial Commission of Inquiry, as described in Note 19 to the Consolidated Financial Statements, in Public Accounts of Ontario 2017–2018. Amounts for net debt and accumulated deficit also reflect this change.
[2] Revenues and expenses have been restated to reflect the following fiscally neutral changes: i) revised presentation of education property taxes to be included in the taxation revenues; ii) reclassification of certain Government Business Enterprises to other government organizations; iii) reclassification of a number of tax measures that provide a financial benefit through the tax system to be reported as expenses; and iv) change in presentation of third-party revenue for hospitals, school boards and colleges to be reported as revenue.
[3] Interest on debt is net of interest capitalized during construction of tangible capital assets of $175 million in 2018–19, $245 million in 2019–20, $230 million in 2020–21 and $236 million in 2021–22.
[4] Population figures are for July 1 of the fiscal year indicated (i.e., for 2017–18, the population on July 1, 2017, is shown).
Note: Numbers may not add due to rounding.
Sources: Statistics Canada, Ontario Treasury Board Secretariat and Ontario Ministry of Finance.
Chart Descriptions
Chart 3.1: 2021 Budget Deficit Outlook Compared to Current Outlook
The bar chart illustrates the deficit outlook presented in the 2021 Budget compared to the current outlook in the 2021 Ontario Economic Outlook and Fiscal Review. The 2021 Budget projected deficits of $33.1 billion in 2021–22, $27.7 billion in 2022–23, and $20.2 billion in 2023–24. With the release of the 2021 Ontario Economic Outlook and Fiscal Review the deficit projections have been revised to $21.5 billion in 2021–22, $19.6 billion in 2022–23, and $12.9 billion in 2023–24.
Source: Ontario Ministry of Finance.
Chart 3.2: Range of Ontario Deficit Outlooks
The bar chart illustrates the range of Ontario deficit outlooks based on the two alternative economic scenarios presented in Chapter 2: Economic Performance and Outlook. The 2021 Ontario Economic Outlook and Fiscal Review deficit outlook estimates the deficit to be $21.5 billion in 2021–22, $19.6 billion in 2022–23 and $12.9 billion in 2023–24. Under the Faster Growth scenario, the deficit is estimated to be $18.7 billion in 2021–22, $13.4 billion in 2022–23 and $4.5 billion in 2023–24. Under the Slower Growth scenario, the deficit is estimated to be $23.1 billion in 2021–22, $24.1 billion in 2022–23 and $19.3 billion in 2023–24.
Source: Ontario Ministry of Finance.
Chart 3.3: Program Expense Growth Excluding COVID‑19 Time-Limited Funding
The bar chart illustrates the growth in program expense excluding COVID‑19 Time-Limited Funding. For 2021–22, COVID‑19 Time-Limited Funding is $10.7 billion while base program expense is $165.5 billion. In 2022–23, COVID‑19 Time-Limited Funding is $3.4 billion while base program expense is $173.0 billion. This represents a year-over-year increase in base program expense of 4.5 per cent. In 2023–24, COVID‑19 Time-Limited Funding is projected to be phased out while base program expense is $175.6 billion. This represents a year-over-year increase in base program expense of 1.5 per cent.
Total expense is $176.1 billion in 2021–22, $176.4 billion in 2022–23 and $175.6 billion in 2023–24.
Sources: Ontario Treasury Board Secretariat and Ontario Ministry of Finance.
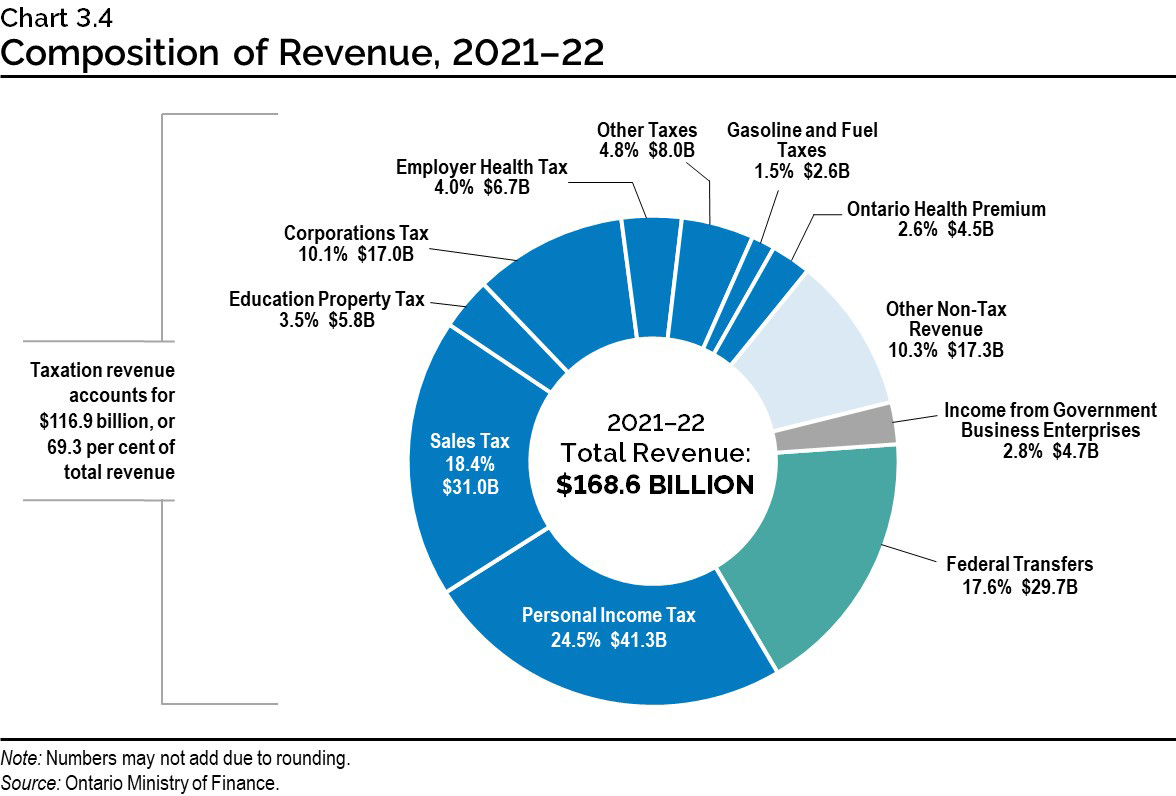
Chart 3.4: Composition of Revenue, 2021–22
The pie chart shows the composition of Ontario’s revenue in 2021–22, which is projected to be $168.6 billion. The largest taxation revenue source is Personal Income Tax revenue at $41.3 billion, accounting for 24.5 per cent of total revenue. This is followed by Sales Tax at $31.0 billion, or 18.4 per cent of total revenue; and Corporations Tax at $17.0 billion, or 10.1 per cent of total revenue. Other components of taxation revenue include Education Property Tax at $5.8 billion, or 3.5 per cent of total revenue; Employer Health Tax at $6.7 billion, or 4.0 per cent; Gasoline and Fuel Taxes at $2.6 billion, or 1.5 per cent; the Ontario Health Premium at $4.5 billion, or 2.6 per cent; and Other Taxes at $8.0 billion, or 4.8 per cent of total revenue.
Total taxation revenue accounts for $116.9 billion, or 69.3 per cent of total revenue.
The other major non-taxation sources of revenue are Federal Transfers of $29.7 billion, or 17.6 per cent of total revenue; Income from Government Business Enterprises at $4.7 billion, or 2.8 per cent of total revenue; and various Other Non-Tax Revenue at $17.3 billion, or 10.3 per cent of total revenue.
Note: Numbers may not add due to rounding.
Source: Ontario Ministry of Finance.
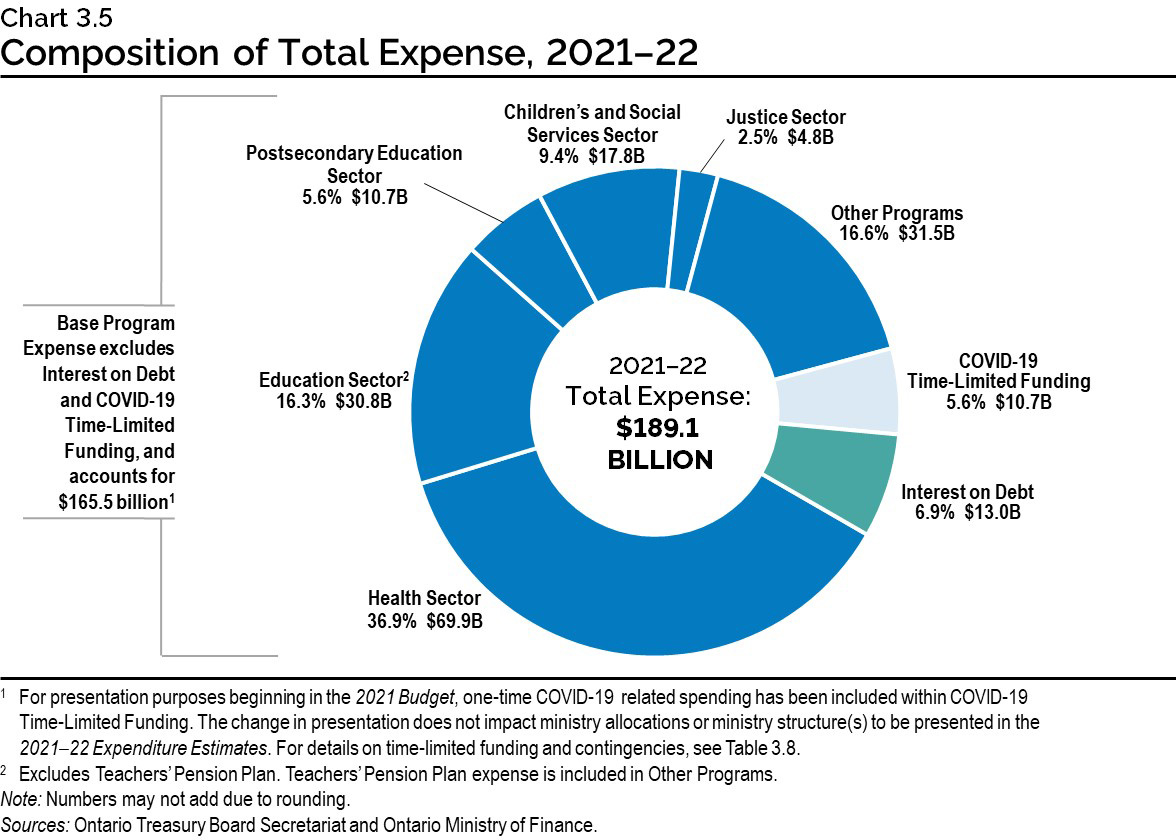
Chart 3.5: Composition of Total Expense, 2021–22
The pie chart shows the share of Ontario’s total expense and dollar amounts by sector in 2021–22.
Total expense in 2021–22 is projected to be $189.1 billion.
Base Program Expense excludes Interest on Debt and COVID‑19 Time-Limited Funding, and accounts for $165.5 billion.1
The largest expense is the Health Sector at $69.9 billion, accounting for 36.9 per cent of total expense.
The remaining sectors of total expense include the Education Sector2 at $30.8 billion or 16.3 per cent; the Postsecondary Education Sector at $10.7 billion or 5.6 per cent; the Children’s and Social Services Sector at $17.8 billion or 9.4 per cent; the Justice Sector at $4.8 billion or 2.5 per cent; Other Programs at $31.5 billion or 16.6 per cent; and COVID‑19 Time-Limited Funding at $10.7 billion or 5.6 per cent. Interest on Debt, included as part of Total Expense, is $13.0 billion or 6.9 per cent.
1 For presentation purposes beginning in the 2021 Budget, one-time COVID‑19 related spending has been included within COVID‑19 Time-Limited Funding. The change in presentation does not impact ministry allocations or ministry structure(s) to be presented in the 2021–22 Expenditure Estimates. For details on time-limited funding and contingencies, see Table 3.8.
2 Excludes the Teachers’ Pension Plan. Teachers’ Pension Plan expense is included in Other Programs.
Note: Numbers may not add due to rounding.
Sources: Ontario Treasury Board Secretariat and Ontario Ministry of Finance.