Introduction
While Ontario experienced strong economic growth through 2021 and in the first half of 2022, there is economic uncertainty on the horizon. As of the second quarter of 2022, Ontario real gross domestic product (GDP) has surpassed the pre-COVID‑19 level by 2.2 per cent. Employment was 141,700 (1.9 per cent) higher in September 2022 than the pre-pandemic level in February 2020.
Ontario’s real GDP is projected to rise 2.6 per cent in 2022, 0.5 per cent in 2023, 1.6 per cent in 2024 and 2.1 per cent in 2025. Forecasts for 2022, 2023 and 2024 have been revised to be lower since the 2022 Budget. For the purposes of prudent fiscal planning, these projections are set slightly below the average of private‐sector forecasts.
| 2021 | 2022p | 2023p | 2024p | 2025p | |
|---|---|---|---|---|---|
| Real GDP Growth | 4.3 | 2.6 | 0.5 | 1.6 | 2.1 |
| Nominal GDP Growth | 11.9 | 9.2 | 3.5 | 3.8 | 4.1 |
| Employment Growth | 4.9 | 4.4 | 0.5 | 1.3 | 1.5 |
| CPI Inflation | 3.5 | 6.9 | 3.4 | 2.3 | 2.0 |
Table 2.1 footnotes:
p = Ontario Ministry of Finance planning projection based on external sources as of September 29, 2022.
Sources: Statistics Canada and Ontario Ministry of Finance.
Revisions to the Outlook Since the 2022 Budget
The outlook over the 2022 to 2025 period has been revised compared to the projections in the 2022 Budget. Key changes since the 2022 Budget include:
- Faster growth in nominal GDP in 2022 and slower growth in 2023 and 2024;
- Slower growth in real GDP from 2022 to 2024;
- Higher job creation in 2022, but lower job growth in 2023 and 2024;
- Higher Consumer Price Index (CPI) inflation from 2022 to 2024; and
- Weaker home resales in 2022 and 2023.
| 2022p: 2022 Budget |
2022p: 2022 FES |
2023p: 2022 Budget |
2023p: 2022 FES |
2024p: 2022 Budget |
2024p: 2022 FES |
2025p: 2022 Budget |
2025p: 2022 FES |
|
|---|---|---|---|---|---|---|---|---|
| Real Gross Domestic Product | 3.7 | 2.6 | 3.1 | 0.5 | 2.0 | 1.6 | 1.9 | 2.1 |
| Nominal Gross Domestic Product | 6.7 | 9.2 | 5.1 | 3.5 | 4.2 | 3.8 | 4.1 | 4.1 |
| Compensation of Employees | 5.6 | 8.9 | 4.6 | 5.1 | 4.6 | 5.4 | 4.1 | 4.6 |
| Net Operating Surplus — Corporations | 4.6 | 4.8 | 5.8 | 1.0 | 1.6 | 1.1 | 4.2 | 2.7 |
| Nominal Household Consumption | 8.8 | 11.5 | 6.3 | 4.9 | 4.7 | 4.6 | 4.6 | 4.3 |
| Other Economic Indicators — Employment | 3.9 | 4.4 | 2.0 | 0.5 | 1.7 | 1.3 | 1.2 | 1.5 |
| Other Economic Indicators — Job Creation (000s) | 287 | 324 | 153 | 38 | 133 | 100 | 95 | 117 |
| Other Economic Indicators — Unemployment Rate (Per Cent) | 6.1 | 5.7 | 5.7 | 6.3 | 5.6 | 6.3 | 5.5 | 6.1 |
| Other Economic Indicators — Consumer Price Index | 4.7 | 6.9 | 2.5 | 3.4 | 2.1 | 2.3 | 2.1 | 2.0 |
| Other Economic Indicators — Housing Starts (000s) | 86.9 | 86.6 | 84.0 | 76.9 | 87.3 | 77.8 | 87.8 | 85.1 |
| Other Economic Indicators — Home Resales | (11.3) | (31.7) | 1.5 | (14.0) | 1.2 | 16.5 | 1.2 | 1.2 |
| Other Economic Indicators — Home Resale Prices | 9.3 | 5.4 | 2.6 | (8.1) | 4.0 | 1.2 | 4.0 | 4.0 |
| Key External Variables — U.S. Real Gross Domestic Product | 3.7 | 1.6 | 2.6 | 0.2 | 2.1 | 1.5 | 2.0 | 2.1 |
| Key External Variables — WTI Crude Oil ($US per Barrel) | 82 | 97 | 75 | 90 | 67 | 83 | 68 | 79 |
| Key External Variables — Canadian Dollar (Cents US) | 79.5 | 77.5 | 79.5 | 77.2 | 79.2 | 78.1 | 80.0 | 79.4 |
| Key External Variables — Three-Month Treasury Bill Rate1 | 0.9 | 2.1 | 1.7 | 3.7 | 2.0 | 2.8 | 2.1 | 2.5 |
| Key External Variables — 10-Year Government Bond Rate2 | 2.0 | 2.9 | 2.5 | 3.2 | 2.8 | 3.2 | 2.9 | 3.2 |
Table 2.2 footnotes:
p = Ontario Ministry of Finance planning projection based on external sources as of September 29, 2022.
[1], [2] Government of Canada interest rates (per cent).
Sources: Statistics Canada; Canada Mortgage and Housing Corporation; Canadian Real Estate Association; Bank of Canada; United States Bureau of Economic Analysis; Blue Chip Economic Indicators (October 2022); U.S. Energy Information Administration; and Ontario Ministry of Finance.
Recent Economic Performance
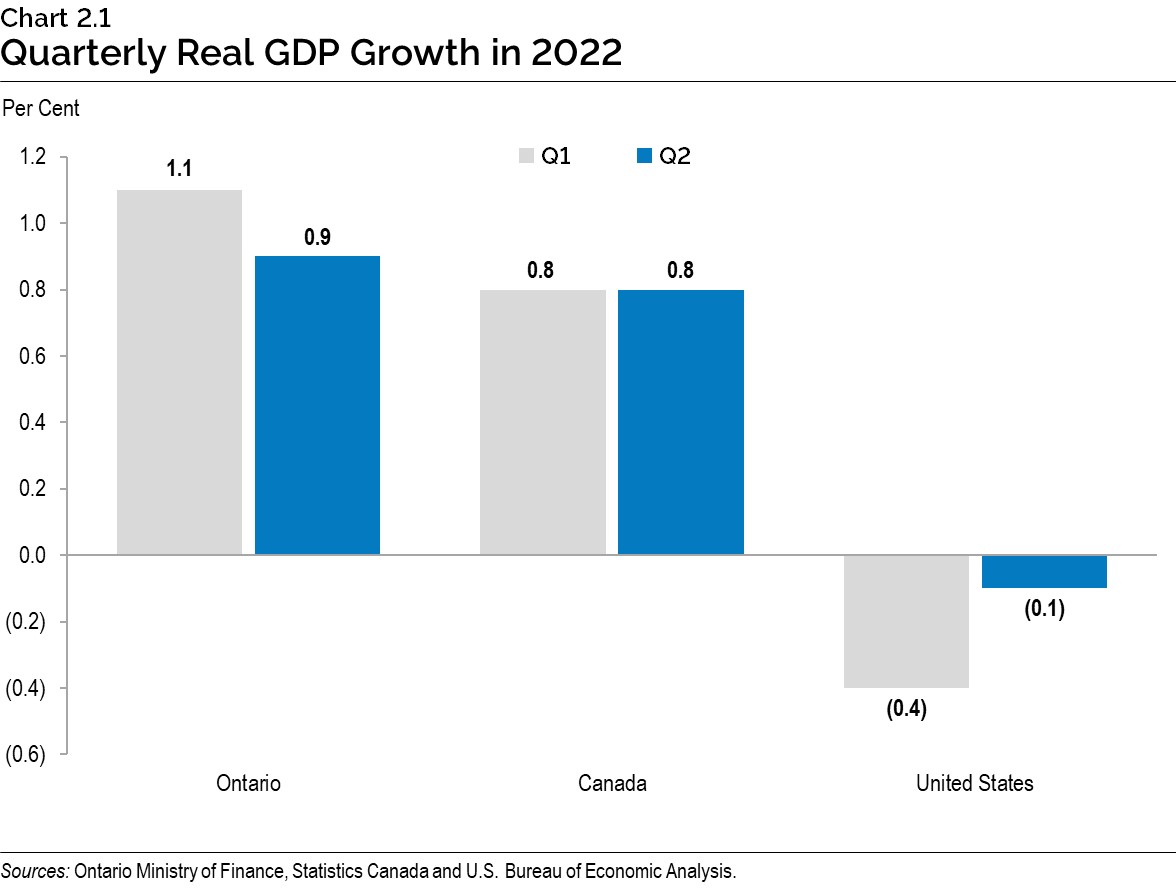
Ontario’s economy continued to grow over the first half of 2022, outpacing growth in both Canada and the United States. Ontario real GDP advanced by 1.1 per cent in the first quarter of 2022, followed by a gain of 0.9 per cent in the second quarter. Growth has been supported by consumer spending along with stronger exports. Ontario real GDP has surpassed the pre-pandemic level by 2.2 per cent.
Canada’s real GDP grew by 0.8 per cent in both the first and second quarters of 2022 and is 1.7 per cent higher than the pre-pandemic level.
The U.S. economy weakened over the first half of the year, with real GDP declines of 0.4 per cent in the first quarter and 0.1 per cent in the second quarter. As of the second quarter of 2022, U.S. real GDP is 3.5 per cent above the pre-pandemic level.
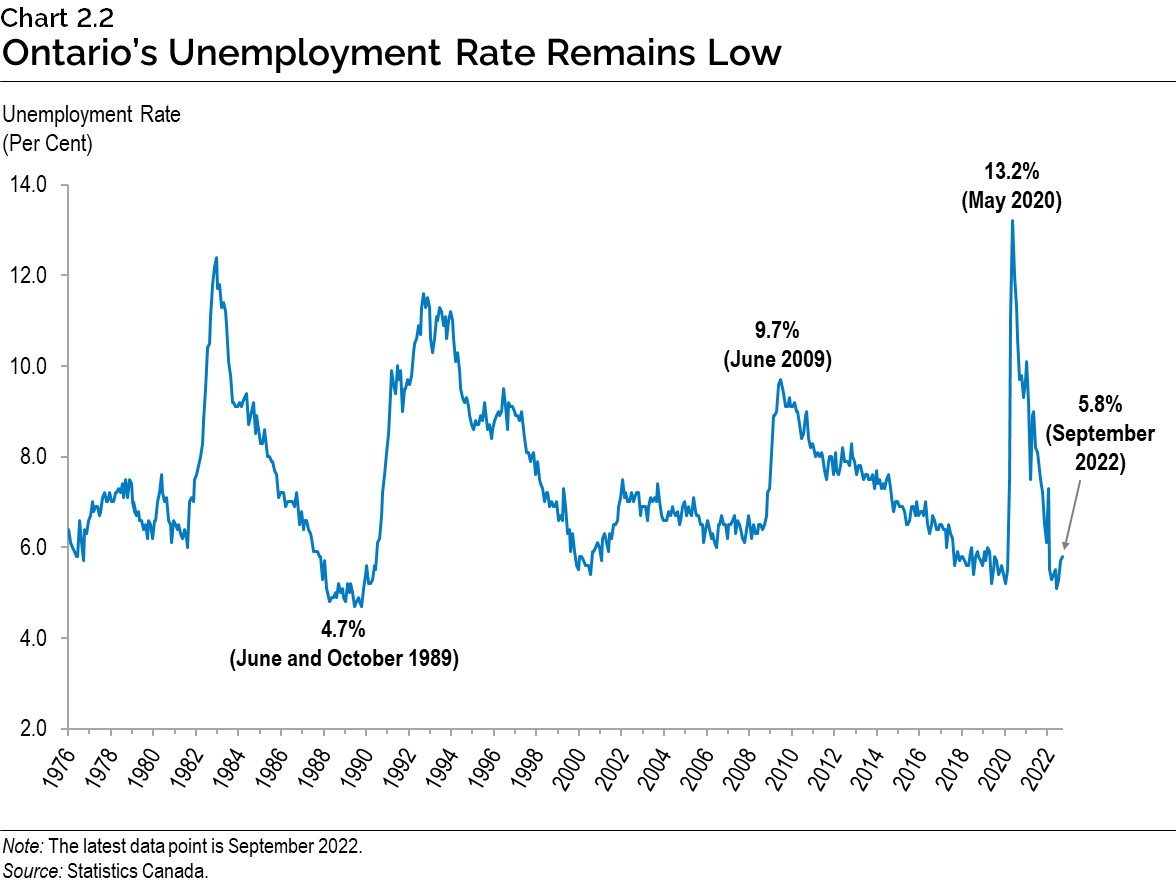
The Ontario labour market remains strong, with high levels of employment and a low unemployment rate. At 5.8 per cent in September 2022, Ontario’s unemployment rate remains near a historic low.
Consumer Price Inflation
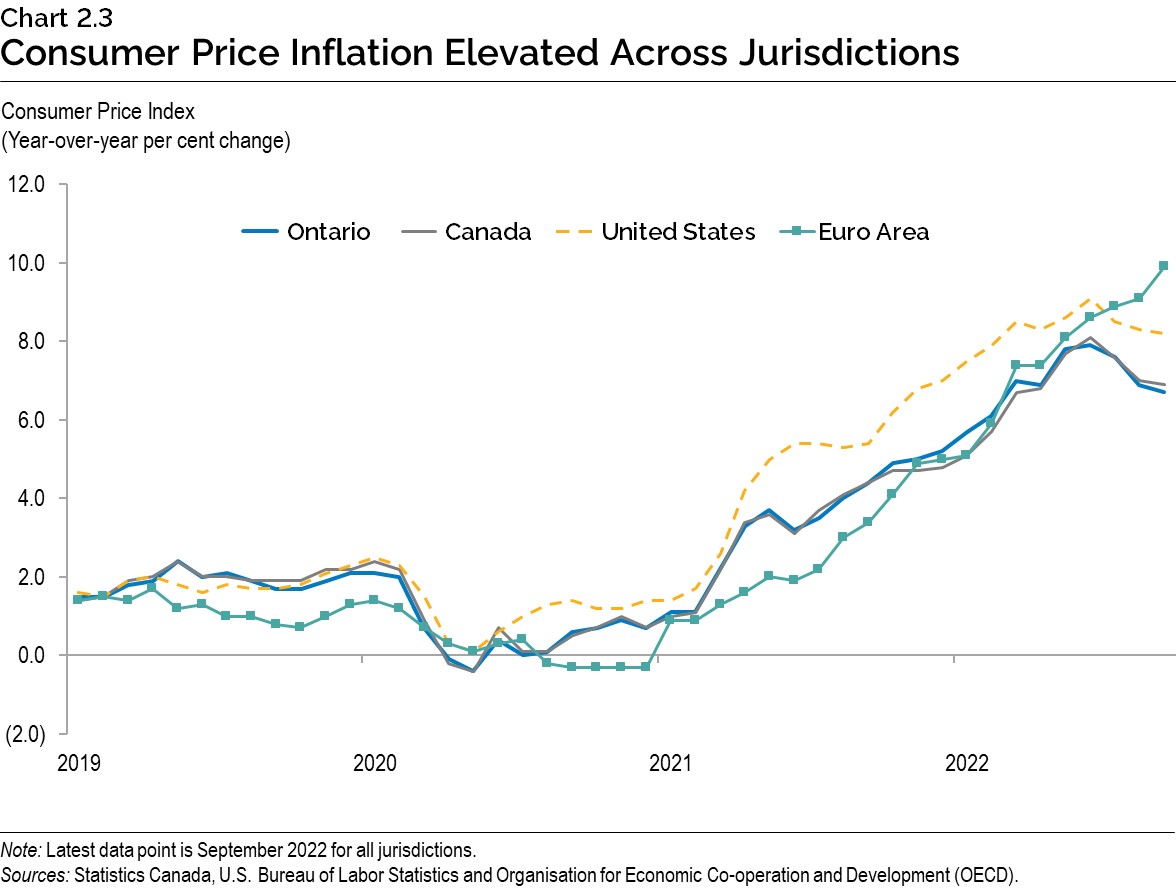
Many jurisdictions around the world are experiencing elevated inflation driven by the economic recovery from the COVID‑19 pandemic that was aided by unprecedented monetary policy support, global supply-chain disruptions and the impact on commodity markets related to the war in Ukraine. Higher than expected inflation has led many central banks, including the Bank of Canada, to raise interest rates to slow inflation.
In 2022, consumer price inflation in Ontario nearly reached a 40-year high, but has begun moderating in recent months, down to 6.7 per cent (year-over-year) in September from a peak of 7.9 per cent in June.
Economic Outlook
The Ontario Ministry of Finance regularly consults with private-sector economists and continually tracks their forecasts to inform the government’s planning assumptions.
Private-sector forecasters, on average, are projecting that Ontario’s real GDP will grow by 3.0 per cent in 2022, 0.6 per cent in 2023, 1.7 per cent in 2024, and 2.2 per cent in 2025. Forecasts for 2022, 2023 and 2024 have been revised lower since the 2022 Budget. The Ontario Ministry of Finance’s real GDP projections are set below the average of private-sector forecasts in each year for prudent planning purposes.
| 2022 | 2023 | 2024 | 2025 | |
|---|---|---|---|---|
| Stokes Economics (July) | 3.3 | 1.6 | 2.2 | 2.3 |
| Royal Bank of Canada (September) | 3.2 | 0.3 | – | – |
| Scotiabank (September) | 3.2 | 1.0 | – | – |
| National Bank of Canada (September) | 3.1 | 0.9 | – | – |
| Laurentian Bank Securities (September) | 3.0 | 1.2 | 1.4 | – |
| TD Bank Group (September) | 2.9 | 0.7 | 1.0 | 1.7 |
| Desjardins Group (September) | 2.9 | (0.1) | 1.5 | 2.1 |
| BMO Capital Markets (September) | 2.9 | (0.4) | – | – |
| The Conference Board of Canada (September) | 3.2 | 1.1 | 2.9 | 2.0 |
| CIBC Capital Markets (September) | 2.8 | 0.3 | 1.3 | – |
| Central 1 Credit Union(September) | 2.6 | 1.0 | 1.5 | – |
| Quantitative Economic Decisions, Inc. (September) | 3.0 | 0.2 | 1.0 | 2.3 |
| University of Toronto (September) | 3.4 | 0.7 | 2.5 | 2.9 |
| Private-Sector Survey Average | 3.0 | 0.6 | 1.7 | 2.2 |
| Ontario’s Planning Assumption | 2.6 | 0.5 | 1.6 | 2.1 |
Table 2.3 footnotes:
Sources: Ontario Ministry of Finance Survey of Forecasters (September 29, 2022) and Ontario Ministry of Finance.
Private-sector forecasters, on average, are projecting that Ontario’s nominal GDP will grow by 9.6 per cent in 2022, 3.6 per cent in 2023, 3.9 per cent in 2024, and 4.2 per cent in 2025. The Ontario Ministry of Finance’s nominal GDP projections are set below the average of private-sector forecasts in each year for prudent planning purposes.
| 2022 | 2023 | 2024 | 2025 | |
|---|---|---|---|---|
| Stokes Economics (July) | 9.1 | 5.0 | 4.8 | 4.2 |
| Royal Bank of Canada (September) | 9.3 | 3.2 | – | – |
| Scotiabank (September) | 10.1 | 3.8 | – | – |
| National Bank of Canada (September) | 9.1 | 2.4 | – | – |
| Laurentian Bank Securities (September) | 8.6 | 4.1 | 3.6 | – |
| TD Bank Group (September) | 9.5 | 5.0 | 3.2 | 3.7 |
| Desjardins Group (September) | 10.8 | 2.1 | – | – |
| BMO Capital Markets (September) | 9.4 | 3.1 | – | – |
| The Conference Board of Canada (September) | 10.2 | 3.4 | 4.5 | 3.2 |
| CIBC Capital Markets (September) | 8.8 | 2.0 | 3.5 | – |
| Central 1 Credit Union (September) | 9.5 | 3.6 | 2.9 | – |
| Quantitative Economic Decisions, Inc. (September) | 9.5 | 6.0 | 4.0 | 4.9 |
| University of Toronto (September) | 11.1 | 3.2 | 4.5 | 4.8 |
| Private-Sector Survey Average | 9.6 | 3.6 | 3.9 | 4.2 |
| Ontario’s Planning Assumption | 9.2 | 3.5 | 3.8 | 4.1 |
Table 2.4 footnotes:
Sources: Ontario Ministry of Finance Survey of Forecasters (September 29, 2022) and Ontario Ministry of Finance.
Global Economic Environment
Global economic growth expectations have eased since the beginning of 2022 due to higher-than-expected inflation and rising interest rates, slower-than-expected growth in China and the continued impact of the war in Ukraine. The International Monetary Fund projects global real GDP growth of 3.2 per cent in 2022 and 2.7 per cent in 2023, down from growth of 4.4 per cent in 2022 and 3.8 per cent in 2023 that was forecast in January.
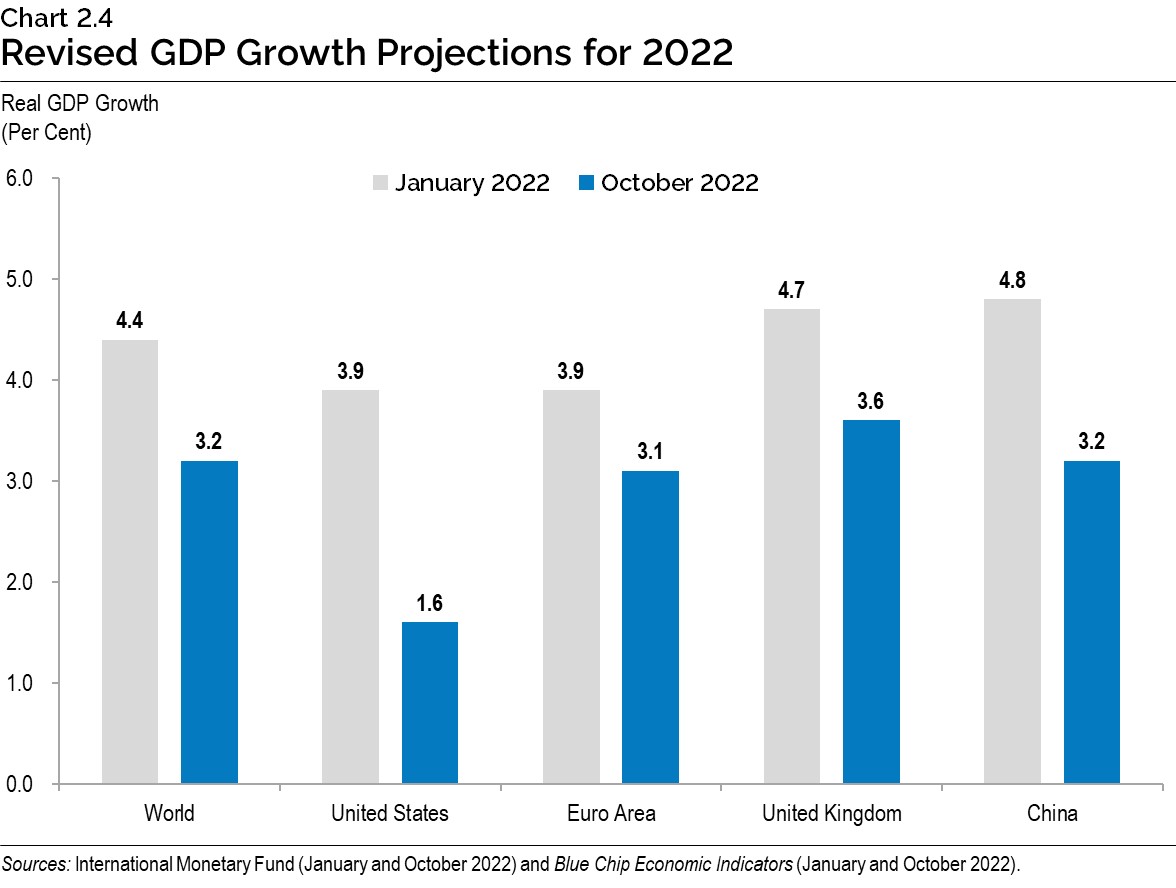
U.S. real GDP is projected to increase by 1.6 per cent in 2022 and 0.2 per cent in 2023. Euro area real GDP is projected to rise 3.1 per cent in 2022 and 0.5 per cent in 2023. China’s real GDP is forecast to rise 3.2 per cent in 2022 and 4.4 per cent in 2023.
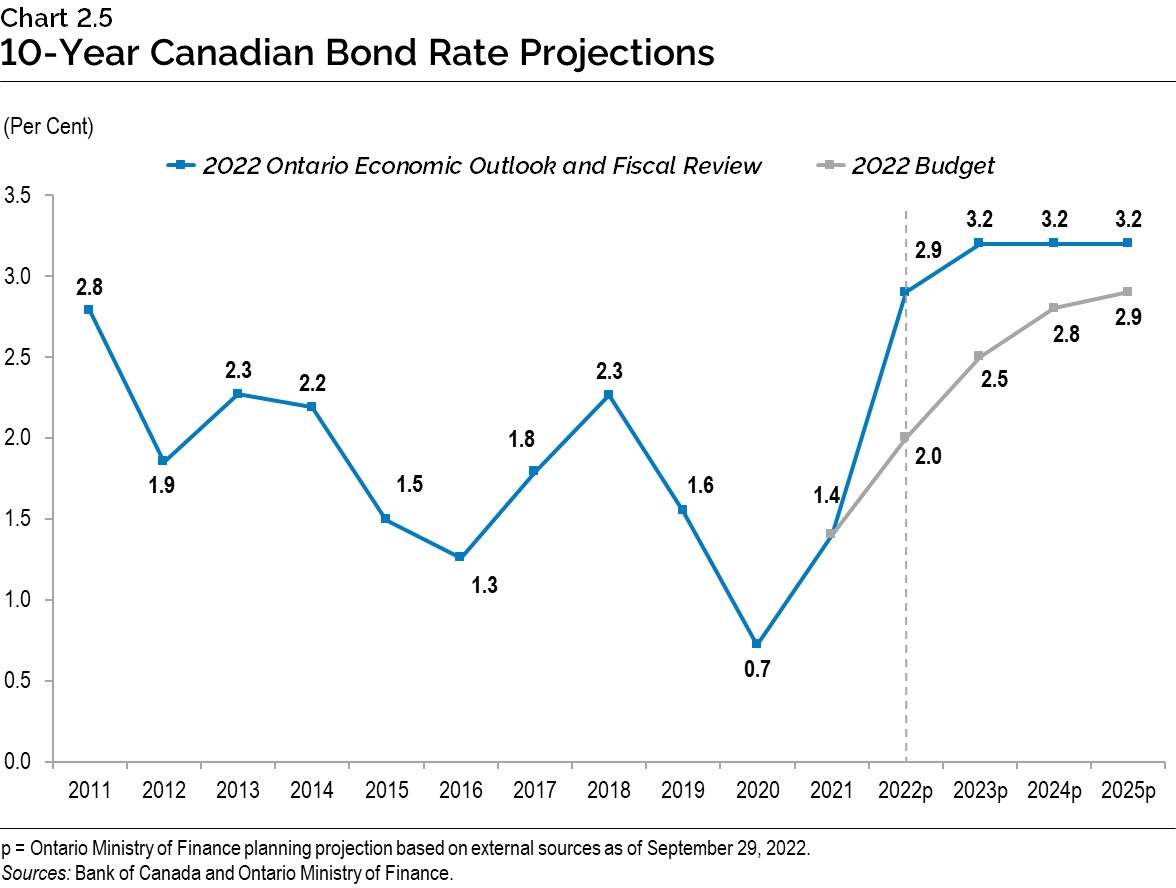
High inflation has prompted central banks in many countries to raise policy interest rates, putting upward pressure on government bond rates. The Bank of Canada this year raised its target overnight rate from 0.25 per cent to 3.25 per cent and has signaled further increases are expected. The Government of Canada three-month treasury bill rate is expected to rise from 0.1 per cent in 2021 to 2.1 per cent in 2022 and then 3.7 per cent in 2023 before moderating to 2.5 per cent in 2025. Similarly, the Government of Canada 10-year bond rate is projected to increase from 1.4 per cent in 2021 to 2.9 per cent in 2022, rise to 3.2 per cent in 2023 and remain at 3.2 per cent into 2025.
Rising demand and tight supply conditions helped global crude oil prices increase from their
COVID‑19 pandemic-era lows, however the easing global economic growth outlook has helped soften prices recently. West Texas Intermediate (WTI) crude oil prices are expected to average $US97 per barrel in 2022 before declining over the subsequent years. By 2025, WTI crude oil prices are expected to average $US79 per barrel.
| 2021 | 2022p | 2023p | 2024p | 2025p | |
|---|---|---|---|---|---|
| World Real GDP Growth (Per Cent) | 6.1 | 3.2 | 2.7 | 3.2 | 3.4 |
| U.S. Real GDP Growth (Per Cent) | 5.9 | 1.6 | 0.2 | 1.5 | 2.1 |
| West Texas Intermediate (WTI) Crude Oil ($US per Barrel) | 68 | 97 | 90 | 83 | 79 |
| Canadian Dollar (Cents US) | 79.8 | 77.5 | 77.2 | 78.1 | 79.4 |
| Three-Month Treasury Bill Rate1 (Per Cent) | 0.1 | 2.1 | 3.7 | 2.8 | 2.5 |
| 10-Year Government Bond Rate2 (Per Cent) | 1.4 | 2.9 | 3.2 | 3.2 | 3.2 |
Table 2.5 footnotes:
p = Ontario Ministry of Finance planning projection based on external sources as of September 29, 2022.
[1], [2] Government of Canada interest rates.
Sources: International Monetary Fund World Economic Outlook (October 2022); U.S. Bureau of Economic Analysis; U.S. Energy Information Administration; Bank of Canada; Blue Chip Economic Indicators (October 2022); and Ontario Ministry of Finance Survey of Forecasters.
Details of Ontario’s Economic Outlook
The Ontario Ministry of Finance projects that Ontario real GDP will grow by 2.6 per cent in 2022. Real GDP is then projected to rise by 0.5 per cent in 2023, 1.6 per cent in 2024 and 2.1 per cent in 2025. Table 2.6 provides details of the Ontario Ministry of Finance’s economic outlook over the forecast period.
| 2021 | 2022p | 2023p | 2024p | 2025p | |
|---|---|---|---|---|---|
| Real Gross Domestic Product | 4.3 | 2.6 | 0.5 | 1.6 | 2.1 |
| Nominal Gross Domestic Product | 11.9 | 9.2 | 3.5 | 3.8 | 4.1 |
| Compensation of Employees | 9.3 | 8.9 | 5.1 | 5.4 | 4.6 |
| Net Operating Surplus — Corporations | 24.2 | 4.8 | 1.0 | 1.1 | 2.7 |
| Nominal Household Consumption | 7.0 | 11.5 | 4.9 | 4.6 | 4.3 |
| Other Economic Indicators — Employment | 4.9 | 4.4 | 0.5 | 1.3 | 1.5 |
| Other Economic Indicators — Job Creation (000s) | 345 | 324 | 38 | 100 | 117 |
| Other Economic Indicators — Unemployment Rate (Per Cent) | 8.0 | 5.7 | 6.3 | 6.3 | 6.1 |
| Other Economic Indicators — Consumer Price Index | 3.5 | 6.9 | 3.4 | 2.3 | 2.0 |
| Other Economic Indicators — Housing Starts (000s) | 99.6 | 86.6 | 76.9 | 77.8 | 85.1 |
| Other Economic Indicators — Home Resales | 18.6 | (31.7) | (14.0) | 16.5 | 1.2 |
| Other Economic Indicators — Home Resale Prices | 23.6 | 5.4 | (8.1) | 1.2 | 4.0 |
| Key External Variables — U.S. Real Gross Domestic Product | 5.9 | 1.6 | 0.2 | 1.5 | 2.1 |
| Key External Variables — WTI Crude Oil ($US per Barrel) | 68 | 97 | 90 | 83 | 79 |
| Key External Variables — Canadian Dollar (Cents US) | 79.8 | 77.5 | 77.2 | 78.1 | 79.4 |
| Key External Variables — Three-Month Treasury Bill Rate1 | 0.1 | 2.1 | 3.7 | 2.8 | 2.5 |
| Key External Variables — 10-Year Government Bond Rate2 | 1.4 | 2.9 | 3.2 | 3.2 | 3.2 |
Table 2.6 footnotes:
p = Ontario Ministry of Finance planning projection based on external sources as of September 29, 2022.
[1], [2] Government of Canada interest rates (per cent).
Sources: Statistics Canada; Canada Mortgage and Housing Corporation; Canadian Real Estate Association; Bank of Canada; United States Bureau of Economic Analysis; Blue Chip Economic Indicators (October 2022); U.S. Energy Information Administration; and Ontario Ministry of Finance.
Employment
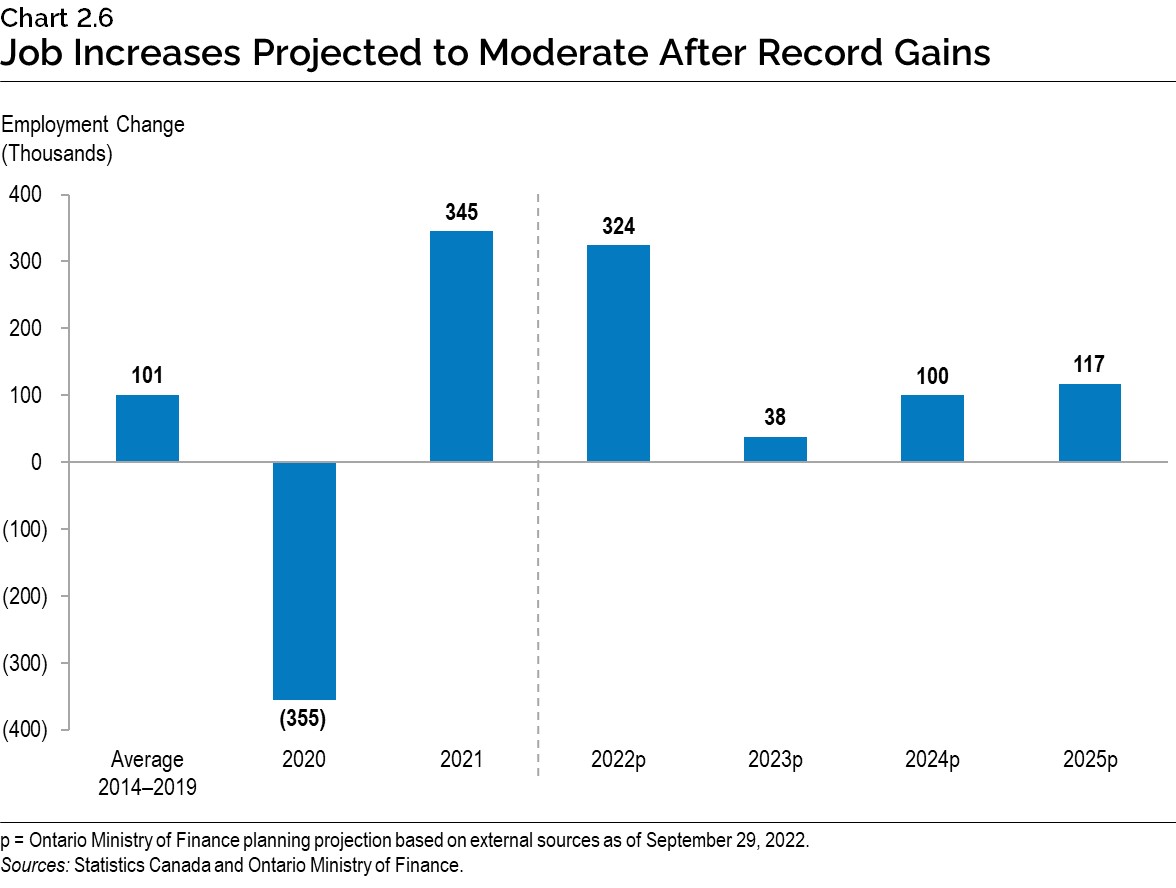
Employment in Ontario is projected to increase by 324,000 or 4.4 per cent in 2022. The unemployment rate is projected to average 5.7 per cent in 2022, down from 8.0 per cent in 2021 and just above the pre-pandemic rate of 5.6 per cent in 2019.
As the pace of economic growth moderates, employment is projected to grow at a slower rate. Employment is forecast to increase by 0.5 per cent in 2023, 1.3 per cent in 2024 and 1.5 per cent in 2025. As labour force growth is expected to outpace employment growth in the second half of 2022 and into 2023, the unemployment rate is projected to rise moderately, averaging 6.3 per cent in 2023 and 2024. Stronger employment gains in 2024 and 2025 are forecast to lower the unemployment rate to 6.1 per cent in 2025.
Household Incomes and Consumption
Household income growth is projected to remain relatively strong, supported by employment growth. However, consumer spending is projected to slow as high inflation and interest rates temper demand, although accumulated household savings will provide some support. Nominal household consumption is projected to grow 11.5 per cent in 2022 and then slow to an annual average of 4.6 per cent from 2023 to 2025.
Consumer Price Inflation
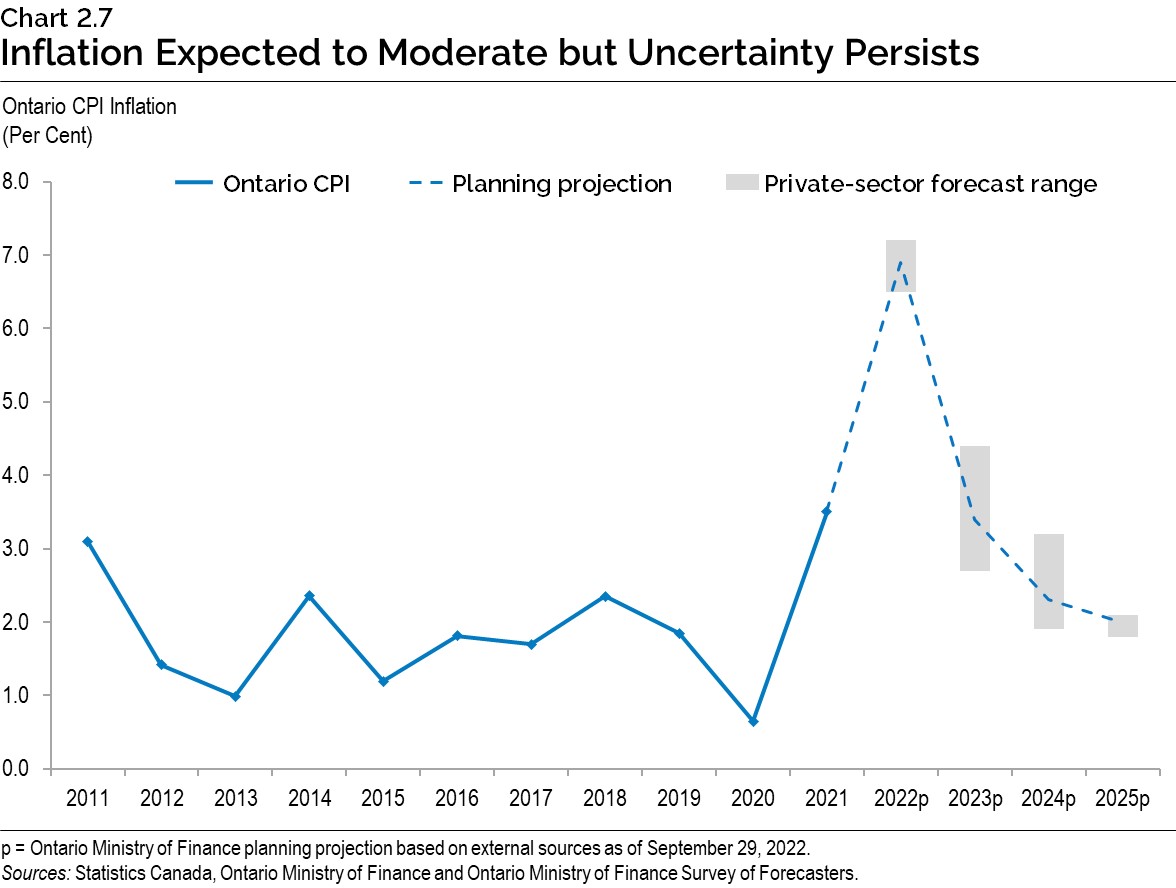
Ontario’s Consumer Price Index (CPI) inflation has exceeded expectations recently, as in many other jurisdictions, due to persistent supply chain issues, steep increases in commodity prices and strong domestic demand. Inflationary pressures have broadened across goods and services. Additionally, expectations for future inflation have risen. The Ontario CPI is projected to increase by 6.9 per cent in 2022, up from 3.5 per cent growth in 2021.
As global economic growth moderates, demand for commodities and other goods should ease and help decrease supply chain bottlenecks. Rising interest rates will slow domestic demand, which should lower price pressures.
The future trajectory of CPI inflation is highly uncertain and dependent on the path of the economy and central bank actions. Private-sector economists have a range of views, with forecasts for 2023 inflation ranging from 2.7 per cent to 4.4 per cent. The range of views narrows to between 1.9 per cent and 3.2 per cent in 2024 and to between 1.8 per cent and 2.1 per cent in 2025. For planning purposes, Ontario is projecting CPI inflation to be 3.4 per cent in 2023 and 2.3 per cent in 2024 before converging to the Bank of Canada’s target rate of 2.0 per cent in 2025.
Housing
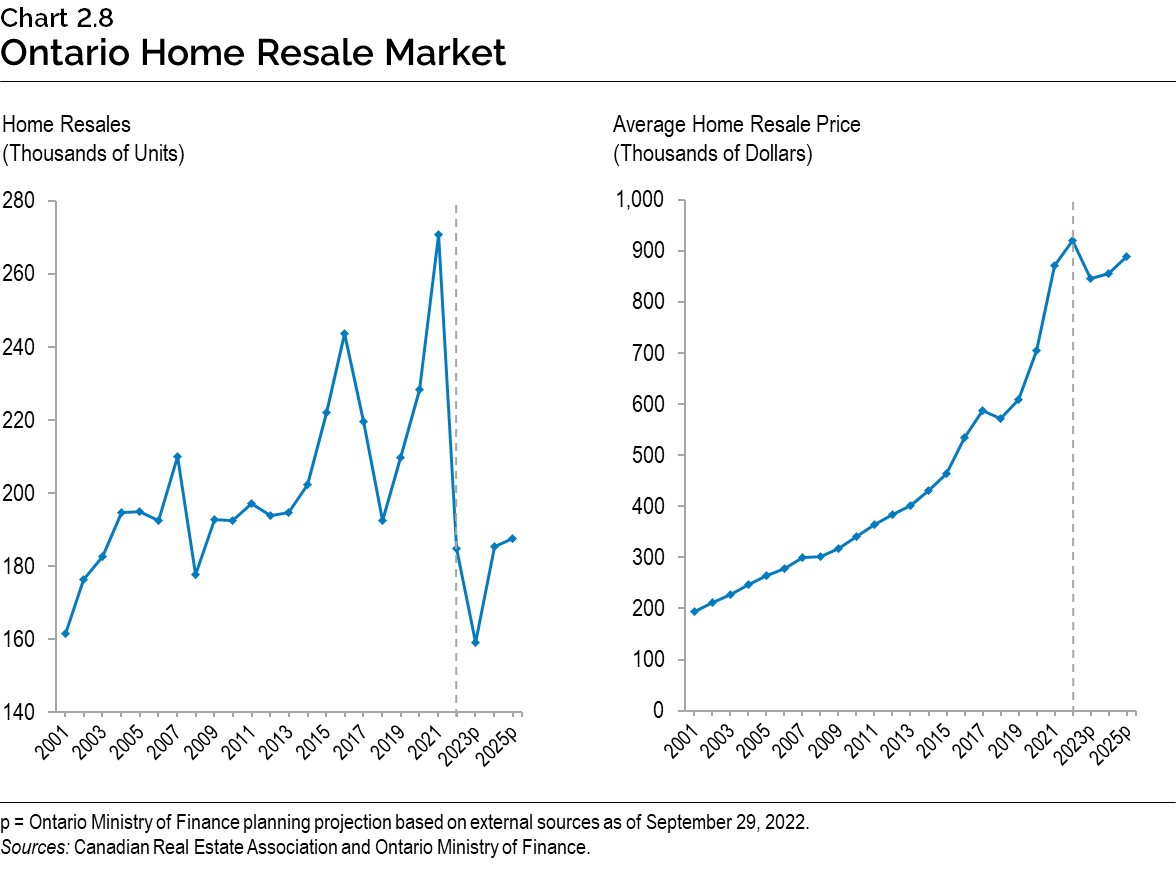
Ontario’s housing market grew strongly in 2021 and into the early months of 2022, in an environment of low interest rates, higher overall incomes, limited resale listings and shifting home preferences. After average home resale prices reached a peak in February 2022, the housing market began adjusting to higher interest rates. As of September, home resales were 41.0 per cent below the February 2022 level, while average home resale prices were 15.5 per cent lower over the same period.
Housing market activity is expected to continue to moderate as interest rate increases impact affordability and overall housing market activity returns to levels more consistent with fundamental drivers of housing demand, such as population growth. The number of Ontario home resales is expected to decline by 31.7 per cent in 2022. Despite recent monthly declines in home prices, strong momentum in late 2021 and early 2022 will support an average annual increase of 5.4 per cent in Ontario average home resale prices in 2022. The moderation in the housing market is projected to continue in 2023 before rebounding in 2024 and 2025.
Risks to the Outlook
Recent elevated levels of consumer price inflation in many jurisdictions around the world have prompted key central banks, including the Bank of Canada, to aggressively tighten monetary policy. If central banks determine that there is a significant risk that consumer and business expectations for elevated inflation are becoming entrenched, they may move even more aggressively and for longer. This represents a significant downside risk for global economies, including for the U.S. economy. Rising interest rates also pose a risk to asset markets, including housing, as prices adjust to reflect changing monetary policy conditions.
Supply chain disruptions and geopolitical risks continue to affect the global economy, including impacts on commodity markets from the invasion of Ukraine by Russia, as well as disruptions to economic activity, primarily in China, from recent outbreaks of COVID‑19. Although supply disruptions are expected to ease, they continue to pose a heightened risk to the global economy, which is compounded by recent disruptions to major commodity markets.
Table 2.7 displays current estimates of the impact of sustained changes in key external factors on Ontario’s real GDP planning assumptions, assuming other external factors are unchanged. The relatively wide range of estimated impacts reflects the uncertainty regarding how the economy could respond to these changes in external conditions.
| Change in Real GDP Growth First Year |
Change in Real GDP Growth Second Year |
|
|---|---|---|
| Canadian Dollar Appreciates by Five Cents US | (0.1) to (0.7) | (0.2) to (0.8) |
| Crude Oil Prices Increase by $10 US per Barrel | (0.1) to (0.3) | (0.1) to (0.3) |
| U.S. Real GDP Growth Increases by One Percentage Point | +0.2 to +0.6 | +0.3 to +0.7 |
| Canadian Interest Rates Increase by One Percentage Point | (0.1) to (0.5) | (0.2) to (0.6) |
Table 2.7 footnotes:
Source: Ontario Ministry of Finance.
Economic Outlook Scenarios
To provide more transparency about the province’s economic outlook amid the elevated degree of economic uncertainty, the Ontario Ministry of Finance has developed Faster Growth and Slower Growth scenarios. These alternative scenarios should not be considered the best case or the worst case, but reasonable possible outcomes in this period of uncertainty.
| 2022p | 2023p | 2024p | 2025p | |
|---|---|---|---|---|
| Faster Growth Scenario | 3.5 | 2.1 | 1.9 | 2.4 |
| Planning Projection | 2.6 | 0.5 | 1.6 | 2.1 |
| Slower Growth Scenario | 2.5 | (0.9) | 1.5 | 2.0 |
Table 2.8 footnotes:
p = Ontario Ministry of Finance planning projection based on external sources and alternative scenarios.
Source: Ontario Ministry of Finance.
| 2022p | 2023p | 2024p | 2025p | |
|---|---|---|---|---|
| Faster Growth Scenario | 10.4 | 5.9 | 4.3 | 4.6 |
| Planning Projection | 9.2 | 3.5 | 3.8 | 4.1 |
| Slower Growth Scenario | 8.8 | 1.3 | 3.5 | 3.8 |
Table 2.9 footnotes:
p = Ontario Ministry of Finance planning projection based on external sources and alternative scenarios.
Source: Ontario Ministry of Finance.
By 2025, the level of real GDP in the Faster Growth scenario is 3.1 per cent higher than in the Planning Projection, while in the Slower Growth scenario, the level of real GDP is 1.7 per cent lower. The nominal GDP scenarios show a wider range of outcomes over the next four years compared to the real GDP scenarios due largely to heightened near-term uncertainty around GDP inflation. By 2025, the level of nominal GDP in the Faster Growth scenario is 4.4 per cent higher than in the Planning Projection, while in the Slower Growth scenario, the level of nominal GDP is 3.0 per cent lower.
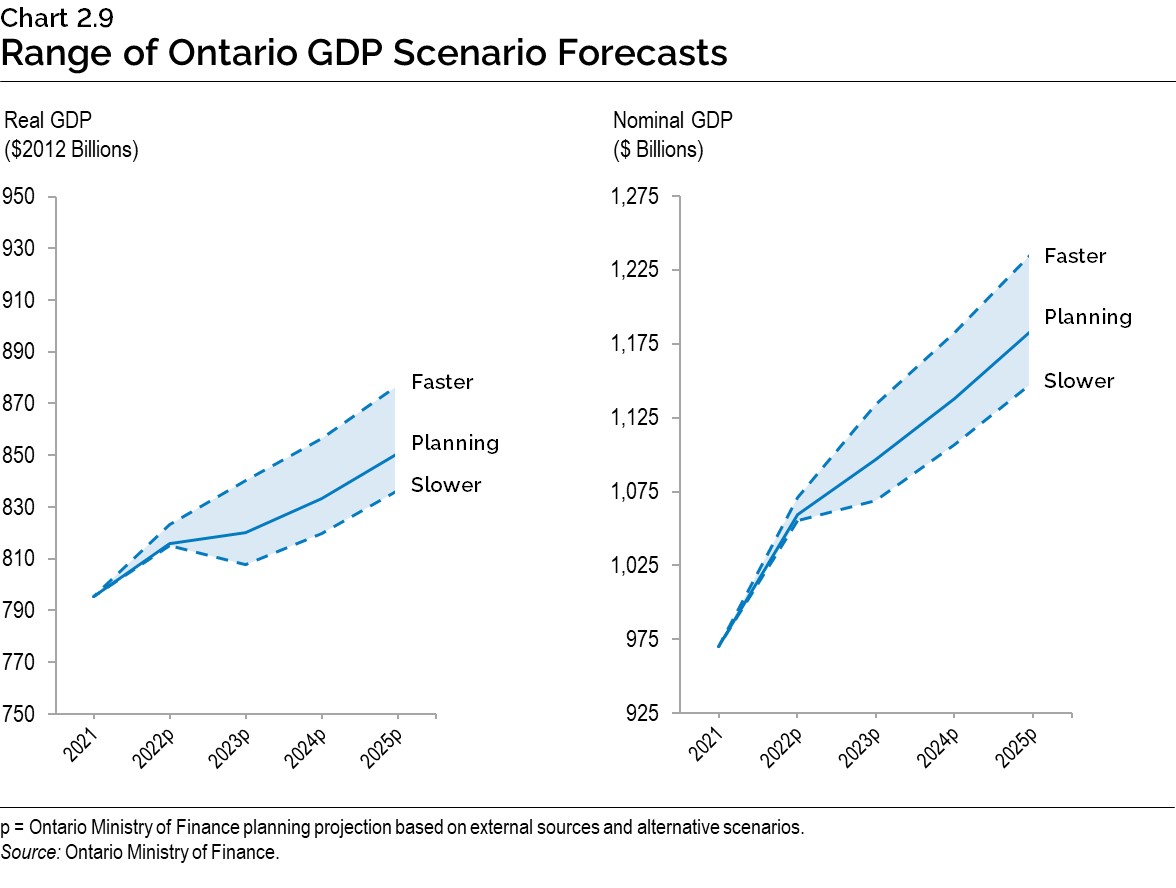
Chart Descriptions
Chart 2.1: Quarterly Real GDP Growth in 2022
This bar chart shows quarterly percentage changes in real GDP for Ontario, Canada and the United States for the first and second quarter of 2022. Ontario real GDP increased 1.1 per cent in the first quarter and 0.9 per cent in the second quarter. Canadian real GDP increased 0.8 per cent in both the first and second quarter. U.S. real GDP declined 0.4 per cent in the first quarter and declined 0.1 per cent in the second quarter.
Source: Ontario Ministry of Finance, Statistics Canada and U.S. Bureau of Economic Analysis.
Chart 2.2: Ontario’s Unemployment Rate Remains Low
This line chart shows Ontario’s unemployment rate from January 1976 to September 2022. The last data point in the series is September 2022, when the unemployment rate was 5.8 per cent. There are only a few times when Ontario’s unemployment rate was generally under 5.8 per cent, including a period from late 1987 to mid-1990, a period from late 1999 to mid-2000 and a period from mid-2017 to early 2020. The unemployment rate has been at or below 5.8 per cent since February 2022. There are call out boxes reading “4.7 per cent (June and October 1989)”, “9.7 per cent (June 2009)”, “13.2 per cent (May 2020)” and “5.8 per cent (September 2022)”.
Source: Statistics Canada.Chart 2.3: Consumer Price Inflation Elevated Across Jurisdictions
This line chart shows the year-over-year per cent change in the Consumer Prince Index for Ontario, Canada, the United States and the Euro Area from January 2019 to September 2022. The four lines generally follow the same pattern. Inflation was generally in the one to two per cent range in 2019, with the Euro Area recording the lowest rates. In early 2020, inflation declined in all jurisdictions to around the zero per cent mark. Inflation began to increase in 2021, and as of September 2022, inflation was 9.9 per cent in the Euro Area, 8.2 per cent the United States, 6.9 per cent in Canada and 6.7 per cent in Ontario.
Sources: Statistics Canada, U.S. Bureau of Labor Statistics and Organisation for Economic Co-operation and Development (OECD).
Chart 2.4: Revised GDP Growth Projections for 2022
This bar chart shows January 2022 and October 2022 projections for 2022 real GDP growth for the world economy, United States, Euro Area, United Kingdom and China. Real GDP growth projections for 2022 have been revised down from 4.4 per cent to 3.2 per cent for the world economy, from 3.9 per cent to 1.6 per cent for the United States, from 3.9 per cent to 3.1 per cent for the Euro Area, from 4.7 per cent to 3.6 per cent for the United Kingdom and from 4.8 per cent to 3.2 per cent for China.
Sources: International Monetary Fund (January and October 2022) and Blue Chip Economic Indicators (January and October 2022).
Chart 2.5: 10-Year Canadian Bond Rate Projections
This line chart shows the 10-year Canadian bond rate from 2011 to 2021 and projections from 2022 to 2025. The highest rate shown was 2.8 per cent in 2011 and the lowest rate is 0.7 per cent in 2020. In other years, the rate ranged from 1.3 per cent to 2.3 per cent. In 2021, the bond rate was 1.4 per cent.
The bond rate is currently projected to be 2.9 per cent in 2022, followed by 3.2 per cent in 2023, 2024 and 2025. These compare to the 2022 Budget projections of 2.0 per cent in 2022, 2.5 per cent in 2023, 2.8 per cent in 2024 and 2.9 per cent in 2025.
Sources: Bank of Canada and Ontario Ministry of Finance.
Chart 2.6: Job Increases Projected to Moderate After Record Gains
This bar chart shows the change in Ontario’s annual employment from 2014 to 2021 and projections from 2022 to 2025. Between 2014 and 2019, Ontario added an average of 101,000 jobs per year, followed by a loss of 355,000 jobs in 2020 and a gain of 345,000 jobs in 2021. Ontario is projected to add 324,000 jobs in 2022, 38,000 jobs in 2023, 100,000 jobs in 2024 and 117,000 jobs in 2025.
Sources: Statistics Canada and Ontario Ministry of Finance.
Chart 2.7: Inflation Expected to Moderate but Uncertainty Persists
This line chart shows Ontario Consumer Price Index (CPI) annual inflation in per cent from 2011 to 2021, as well as projected Ontario CPI inflation for 2022 through 2025. Ontario CPI inflation averaged 1.9 per cent between 2011 and 2019. CPI inflation was 0.7 per cent in 2020 and 3.5 per cent in 2021. Ontario CPI inflation is projected to be 6.9 per cent in 2022, 3.4 per cent in 2023, 2.3 per cent in 2024 and 2.0 per cent 2025.
Bars on the chart show the range of private-sector forecasts for Ontario CPI inflation for 2022 through 2025. Private-sector forecasts range from 6.5 per cent to 7.2 per cent in 2022, 2.7 per cent to 4.4 per cent in 2023, 1.9 per cent to 3.2 per cent in 2024, and 1.8 per cent to 2.1 per cent in 2025.
Sources: Statistics Canada, Ontario Ministry of Finance and Ontario Ministry of Finance Survey of Forecasters (September 29, 2022).
Chart 2.8: Ontario Home Resale Market
The first line chart on the left shows annual home resale units in Ontario from 2001 to 2021 and projected home resale units from 2022 to 2025. In 2001, Ontario home resales were 161,000 units and trended upward, peaking in 2016 at 244,000 units. Home resales then declined to 192,000 in 2018 before rising to 271,000 units in 2021. Home resales are projected to be 185,000 units in 2022, 159,000 units in 2023, 185,000 units in 2024 and 187,000 units in 2025.
The second line chart on the right shows the annual average home resale price in Ontario from 2001 to 2021 and the projected average prices from 2022 to 2025. In 2001, the average home resale price was $194,000 and trended upwards, reaching $872,000 in 2021. The average home resale price is projected to be $919,000 in 2022, $845,000 in 2023, $855,000 in 2024 and $889,000 in 2025.
Note: Projections based on Ontario Ministry of Finance planning projection based on external sources as of September 29, 2022.
Sources: Canadian Real Estate Association and Ontario Ministry of Finance.
Chart 2.9: Range of Ontario GDP Scenario Forecasts
The line chart on the left shows the Ontario Ministry of Finance planning projection for real GDP in billions of 2012 dollars for 2022 to 2025. Separate lines show the levels of real GDP in the Faster Growth and the Slower Growth scenarios for 2022 to 2025. In the Planning Projection, Ontario real GDP is projected to rise from $816 billion in 2022 to $851 billion in 2025. In the Faster Growth Scenario, Ontario real GDP is projected to rise from $823 billion in 2022 to $877 billion in 2025. In the Slower Growth Scenario, Ontario real GDP is projected to rise from $815 billion in 2022 to $836 billion in 2025.
The line chart on the right shows the Ontario Ministry of Finance planning projection for nominal GDP in billions of dollars for 2022 to 2025. Separate lines show the levels of nominal GDP in the Faster Growth and the Slower Growth scenarios for 2022 to 2025. In the planning projection, Ontario nominal GDP is projected to rise from $1,060 billion in 2022 to $1,185 billion in 2025. In the Faster Growth scenario, Ontario nominal GDP is projected to rise from $1,071 billion in 2022 to $1,237 billion in 2025. In the Slower Growth Scenario, Ontario nominal GDP is projected to rise from $1,055 billion in 2022 to $1,149 billion in 2025.
Source: Ontario Ministry of Finance.