Ontario’s Economic and Fiscal Outlook in Brief
Ontario continues to face economic challenges and elevated uncertainty like the rest of the world. The outcomes of ongoing geopolitical instability, high interest rates and inflation continue to be unclear. But after record investments during a worldwide COVID‑19 pandemic, Ontario is on a path to balance the budget, while continuing to invest responsibly to build a strong province. The government is taking this responsible approach to its finances so Ontario can have a strong fiscal foundation now and in the future.
Ontario’s economy has remained resilient and has continued to grow despite ongoing economic uncertainty. Real gross domestic product (GDP) exceeded the COVID‑19 pre-pandemic level by 4.0 per cent as of the third quarter of 2022. Ontario created 338,300 jobs (+4.6 per cent) in 2022, following a gain of 367,400 (+5.2 per cent) net jobs in 2021, which were the two strongest years of job growth on record. Ontario’s unemployment rate is near historic lows.
The government’s plan will balance the budget with the province on track to post a surplus in 2024–25, three years earlier than forecast in the 2022 Budget. In 2022–23, Ontario is projecting a deficit of $2.2 billion. Over the medium term, the government is projecting a deficit of $1.3 billion in 2023–24 before planning for surpluses of $0.2 billion in 2024–25 and $4.4 billion in 2025–26, representing significant fiscal improvement since the 2022 Budget. Elevated uncertainty still remains about the future pace of economic growth, which may impact these projections further.Ontario has shown that it can balance the budget, while making record investments in services the people of Ontario need.
The government will continue to take a responsible, targeted approach with its Plan to Build to support people and businesses while laying a strong fiscal foundation for future generations.
Ontario’s Economic Outlook
Ontario’s real GDP increased by an estimated 3.7 per cent in 2022 and is projected to increase by 0.2 per cent in 2023, 1.3 per cent in 2024, 2.5 per cent in 2025 and 2.4 per cent in 2026. Ontario nominal GDP increased by an estimated 9.4 per cent in 2022, largely reflecting continued elevated GDP inflation due to strong economy‐wide price increases amid supply constraints and strong demand. Nominal GDP is projected to grow by 2.8 per cent in 2023 and accelerate to 3.6 per cent in 2024, 4.6 per cent in 2025 and 4.5 per cent in 2026. For the purposes of prudent fiscal planning, these projections are slightly below the average of private-sector forecasts.
| 2021 | 2022 | 2023p | 2024p | 2025p | 2026p | |
|---|---|---|---|---|---|---|
| Real GDP Growth | 5.2 | 3.7e | 0.2 | 1.3 | 2.5 | 2.4 |
| Nominal GDP Growth | 10.3 | 9.4e | 2.8 | 3.6 | 4.6 | 4.5 |
| Employment Growth | 5.2 | 4.6 | 0.5 | 1.0 | 1.7 | 1.7 |
| CPI Inflation | 3.5 | 6.8 | 3.6 | 2.1 | 2.0 | 2.0 |
Table footnotes:
e = estimate.
p = Ontario Ministry of Finance planning projection based on external sources as of January 30, 2023.
Sources: Statistics Canada and Ontario Ministry of Finance.
Ontario’s Fiscal Plan
The government is projecting a deficit of $1.3 billion in 2023–24, and surpluses of $0.2 billion in 2024–25 and $4.4 billion in 2025–26. This is a significant improvement compared to the forecasts presented in the 2022 Budget.
| Actual 2021–22 |
Interim1 2022–23 |
Medium-Term Outlook 2023–24 |
Medium-Term Outlook 2024–25 |
Medium-Term Outlook 2025–26 |
|
|---|---|---|---|---|---|
| Revenue — Personal Income Tax | 46.8 | 52.8 | 56.0 | 58.7 | 62.0 |
| Revenue — Sales Tax | 30.4 | 35.9 | 35.4 | 36.8 | 38.6 |
| Revenue — Corporations Tax | 25.2 | 27.9 | 24.7 | 25.9 | 28.2 |
| Revenue — Ontario Health Premium | 4.4 | 4.7 | 4.9 | 5.1 | 5.3 |
| Revenue — Education Property Tax | 5.7 | 5.8 | 5.7 | 5.7 | 5.8 |
| Revenue — All Other Taxes | 19.2 | 17.6 | 17.6 | 19.8 | 20.6 |
| Total Taxation Revenue | 131.7 | 144.7 | 144.2 | 152.1 | 160.4 |
| Government of Canada | 30.6 | 31.3 | 34.8 | 35.1 | 37.1 |
| Income from Government Business Enterprises | 6.4 | 6.5 | 6.3 | 6.7 | 8.5 |
| Other Non-Tax Revenue | 16.3 | 18.0 | 19.0 | 19.2 | 20.0 |
| Total Revenue | 185.1 | 200.4 | 204.4 | 213.0 | 226.0 |
| Base Programs2 — Health Sector | 69.6 | 74.9 | 81.0 | 84.2 | 87.6 |
| Base Programs3 — Education Sector4 | 28.8 | 32.4 | 34.7 | 36.1 | 37.5 |
| Base Programs5 — Postsecondary Education Sector | 10.5 | 11.3 | 12.1 | 12.5 | 12.9 |
| Base Programs6 — Children, Community and Social Services Sector | 16.8 | 18.4 | 19.4 | 19.8 | 19.9 |
| Base Programs7 — Justice Sector | 4.7 | 5.5 | 5.4 | 5.4 | 5.3 |
| Base Programs8 — Other Programs | 29.2 | 32.6 | 38.1 | 38.4 | 39.3 |
| Total Base Programs | 159.6 | 175.1 | 190.6 | 196.4 | 202.5 |
| COVID‑19 Time-Limited Funding | 10.9 | 7.8 | – | – | – |
| Other One-Time Expenses | – | 6.3 | – | – | – |
| Total Programs | 170.4 | 189.1 | 190.6 | 196.4 | 202.5 |
| Interest on Debt | 12.6 | 13.4 | 14.1 | 14.4 | 15.1 |
| Total Expense | 183.0 | 202.6 | 204.7 | 210.8 | 217.5 |
| Surplus/(Deficit) Before Reserve | 2.1 | (2.2) | (0.3) | 2.2 | 8.4 |
| Reserve | – | – | 1.0 | 2.0 | 4.0 |
| Surplus/(Deficit) | 2.1 | (2.2) | (1.3) | 0.2 | 4.4 |
| Net Debt as a Per Cent of GDP | 39.8% | 37.8% | 37.8% | 37.7% | 36.9% |
| Net Debt as a Per Cent of Revenue | 205.6% | 197.5% | 198.9% | 197.3% | 190.2% |
| Interest on Debt as a Per Cent of Revenue | 6.8% | 6.7% | 6.9% | 6.8% | 6.7% |
Table footnotes:
[1] Interim represents the 2023 Budget projection for the 2022–23 fiscal year.
[2], [3], [5], [6], [7], [8] For presentation purposes in the 2023 Budget, one-time COVID‑19-related spending in 2021–22 and 2022–23 has been included within COVID‑19 Time-Limited Funding.
[4] Excludes Teachers’ Pension Plan. Teachers’ Pension Plan expense is included in Other Programs.
Note: Numbers may not add due to rounding.
Sources: Ontario Treasury Board Secretariat and Ontario Ministry of Finance.
Revenue Outlook
Ontario’s revenue outlook is anchored by an economic projection based on private-sector forecasts and the best available information at the time of finalizing the planning projection. Details of the medium-term revenue outlook are outlined later in this Budget. See Chapter 3: Ontario’s Fiscal Plan and Outlook for more details.
Key inputs included in the revenue forecast are a prudent economic outlook; existing federal–provincial agreements and funding formulas; and the business plans of government ministries, business enterprises and service organizations.
Program Expense Outlook
Ontario’s program expense outlook is expected to grow from $189.1 billion in 2022–23 to $202.5 billion in 2025–26 to fund the services the people of Ontario need.
The government has made available COVID‑19 Time-Limited Funding to protect Ontario’s progress against COVID‑19, including $7.8 billion in 2022–23. This funding will no longer be reported separately, starting 2023–24. Additionally, in 2022–23, there are other significant one-time expenses of $6.3 billion projected, including for costs associated with ongoing land and land-related claims with Indigenous communities, where Ontario is in active negotiations, or claims are accepted for negotiation or are under review. These one-time expenses are broken out to provide greater transparency regarding their temporary nature.
Interest on Debt Outlook
Interest on debt is forecast to be $13.4 billion in 2022–23, down from the 2022 Budget forecast of $13.5 billion, and lower than the interest on debt forecast for each year of the medium‑term outlook contained in the 2022 Budget as a result of lower borrowing programs, partially offset by higher than projected interest rates.
Other Fiscal Plan Assumptions
The reserve is set at $1.0 billion in 2023–24, $2.0 billion in 2024–25 and $4.0 billion in 2025–26. These increases reflect Ontario’s commitment to maintaining a prudent and flexible fiscal plan that can respond to elevated economic uncertainty, notably higher levels of inflation and the impact of higher interest rates on the economy.
The net debt-to-GDP ratio is projected to be 37.8 per cent in 2023–24, 37.7 per cent in 2024–25 and declining to 36.9 per cent in 2025–26.
Alternative Economic Scenarios and Fiscal Outlooks
In recognition of the elevated degree of economic uncertainty, the Ontario Ministry of Finance has once again developed Faster Growth and Slower Growth scenarios that the economy could take over the next several years. These alternative scenarios should not be considered the best case or the worst case. Rather, they illustrate a broader range of possible alternative outcomes.
| 2023p | 2024p | 2025p | 2026p | |
|---|---|---|---|---|
| Faster Growth Scenario | 1.3 | 2.0 | 2.8 | 2.7 |
| Planning Projection | 0.2 | 1.3 | 2.5 | 2.4 |
| Slower Growth Scenario | (0.7) | 0.8 | 2.4 | 2.3 |
Table footnotes:
p = Ontario Ministry of Finance planning projection based on external sources and alternative scenarios.
Source: Ontario Ministry of Finance.
| 2023p | 2024p | 2025p | 2026p | |
|---|---|---|---|---|
| Faster Growth Scenario | 6.0 | 4.4 | 5.1 | 5.0 |
| Planning Projection | 2.8 | 3.6 | 4.6 | 4.5 |
| Slower Growth Scenario | 1.0 | 3.0 | 4.3 | 4.2 |
Table footnotes:
p = Ontario Ministry of Finance planning projection based on external sources and alternative scenarios.
Source: Ontario Ministry of Finance.
In the event that the alternative economic scenarios materialize as opposed to the Planning Projection, Ontario’s fiscal plan would also change as a result. See Chapter 3: Ontario’s Fiscal Plan and Outlook, Revenue Outlook Scenarios section, for more information.
Under the Faster Growth scenario, Ontario may see larger budget surpluses starting with a surplus of $4.4 billion in 2023–24. However, if the Slower Growth scenario takes place instead, the fiscal outlook may deteriorate, with deficits of $5.0 billion in 2023–24, $5.8 billion in 2024–25 and $3.8 billion in 2025–26.
Borrowing and Debt Management
Ontario’s borrowing program is primarily used to refinance maturing debt, make investments in capital assets and fund deficits, when applicable. Ontario will continue to finance most of its borrowing program in the long-term public markets in Canada as well as internationally. Ontario has completed long‑term borrowing for 2022–23 of $32.1 billion, including $14.5 billion in pre-borrowing for 2023–24. The total long-term borrowing requirements for 2023–24, 2024–25 and 2025–26 are forecast to be $27.5 billion, $28.7 billion and $33.4 billion, respectively. Ontario’s annual long-term borrowing program in 2023–24 is forecast to be the lowest borrowing program since 2016–17.
| 2022–23 — 2022 Budget |
2022–23 — Change from 2022 Budget |
2022–23 — Interim1 2022–23 |
Medium-Term Outlook 2023–24 |
Medium-Term Outlook 2024–25 |
Medium-Term Outlook 2025–26 |
|
|---|---|---|---|---|---|---|
| Deficit/(Surplus) | 19.9 | (17.7) | 2.2 | 1.3 | (0.2) | (4.4) |
| Investment in Capital Assets | 13.4 | (1.5) | 11.9 | 13.6 | 18.6 | 18.8 |
| Non-Cash and Cash Timing Adjustments | (9.7) | (8.1) | (17.8) | (9.2) | (11.7) | (14.0) |
| Loans to Infrastructure Ontario | (0.1) | (0.1) | (0.2) | 0.1 | 0.1 | 0.2 |
| Other Net Loans/Investments | 0.7 | (0.8) | (0.1) | 0.1 | (1.0) | (0.2) |
| Debt Maturities/Redemptions | 30.5 | 0.0 | 30.6 | 31.2 | 27.9 | 33.1 |
| Total Funding Requirement | 54.7 | (28.1) | 26.6 | 37.0 | 33.7 | 33.4 |
| Decrease/(Increase) in Short-Term Borrowing | (3.0) | 4.3 | 1.3 | – | – | – |
| Increase/(Decrease) in Cash and Cash Equivalents | – | – | – | 5.0 | (5.0) | – |
| Pre-borrowing in 2021–22 for 2022–23 | (10.3) | – | (10.3) | – | – | – |
| Pre-borrowing for 2023–24 | – | 14.5 | 14.5 | (14.5) | – | – |
| Total Long-Term Borrowing | 41.5 | (9.3) | 32.1 | 27.5 | 28.7 | 33.4 |
Table footnotes:
[1] Interim represents the 2023 Budget projection for the 2022–23 fiscal year.
Note: Numbers may not add due to rounding.
Source: Ontario Financing Authority.
Ontario is forecast to pay $13.4 billion in interest costs in 2022–23, $14.1 billion in 2023–24 and $14.4 billion in 2024–25, down from the 2022 Budget forecasts of $13.5 billion, $14.3 billion and $14.9 billion, respectively. These lower interest costs total a cumulative savings of $0.8 billion over three years and are a result of smaller borrowing programs, partially offset by higher than projected interest rates. Interest on debt in 2025–26 is forecast to be $15.1 billion.
Ontario’s overall borrowing needs have been reduced by $36.6 billion over the three-year outlook period compared to the 2022 Budget forecast. Had the borrowing program stayed the same as in the 2022 Budget forecast, given higher interest rates forecast today, interest on debt would have been $0.3 billion higher in 2022–23, $0.7 billion higher in 2023–24 and $0.7 billion higher in 2024–25.
The 2023 Budget includes an updated debt burden reduction strategy, with new targets over the medium-term outlook for the relevant measures of debt sustainability. Meeting these targets on a sustained basis would help improve Ontario’s credit rating profile and lower Ontario’s cost of borrowing. This would result in less money being required to pay for interest on debt, which frees up resources for other priorities.
| 2022 Budget Target |
2022 Budget 2022–23 |
2023 Budget Target |
2023 Budget 2022–23 |
2023 Budget 2023–24 |
|
|---|---|---|---|---|---|
| Net Debt-to-GDP | <42.0 | 41.4 | <40.0 | 37.8 | 37.8 |
| Net Debt-to-Revenue | <250 | 238 | <200 | 198 | 199 |
| Interest on Debt-to-Revenue | <8.0 | 7.5 | <7.5 | 6.7 | 6.9 |
Table footnotes:
Source: Ontario Financing Authority.
See Chapter 4: Borrowing and Debt Management for more details on Ontario’s borrowing program, including borrowing outlook scenarios for long-term borrowing and the debt burden reduction strategy.
Ontario’s Capital Plan
Ontario’s Plan to Build includes the most ambitious capital plan in Ontario’s history, with planned investments over the next 10 years totalling $184.4 billion, including $20.6 billion in 2023–24. This plan is getting shovels in the ground to build highways, hospitals and other critical assets, laying the foundation for a strong Ontario.
Key highlights in the capital plan include:
Highways
- $27.9 billion over 10 years to support the planning and/or construction of highway expansion and rehabilitation projects across the province, including:
- Highway 413, a new 400-series highway and transportation corridor across Halton, Peel and York regions that will bring relief to the most congested corridor in North America and save drivers up to 30 minutes each way on their commute;
- Bradford Bypass, a new four-lane freeway connecting Highway 400 in Simcoe County and Highway 404 in York Region, saving motorists and commercial truck drivers up to approximately 35 minutes in travel time compared to using existing routes along local roads;
- The QEW Garden City Skyway Bridge Twinning project, which includes construction of a new twin bridge on the QEW over the Welland Canal connecting the City of St. Catharines to the Town of Niagara-on-the-Lake;
- Enabling the expansion of Highway 401 from Brock Road in Pickering through Eastern Ontario, to help relieve gridlock for tens of thousands of drivers per day and get goods moving faster; and
- Widening existing corridors across the province such as Highway 3 between Essex and Leamington, Highway 11/17 between Thunder Bay and Nipigon and Highway 17 between Arnprior and Renfrew.
Transit
- $70.5 billion over 10 years for public transit with a variety of projects underway, including:
- Transforming the GO Transit rail network into a modern, reliable and fully integrated rapid transit network. GO Expansion will improve access and convenience across the Greater Golden Horseshoe by steadily increasing service with faster trains, more stations and better connections;
- Making investments to expand GO Transit rail service to Bowmanville and the Niagara Region;
- Awarding two major contracts and releasing two Requests for Qualifications (RFQs) for the Ontario Line, which will provide rapid transit between Exhibition/Ontario Place and the Ontario Science Centre and connect more than 40 other transit routes, including GO train lines, subway and streetcar lines and the Eglinton Crosstown;
- Beginning tunnelling for the three-stop Scarborough Subway Extension from Kennedy Station to Sheppard Avenue and McCowan Road and awarding the contract for design and construction of new underground stations with bus terminals;
- Continuing tunnelling on the Eglinton Crosstown West Extension. As of March 1, 2023, the two boring machines have tunnelled more than a combined 5.6 kilometres;
- Purchasing three new trainsets to restore the Northlander passenger rail service to provide a safe and reliable transportation option for Northern communities, which will also support industries and resource sectors; and
- Making progress on delivering fast, reliable transit, including the Hazel McCallion Line and Finch West Light Rail Transit projects.
Health
- More than $48 billion over the next 10 years in hospital infrastructure, including over $32 billion in hospital capital grants, to support more than 50 hospital projects that would add 3,000 new beds over 10 years to increase access to reliable, quality care. Investments are being made to support hospital projects, including:
- Transformation of the existing site and urgent care centre into a new 24/7 inpatient care hospital at Peel Memorial in Brampton, in partnership with the William Osler Health System. This will allow development of an emergency department and meet the evolving needs of one of Ontario’s fastest growing communities;
- Funding to support the Trillium Health Partners – Broader Redevelopment Project to build a new, state‐of‐the‐art Mississauga Hospital;
- Support for the construction of a new, modern hospital facility on the existing Uxbridge site at the Oak Valley Health – Uxbridge Hospital to replace the current aged building, and enable the expansion of specialized outpatient clinics as well as the creation of a community health hub with long-term care services;
- Support for a new state-of-the-art acute care hospital in Windsor and Essex County to add more hospital beds and expand services in the region;
- Support for redevelopment of the existing hospital and regional trauma centre on a new site for the Ottawa Hospital – Civic Campus to expand access to programs and services as well as meet bed capacity needs; and
- Support the Runnymede Healthcare Centre’s First Responders Wellness and Rehabilitation Centre to break down barriers in accessing treatment for Post-Traumatic Stress Injury and other concurrent mental health disorders.
Long-Term Care

- In March 2022, the first home under the Accelerated Build Pilot, Lakeridge Health in Ajax, opened to residents. Construction continues to progress for the remaining three long‐term care homes in Mississauga and Toronto;
- Planned investments that total a historic $6.4 billion since 2019 to build more than 30,000 new and upgrade over 28,000 long‐term care beds across the province by 2028 to modern design standards. Ontario now has over 31,000 new and 28,000 upgraded beds in development; and
- The government is helping to increase long-term care capacity in communities across the province by providing development loans and loan guarantees to select non-municipal not-for-profit homes.
Education and Postsecondary Education
- Investing $22 billion, including about $15 billion in capital grants over the next 10 years, to build more schools and child care spaces, including a new English public elementary school in North Bay, a new addition to the École élémentaire et secondaire publique Ronald-Marion in Pickering, a new addition to the École secondaire catholique Sainte-Trinité in Oakville, and a new English Catholic secondary school in Windsor; and
- $5.4 billion in the Postsecondary Education sector, including over $2 billion in capital grants over the next 10 years to help colleges, universities and Indigenous Institutes modernize classrooms by upgrading technology, carrying out critical repairs and improving environmental sustainability.
Broadband
- Nearly $4 billion beginning in 2019–20 to ensure every community across the province has access to high-speed internet by the end of 2025. Multiple broadband programs are supporting this goal, including an innovative competitive bidding process to identify service providers quickly and cost-effectively for underserved areas of Ontario, and the Southwestern Integrated Fibre Technology (SWIFT) and Eastern Ontario Regional Network initiatives.
| Sector | Interim2,3 2022–23 |
Medium-Term Outlook 2023–24 |
Medium-Term Outlook 2024–25 |
Medium-Term Outlook 2025–26 |
10-Year Total4 |
|---|---|---|---|---|---|
| Transportation — Transit | 6,837 | 7,471 | 11,892 | 10,100 | 70,502 |
| Transportation — Provincial Highways | 2,790 | 3,193 | 3,385 | 3,676 | 27,920 |
| Transportation — Other Transportation, Property and Planning | 237 | 236 | 192 | 167 | 1,270 |
| Health — Hospitals | 3,186 | 3,349 | 3,795 | 5,687 | 48,119 |
| Health — Other Health | 406 | 581 | 368 | 1,297 | 8,472 |
| Education | 2,944 | 3,003 | 2,819 | 2,801 | 21,958 |
| Postsecondary Education — Colleges and Other | 894 | 705 | 631 | 495 | 4,064 |
| Postsecondary Education — Universities | 117 | 124 | 133 | 132 | 1,327 |
| Social | 342 | 369 | 381 | 472 | 2,621 |
| Justice | 516 | 801 | 721 | 412 | 2,908 |
| Other Sectors5 | 2,345 | 3,667 | 3,196 | 3,227 | 16,748 |
| Total Infrastructure Expenditures | 20,615 | 23,499 | 27,513 | 28,465 | 205,910 |
| Less: Other Partner Funding6 | 3,264 | 2,864 | 1,741 | 1,482 | 21,507 |
| Total7 | 17,351 | 20,635 | 25,772 | 26,983 | 184,403 |
Table footnotes:
[1] Includes interest capitalized during construction; third-party investments in hospitals, colleges and schools; federal and municipal contributions to provincially owned infrastructure investments; and transfers to municipalities, universities and non-consolidated agencies.
[2] Interim represents the 2023 Budget projection for the 2022–23 fiscal year.
[3] Includes provincial investment in capital assets of $11.9 billion.
[4] Total reflects the planned infrastructure expenditures for years 2023–24 through to 2032–33.
[5] Includes broadband infrastructure, government administration, natural resources, and culture and tourism industries.
[6] Other Partner Funding refers to third-party investments primarily in hospitals, colleges and schools.
[7] Includes Federal/Municipal contributions to provincial infrastructure investments.
Note: Numbers may not add due to rounding.
Source: Ontario Treasury Board Secretariat.
Managing Ontario’s Finances Responsibly
The government’s multi-year fiscal plan is consistent with the requirements of the Fiscal Sustainability, Transparency and Accountability Act, 2019, and the Act’s governing principles guide Ontario’s fiscal policy.
- Transparent: The government continues to demonstrate its commitment to transparency through the release of its twentieth quarterly financial update since 2018. In addition, for the fifth year in a row, the Auditor General of Ontario has provided a clean audit opinion on Ontario’s consolidated financial statements.
- Responsible: The government has developed a measured and responsible approach to managing Ontario’s finances that is driven by economic growth, while investing in key public services and capital projects that will help to improve economic productivity and create jobs.
- Flexible: The government’s plan has built in appropriate levels of prudence in the form of contingency funds and a reserve to ensure that the necessary fiscal flexibility is available to respond to changing circumstances.
- Equitable: The government’s plan strengthens critical public services, such as health care, for the people of Ontario today, to ensure that these services are available for future generations.
- Sustainable: The government is committed to returning to a balanced budget and reducing the province’s debt burden to ensure the sustainability of Ontario’s finances today and tomorrow.
Chart Descriptions
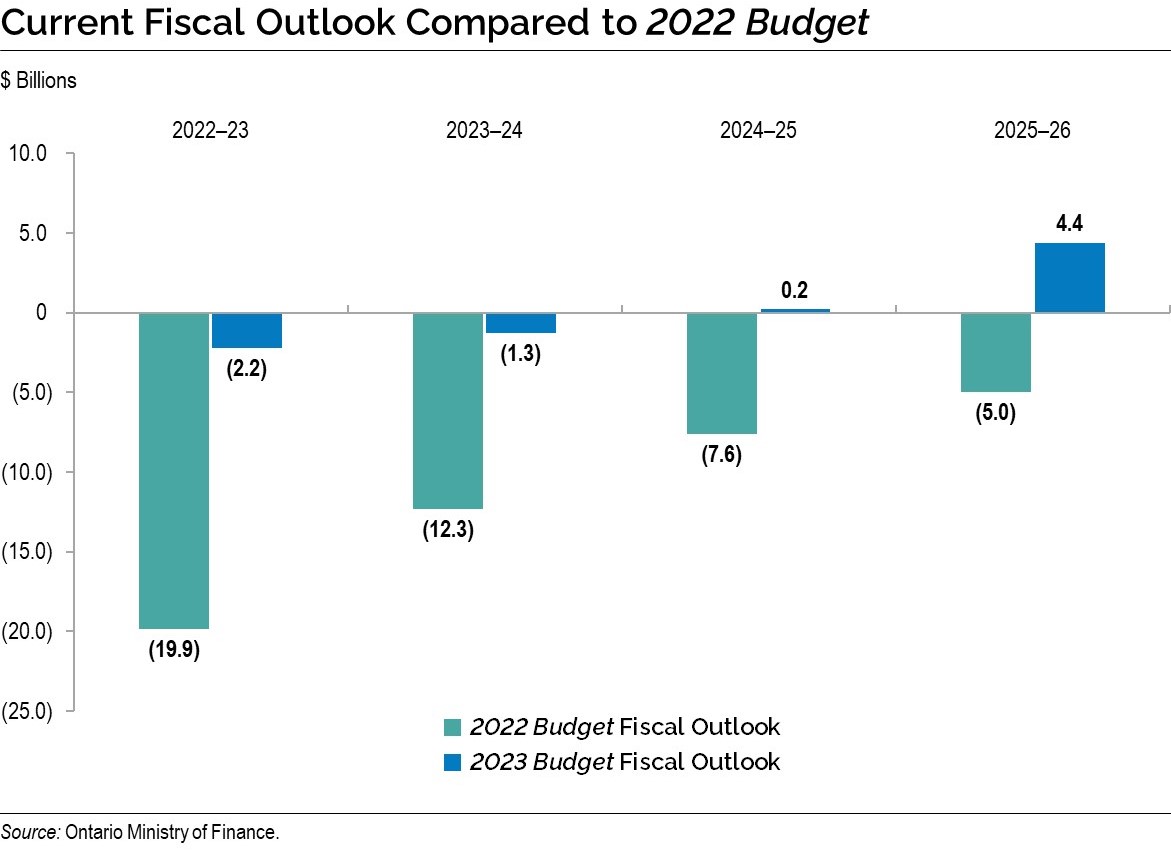
Current Fiscal Outlook Compared to 2022 Budget
The bar chart illustrates the fiscal outlook presented in the 2022 Budget compared to the current outlook in the 2023 Budget. The 2022 Budget projected deficits of $19.9 billion in 2022–23, $12.3 billion in 2023–24, $7.6 billion in 2024–25 and $5.0 billion in 2025–26. With the release of the 2023 Budget, the deficit projections have been revised to $2.2 billion in 2022–23, $1.3 billion in 2023–24, and surpluses of $0.2 billion in 2024–25 and $4.4 billion in 2025–26.
Source: Ontario Ministry of Finance.
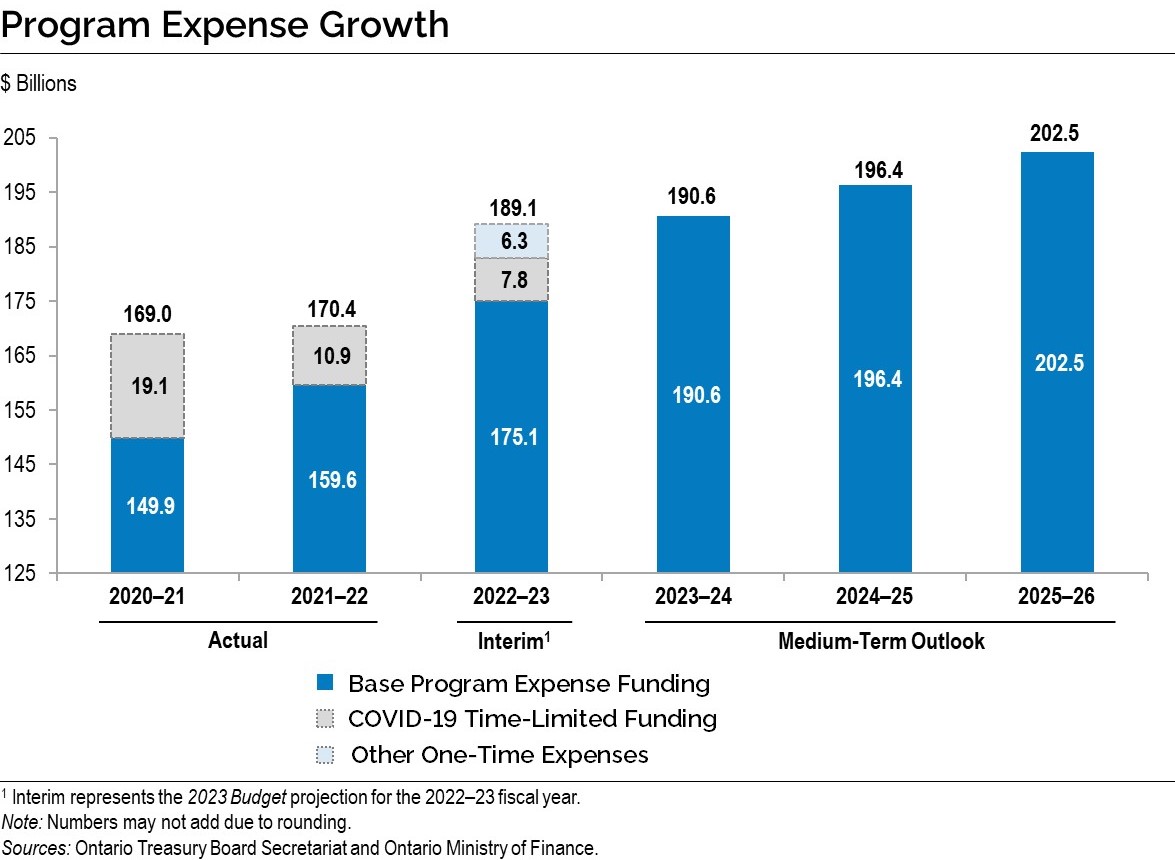
Program Expense Growth
The bar chart shows program expense growth from 2020–21 to 2025–26 excluding COVID‑19 Time-Limited Funding and Other One-Time Expenses. For 2020–21, base program expense, excluding COVID‑19 Time-Limited Funding and Other One-Time Expenses, is $149.9 billion, $159.6 billion in 2021–22, $175.1 billion in 2022–23, $190.6 billion in 2023–24, $196.4 billion in 2024–25 and $202.5 billion in 2025–26.
There are only three fiscal years from 2020–21 to 2022–23 where COVID‑19 Time-Limited Funding is included as part of total program expense. In 2020–21, COVID‑19 Time-Limited Funding of $19.1 billion increases total program expense to $169.0 billion. In 2021–22, COVID‑19 Time-Limited Funding of $10.9 billion increases total program expense to $170.4 billion. In 2022–23, COVID‑19 Time-Limited Funding of $7.8 billion as well as $6.3 billion for Other One-Time Expenses, increases total program expense to $189.1 billion.
Note: Numbers may not add due to rounding.
Sources: Ontario Treasury Board Secretariat and Ontario Ministry of Finance.
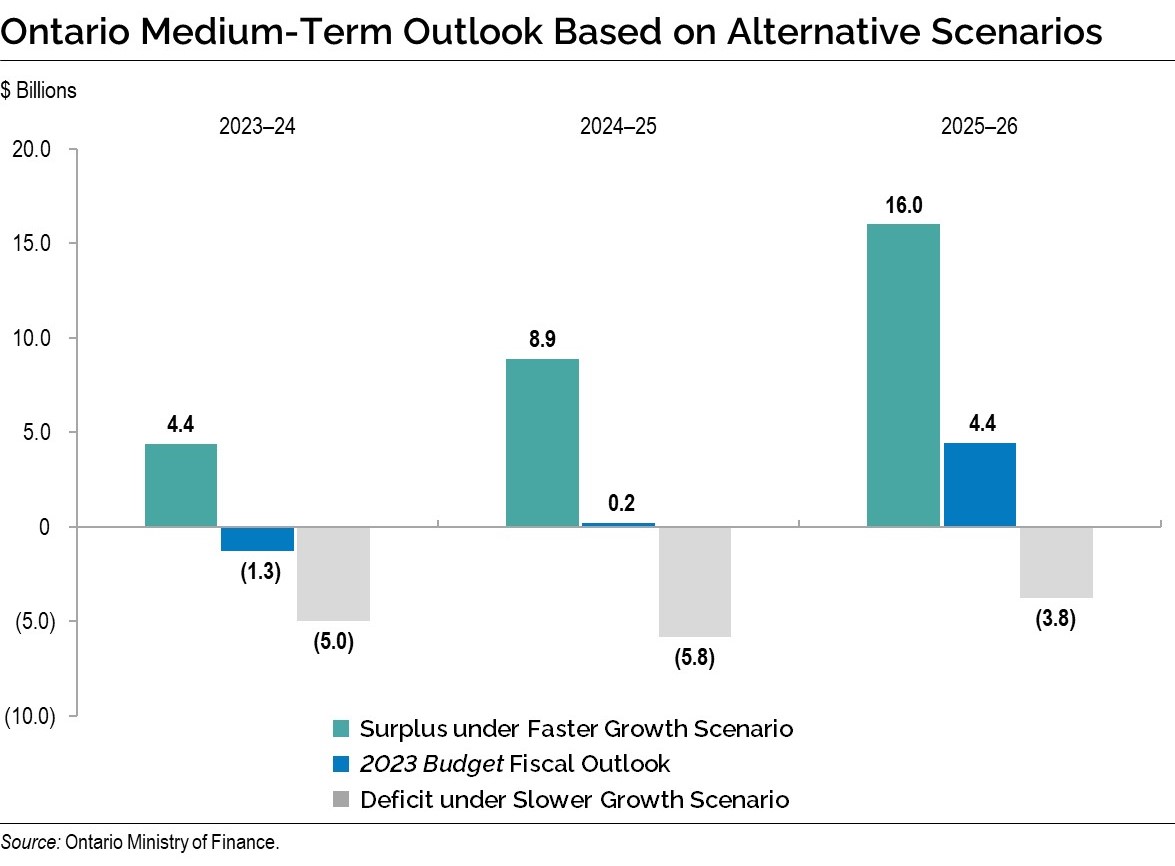
Ontario Medium-Term Outlook Based on Alternative Scenarios
The bar chart illustrates the range of Ontario fiscal outlooks based on the two alternative economic scenarios presented in Chapter 2: Economic Performance and Outlook. The 2023 Budget outlook estimates the deficit to be $1.3 billion in 2023–24, a surplus of $0.2 billion in 2024–25 and a surplus of $4.4 billion in 2025–26. Under the Faster Growth scenario, the surplus outlook is estimated to be $4.4 billion in 2023–24, $8.9 billion in 2024–25 and $16.0 billion in 2025–26. Under the Slower Growth scenario, the deficit outlook is estimated to be $5.0 billion in 2023–24, $5.8 billion in 2024–25 and $3.8 billion in 2025–26.
Source: Ontario Ministry of Finance.