Introduction
With economic headwinds weighing on household and government finances, it is more important than ever to continue investing in Ontario’s Plan to Build and to keep costs down and taxes low. While Ontario’s economy has remained resilient, it is expected to reflect continued but slower growth in 2024, compared to the projection in the 2023 Budget.
This slower projected growth and other factors beyond the province’s control — such as lower tax assessments and the federal government’s cap on international student study permit applications — have put new pressures on government finances. But the government will not stop investing in growth, infrastructure, economic development and communities across Ontario, and will also not raise taxes or fees at a time when families and businesses are struggling.
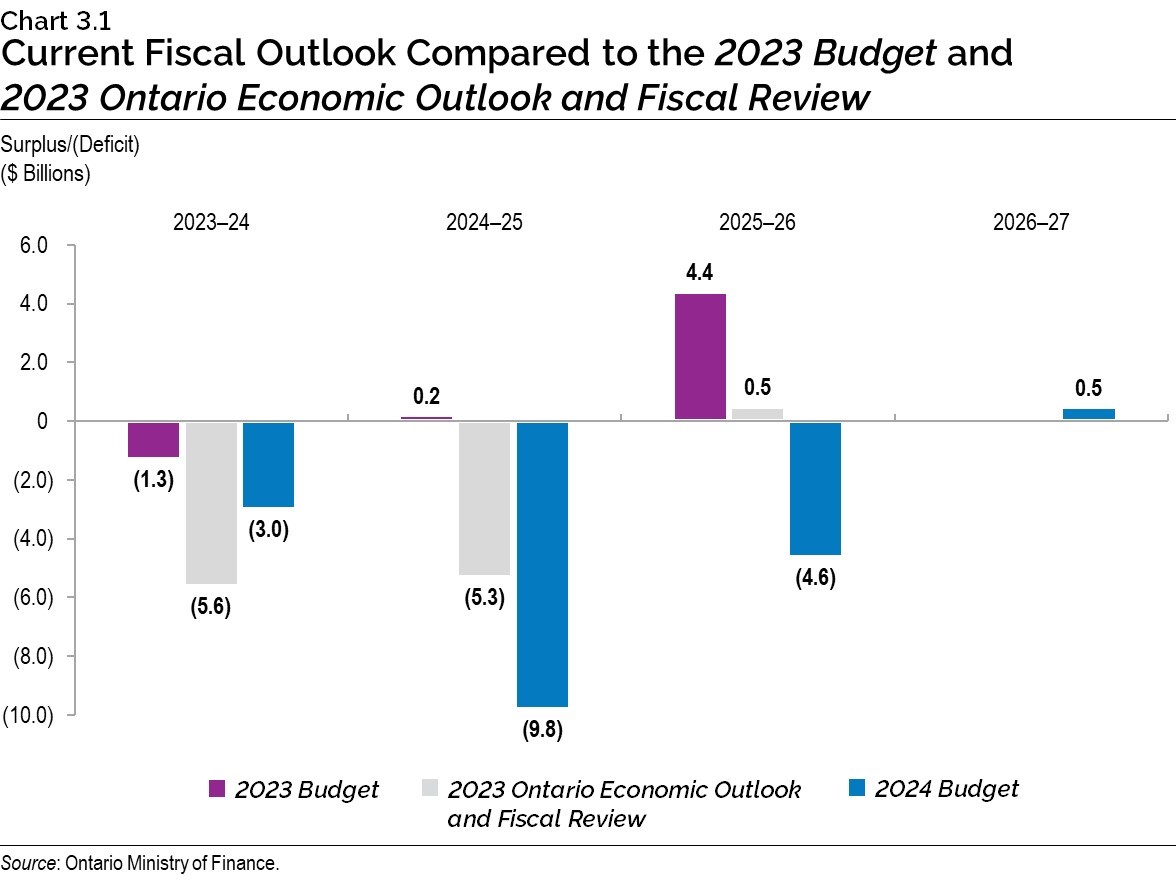
For 2023–24, the government is projecting a deficit of $3.0 billion. Over the medium term, the government is projecting deficits of $9.8 billion in 2024–25 and $4.6 billion in 2025–26, before reaching a surplus of $0.5 billion in 2026–27. The government’s plan retains a path to balance the budget despite a fiscal deterioration relative to the outlooks in Ontario’s 2023 Budget and the fall 2023 Ontario Economic Outlook and Fiscal Review.
A strong federal–provincial partnership is also key to Ontario’s long-term fiscal sustainability. While Ontario and the federal government have recently achieved agreements on health funding, Ontario continues to make new investments in critical health services while also facing increased cost pressures. More is needed to be done to ensure the Canada Health Transfer provides adequate funding going forward. In addition, with significant new infrastructure investments announced in Ontario’s 2024 Budget, Ontario is calling on the Government of Canada to build on these actions to support municipalities and to get shovels in the ground on housing-enabling infrastructure.
| Actual 2022–23 |
Interim1 2023–24 |
Medium-Term Outlook 2024–25 |
Medium-Term Outlook 2025–26 |
Medium-Term Outlook 2026–27 |
|
|---|---|---|---|---|---|
| Revenue | 192.9 | 204.3 | 205.7 | 217.4 | 226.6 |
| Expense — Programs | 186.4 | 194.5 | 200.6 | 205.8 | 208.9 |
| Expense — Interest on Debt | 12.4 | 12.8 | 13.9 | 14.7 | 15.2 |
| Total Expense | 198.8 | 207.3 | 214.5 | 220.6 | 224.1 |
| Surplus/(Deficit) Before Reserve | (5.9) | (3.0) | (8.8) | (3.1) | 2.5 |
| Reserve | – | – | 1.0 | 1.5 | 2.0 |
| Surplus/(Deficit) | (5.9) | (3.0) | (9.8) | (4.6) | 0.5 |
| Net Debt as a Per Cent of GDP | 38.2% | 38.0% | 39.2% | 39.5% | 39.1% |
| Net Debt as a Per Cent of Revenue | 207.6% | 203.0% | 213.5% | 211.4% | 209.4% |
| Interest on Debt as a Per Cent of Revenue | 6.4% | 6.3% | 6.8% | 6.8% | 6.7% |
Table 3.1 footnotes:
[1] Interim represents the 2024 Budget projection for the 2023–24 fiscal year.
Notes: Numbers may not add due to rounding. Interim and medium-term outlook primarily reflect information available as of February 28, 2024.
Sources: Ontario Treasury Board Secretariat and Ontario Ministry of Finance.
2023–24 Interim1 Fiscal Performance
Ontario’s 2023–24 deficit is projected to be $3.0 billion — $1.7 billion higher than the outlook published in the 2023 Budget but $2.6 billion lower than the outlook published in the 2023 Ontario Economic Outlook and Fiscal Review. It is also $1.6 billion lower than the outlook published in the 2023–24 Third Quarter Finances.
The 2024 Budget is projecting revenues in 2023–24 to be $204.3 billion — slightly lower than forecast in the 2023 Budget. Declines in taxation revenue and Government of Canada transfers are mostly offset by gains in net income from Government Business Enterprises and Other Non-Tax Revenue.
Program expense is projected to be $194.5 billion, $3.8 billion higher than the 2023 Budget forecast.
Ontario is forecast to pay $12.8 billion in interest costs in 2023–24 — lower than the forecast in the 2023 Budget, mainly due to lower than projected borrowing costs. At 38.0 per cent, the net debt‐to‐GDP ratio in 2023–24 is forecast to be 0.2 percentage point higher than in the 2023 Budget, primarily due to a modestly higher than forecast deficit and investments in infrastructure.
The 2023 Budget also included a $1.0 billion reserve in 2023–24 to protect the fiscal plan against unforeseen adverse changes in Ontario’s revenue and expense forecasts. The reserve was not required at fiscal year-end and has been drawn down to zero at interim, reducing the deficit further.
| 2023 Budget | Interim1 2023–24 |
In-Year Change |
|
|---|---|---|---|
| Revenue | 204,367 | 204,336 | (32) |
| Expense — Programs | 190,622 | 194,470 | 3,848 |
| Expense — Interest on Debt | 14,058 | 12,843 | (1,215) |
| Total Expense | 204,680 | 207,313 | 2,633 |
| Surplus/(Deficit) Before Reserve | (313) | (2,977) | (2,665) |
| Reserve | 1,000 | – | (1,000) |
| Surplus/(Deficit) | (1,313) | (2,977) | (1,665) |
Table 3.2 footnotes:
[1] Interim represents the 2024 Budget projection for the 2023–24 fiscal year.
Notes: Numbers may not add due to rounding. Interim and medium-term outlook primarily reflect information available as of February 28, 2024.
Sources: Ontario Treasury Board Secretariat and Ontario Ministry of Finance.
Revenue Update
The 2023–24 total revenue outlook is $204.3 billion — slightly lower than projected in the 2023 Budget. Since the release of the most recent update as part of the 2023–24 Third Quarter Finances, total revenue is projected to increase by $1.6 billion due to higher Taxation Revenue, Other Non-Tax Revenue and Net Income from Government Business Enterprises, after factoring in a decline in Government of Canada Transfers.
| Interim1 2023–24 |
|
|---|---|
| 2023 Budget Total Revenue | 204,367 |
| Revenue Changes in the 2023–24 First Quarter Finances | 0.2 |
| Revenue Changes in the 2023 Ontario Economic Outlook and Fiscal Review | (2,566) |
| Revenue Changes in the 2023–24 Third Quarter Finances | 942 |
| Revenue Changes Since the 2023–24 Third Quarter Finances — Corporations Tax | 2,410 |
| Revenue Changes Since the 2023–24 Third Quarter Finances — Electricity Payments in Lieu of Taxes | (9) |
| Revenue Changes Since the 2023–24 Third Quarter Finances — Personal Income Tax | (1,281) |
| Total Taxation Revenue | 1,119 |
| Government of Canada Transfers | (394) |
| Government Business Enterprises | 475 |
| Other Non-Tax Revenue | 392 |
| Total Revenue Changes Since the 2023–24 Third Quarter Finances | 1,592 |
| Total Revenue Changes Since the 2023 Budget | (32) |
| 2024 Budget Total Revenue Outlook | 204,336 |
Table 3.3 footnotes:
[1] Interim represents the 2024 Budget projection for the 2023–24 fiscal year.
Notes: Numbers may not add due to rounding. Interim and medium-term outlook primarily reflect information available as of February 28, 2024.
Source: Ontario Ministry of Finance.
The forecast for Total Taxation Revenue has increased by $1,119 million compared to the 2023–24 Third Quarter Finances. Key changes in the taxation revenue outlook include:
- Corporations Tax revenue projections increased by $2,410 million, mainly due to a stronger than expected corporate profit outlook than anticipated mid-way through 2023–24;
- Electricity Payments in Lieu of Taxes (PILs) revenue projections decreased by $9 million, reflecting a lower Municipal Electricity Utilities PILs forecast; and
- Personal Income Tax revenue projections decreased by $1,281 million, reflecting anticipated weaker taxable income growth for 2023.
Government of Canada Transfers projections decreased by $394 million, mainly due to a reprofiling of funding under the Canada-wide Early Learning and Child Care Agreement and Investing in Canada Infrastructure Program.
Net income from Government Business Enterprises projections increased by $475 million, due to a higher forecast for income from Ontario Power Generation (OPG) reflecting a revised consolidation adjustment under International Financial Reporting Standards (IFRS).
Other Non-Tax Revenues projections increased by $392 million, largely due to higher revenue resulting from recoveries of prior-year expenditures and updates from consolidated government organizations.
Expense Update
Since the release of the 2023 Budget, the government has made targeted investments throughout the fiscal year to continue to make progress on Ontario’s Plan to Build while also investing in critical public services. The 2023–24 total expense outlook is $207.3 billion, $2.6 billion higher than the 2023 Budget.
Since the release of the most recent update as part of the 2023–24 Third Quarter Finances, the total program expense projection has increased by $1.1 billion, primarily due to compensation costs and higher than forecasted ministry spending.
| Interim1 2023–24 |
|
|---|---|
| 2023 Budget Total Expense | 204,680 |
| Total Expense Changes in the 2023–24 First Quarter Finances | 0.2 |
| Total Expense Changes in the 2023 Ontario Economic Outlook and Fiscal Review | 1,734 |
| Total Expense Changes in the 2023–24 Third Quarter Finances | (136) |
| Program Expense Changes Since the 2023–24 Third Quarter Finances — Health Sector | 1,581 |
| Program Expense Changes Since the 2023–24 Third Quarter Finances — Education Sector2 | 1,881 |
| Program Expense Changes Since the 2023–24 Third Quarter Finances — Postsecondary Education Sector | (116) |
| Program Expense Changes Since the 2023–24 Third Quarter Finances — Children, Community and Social Services Sector | 44 |
| Program Expense Changes Since the 2023–24 Third Quarter Finances — Justice Sector | 638 |
| Program Expense Changes Since the 2023–24 Third Quarter Finances — Other Programs | (2,945) |
| Total Program Expense Changes Since the 2023–24 Third Quarter Finances | 1,081 |
| Interest on Debt Change Since the 2023–24 Third Quarter Finances | (46) |
| Total Expense Changes Since the 2023–24 Third Quarter Finances | 1,035 |
| Total Expense Changes Since the 2023 Budget | 2,633 |
| 2024 Budget Total Expense Outlook | 207,313 |
Table 3.4 footnotes:
[1] Interim represents the 2024 Budget projection for the 2023–24 fiscal year.
[2] Excludes Teachers’ Pension Plan. Teachers’ Pension Plan expense is included in Other Programs.
Notes: Numbers may not add due to rounding. Interim and medium-term outlook primarily reflect information available as of February 28, 2024.
Sources: Ontario Treasury Board Secretariat and Ontario Ministry of Finance.
The following program expense changes are projected since the release of the 2023–24 Third Quarter Finances:
- Health sector expense is projected to be $1,581 million higher, primarily to address pressures related to compensation costs, including Bill 124 remedy settlements, and other health services, such as utilization-driven programs like OHIP and the Ontario Public Drug Programs.
- Education sector expense is projected to be $1,881 million higher, mainly due to compensation costs, including Bill 124 remedy settlements and arbitration outcomes, and higher than forecasted school board spending.
- Postsecondary Education sector expense is projected to be $116 million lower, mainly due to updates to forecasted expense in the college sector.
- Children, Community and Social Services sector expense is projected to be $44 million higher, primarily due to investments in the Ontario Autism Program and compensation costs including Bill 124 remedy settlements.
- Justice sector expense is projected to be $638 million higher, primarily due to compensation costs including Bill 124 remedy settlements and investments related to essential service delivery in corrections, courts, and coroner and forensic pathology services.
- Other Programs expense is projected to be a net $2,945 million lower, primarily due to the following key changes:
- $2,772 million drawdown of the Contingency Fund to offset increases in other sectors;
- $377 million in lower than forecasted spending for the Ministry of Infrastructure, primarily due to revised implementation timelines for infrastructure projects, including the Investing in Canada Infrastructure Program and the Transit-Oriented Communities Program;
- $118 million in lower than forecasted spending for the Ministry of Labour, Immigration, Training and Skills Development, mainly due to revised implementation timelines for the Skills Development Fund Capital Stream; and
- $95 million higher than forecasted spending for the Ministry of Agriculture, Food and Rural Affairs, primarily due to higher uptake from the agricultural sector for demand-driven Business Risk Management programming, driven by various factors such as growing conditions.
Interest on debt expense is projected to be $46 million lower due to a lower projected deficit.
Prudence in 2023–24
The Contingency Fund is maintained to help mitigate expense risks that may adversely affect Ontario’s fiscal performance. For the remainder of 2023–24, the Contingency Fund has a current remaining balance of $0.5 billion, which is available to offset additional expenses that may materialize before the end of the fiscal year.
The 2023 Budget included a reserve of $1.0 billion in 2023–24, which was not required and has been drawn down to zero at interim.
Medium-Term Fiscal Plan
The government is projecting deficits of $9.8 billion in 2024–25, $4.6 billion in 2025–26, and a surplus of $0.5 billion in 2026–27. This outlook reflects the government’s continuing investments in infrastructure, housing, economic development and key public services, while not raising taxes or fees.
Key Changes Since the 2023 Budget
Since the 2023 Budget, revenues have decreased by $7.3 billion in 2024–25 and $8.5 billion 2025–26. This is mainly reflecting lower actual tax assessment information from the federal government and slower economic growth over the outlook period. The financial results of colleges are consolidated into the province’s financial statements. As a result of the federal government’s cap on international student study permit applications for two years, a significant downward revision to Broader Public Sector Colleges revenue is also contributing to the decline in 2024–25 and beyond.
The total expense outlook is projected to increase from $207.3 billion in 2023–24 to $220.6 billion in 2025–26. Total expense is projected to be higher than forecast at the time of the 2023 Budget as a result of program expense increases, partially offset by interest on debt savings.
The program expense outlook is projected to be higher by $4.2 billion in 2024–25 and $3.4 billion in 2025–26, compared with the medium-term forecast in the 2023 Budget. This increase reflects the government’s commitment to strengthen communities through investments in health, education, infrastructure, and economic development as well as additional compensation-related costs.
Ontario’s medium-term outlook for interest on debt is currently below the 2023 Budget estimate by $0.5 billion in 2024–25 and $0.3 billion in 2025–26, primarily as a result of lower than projected borrowing costs.
The fiscal plan also includes a reserve of $1.0 billion in 2024–25, $1.5 billion in 2025–26 and $2.0 billion in 2026–27, which aligns with long-run historical reserve levels while maintaining a prudent and flexible fiscal plan.
Medium-Term Revenue Outlook
Total revenue is projected to increase from $204.3 billion in 2023–24 to $226.6 billion in 2026–27, for an average annual growth rate of 3.5 per cent. Revenue growth reflects the Ontario Ministry of Finance’s outlook for economic growth and the key economic drivers that underpin the revenue forecast, which are based on private-sector forecasts.
| Actual 2022–23 |
Interim1 2023–24 |
Medium-Term Outlook 2024–25 |
Medium-Term Outlook 2025–26 |
Medium-Term Outlook 2026–27 |
|
|---|---|---|---|---|---|
| Revenue — Personal Income Tax | 44.2 | 50.6 | 51.9 | 55.1 | 58.3 |
| Revenue — Sales Tax | 36.1 | 39.8 | 38.8 | 40.6 | 42.7 |
| Revenue — Corporations Tax | 27.8 | 24.2 | 24.9 | 26.3 | 28.0 |
| Revenue — Ontario Health Premium | 4.4 | 4.9 | 5.0 | 5.2 | 5.4 |
| Revenue — Education Property Tax | 6.0 | 5.8 | 5.8 | 5.9 | 5.9 |
| Revenue — All Other Taxes | 18.0 | 17.2 | 18.2 | 20.4 | 21.0 |
| Total Taxation Revenue | 136.5 | 142.5 | 144.7 | 153.5 | 161.3 |
| Government of Canada | 31.3 | 34.8 | 36.3 | 37.5 | 38.7 |
| Income from Government Business Enterprises | 6.1 | 7.3 | 6.8 | 8.0 | 7.8 |
| Other Non-Tax Revenue | 19.0 | 19.8 | 18.0 | 18.5 | 18.8 |
| Total Revenue | 192.9 | 204.3 | 205.7 | 217.4 | 226.6 |
Table 3.5 footnotes:
[1] Interim represents the 2024 Budget projection for the 2023–24 fiscal year.
Note: Numbers may not add due to rounding.
Source: Ontario Ministry of Finance.
The primary driver of the forecast for Personal Income Tax (PIT) revenues is the outlook for growth in compensation of employees. Personal Income Tax revenue is projected to grow at an average annual rate of 4.9 per cent between 2023–24 and 2026–27.
The forecast for Sales Tax (ST) revenue is driven by the projection for household consumption spending. Average growth in ST revenue is 2.4 per cent between 2023–24 and 2026–27.
The forecast for Corporations Tax (CT) revenue is driven by the projections of corporate profitability. Corporations Tax revenue is projected to grow at an average annual rate of 5.0 per cent between 2023–24 and 2026–27.
The primary driver of the forecast for Ontario Health Premium revenue is the outlook for growth in compensation of employees. Ontario Health Premium revenue is projected to grow at an average annual rate of 3.5 per cent between 2023–24 and 2026–27.
Education Property Tax revenue is based primarily on the outlook for growth in the property assessment base resulting from new construction activities.
Revenues from All Other Taxes are projected to increase at an average annual rate of 6.8 per cent between 2023–24 and 2026–27. This includes revenues from the Employer Health Tax; Land Transfer Tax; Beer, Wine and Spirits Taxes; and volume-based taxes such as the Gasoline Tax, Fuel Tax and Tobacco Tax.
The forecast for Government of Canada Transfers is largely based on existing federal–provincial funding agreements and formulas. Federal transfers are projected to increase at an average annual rate of 3.6 per cent between 2023–24 and 2026–27.
The outlook for Income from Government Business Enterprises (GBEs) is based on Ontario Ministry of Finance estimates of net income for Hydro One Ltd. (Hydro One) and projections provided by Ontario Power Generation (OPG), the Ontario Cannabis Store (OCS), the Liquor Control Board of Ontario (LCBO), the Ontario Lottery and Gaming Corporation (OLG) and iGaming Ontario (iGO). Net incomes of GBEs are projected to increase at an average annual rate of 2.2 per cent from 2023–24 to 2026–27.
The forecast for Other Non-Tax Revenue is based on projections provided by government ministries and agencies. The outlook for Other Non-Tax Revenue is projected to decline at an average annual rate of 1.7 per cent from 2023–24 to 2026–27, largely due to the decrease in third‐party revenues from Broader Public Sector Colleges reflecting the federal government’s cap on international student study permit applications for two years, beginning in 2024.
Risks to the Revenue Outlook
There are a variety of risks to the economic planning assumptions underlying the revenue forecast, as outlined in Chapter 2: Economic Performance and Outlook. Table 3.6 highlights some key risks and sensitivities to the 2024–25 revenue forecast that could arise from unexpected changes in economic conditions. These are only estimates; actual results can vary. The risks identified are based on factors that are considered to have the most material impact on the largest revenue sources.
| Economic Factors | Revenue Sources | 2024–25 Sensitivities |
|---|---|---|
| Nominal GDP | Total Taxation Revenue | $1,080 million revenue change for each percentage point change in nominal GDP growth. This can vary significantly, depending on the composition and source of changes in GDP growth. |
| Compensation of Employees | Personal Income Tax; Ontario Health Premium; and Employer Health Tax | $723 million revenue change for each percentage point change in growth in compensation of employees. |
| Household Consumption Expenditures | Sales Tax | $282 million revenue change for each percentage point change in growth of household consumption expenditures. |
| Net Operating Surplus of Corporations | Corporations Tax | $228 million revenue change for each percentage point change in growth in net operating surplus of corporations. |
| Housing Resales and Resale Prices | Land Transfer Tax | $37 million revenue change for each percentage point change in growth of either housing resales or resale prices. |
| Ontario Population Share | Canada Health Transfer | $52 million revenue change for each one-tenth of a percentage point change in Ontario’s population share. |
| Ontario Population Share | Canada Social Transfer | $17 million revenue change for each one-tenth of a percentage point change in Ontario’s population share. |
Table 3.6 footnotes:
Source: Ontario Ministry of Finance.
Economic and Fiscal Outlook Scenarios
To illustrate the potential impacts of elevated economic uncertainty, the Ontario Ministry of Finance has developed two alternative scenarios that the economy could take over the next several years (see Chapter 2: Economic Performance and Outlook for more details). Based on the two alternative nominal GDP growth economic scenarios, two taxation revenue outlook scenarios were developed. The Faster Growth and Slower Growth scenarios each represent a potential path intended to illustrate a broader range of possible outcomes depending on the pace of economic growth, but neither should be considered as the best case or the worst case.
| 2024–25p | 2025–26p | 2026–27p | |
|---|---|---|---|
| Faster Growth Scenario | 148.4 | 159.7 | 170.0 |
| Planning Projection | 144.7 | 153.5 | 161.3 |
| Slower Growth Scenario | 141.3 | 147.9 | 153.9 |
Table 3.7 footnotes:
p = Ontario Ministry of Finance Planning Projection and alternative scenarios based on external sources as of January 25, 2024.
Note: Numbers may not add due to rounding.
Source: Ontario Ministry of Finance.
In the Faster Growth scenario, total taxation revenue over the medium term is $8.7 billion higher in 2026–27 than the Planning Projection, while in the Slower Growth scenario, total taxation revenue is $7.4 billion lower.
In the event that the alternative economic scenarios materialize, as opposed to the Planning Projection, Ontario’s fiscal plan would also change as a result.
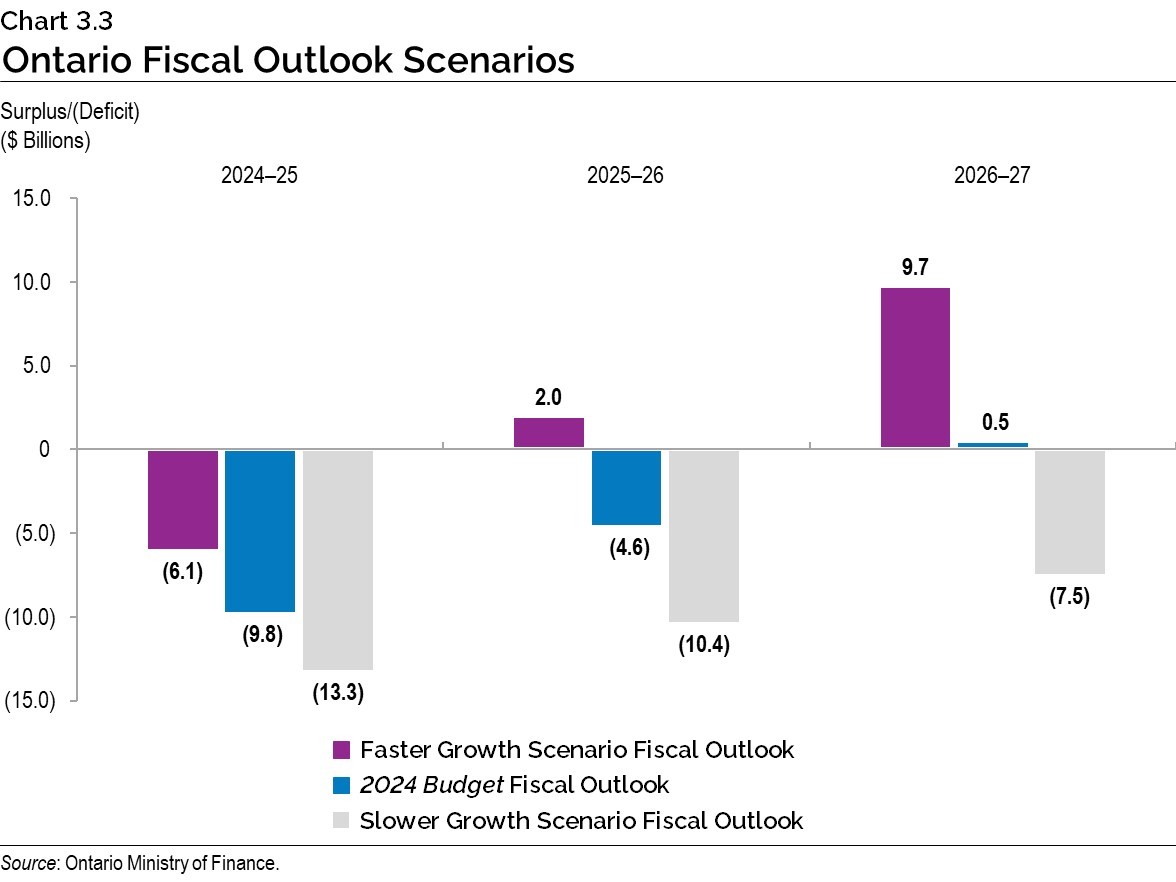
Under the Faster Growth scenario, the deficit outlook would improve to $6.1 billion in 2024–25, followed by surpluses of $2.0 billion in 2025–26 and $9.7 billion in 2026–27. However, if the Slower Growth scenario materializes, the deficit outlook would deteriorate to $13.3 billion in 2024–25, $10.4 billion in 2025–26 and $7.5 billion in 2026–27.
In these alternative outlook scenarios, program expenses are assumed to be unchanged compared to the medium-term expense outlook and only revenue and interest on debt are adjusted.
Medium-Term Expense Outlook
The government is committed to strengthening communities through investments in health care, education, infrastructure, and economic development. The total expense outlook is projected to grow from $207.3 billion in 2023–24 to $224.1 billion in 2026–27.
The government continues to invest in programs that serve the people of Ontario. Ontario’s program expense outlook is projected to grow from $194.5 billion in 2023–24 to $208.9 billion in 2026–27 for an average annual growth rate of 2.4 per cent. This also reflects additional compensation-related costs.
| Actual 2022–23 |
Interim1 2023–24 |
Medium-Term Outlook 2024–25 |
Medium-Term Outlook 2025–26 |
Medium-Term Outlook 2026–27 |
|
|---|---|---|---|---|---|
| Base Programs2 — Health Sector | 75.1 | 84.5 | 85.0 | 88.0 | 89.9 |
| Base Programs3 — Education Sector4 | 33.6 | 36.6 | 37.6 | 38.8 | 39.4 |
| Base Programs5 — Postsecondary Education Sector | 11.7 | 12.6 | 12.2 | 12.5 | 13.0 |
| Base Programs6 — Children, Community and Social Services Sector | 18.0 | 19.4 | 19.9 | 20.1 | 20.1 |
| Base Programs7 — Justice Sector | 5.3 | 6.1 | 5.9 | 5.6 | 5.6 |
| Base Programs8 — Other Programs | 30.1 | 35.3 | 40.0 | 40.9 | 40.9 |
| Total Base Programs | 173.8 | 194.5 | 200.6 | 205.8 | 208.9 |
| COVID‑19 Time-Limited Funding | 6.3 | – | – | – | – |
| Other One-Time Expenses | 6.3 | – | – | – | – |
| Total Programs | 186.4 | 194.5 | 200.6 | 205.8 | 208.9 |
| Interest on Debt | 12.4 | 12.8 | 13.9 | 14.7 | 15.2 |
| Total Expense | 198.8 | 207.3 | 214.5 | 220.6 | 224.1 |
Table 3.8 footnotes:
[1] Interim represents the 2024 Budget projection for the 2023–24 fiscal year.
[2], [3], [5], [6], [7], [8] For presentation purposes in the 2024 Budget, one-time COVID-19-related spending in 2022–23 has been included within COVID-19 Time-Limited Funding. This funding is no longer reported separately, starting 2023–24.
[4] Excludes Teachers’ Pension Plan. Teachers’ Pension Plan expense is included in Other Programs.
Note: Numbers may not add due to rounding.
Sources: Ontario Treasury Board Secretariat and Ontario Ministry of Finance.
Highlights of the changes to the program expense outlook over the medium term include the following:
- Health sector expense is projected to increase from $84.5 billion in 2023–24 to $89.9 billion in 2026–27. The growth is primarily due to investments to:
- Address the growing demands in the health sector, including funding for hospitals and cancer treatment services to respond to Ontario’s aging and growing population;
- Support health human resources initiatives to optimize the existing workforce and recruit and retain health care providers;
- Improve and transform the home and community care sector;
- Improve quality of care in the long-term care sector; and
- Support mental health and addictions services through the Roadmap to Wellness: A Plan to Build Ontario’s Mental Health and Addictions System.
- Education sector expense is projected to increase from $36.6 billion in 2023–24 to $39.4 billion in 2026–27. Key investments include:
- Funding to address enrolment growth and support student achievement, including through Ontario’s back to basics learning strategy on reading and math;
- Continued implementation of the Canada-wide Early Learning and Child Care Agreement to increase access to high-quality affordable child care while reducing average out-of-pocket child care fees; and
- Supporting commitments consistent with labour agreements reached.
- Postsecondary Education sector expense is projected to increase from $12.6 billion in 2023–24 to $13.0 billion in 2026–27. This is mainly due to:
- Increased supports to institutions of $903 million to strengthen postsecondary education in Ontario, including implementing a Postsecondary Education Sustainability Fund to help address immediate financial sustainability challenges;
- Investments of over $485 million to support Health Human Resources initiatives, including the ongoing expansion of nursing and medical school seats and the Ontario Learn and Stay Grant where students in targeted nursing, paramedic and medical laboratory technologist programs study and work in underserviced communities; and
- Lower forecasted college sector spending, primarily as a result of the federal government announcement to cap international student study permit applications for two years, beginning in 2024.
- Children, Community and Social Services sector expense is projected to increase from $19.4 billion in 2023–24 to $20.1 billion in 2026–27. This is mainly due to:
- $310 million over three years to address increasing operational costs for community organizations that support vulnerable populations, including children in care and those with special needs, people with developmental disabilities, and people who have experienced gender-based violence and human trafficking; and
- Annual inflation adjustments to core allowances for the Ontario Disability Support Program and the maximum monthly amount for the Assistance for Children with Severe Disabilities Program, which started in July 2023.
- Justice sector expense is projected to decrease from $6.1 billion in 2023–24 to $5.6 billion in 2026–27. Investments in the sector include:
- One-time funding in 2023–24 for compensation costs, including Bill 124 remedy settlements in the Justice sector;
- Funding provided in 2023–24 to support essential service delivery in corrections, coroner and forensic pathology services, as well as courts and animal welfare services; and
- Continuing investments in the Justice sector to protect public safety such as the Guns, Gangs and Violence Reduction Strategy, air support equipment, initiatives to fight auto theft, and the expansion of the Basic Constable Training Program including the elimination of its tuition fees.
- Other Programs expense is projected to increase from $35.3 billion in 2023–24 to $40.9 billion in 2026–27. Key changes include:
- $3.3 billion over three years, beginning in 2024–25, as part of the government’s multi-year commitment to provide access to high-speed internet for every community across Ontario by the end of 2025;
- $2.8 billion over three years, beginning in 2024–25, for strategic investments in industrial support and land development, including Ontario’s auto manufacturing sector and electric vehicle battery production;
- $1.8 billion over three years, beginning in 2024–25, to help build municipal housing-enabling infrastructure projects through the $1.0 billion new Municipal Housing Infrastructure Program and the enhanced $825 million Housing-Enabling Water Systems Fund; and
- $200 million over three years, beginning in 2024–25, for the new Community Sport and Recreation Infrastructure Fund to support new facilities and revitalize existing venues for youth and families, while creating good local jobs and supporting economic growth.
The total expense outlook includes Interest on Debt expense, which is projected to increase from $12.8 billion in 2023–24 to $15.2 billion in 2026–27.
Prudence Built into the Medium-Term Outlook
In keeping with sound fiscal planning practices, Ontario’s revenue outlook is based on prudent economic planning projections, as discussed in Chapter 2: Economic Performance and Outlook. Three external economic experts reviewed the Ontario Ministry of Finance’s economic assumptions and found them to be reasonable.1
The government maintains a responsible and flexible fiscal plan to respond to uncertainty and risks. Ontario incorporates prudence in the form of a reserve to protect the fiscal outlook against unforeseen adverse changes in Ontario’s revenue and expense, including those resulting from changes in Ontario’s economic performance.
In addition, the Contingency Fund is maintained to help mitigate expense risks that may adversely affect Ontario’s fiscal performance. The Contingency Fund in 2024–25 is set at $1.5 billion and increases further through the remainder of the medium‐term outlook, reflecting the government’s prudent and responsible fiscal planning.
The reserve has been set at $1.0 billion in 2024–25, $1.5 billion in 2025–26 and $2.0 billion in 2026–27. This reflects Ontario’s commitment to maintaining a prudent and flexible fiscal plan.
Risks to the Expense Outlook
Table 3.9 provides a summary of key expense risks and sensitivities that could result from unexpected changes in economic conditions and program demands. A change in these factors could affect total expense and the public sector, causing variances in the overall fiscal forecast. These sensitivities illustrate possible effects on the government’s key programs and can vary, depending on the nature and composition of potential risks.
| Program/Sector | 2024–25 Assumption | 2024–25 Sensitivities |
|---|---|---|
| Hospital1 | Annual growth of 4.0 per cent. | One per cent change in hospital costs: $249.3 million. |
| Home Care2 | Approximately 39.8 million hours of personal support services. Approximately 9.8 million nursing and therapy visits and 1.3 million nursing shifts. |
One per cent change in hours of personal support services: approximately $19.5 million. One per cent change in all nursing and therapy visits: approximately $12.8 million. |
| Elementary and Secondary Schools | Approximately 2.066 million average daily pupil enrolment. |
One per cent enrolment change: approximately $176 million. |
| Ontario Works | 263,748 average annual caseload. | One per cent caseload change: approximately $30 million. |
| Ontario Disability Support Program | 376,462 average annual caseload. | One per cent caseload change: approximately $63 million. |
| Interest on Debt | Average cost of borrowing in 2024–25 is forecast to be 4.0 per cent. | In the first full year, the impact of a 100 basis-point change in borrowing rates: approximately $700 million. |
Table 3.9 footnotes:
[1] Hospital costs are based on hospital operating transfer payments and exclude one-time funding, consolidations and arbitrated wage settlements.
[2] Home Care statistics are based on a combination of 2022–23 and 2023–24 data and estimates.
Sources: Ontario Treasury Board Secretariat and Ontario Ministry of Finance.
Transparency and Risks
The government continues to be transparent about the state of Ontario’s finances. This principle is reflected in the Fiscal Sustainability, Transparency and Accountability Act, 2019, which stipulates that Ontario’s fiscal policy should be clearly articulated and information about it should be readily available to the public without charge.
To ensure a reasonable and prudent economic forecast, the government’s key economic planning projections are set below the average of private-sector forecasts in each year. While the planning assumptions for economic growth are reasonable and prudent, the Ontario Ministry of Finance has also developed Faster Growth and Slower Growth scenarios to provide greater transparency around a broader range of possible outcomes depending on the pace of Ontario’s economic growth amid heightened economic uncertainty.
As a matter of transparent fiscal management, financial pressures are monitored throughout the fiscal year with the goal of ensuring value for taxpayer dollars through the use of robust and prudent methodologies to develop forecasts. Other important risk management tools include closely tracking the pace of implementation of initiatives and proactively identifying emerging program and policy risks. Comprehensive analysis of known pressures informs the fiscal planning processes, including the development of plans to mitigate and manage fiscal pressures, as well as maintaining adequate contingencies as part of the medium-term fiscal projections. The fiscal plan also incorporates the impact of the Bill 124 court decision on compensation-related costs.
In addition to the key demand sensitivities and economic risks to the fiscal plan, there are risks stemming from the government’s contingent liabilities. Whether future events will result in actual liabilities for Ontario is beyond the direct control of the government. For example, losses could result from legal settlements, a call on a loan or funding guarantees. While a Contingency Fund is included in the fiscal plan to help mitigate expense risks, until there exists certainty around the likelihood and costs of these future events, these risks are not included in the government’s fiscal plan. Provisions for losses that are likely to occur and can be reasonably estimated are expensed and reported as liabilities in Ontario’s financial statements. Any significant contingent liabilities related to the 2023–24 fiscal year will be disclosed as part of the Public Accounts of Ontario 2023 –2024, to be released no later than September 27, 2024.
Details of Ontario’s Finances
| Actual 2021–22 |
Actual 2022–23 |
Interim1 2023–24 |
Plan 2024–25 |
|
|---|---|---|---|---|
| Taxation Revenue — Personal Income Tax | 46,750 | 44,209 | 50,593 | 51,936 |
| Taxation Revenue — Sales Taxes | 30,357 | 36,092 | 39,762 | 38,832 |
| Taxation Revenue — Corporations Tax | 25,227 | 27,791 | 24,179 | 24,915 |
| Taxation Revenue — Education Property Tax | 5,713 | 5,991 | 5,755 | 5,831 |
| Taxation Revenue — Employer Health Tax | 7,223 | 7,797 | 8,364 | 8,720 |
| Taxation Revenue — Ontario Health Premium | 4,414 | 4,445 | 4,918 | 5,014 |
| Taxation Revenue — Gasoline Tax | 2,202 | 2,103 | 1,664 | 1,953 |
| Taxation Revenue — Land Transfer Tax | 5,827 | 4,443 | 3,739 | 3,881 |
| Taxation Revenue — Tobacco Tax | 927 | 864 | 827 | 771 |
| Taxation Revenue — Fuel Tax | 771 | 571 | 499 | 623 |
| Taxation Revenue — Beer, Wine and Spirits Taxes | 624 | 600 | 599 | 576 |
| Taxation Revenue — Electricity Payments in Lieu of Taxes | 666 | 674 | 535 | 536 |
| Taxation Revenue — Ontario Portion of the Federal Cannabis Excise Duty | 215 | 310 | 344 | 379 |
| Taxation Revenue — Other Taxes | 759 | 627 | 673 | 720 |
| Taxation Revenue — Total | 131,675 | 136,518 | 142,452 | 144,687 |
| Government of Canada — Canada Health Transfer | 16,731 | 17,525 | 19,277 | 20,256 |
| Government of Canada — Canada Social Transfer | 6,003 | 6,178 | 6,404 | 6,576 |
| Government of Canada — Equalization | – | – | 421 | 576 |
| Government of Canada — Infrastructure Programs | 562 | 769 | 1,075 | 1,185 |
| Government of Canada — Labour Market Programs | 1,476 | 1,181 | 1,148 | 904 |
| Government of Canada — Social Housing Agreement | 305 | 263 | 218 | 174 |
| Government of Canada — Other Federal Payments | 5,091 | 4,817 | 5,739 | 6,098 |
| Government of Canada — Direct Transfers to Broader Public Sector Organizations | 439 | 530 | 481 | 482 |
| Government of Canada — Total | 30,607 | 31,264 | 34,764 | 36,252 |
| Income from Government Business Enterprises — Liquor Control Board of Ontario | 2,543 | 2,457 | 2,546 | 2,450 |
| Income from Government Business Enterprises — Ontario Power Generation Inc./Hydro One Ltd. | 2,151 | 850 | 1,973 | 1,314 |
| Income from Government Business Enterprises — Ontario Lottery and Gaming Corporation | 1,561 | 2,505 | 2,351 | 2,623 |
| Income from Government Business Enterprises — Ontario Cannabis Store | 186 | 234 | 242 | 225 |
| Income from Government Business Enterprises — iGaming Ontario | – | 87 | 162 | 174 |
| Income from Government Business Enterprises — Total | 6,441 | 6,133 | 7,274 | 6,786 |
| Other Non-Tax Revenue — Fees, Donations and Other Revenues from Hospitals, School Boards and Colleges | 9,688 | 11,492 | 11,737 | 10,239 |
| Other Non-Tax Revenue — Vehicle and Driver Registration Fees2 | 33 | 1,251 | 1,190 | 1,181 |
| Other Non-Tax Revenue — Miscellaneous Other Non-Tax Revenue | 2,628 | 2,149 | 2,392 | 2,000 |
| Other Non-Tax Revenue — Other Fees and Licences | 1,237 | 1,438 | 1,698 | 1,657 |
| Other Non-Tax Revenue — Sales and Rentals | 1,046 | 1,227 | 1,388 | 1,546 |
| Other Non-Tax Revenue — Reimbursements | 1,233 | 1,031 | 1,112 | 1,002 |
| Other Non-Tax Revenue — Royalties | 468 | 335 | 289 | 295 |
| Other Non-Tax Revenue — Power Supply Contract Recoveries | 67 | 48 | 39 | 44 |
| Other Non-Tax Revenue — Net Reduction of Power Purchase Contracts | 5 | – | – | – |
| Other Non-Tax Revenue — Total | 16,405 | 18,972 | 19,845 | 17,965 |
| Total Revenue | 185,128 | 192,887 | 204,336 | 205,690 |
Table 3.10 footnotes:
[1] Interim represents the 2024 Budget projection for the 2023–24 fiscal year.
[2] Vehicle and Driver Registration Fees in 2021–22 reflect the elimination and rebate of eligible licence plate renewal fees paid since March 1, 2020.
Note: Numbers may not add due to rounding.
Source: Ontario Ministry of Finance.
| Ministry Expense | Actual 2021–22 |
Actual 2022–23 |
Interim3 2023–24 |
Plan 2024–25 |
|---|---|---|---|---|
| Agriculture, Food and Rural Affairs (Base) | 284 | 300 | 352 | 378.2 |
| Demand-Driven Risk Management and Time-Limited Programs | 358 | 502 | 577 | 477.5 |
| COVID-19 Time-Limited Funding4 | 32 | 30 | – | – |
| Agriculture, Food and Rural Affairs (Total) | 674 | 832 | 929 | 855.7 |
| Attorney General (Base) | 1,615 | 1,783 | 1,950 | 1,960.5 |
| Statutory Appropriations — Crown Liability and Proceedings Act, 2019 | 49 | 79 | 36 | – |
| Bad Debt Expense | 7 | 30 | 25 | 5.3 |
| Compensation Settlements | – | – | 81 | – |
| COVID-19 Time-Limited Funding5 | 145 | 31 | – | – |
| Attorney General (Total) | 1,816 | 1,923 | 2,092 | 1,965.8 |
| Board of Internal Economy (Base) | 283 | 392 | 321 | 320.4 |
| COVID-19 Time-Limited Funding6 | 2 | 0 | – | – |
| Board of Internal Economy (Total) | 284 | 392 | 321 | 320.4 |
| Children, Community and Social Services (Base) | 16,717 | 17,991 | 19,438 | 19,925.7 |
| COVID-19 Time-Limited Funding7 | 293 | 48 | – | – |
| Children, Community and Social Services (Total) | 17,010 | 18,039 | 19,438 | 19,925.7 |
| Citizenship and Multiculturalism (Base) | 33 | 54 | 70 | 70.7 |
| Time-Limited Investments | – | – | 21 | – |
| COVID-19 Time-Limited Funding8 | 3 | 2 | – | – |
| Citizenship and Multiculturalism (Total) | 36 | 56 | 90 | 70.7 |
| Colleges and Universities (Base)9 | 9,542 | 10,714 | 11,244 | 10,818.8 |
| Student Financial Assistance | 954 | 1,019 | 1,332 | 1,370.3 |
| COVID-19 Time-Limited Funding10 | 117 | 32 | – | – |
| Colleges and Universities (Total) | 10,614 | 11,764 | 12,576 | 12,189.1 |
| Economic Development, Job Creation and Trade (Base) | 164 | 167 | 189 | 193.0 |
| Tax Credits for Business Investment and Research and Development11 | 258 | 299 | 537 | 550.9 |
| Tax Credits for Business Investment and Research and Development — Amounts Related to Prior Years | 46 | 22 | 18 | – |
| Time-Limited Investments | 157 | 540 | 609 | 1,935.6 |
| COVID-19 Time-Limited Funding12 | 360 | 46 | – | – |
| Economic Development, Job Creation and Trade (Total) | 985 | 1,074 | 1,352 | 2,679.5 |
| Education (Base) | 28,893 | 32,357 | 35,063 | 37,605.6 |
| Teachers’ Pension Plan | 1,610 | 1,661 | 1,653 | 1,700.0 |
| Compensation Settlements | – | 1,266 | 1,532 | – |
| COVID-19 Time-Limited Funding13 | 1,060 | 918 | – | – |
| Education (Total) | 31,563 | 36,202 | 38,248 | 39,305.6 |
| Energy (Base) | 240 | 254 | 329 | 316.7 |
| Electricity Cost-Relief Programs | 6,313 | 5,844 | 6,120 | 7,336.1 |
| COVID-19 Time-Limited Funding14 | 274 | 2 | – | – |
| Energy (Total) | 6,827 | 6,100 | 6,448 | 7,652.9 |
| Environment, Conservation and Parks (Base) | 687 | 727 | 835 | 860.4 |
| One-Time Accounting Adjustment for Contaminated Sites | – | – | 80 | – |
| COVID-19 Time-Limited Funding15 | 16 | 17 | – | – |
| Environment, Conservation and Parks (Total) | 703 | 743 | 915 | 860.4 |
| Executive Offices (Base) | 49 | 55 | 68 | 66.8 |
| COVID-19 Time-Limited Funding16 | 2 | 0 | – | – |
| Executive Offices (Total) | 51 | 55 | 68 | 66.8 |
| Finance (Base) | 759 | 799 | 906 | 969.3 |
| Investment Management Corporation of Ontario17 | 210 | 245 | 296 | 312.7 |
| Ontario Municipal Partnership Fund | 502 | 501 | 502 | 501.9 |
| Temporary and Other Local Assistance | 21 | 21 | 68 | 41.0 |
| Power Supply Contract Costs | 67 | 48 | 39 | 43.7 |
| Time-Limited Investments | – | 174 | 119 | – |
| COVID-19 Time-Limited Funding18 | 231 | 0 | – | – |
| Finance (Total) | 1,789 | 1,789 | 1,930 | 1,868.6 |
| Francophone Affairs (Base) | 7 | 7 | 8 | 8.6 |
| Time-Limited Investments | – | 1 | – | 4.7 |
| COVID-19 Time-Limited Funding19 | 2 | – | – | – |
| Francophone Affairs (Total) | 9 | 8 | 8 | 13.3 |
| Health (Base) | 64,285 | 67,872 | 74,638 | 75,636.4 |
| Compensation Settlements | – | 970 | 2,080 | – |
| Health (Total)20 | 64,285 | 68,842 | 76,717 | 75,636.4 |
| COVID-19 Health Response21 | 6,167 | 3,331 | – | – |
| Indigenous Affairs (Base) | 85 | 111 | 134 | 137.0 |
| One-Time Investments Including Settlements | 152 | 6,273 | 17 | – |
| COVID-19 Time-Limited Funding22 | 4 | 1 | – | – |
| Indigenous Affairs (Total) | 241 | 6,384 | 151 | 137.0 |
| Infrastructure (Base) | 192 | 170 | 454 | 856.0 |
| Federal–Provincial Infrastructure Programs | 267 | 303 | 366 | 414.5 |
| High-Speed Internet | 75 | 328 | 316 | 1,376.9 |
| Waterfront Toronto Revitalization (Port Lands Flood Protection) | 156 | 25 | 25 | 30.2 |
| Municipal Infrastructure Program Investments | 399 | 396 | 393 | 672.1 |
| Realty | 1,174 | 1,195 | 1,198 | 1,340.8 |
| COVID-19 Time-Limited Funding23 | 10 | – | – | – |
| Infrastructure (Total) | 2,272 | 2,416 | 2,753 | 4,690.5 |
| Labour, Immigration, Training and Skills Development (Base) | 102 | 202 | 248 | 256.1 |
| Training Tax Credits (Co-operative Education and Apprenticeship Training)24 | 105 | 86 | 116 | 113.9 |
| Demand-Driven Employment and Training Programs | 1,016 | 1,269 | 1,294 | 1,268.3 |
| Time-Limited Investments | – | – | 13 | – |
| COVID-19 Time-Limited Funding25 | 794 | 310 | – | – |
| Labour, Immigration, Training and Skills Development (Total) | 2,017 | 1,866 | 1,670 | 1,638.3 |
| Long-Term Care (Total)26 | 5,301 | 6,305 | 7,750 | 9,324.6 |
| Mines (Base) | 135 | 147 | 191 | 209.1 |
| One-Time Accounting Adjustment for Contaminated Sites | 183 | 86 | 334 | – |
| Mines (Total) | 318 | 233 | 525 | 209.1 |
| Municipal Affairs and Housing (Base) | 486 | 564 | 779 | 785.0 |
| Time-Limited Investments | 351 | 404 | 764 | 1,099.4 |
| Social Housing Agreement — Payments to Service Managers27 | 281 | 206 | 194 | 168.8 |
| COVID-19 Time-Limited Funding28 | 330 | 390 | – | – |
| Municipal Affairs and Housing (Total) | 1,447 | 1,563 | 1,738 | 2,053.2 |
| Natural Resources and Forestry (Base) | 605 | 613 | 666 | 680.2 |
| Emergency Forest Firefighting | 237 | 95 | 216 | 135.0 |
| Compensation Settlements | – | – | 26 | – |
| COVID-19 Time-Limited Funding29 | 12 | 2 | – | – |
| Natural Resources and Forestry (Total) | 855 | 710 | 907 | 815.1 |
| Northern Development (Base) | 605 | 661 | 719 | 762.3 |
| COVID-19 Time-Limited Funding30 | 41 | – | – | – |
| Northern Development (Total) | 646 | 661 | 719 | 762.3 |
| Public and Business Service Delivery (Base)31 | 613 | 963 | 1,131 | 743.0 |
| COVID-19 Time-Limited Funding32 | 141 | 201 | – | – |
| Public and Business Service Delivery (Total) | 754 | 1,165 | 1,131 | 743.0 |
| Seniors and Accessibility (Base) | 53 | 63 | 65 | 66.3 |
| Seniors Tax Credits (Home Safety and Care at Home) | 30 | 164 | 108 | 119.4 |
| COVID-19 Time-Limited Funding33 | 43 | 11 | – | – |
| Seniors and Accessibility (Total) | 127 | 237 | 173 | 185.6 |
| Solicitor General (Base) | 2,981 | 3,375 | 3,765 | 3,912.6 |
| Compensation Settlements | – | – | 233 | – |
| COVID-19 Time-Limited Funding34 | 150 | 96 | – | – |
| Solicitor General (Total) | 3,131 | 3,472 | 3,998 | 3,912.6 |
| Tourism, Culture and Sport (Base) | 833 | 829 | 840 | 870.2 |
| Time-Limited Investments | – | – | – | 50.0 |
| Ontario Cultural Media Tax Credits | 693 | 833 | 841 | 1,034.4 |
| Ontario Cultural Media Tax Credits — Amounts Related to Prior Years | 84 | 51 | 89 | – |
| COVID-19 Time-Limited Funding35 | 257 | 200 | – | – |
| Tourism, Culture and Sport (Total) | 1,868 | 1,913 | 1,770 | 1,954.7 |
| Transportation (Base) | 4,854 | 5,547 | 6,388 | 6,390.4 |
| Federal–Provincial Infrastructure Programs | 557 | 477 | 743 | 708.4 |
| Time-Limited Investments | – | – | 729 | – |
| Compensation Settlements | – | – | 25 | – |
| COVID-19 Time-Limited Funding36 | 369 | 609 | – | – |
| Transportation (Total) | 5,780 | 6,633 | 7,885 | 7,098.7 |
| Treasury Board Secretariat (Base)37 | 315 | 476 | 633 | 918.1 |
| Employee and Pensioner Benefits | 2,633 | 1,178 | 1,035 | 1,223.5 |
| Operating Contingency Fund | – | – | 500 | 1,405.4 |
| Capital Contingency Fund | – | – | – | 100.0 |
| COVID-19 Time-Limited Funding38 | 2 | 0 | – | – |
| Treasury Board Secretariat (Total) | 2,950 | 1,654 | 2,168 | 3,647.0 |
| Interest on Debt39 | 12,583 | 12,389 | 12,843 | 13,913.0 |
| Total Expense | 183,103 | 198,750 | 207,313 | 214,495.9 |
Table 3.11 footnotes:
[1] Numbers reflect current ministry structure.
[2] Ministry expenses have been restated for reclassification and program transfer changes. These changes are fiscally neutral. The actual results are presented on a similar basis for consistency.
[3] Interim represents the 2024 Budget projection for the 2023–24 fiscal year.
[4], [5], [6], [7], [8], [10], [12], [13], [14], [15], [16], [18], [19], [22], [23], [25], [28], [29], [30], [31], [32], [33], [34], [35], [36], [37], [39] COVID‐19 Time‐Limited Funding is no longer reported separately, starting in 2023–24.
[9] Projected to decline from 2023–24 to 2024–25 primarily due to lower college spending as a result of the federal government announcement to cap international student study permit applications for two years, beginning in 2024.
[11] Includes the estimated cost of tax credit claims for the Regional Opportunities Investment Tax Credit, the Ontario Made Manufacturing Investment Tax Credit (OMMITC), the Ontario Innovation Tax Credit and the Ontario Business-Research Institute Tax Credit. The OMMITC was introduced in the 2023 Budget with costs commencing in 2023–24.
[17] Based on the requirements of Public Sector Accounting Standards, the Ontario government consolidates the financial results of the Investment Management Corporation of Ontario.
[20] Includes accounting adjustments tied primarily to grants provided for infrastructure projects and other related investments.
[21] For presentation purposes in the 2024 Budget, Time-Limited COVID-19-related health response spending has been included separately for 2021–22 to 2022–23 instead of within the Ontario Ministry of Health and Ontario Ministry of Long-Term Care.
[24] The Co-operative Education Tax Credit remains in effect. The Apprenticeship Training Tax Credit is eliminated for eligible apprenticeship programs that commenced on or after November 15, 2017. Amounts from 2021–22 to 2023–24 include tax credit amounts related to prior years; however, a decrease in costs of $18 million for the Apprenticeship Training Tax Credit in 2022–23 was reported separately as revenue.
[26] The Ontario Ministry of Long-Term Care total includes expenses incurred by Ontario Health and hospitals for funding for long-term care. These amounts will be consolidated in the total expense of the Ontario Ministry of Health, including $4.4 billion for interim 2023–24 and $5.2 billion in 2024–25.
[27] The annual decline from 2021–22 to 2023–24 is mainly due to declining federal obligations, such as maturing mortgages, under the Social Housing Agreement.
[37] Funding for Supply Ontario will transfer from the Ministry of Public and Business Service Delivery to Treasury Board Secretariat as of April 1, 2024, to reflect ministerial responsibility for oversight of the provincial agency.
[38] Interest on debt is net of interest capitalized during construction of tangible capital assets of $321 million in 2021–22, $694 million in 2022–23, $573 million in 2023–24 and $865 million in 2024–25.
Note: Numbers may not add due to rounding.
Sources: Ontario Treasury Board Secretariat and Ontario Ministry of Finance.
| Sector | Total Infrastructure Expenditures Interim1,2 2023–24 |
2024–25 Plan Investment in Capital Assets3 |
2024–25 Plan Transfers and Other Infrastructure Expenditures4 |
2024–25 Plan Total Infrastructure Expenditures |
|---|---|---|---|---|
| Transportation — Transit | 8,638 | 9,535 | 1,160 | 10,695 |
| Transportation — Provincial Highways | 3,285 | 3,649 | 222 | 3,872 |
| Transportation — Other Transportation, Property and Planning | 188 | 137 | 81 | 218 |
| Health — Hospitals | 3,348 | 3,545 | 37 | 3,582 |
| Health — Other Health | 640 | 47 | 255 | 303 |
| Education | 3,316 | 3,127 | 223 | 3,350 |
| Postsecondary Education — Colleges and Other | 765 | 792 | 87 | 879 |
| Postsecondary Education — Universities | 113 | – | 130 | 130 |
| Social | 435 | 26 | 949 | 975 |
| Justice | 514 | 860 | 48 | 908 |
| Other Sectors5 | 2,874 | 1,089 | 3,219 | 4,307 |
| Total Infrastructure Expenditures | 24,117 | 22,808 | 6,412 | 29,220 |
| Less: Other Partner Funding6 | 3,176 | 2,972 | – | 2,972 |
| Total7 | 20,941 | 19,836 | 6,412 | 26,248 |
Table 3.12 footnotes:
[1] Interim represents the 2024 Budget projection for the 2023–24 fiscal year.
[2] Includes provincial investment in capital assets of $14.7 billion.
[3] Includes $865 million in interest capitalized during construction.
[4] Includes transfers to municipalities, universities and non-consolidated agencies.
[5] Includes high-speed internet infrastructure, government administration, natural resources, and culture and tourism industries.
[6] Other Partner Funding refers to third-party investments primarily in hospitals, colleges and schools.
[7] Includes Federal–Municipal contributions to provincial infrastructure investments.
Note: Numbers may not add due to rounding.
Source: Ontario Treasury Board Secretariat.
| 2015–16 | 2016–17 | 2017–18 | 2018–19 | 2019–20 | 2020–21 | 2021–22 | Actual 2022–23 |
Interim4 2023–24 |
Plan 2024–25 |
|
|---|---|---|---|---|---|---|---|---|---|---|
| Revenue | 136,148 | 140,734 | 150,696 | 153,804 | 156,167 | 164,970 | 185,128 | 192,887 | 204,336 | 205,690 |
| Expense — Programs | 129,905 | 131,442 | 142,464 | 148,747 | 152,265 | 168,964 | 170,520 | 186,361 | 194,470 | 200,583 |
| Expense — Interest on Debt2 | 11,589 | 11,727 | 11,912 | 12,385 | 12,497 | 12,296 | 12,583 | 12,389 | 12,843 | 13,913 |
| Total Expense | 141,494 | 143,169 | 154,375 | 161,132 | 164,762 | 181,260 | 183,103 | 198,750 | 207,313 | 214,496 |
| Reserve | – | – | – | – | – | – | – | – | – | 1,000 |
| Surplus/(Deficit) | (5,346) | (2,435) | (3,679) | (7,328) | (8,595) | (16,290) | 2,025 | (5,863) | (2,977) | (9,806) |
| Net Debt | 306,357 | 314,077 | 323,068 | 337,623 | 352,382 | 372,501 | 382,842 | 400,484 | 414,814 | 439,056 |
| Accumulated Deficit | 203,014 | 205,939 | 208,257 | 215,770 | 224,814 | 238,231 | 238,160 | 246,804 | 249,781 | 259,587 |
| Gross Domestic Product (GDP) at Market Prices | 760,435 | 790,749 | 824,979 | 860,103 | 893,224 | 874,354 | 960,226 | 1,048,258 | 1,091,497 | 1,120,967 |
| Primary Household Income | 512,570 | 520,486 | 541,501 | 567,484 | 593,065 | 592,514 | 642,859 | 695,228 | 739,268 | 768,844 |
| Population (000s) — July3 | 13,709 | 13,877 | 14,078 | 14,327 | 14,574 | 14,762 | 14,842 | 15,145 | 15,608 | 16,021 |
| Net Debt per Capita (Dollars) | 22,347 | 22,634 | 22,948 | 23,566 | 24,180 | 25,234 | 25,794 | 26,443 | 26,576 | 27,405 |
| Household Income per Capita (Dollars) | 37,389 | 37,508 | 38,463 | 39,610 | 40,695 | 40,138 | 43,312 | 45,905 | 47,364 | 47,990 |
| Net Debt as a Per Cent of Revenue | 225.0% | 223.2% | 214.4% | 219.5% | 225.6% | 225.8% | 206.8% | 207.6% | 203.0% | 213.5% |
| Interest on Debt as a Per Cent of Revenue | 8.5% | 8.3% | 7.9% | 8.1% | 8.0% | 7.5% | 6.8% | 6.4% | 6.3% | 6.8% |
| Net Debt as a Per Cent of GDP | 40.3% | 39.7% | 39.2% | 39.3% | 39.5% | 42.6% | 39.9% | 38.2% | 38.0% | 39.2% |
| Accumulated Deficit as a Per Cent of GDP | 26.7% | 26.0% | 25.2% | 25.1% | 25.2% | 27.2% | 24.8% | 23.5% | 22.9% | 23.2% |
Table 3.13 footnotes:
[1] Amounts reflect a change in pension expense that was calculated based on recommendations of the Independent Financial Commission of Inquiry, as described in Note 19 to the Consolidated Financial Statements, in Public Accounts of Ontario 2017–2018. Amounts for net debt and accumulated deficit also reflect this change.
[2] Interest on debt is net of interest capitalized during construction of tangible capital assets of $321 million in 2021–22, $694 million in 2022–23, $573 million in 2023–24 and $865 million in 2024–25.
[3] Population figures are for July 1 of the fiscal year indicated (i.e., for 2023–24, the population on July 1, 2023, is shown).
[4] Interim represents the 2024 Budget projection for the 2023–24 fiscal year.
Note: Numbers may not add due to rounding.
Sources: Statistics Canada, Ontario Treasury Board Secretariat, and Ontario Ministry of Finance.
Footnotes
[1] The three experts are from the Policy and Economic Analysis Program at the University of Toronto; Quantitative Economic Decisions, Inc. (QEDinc.); and Stokes Economics Consulting, Inc.
Chart Descriptions
Chart 3.1: Current Fiscal Outlook Compared to the 2023 Budget and 2023 Ontario Economic Outlook and Fiscal Review
The bar chart illustrates the fiscal outlooks presented in the 2023 Budget and the 2023 Ontario Economic Outlook and Fiscal Review compared to the current outlook in the 2024 Budget. The 2023 Budget projected a deficit of $1.3 billion in 2023–24 and surpluses of $0.2 billion in 2024–25 and $4.4 billion in 2025–26. The 2023 Ontario Economic Outlook and Fiscal Review projected deficits of $5.6 billion in 2023–24 and $5.3 billion in 2024–25, and a surplus of $0.5 billion in 2025–26. With the release of the 2024 Budget, the deficit projections have been revised to deficits of $3.0 billion in 2023–24, $9.8 billion in 2024–25 and $4.6 billion in 2025–26, and a surplus of $0.5 billion in 2026–27.
Source: Ontario Ministry of Finance.
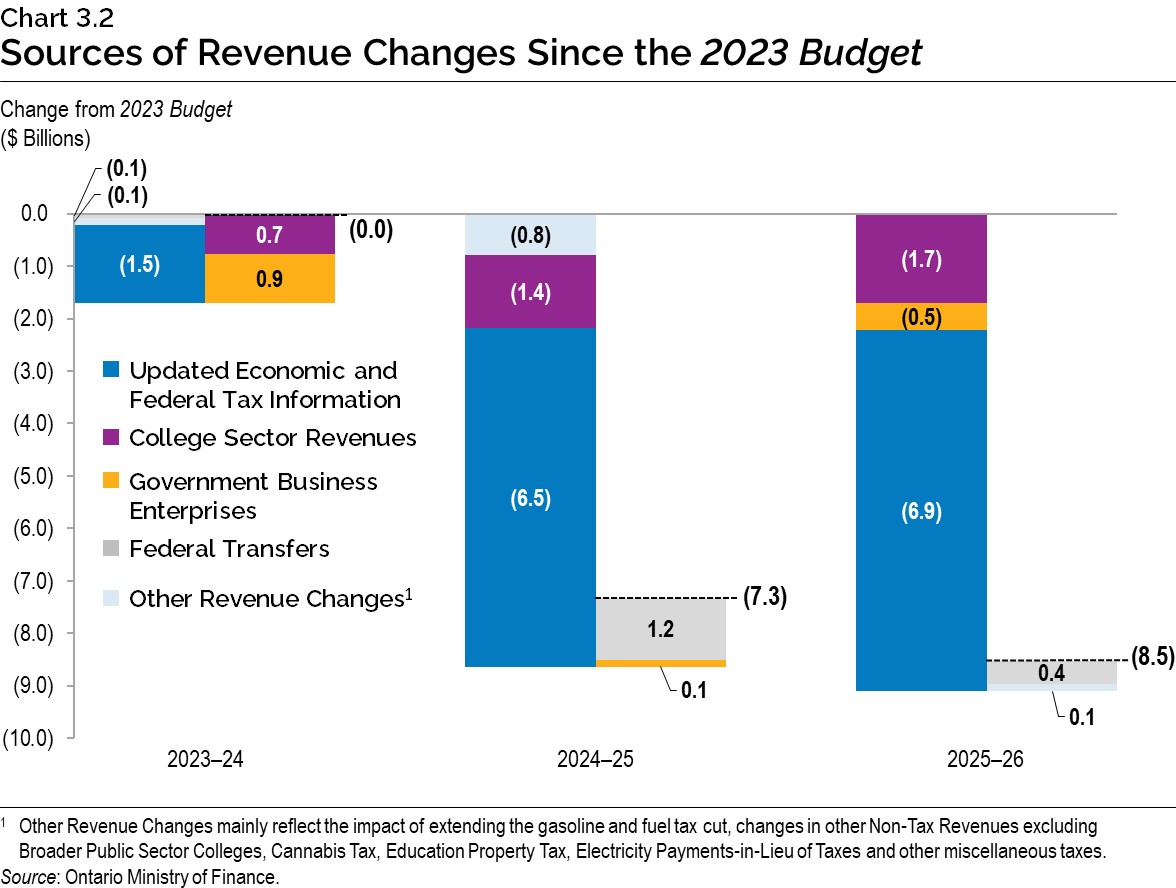
Chart 3.2: Sources of Revenue Changes Since the 2023 Budget
The multi-year chart identifies the sources of revenue changes since the 2023 Budget for each year of the medium-term outlook. In 2023–24, total revenues are projected to be slightly lower than the 2023 Budget. The overall decline is due to decreases in revenue of $1.5 billion caused by updated economic and federal tax information, $0.1 billion in Federal Transfers and $0.1 billion in Other Revenue changes1, partially offset by increases of $0.9 billion in Government Business Enterprises and $0.7 billion in College sector revenues.
In 2024–25, total revenues are projected to be $7.3 billion lower than the 2023 Budget. The overall decline is due to decreases in revenue of $0.8 billion in other revenue changes, $1.4 billion in College sector revenues and $6.5 billion caused by updated economic and federal tax information, partially offset by increases of $1.2 billion in Federal Transfers and $0.1 billion in Government Business Enterprises.
In 2025–26, total revenues are projected to be $8.5 billion lower than the 2023 Budget. The overall decline is due to decreases in revenue of $1.7 billion in College sector revenues, $0.5 billion in Government Business Enterprises and $6.9 billion caused by updated economics and federal tax information, partially offset by increases of $0.4 billion in Federal Transfers and $0.1 billion in other revenue changes.
[1] Other Revenue Changes mainly reflect the impact of extending the gasoline and fuel tax cut, changes in other Non-Tax Revenues excluding Broader Public Sector Colleges, Cannabis Tax, Education Property Tax, Electricity Payments-in-Lieu of Taxes and other miscellaneous taxes.
Source: Ontario Ministry of Finance.
Chart 3.3: Ontario Fiscal Outlook Scenarios
The bar chart illustrates the range of Ontario fiscal outlooks based on the two alternative economic scenarios presented in Chapter 2: Economic Performance and Outlook. The 2024 Budget outlook estimates the deficit to be $9.8 billion in 2024–25 and $4.6 billion in 2025–26, followed by a surplus of $0.5 billion in 2026–27. Under the Faster Growth scenario, the deficit outlook is estimated to be $6.1 billion in 2024–25, followed by surpluses of $2.0 billion in 2025–26 and $9.7 billion in 2026–27. Under the Slower Growth scenario, the deficit outlook is estimated to be $13.3 billion in 2024–25, $10.4 billion in 2025–26 and $7.5 billion in 2026–27.
Source: Ontario Ministry of Finance.
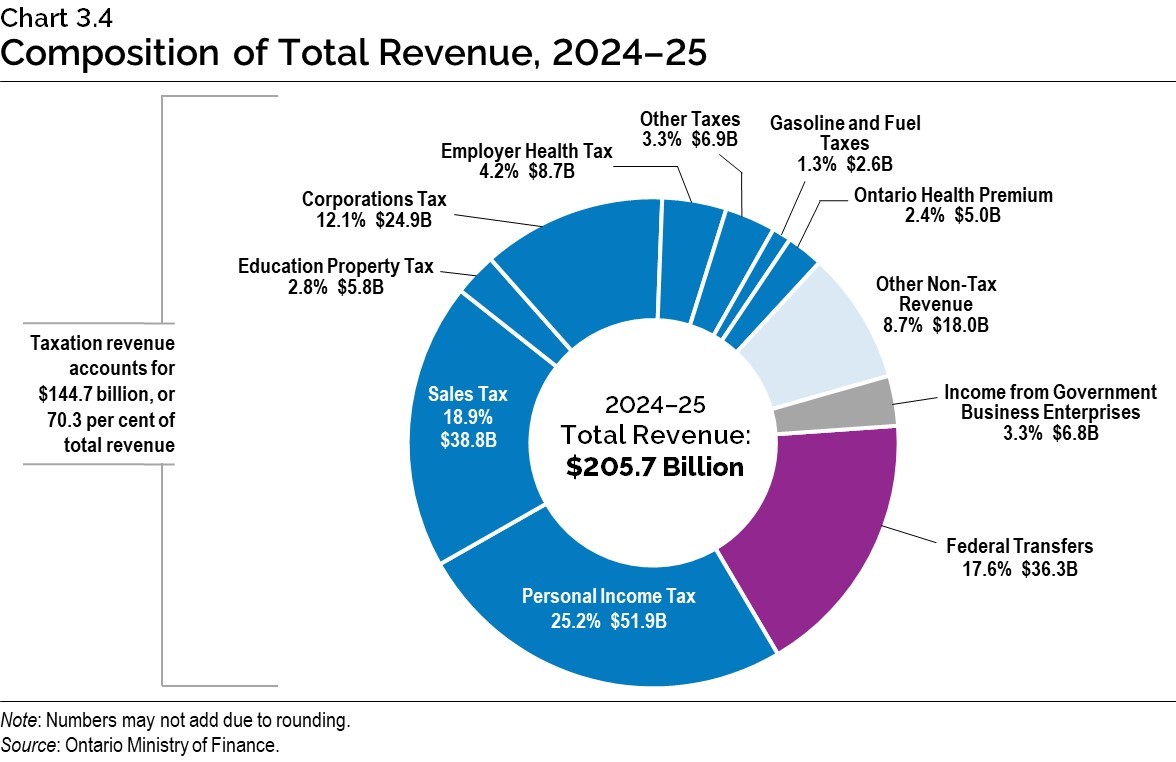
Chart 3.4: Composition of Total Revenue, 2024–25
The pie chart shows the composition of Ontario’s revenue in 2024–25, which is projected to be $205.7 billion. The largest taxation revenue source is Personal Income Tax revenue at $51.9 billion, accounting for 25.2 per cent of total revenue. This is followed by Sales Tax at $38.8 billion, or 18.9 per cent of total revenue; and Corporations Tax at $24.9 billion, or 12.1 per cent of total revenue. Other components of taxation revenue include Education Property Tax at $5.8 billion, or 2.8 per cent of total revenue; Employer Health Tax at $8.7 billion, or 4.2 per cent; Gasoline Tax and Fuel Taxes at $2.6 billion, or 1.3 per cent; the Ontario Health Premium at $5.0 billion, or 2.4 per cent; and Other Taxes at $6.9 billion, or 3.3 per cent of total revenue.
Total taxation revenue accounts for $144.7 billion, or 70.3 per cent of total revenue.
The other major non-taxation sources of revenue are Federal Transfers of $36.3 billion, or 17.6 per cent of total revenue; Income from Government Business Enterprises at $6.8 billion, or 3.3 per cent of total revenue; and various Other Non-Tax Revenue at $18.0 billion, or 8.7 per cent of total revenue.
Note: Numbers may not add due to rounding.
Source: Ontario Ministry of Finance.
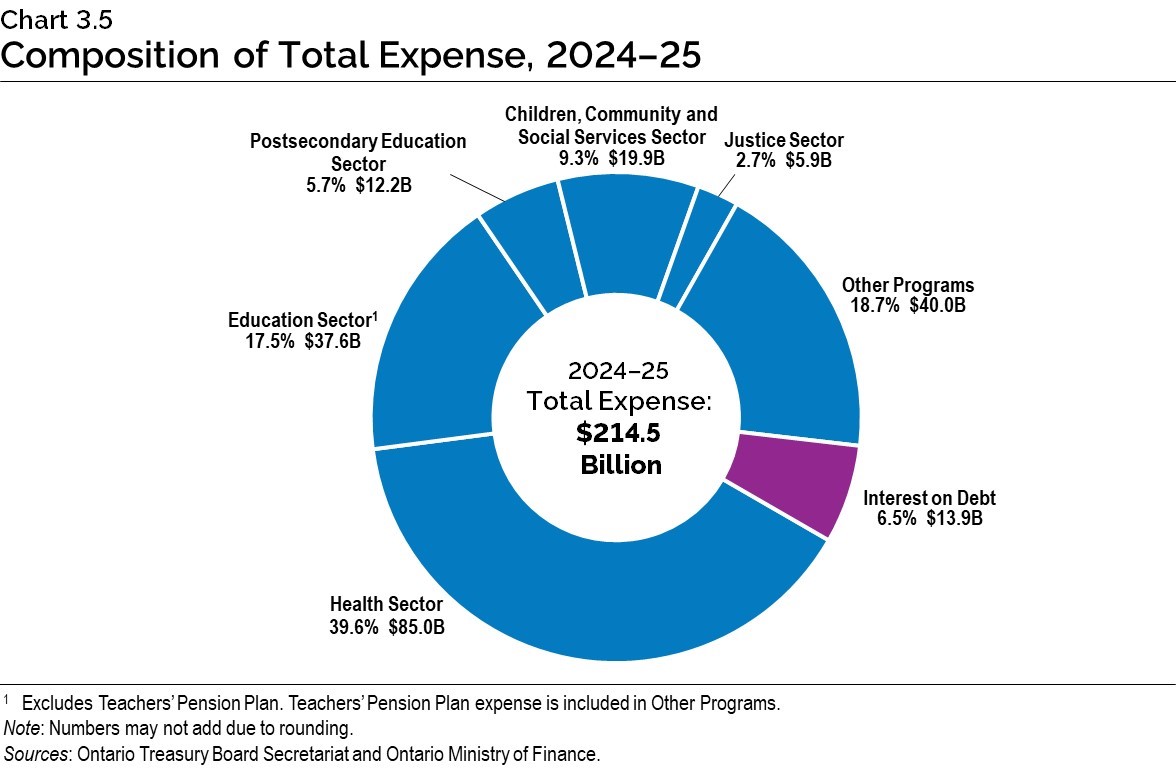
Chart 3.5: Composition of Total Expense, 2024–25
The pie chart shows the share of Ontario’s total expense and dollar amounts by sector in 2024–25.
Total expense in 2024–25 is projected to be $214.5 billion.
The largest expense is the Health sector at $85.0 billion, accounting for 39.6 per cent of total expense.
The remaining sectors of total expense include the Education sector1 at $37.6 billion or 17.5 per cent; the Postsecondary Education sector at $12.2 billion or 5.7 per cent; the Children, Community and Social Services sector at $19.9 billion or 9.3 per cent; the Justice Sector at $5.9 billion or 2.7 per cent; Other Programs at $40.0 billion or 18.7 per cent; and Interest on Debt, included as part of Total Expense, is $13.9 billion or 6.5 per cent.
[1] Excludes Teachers’ Pension Plan. Teachers’ Pension Plan expense is included in Other Programs.
Note: Numbers may not add due to rounding.
Sources: Ontario Treasury Board Secretariat and Ontario Ministry of Finance.