Introduction
As Ontario continues on its path to balance the budget, the borrowing program remains responsibly and prudently managed to minimize interest on debt (IOD).
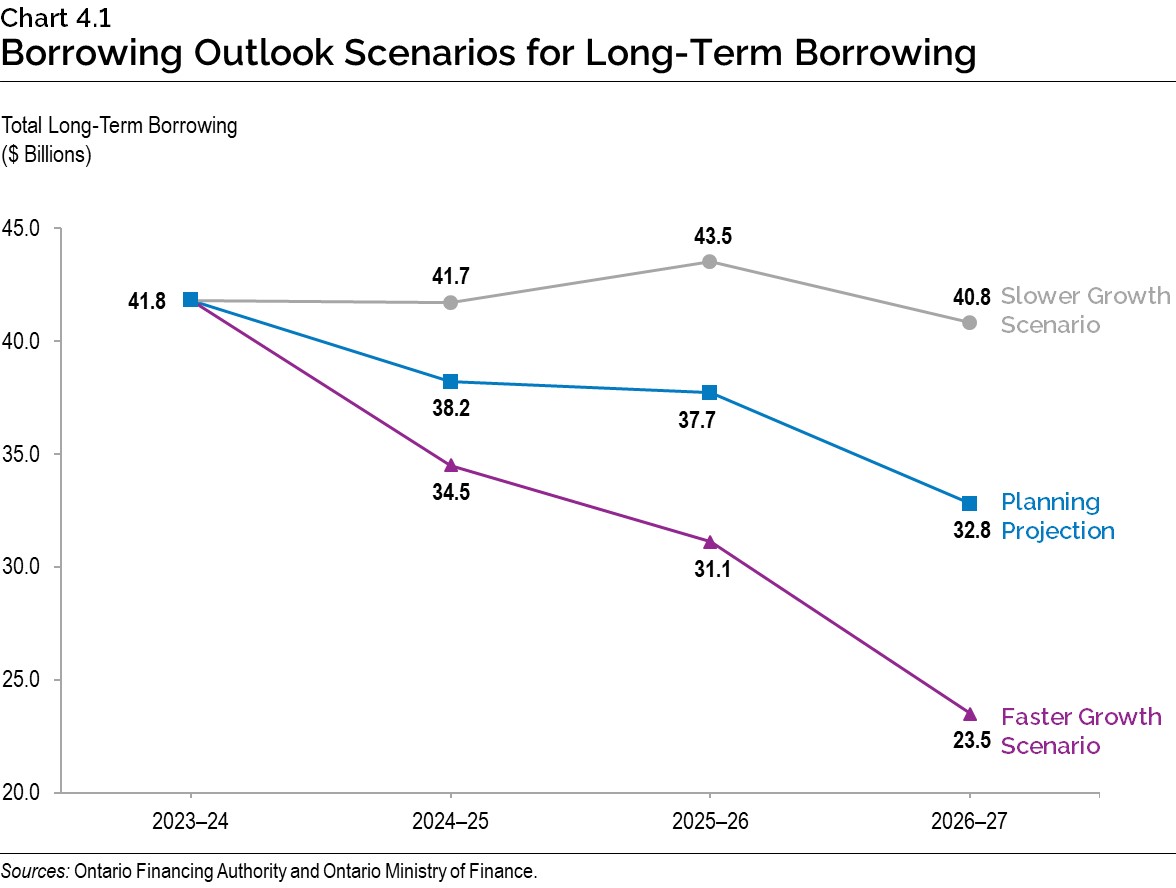
Ontario has completed $41.8 billion in long-term borrowing in 2023–24. This is $14.3 billion higher than anticipated in the 2023 Budget, primarily as a result of non-cash and cash timing adjustments, a modestly higher deficit for 2023–24 and higher year-end cash levels to pre-borrow for future years’ funding needs. The 2024–25 and 2025–26 long-term public borrowing forecasts are $38.2 billion and $37.7 billion, an increase of $9.5 billion and $4.3 billion from the 2023 Budget forecast, respectively, but only $0.8 billion and $0.7 billion higher than the forecast in the 2023 Ontario Economic Outlook and Fiscal Review. Long-term public borrowing for 2026–27 is forecast to be $32.8 billion.
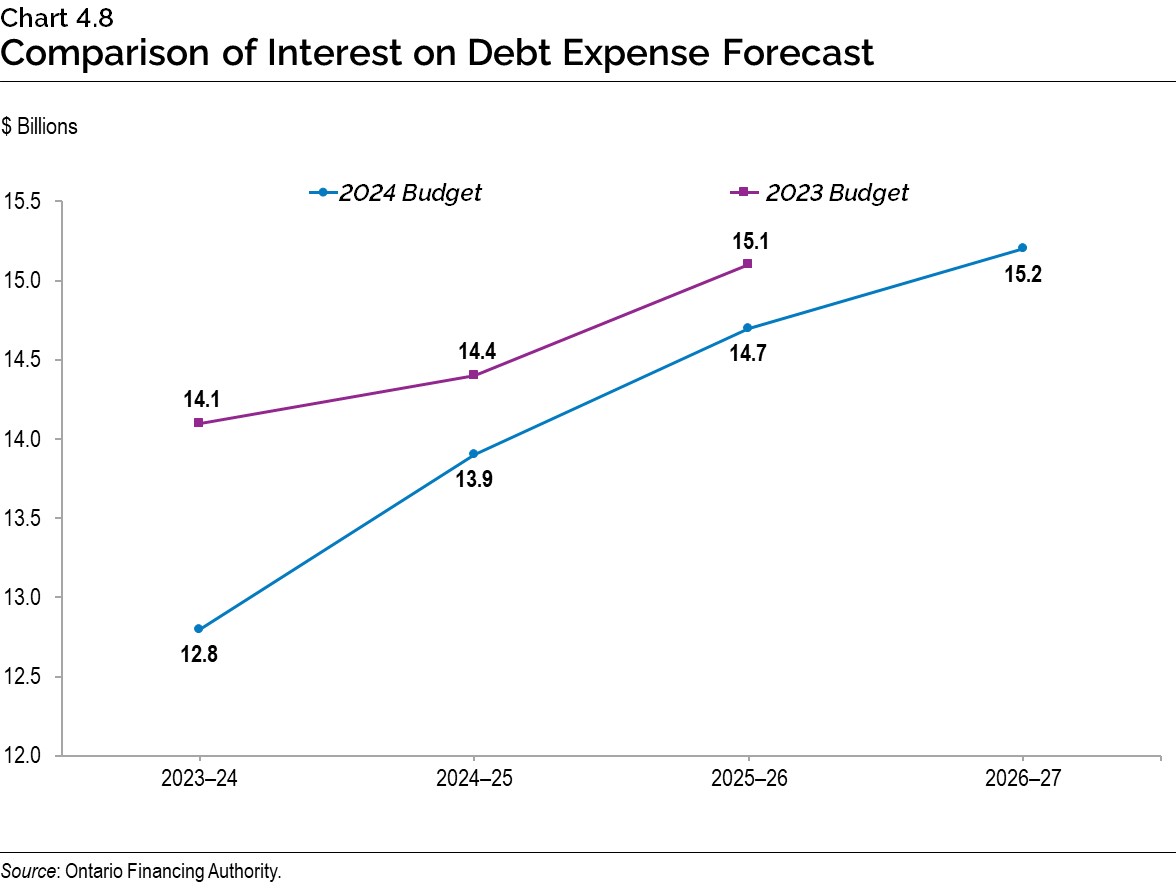
Ontario is forecast to pay $12.8 billion in interest costs in 2023–24, $13.9 billion in 2024–25 and $14.7 billion in 2025–26, down from the 2023 Budget forecast of $14.1 billion, $14.4 billion and $15.1 billion, respectively. These lower interest costs total a cumulative savings of more than $2 billion over the three years, due to lower than projected borrowing costs. Interest costs in 2026–27 are forecast to be $15.2 billion.
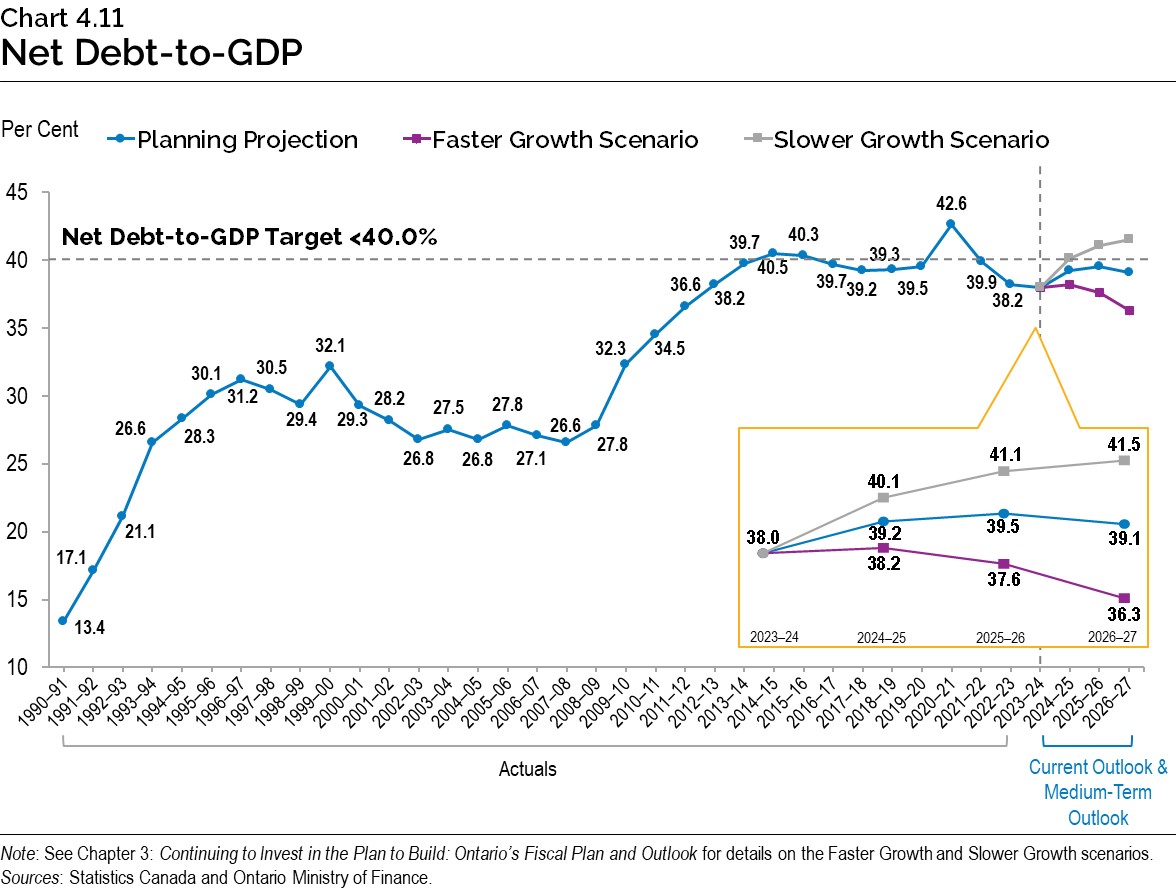
Ontario continues to make progress on its debt burden reduction strategy. The net debt-to-GDP ratio is now forecast to be 38.0 per cent in 2023–24, 39.2 per cent in 2024–25, 39.5 per cent in 2025–26 and 39.1 per cent in 2026–27.
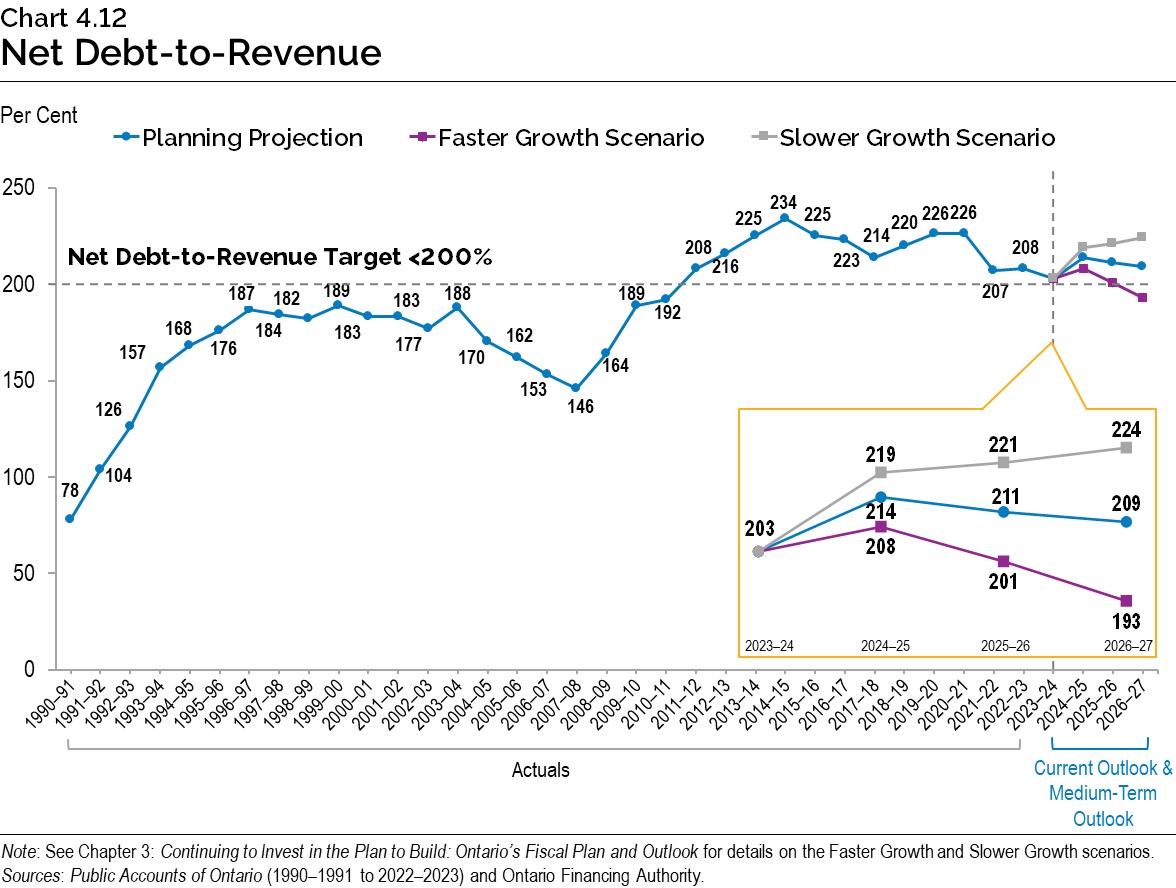
Ontario’s net debt-to-revenue is forecast to be 203 per cent in 2023–24, 214 per cent in 2024–25, 211 per cent in 2025–26 and 209 per cent in 2026–27.
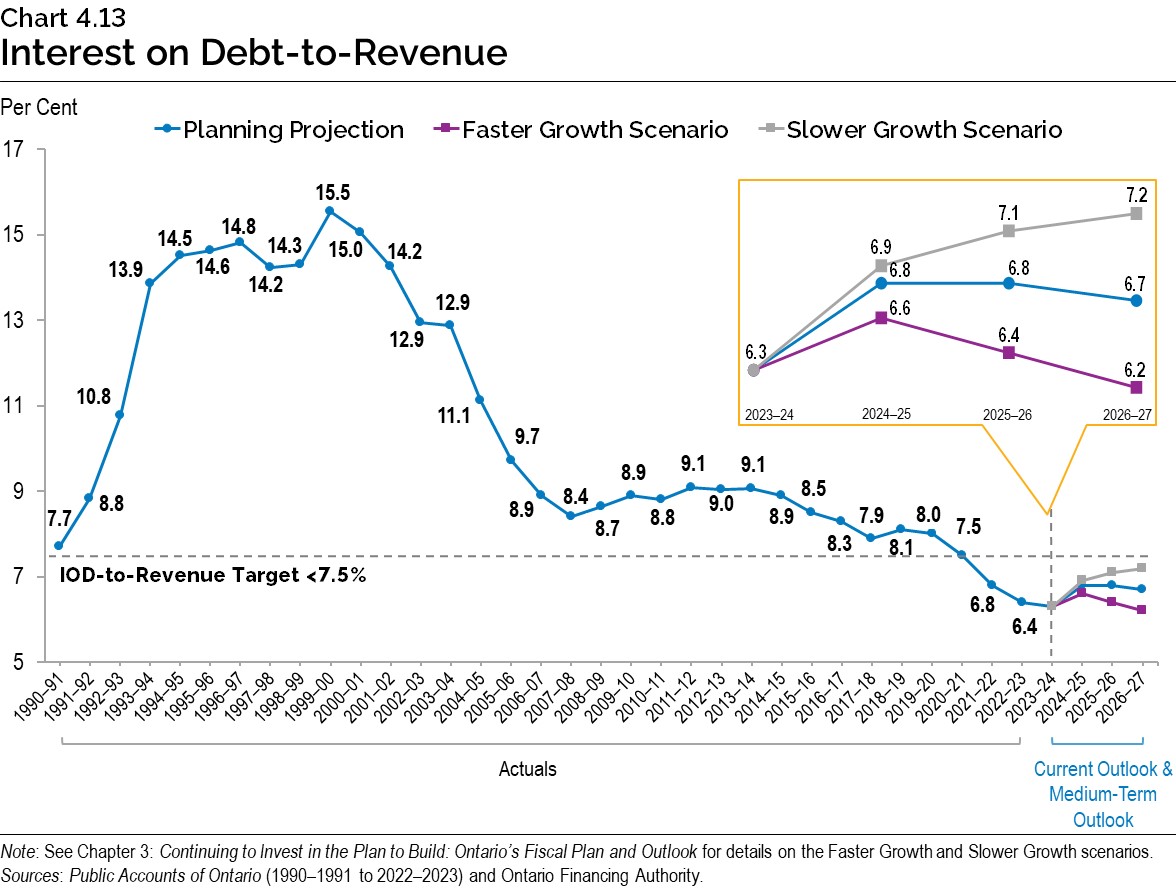
Ontario’s interest on debt-to-revenue is forecast to be 6.3 per cent in 2023–24, 6.8 per cent in 2024–25 and 2025–26, and 6.7 per cent in 2026–27.
Borrowing Program
Ontario’s borrowing program is primarily used to fund deficits, refinance maturing debt, and make investments in capital assets. Ontario will continue to finance most of its borrowing program in the long-term public markets in Canada and internationally.
| 2023–24 2023 Budget |
2023–24 Change from 2023 Budget |
2023–24 Interim1 2023–24 |
Medium-Term Outlook 2024–25 |
Medium-Term Outlook 2025–26 |
Medium-Term Outlook 2026–27 |
|
|---|---|---|---|---|---|---|
| Deficit/(Surplus) | 1.3 | 1.7 | 3.0 | 9.8 | 4.6 | (0.5) |
| Investment in Capital Assets | 13.6 | 1.2 | 14.7 | 17.7 | 20.2 | 20.4 |
| Non-Cash and Cash Timing Adjustments | (9.2) | 7.6 | (1.6) | (11.0) | (12.0) | (13.9) |
| Net Loans and Investments | 0.1 | (0.4) | (0.2) | (0.3) | 0.1 | – |
| Debt Maturities and Redemptions | 31.2 | – | 31.2 | 28.0 | 33.1 | 26.9 |
| Total Funding Requirement | 37.0 | 10.1 | 47.1 | 44.2 | 46.0 | 32.8 |
| Decrease/(Increase) in Short-Term Borrowing | – | – | – | (5.0) | – | – |
| Increase/(Decrease) in Year-End Cash and Cash Equivalents2 | 5.0 | 4.3 | 9.3 | (1.0) | (8.3) | – |
| Pre-borrowing in 2022–23 for 2023–24 | (14.5) | – | (14.5) | – | – | – |
| Total Long-Term Borrowing | 27.5 | 14.3 | 41.8 | 38.2 | 37.7 | 32.8 |
Table 4.1 footnotes:
[1] Interim represents the 2024 Budget projection for the 2023–24 fiscal year.
[2] Starting in 2024–25, pre-borrowing will be reflected as part of the increase in year-end cash and cash equivalents
Note: Numbers may not add due to rounding.
Source: Ontario Financing Authority.
Ontario has completed $41.8 billion in long-term borrowing in 2023–24. This is $14.3 billion higher than anticipated in the 2023 Budget, primarily as a result of non-cash and cash timing adjustments, a modestly higher deficit for 2023–24 and higher year-end cash levels to pre-borrow for future years’ funding needs. The 2024–25 and 2025–26 long-term public borrowing forecasts are $38.2 billion and $37.7 billion, an increase of $9.5 billion and $4.3 billion from the 2023 Budget forecast, respectively, but only $0.8 billion and $0.7 billion higher than the forecast in the 2023 Ontario Economic Outlook and Fiscal Review. Long-term public borrowing for 2026–27 is forecast to be $32.8 billion.
Year-end cash and cash equivalents are forecast to decrease by $1.0 billion in 2024–25 and $8.3 billion in 2025–26. Starting in 2024–25, pre-borrowing will be reflected as part of the increase in year-end cash and cash equivalents, rather than having a separate line for pre-borrowing.
Ontario plans to increase short-term borrowing by $5.0 billion in 2024–25. This positions Ontario to respond to recent changes in market demand for short-term Ontario debt. It will also maintain the proportion of short-term debt as a percentage of total debt outstanding within the target range of five to seven per cent, as it has been over the past 10 years.
In the event that alternative economic scenarios materialize, Ontario’s borrowing requirements in the next three years would also change (see Chapter 3: Continuing to Invest in the Plan to Build: Ontario’s Fiscal Plan and Outlook for more details, and a description of the resulting alternative medium-term outlook scenarios). Under the Faster Growth scenario, long-term borrowing would decrease by a total of $19.6 billion over the three-year outlook period, while under the Slower Growth scenario, long‑term borrowing would increase by $17.3 billion over the same period.
Approximately 86 per cent of 2023–24 long-term borrowing was completed in Canadian dollars, through 36 syndicated issues, one floating rate note and two Green Bonds. This percentage was within Ontario’s target range for domestic borrowing of 75 to 90 per cent for the 2023–24 fiscal year. Based on the combined experience of the last five fiscal years, Ontario’s target range for domestic borrowing will remain unchanged for 2024–25. This range will be adjusted, if necessary, in response to evolving investor demand in the Canadian dollar and foreign currency debt markets.
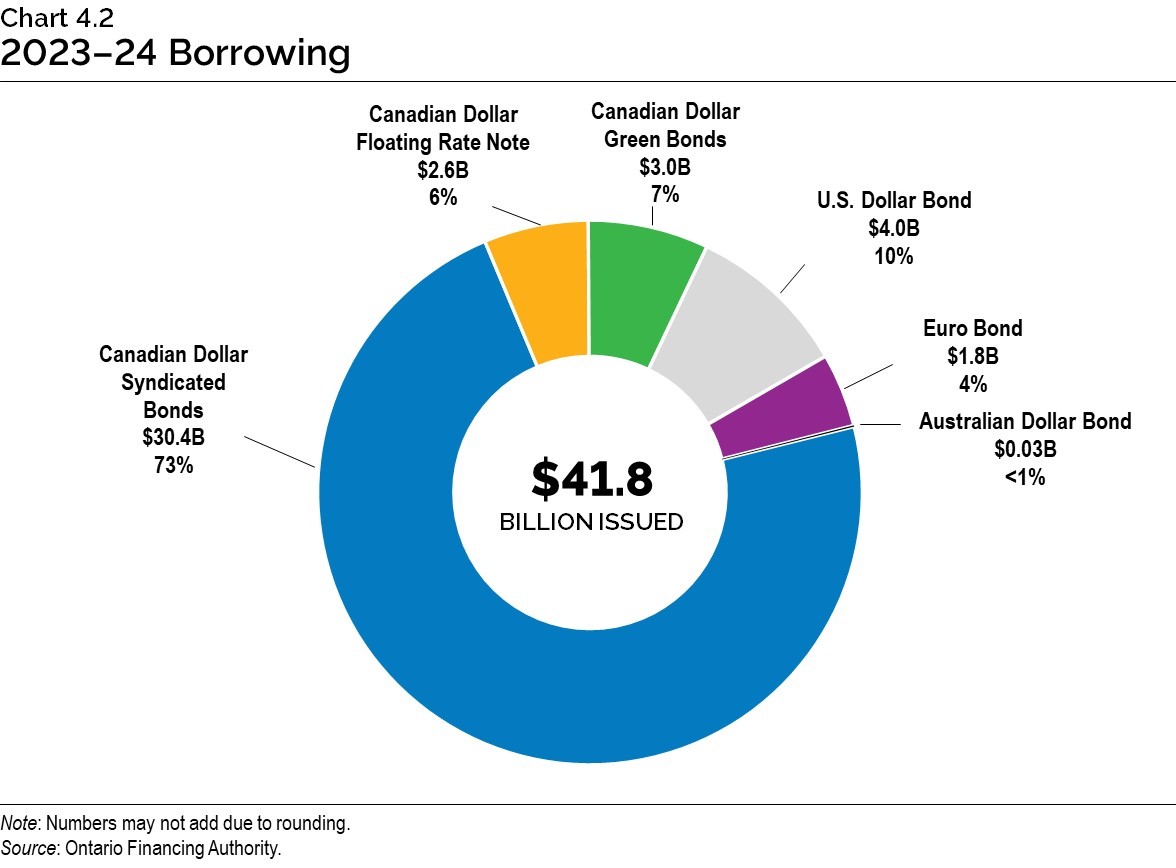
Foreign currency borrowing helps reduce Ontario’s overall borrowing costs by continuing to diversify Ontario’s investor base. This diversification ensures the province will continue to have access to capital even if domestic market conditions become challenging. Approximately $5.9 billion, or 14 per cent of this year’s long-term borrowing, was completed in foreign currencies, primarily in U.S. dollars and euros.
Sustainable Bond Program
Green Bonds have been a core component of Ontario’s borrowing program since 2014. They are an important tool to help finance public transit initiatives, extreme weather-resistant infrastructure, as well as energy efficiency and conservation projects. Ontario remains the largest and most frequent issuer of Canadian dollar Green Bonds, with 15 issues totalling $18.0 billion since 2014–15 and $15.95 billion outstanding.
In January 2024, the government released the new Ontario Sustainable Bond Framework, replacing its Green Bond Framework from 2014. The new framework will allow for a broader range of potential bond offerings in the future, including emissions-free nuclear power.
On February 29, 2024, Ontario issued a $1.5 billion Green Bond. This was the second Green Bond issued in 2023–24, fifteenth Green Bond overall, and Ontario’s first Green Bond issued under the new Ontario Sustainable Bond Framework. Five projects were selected to receive funding from the most recent Green Bond:
- GO Transit Expansion;
- Hazel McCallion Light Rail Transit;
- Ontario Line Subway;
- Scarborough Subway Extension; and
- Electric Vehicle (EV) ChargeON.
Ontario plans to continue its leadership in the Canadian dollar Green Bond market and, subject to market conditions, will issue multiple Green Bonds each fiscal year, including in 2024–25.
Cost of Debt
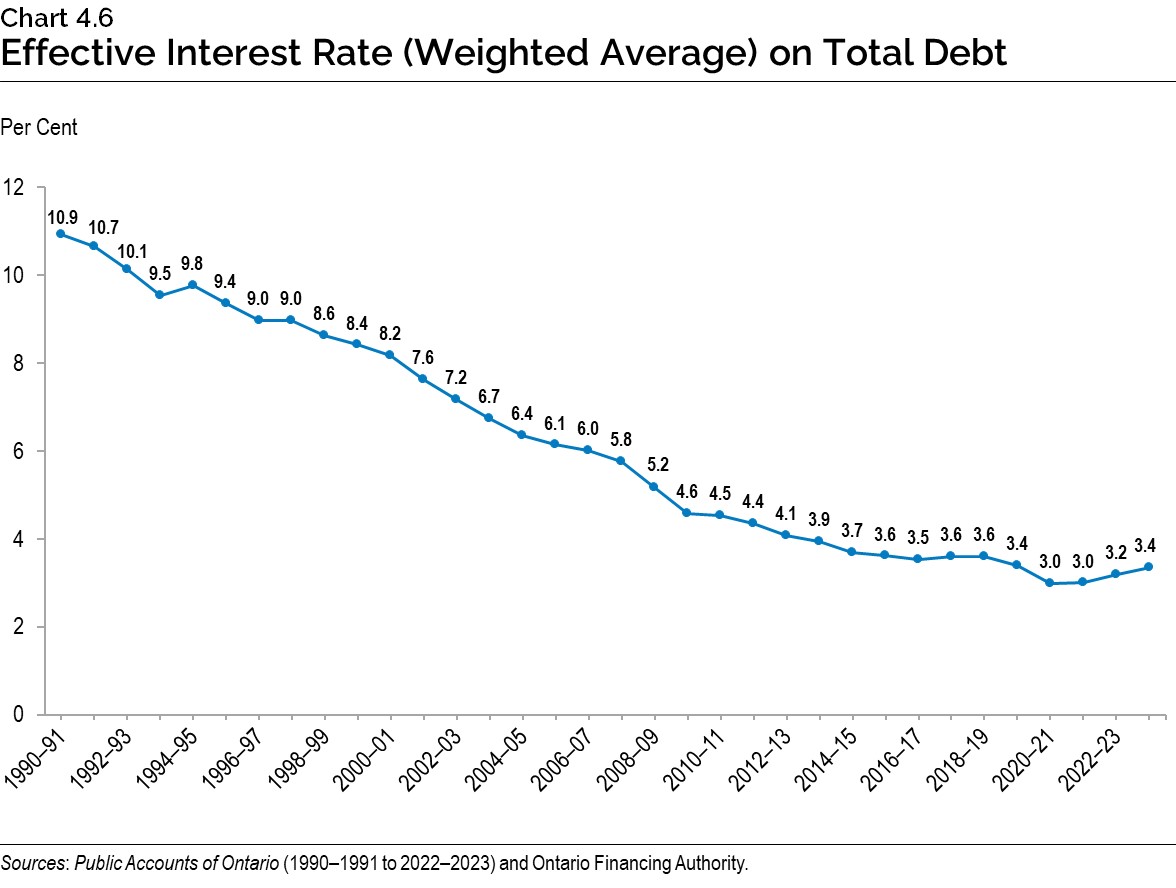
After a three-decade decline, interest rates have risen as central banks, including the Bank of Canada and the U.S. Federal Reserve, have raised overnight interest rates since early 2022. Interest rates have remained elevated throughout 2023 and into 2024. Chart 4.6 shows that while the effective interest rate on Ontario’s debt has risen modestly, it remains low in historical terms due to the decision to lock in long-term rates to extend the term of debt.
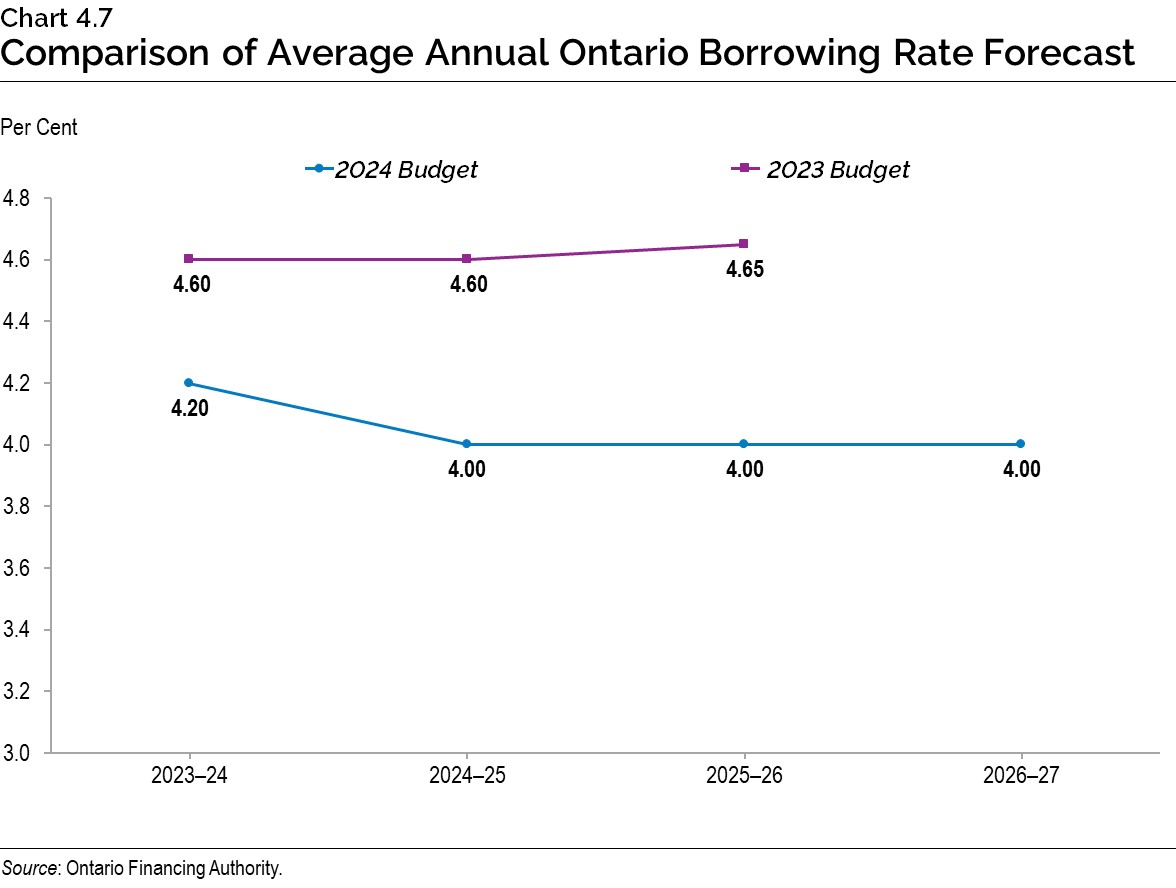
Ontario’s borrowing costs for 2023–24 are now estimated to be 4.2 per cent, 40 basis points lower than forecasted in the 2023 Budget, as shown in Chart 4.7. Borrowing costs in 2024–25 and 2025–26 are also projected to be lower than forecasted in the 2023 Budget by an even greater margin. A one percentage point change in interest rates, either up or down from the current interest rate forecast, is estimated to have a corresponding change in Ontario’s borrowing costs of approximately $0.7 billion in the first full year.
Ontario is forecast to pay $12.8 billion in interest costs in 2023–24, $13.9 billion in 2024–25 and $14.7 billion in 2025–26, down from the 2023 Budget forecasts of $14.1 billion, $14.4 billion and $15.1 billion, respectively. These lower interest costs total a cumulative savings of more than $2 billion over three years, due to lower than projected borrowing costs.
Term of Debt
Ontario has continued to extend the term of its debt, to reduce refinancing risk on maturing debt. This also protects the IOD forecast against further increases in interest rates in the long term. Ontario has issued $137.0 billion of bonds, or almost one‑third of total debt outstanding, with maturities of 30 years or longer since 2010–11. This includes $12.8 billion in 2023–24.
The success Ontario has had in extending the term of its debt from the time of the Global Financial Crisis has created flexibility for managing its large borrowing program and debt portfolio. Due to the extension of the term of debt in recent years, the impact on IOD in the short term and medium term has been lessened. Given interest rates have risen to near historical averages, Ontario will monitor the market and adjust the debt term strategy in the future, if necessary, in response to further changes to interest rates and the yield curve.
Ensuring Adequate Liquidity Levels
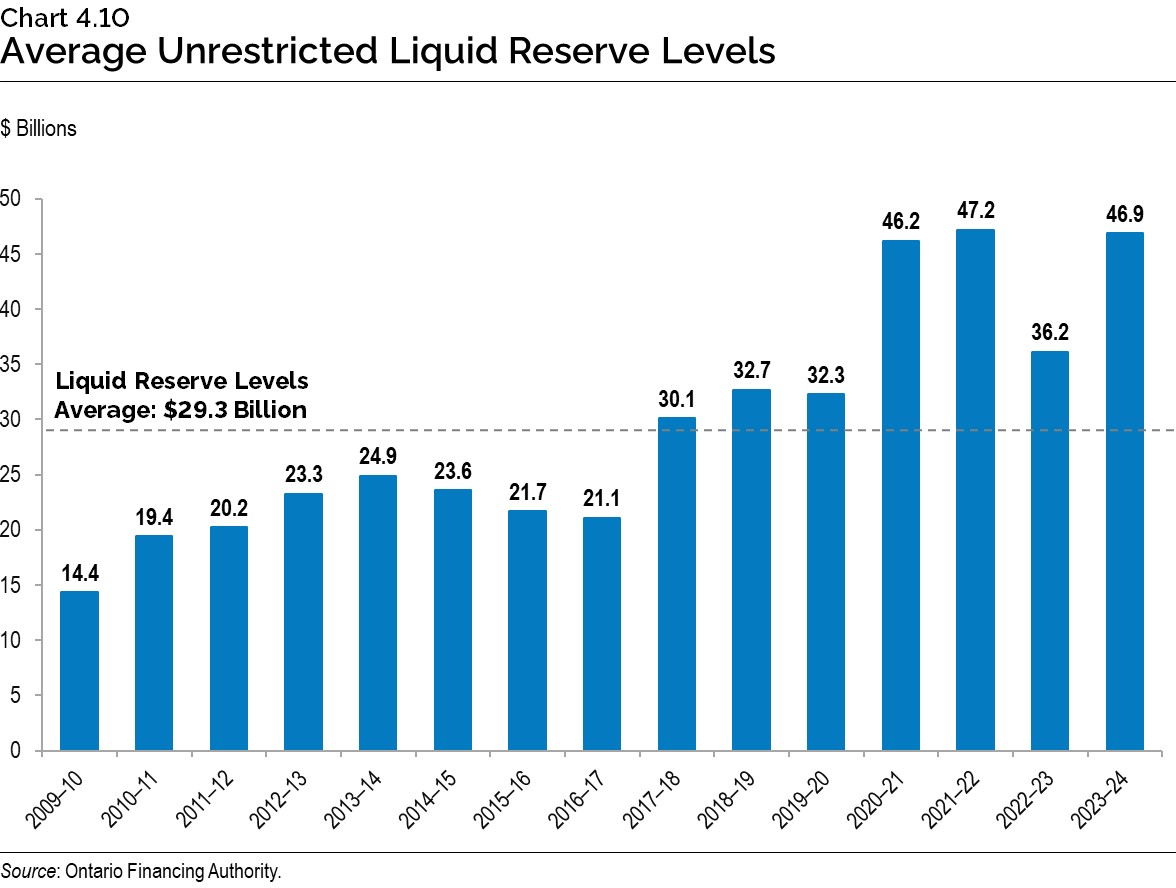
Ontario aims to maintain an optimal level of cash reserves that balances potential holding costs with the need to have adequate funds to meet its financial obligations in a timely manner, as well as to be able to respond promptly to unforeseen market events or economic shocks. With short-term interest rates higher than long-term rates through 2023–24, holding liquid reserves reduced IOD as short-term investments earned more income than Ontario’s cost of borrowing long-term debt.
Ontario’s cash reserves averaged $46.9 billion in 2023–24. As shown in Chart 4.10, this is higher than the average in the previous fiscal year, reflecting higher operating requirements, investments in infrastructure and debt maturities.
Debt Burden Reduction Strategy
The government remains committed to reducing the debt burden and putting Ontario’s finances back on a more sustainable path. As a result, Ontario has maintained the targets set in the 2023 Budget and continues to make progress towards achieving them over the medium-term outlook. In addition, Ontario’s path to balance by 2026–27 will further support progress towards its debt burden reduction strategy.
| 2023 Budget Target |
2023 Budget 2023–23 Forecast |
2023 FES 2023-24 Forecast |
2024 Budget 2023–24 Forecast |
2024 Budget 2024–25 Forecast |
|
|---|---|---|---|---|---|
| Net Debt-to-GDP | <40.0 | 37.8 | 38.4 | 38.0 | 39.2 |
| Net Debt-to-Revenue | <200 | 199 | 206 | 203 | 214 |
| Interest on Debt-to-Revenue | <7.5 | 6.9 | 6.7 | 6.3 | 6.8 |
Table 4.2 footnotes:
Note: 2023 FES is defined as the 2023 Ontario Economic Outlook and Fiscal Review.
Source: Ontario Financing Authority.
Ontario’s net debt-to-GDP is projected to be 38.0 per cent in 2023–24, 39.2 per cent in 2024–25 and 39.5 per cent in 2025–26. In comparison to the 2023 Budget, the ratio increased by 0.2 percentage points, 1.5 percentage points and 2.6 percentage points, respectively. The increase in this ratio over the medium-term outlook is primarily due to higher than projected deficits and investments in infrastructure. The ratio is forecast to be 39.1 per cent in 2026–27. This ratio measures the relationship between a government’s obligations and its ability to meet them, indicating the burden of government debt as a share of the economy.
When compared to the 2023 Ontario Economic Outlook and Fiscal Review, the ratio decreased by 0.4 percentage points in 2023–24, followed by increases of 0.1 percentage points in 2024–25 and 0.8 percentage points in 2025–26. However, when further compared to the 2022 Budget, the ratio decreased by 3.4 percentage points in 2023–24, 2.1 percentage points in 2024–25 and 1.5 percentage points in 2025–26. These trends indicate that although the net debt-to-GDP ratio increased in comparison to the 2023 Budget, it remains relatively consistent or lower than in other recently published forecasts.
Over the medium-term outlook, the net debt‑to‑GDP ratio is forecast to stay below the target of 40.0 per cent, demonstrating that Ontario continues to make positive progress towards reducing the debt burden, while remaining committed to the target originally set in the 2023 Budget.
Ontario’s net debt-to-revenue is projected to be 203 per cent in 2023–24, 214 per cent in 2024–25 and 211 per cent in 2025–26. In comparison to the 2023 Budget, the ratio increased by 4 percentage points, 16 percentage points and 21 percentage points, respectively. The increase in this ratio over the medium‑term outlook is primarily due to reduced revenues as a result of lower projected economic growth, updated tax receipts information and investments in infrastructure. The ratio is forecast to be 209 per cent in 2026–27. This ratio is an indicator of how many years it would take to eliminate the debt if the Ontario government were to spend all its annual revenue on debt repayment.
When compared to the 2023 Ontario Economic Outlook and Fiscal Review, the ratio decreased by 3 percentage points in 2023–24, followed by increases of 3 percentage points in 2024–25 and 7 percentage points in 2025–26. However, when further compared to the 2022 Budget, the ratio decreased by 36 percentage points in 2023–24 and 25 percentage points in 2024–25 and 2025–26. These trends indicate that although the net debt-to-revenue ratio increased in comparison to the 2023 Budget, it remains relatively consistent or lower than in other recently published forecasts.
Ontario’s target for the net debt-to-revenue ratio remains to be below 200 per cent. Based on the growth trend in net debt and revenue beyond the medium-term outlook, this ratio is expected to meet the target of 200 per cent by 2029–30, or as early as 2026–27 should the Faster Growth scenario materialize.
Ontario’s IOD-to-revenue ratio is projected to be 6.3 per cent in 2023–24, 6.8 per cent in 2024–25 and 2025–26. In comparison to the 2023 Budget, the ratio decreased by 0.6 percentage points in 2023–24, remained unchanged in 2024–25, and increased by 0.1 percentage points in 2025–26. The ratio is forecast to be 6.7 per cent in 2026–27. This ratio represents how much Ontario needs to spend on interest for every revenue dollar received. A lower IOD-to-revenue ratio frees up more resources for other priorities.
When comparing this ratio to the 2023 Ontario Economic Outlook and Fiscal Review and the 2022 Budget, for the years 2023–24 to 2025–26, the ratio improved by up to 1.3 percentage points. Ontario continues to show positive progress on the IOD-to-revenue ratio and is forecasting to meet the target and stay below 7.5 per cent over the medium-term outlook. This ratio remains close to the lowest levels it has been at since the 1980s.
Consolidated Financial Tables
| Debt2 | 2019–20 | 2020–21 | 2021–22 | Actual 2022–23 |
Interim1 2023–24 |
Plan 2024–25 |
|---|---|---|---|---|---|---|
| Publicly Held Debt — Bonds3 | 348,589 | 381,492 | 399,628 | 403,398 | 416,517 | 428,080 |
| Publicly Held Debt — Treasury Bills | 19,175 | 24,097 | 22,301 | 22,276 | 20,866 | 25,866 |
| Publicly Held Debt — U.S. Commercial Paper4 | 3,891 | 0 | 1,735 | 460 | 1,694 | 1,694 |
| Publicly Held Debt — Infrastructure Ontario (IO)5 | 300 | 300 | 300 | 300 | 300 | 300 |
| Publicly Held Debt — Other | 264 | 250 | 231 | 217 | 202 | 186 |
| Total Publicly Held Debt | 372,219 | 406,139 | 424,195 | 426,651 | 439,579 | 456,126 |
| Non-Public Debt | 10,010 | 9,318 | 8,766 | 8,678 | 7,953 | 6,776 |
| Gross Debt | 382,229 | 415,457 | 432,961 | 435,329 | 447,532 | 462,902 |
| Less: Holdings of own Ontario Bonds and Treasury Bills6 | (9,938) | (11,122) | (7,098) | (10,154) | (5,586) | – |
| Less: Unamortized Discounts, Premiums and Commissions7 | (3,376) | (4,495) | – | |||
| Total Debt | 372,291 | 404,335 | 425,863 | 421,799 | 437,451 | 462,902 |
| Other Net Financial (Assets)/Liabilities8 | (33,808) | (44,396) | (54,729) | (37,876) | (34,669) | (34,864) |
| Broader Public Sector Net Debt | 13,899 | 12,562 | 11,708 | 16,561 | 12,032 | 11,018 |
| Net Debt | 352,382 | 372,501 | 382,842 | 400,484 | 414,814 | 439,056 |
| Non-Financial Assets9 | (127,568) | (134,270) | (144,682) | (153,680) | (165,033) | (179,469) |
| Accumulated Deficit | 224,814 | 238,231 | 238,160 | 246,804 | 249,781 | 259,587 |
Table 4.3 footnotes:
[1] Interim represents the 2024 Budget projection for the 2023–24 fiscal year.
[2] Includes debt issued by Ontario and all government organizations, including the Ontario Electricity Financial Corporation (OEFC).
[3], [4] All balances are expressed in Canadian dollars. The balances above reflect the effect of related derivative contracts.
[5] IO debt is composed of Infrastructure Renewal Bonds. IO debt is not guaranteed by Ontario.
[6] Ontario holds its own debt mainly to reduce the cash flow required to service large maturities, typically in June. For 2024–25, there are currently no significant holdings for maturities.
[7] Effective April 1, 2022, Ontario adopted new PSAS standard on Financial Instruments on a prospective basis. Unamortized discounts and premiums are now amortized on an effective interest basis. These amounts are not forecasted for 2024–25.
[8] Other Net Financial (Assets)/Liabilities include cash and temporary investments, accounts receivable, loans receivable, advances and investments in Government Business Enterprises (GBEs) offset by accounts payable, accrued liabilities, deferred revenue and capital contributions, pensions and other employee future benefits, and other liabilities.
[9] Non-financial assets include the tangible capital assets of Ontario, including the broader public sector.
Sources: Ontario Financing Authority and Ontario Ministry of Finance.
| 2024–25 | 2025–26 | 2026–27 | |
|---|---|---|---|
| Total Debt | 462,902 | 467,489 | 473,348 |
| Other Net Financial (Assets)/Liabilities | (34,864) | (18,148) | (10,467) |
| Broader Public Sector Net Debt | 11,018 | 10,426 | 11,596 |
| Net Debt | 439,056 | 459,767 | 474,477 |
| Non-Financial Assets | (179,469) | (195,567) | (210,757) |
| Accumulated Deficit | 259,587 | 264,200 | 263,720 |
Table 4.4 footnotes:
Note: Numbers may not add due to rounding.
Sources: Ontario Financing Authority and Ontario Ministry of Finance.
Chart Descriptions
Chart 4.1: Borrowing Outlook Scenarios for Long-Term Borrowing
| Year | 2023–24 | 2024–25 | 2025–26 | 2026–27 |
|---|---|---|---|---|
| Planning Projection | $41.8 | $38.2 | $37.7 | $32.8 |
| Slower Growth Scenario | $41.8 | $41.7 | $43.5 | $40.8 |
| Faster Growth Scenario | $41.8 | $34.5 | $31.1 | $23.5 |
Sources: Ontario Financing Authority andOntario Ministry of Finance.
Chart 4.2: 2023–24 Borrowing
Long-term public borrowing of $41.8 billion has been completed for fiscal year 2023–24. This consisted of $30.4 billion (73 per cent) of Canadian dollar syndicated bonds, $2.6 billion (6 per cent) of Canadian Dollar Floating Rate Note, $3.0 billion (7 per cent) of Canadian dollar Green Bonds, $4.0 billion (10 per cent) of U.S. dollar bond, $1.8 billion (4 per cent) of Euro bond, and $0.03 billion (<1 per cent) of Australian dollar bond.
Note: Numbers may not add due to rounding.
Source: Ontario Financing Authority.
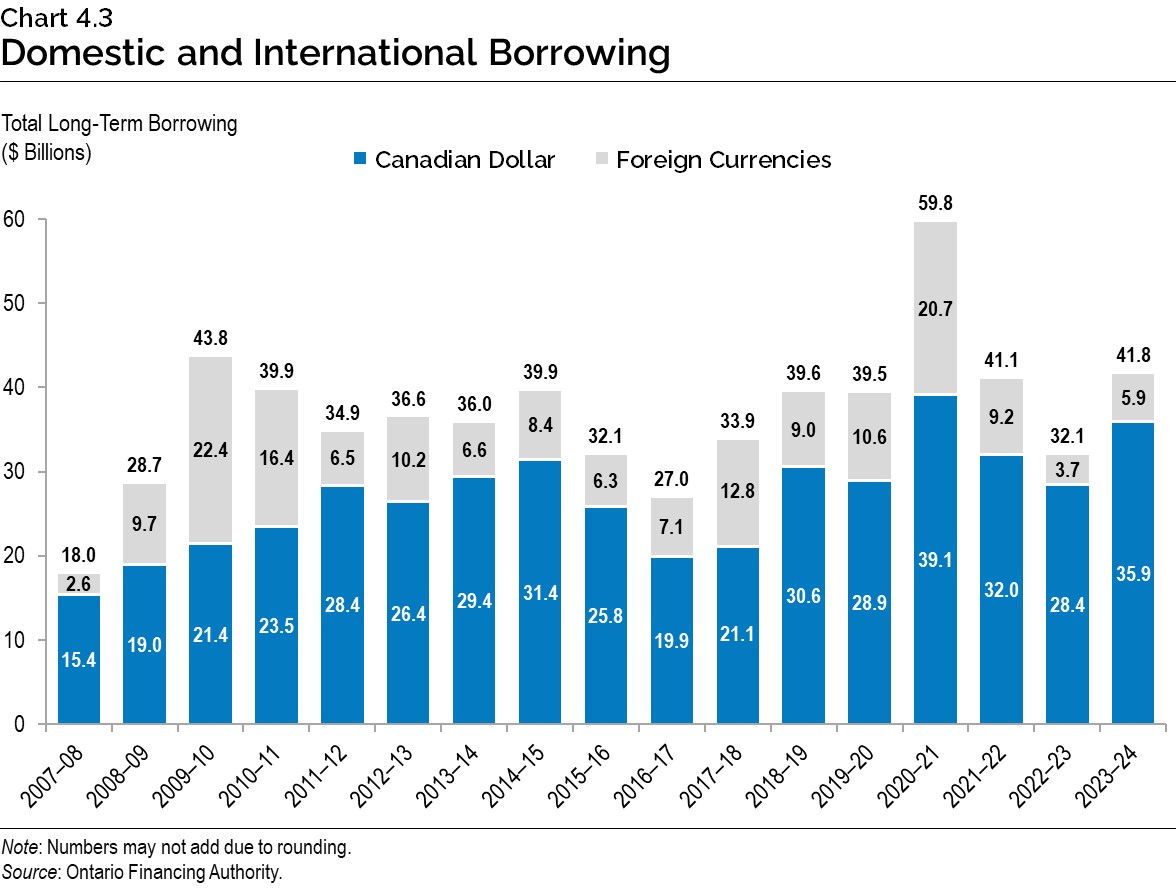
Chart 4.3: Domestic and International Borrowing
Ontario’s total long-term borrowing completed in 2023–24 is $41.8 billion — $35.9 billion was borrowed in the Canadian dollar market and $5.9 billion was borrowed in foreign currencies.
| Year | Canadian Dollar ($ Billions) |
Foreign Currencies ($ Billions) |
Total ($ Billions) |
|---|---|---|---|
| 2007–08 | 15.4 | 2.6 | 18.0 |
| 2008–09 | 19.0 | 9.7 | 28.7 |
| 2009–10 | 21.4 | 22.4 | 43.8 |
| 2010–11 | 23.5 | 16.4 | 39.9 |
| 2011–12 | 28.4 | 6.5 | 34.9 |
| 2012–13 | 26.4 | 10.2 | 36.6 |
| 2013–14 | 29.4 | 6.6 | 36.0 |
| 2014–15 | 31.4 | 8.4 | 39.9 |
| 2015–16 | 25.8 | 6.3 | 32.1 |
| 2016–17 | 19.9 | 7.1 | 27.0 |
| 2017–18 | 21.1 | 12.8 | 33.9 |
| 2018–19 | 30.6 | 9.0 | 39.6 |
| 2019–20 | 28.9 | 10.6 | 39.5 |
| 2020–21 | 39.1 | 20.7 | 59.8 |
| 2021–22 | 32.0 | 9.2 | 41.1 |
| 2022–23 | 28.4 | 3.7 | 32.1 |
| 2023–24 | 35.9 | 5.9 | 41.8 |
Note: Numbers may not add due to rounding.
Source: Ontario Financing Authority.
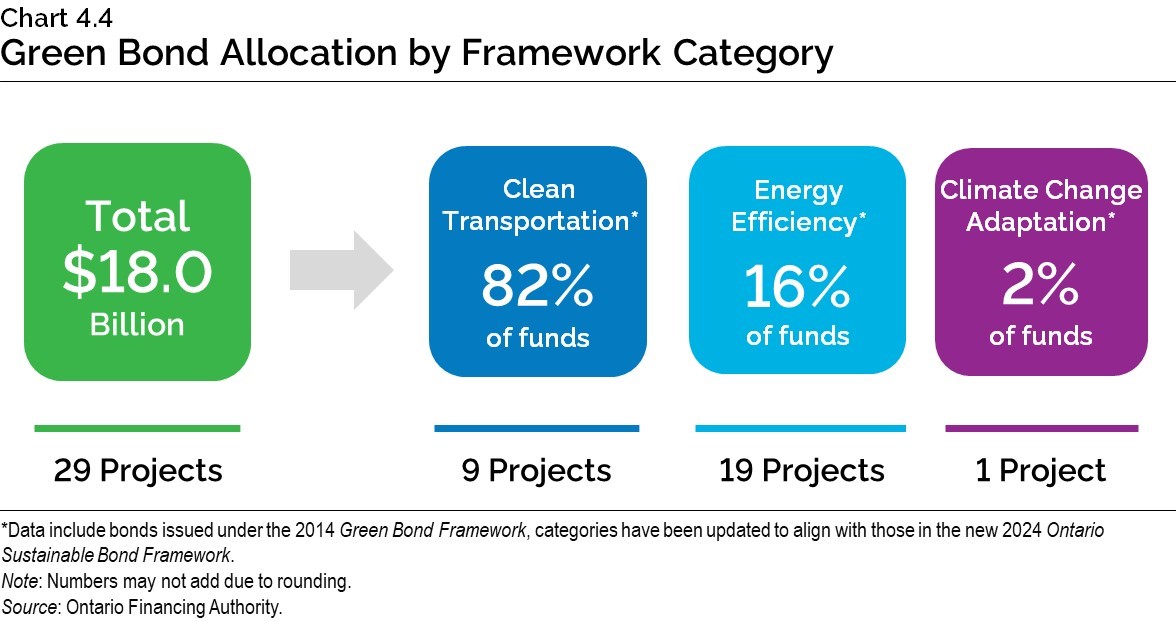
Chart 4.4: Green Bond Allocation by Framework Category
A total of $18.0 billion in Green Bond funding has or will provide funding for 29 projects. Nine of those projects are under the Clean Transportation* framework category and have received 82 per cent of the funding. Nineteen projects are under the Energy Efficiency* category and have received 16 per cent of the funding. One project is under the Climate Change Adaptation* category and has received two per cent of the funding.
*Data include bonds issued under the 2014 Green Bond Framework; categories have been updated to align with those in the new 2024 Ontario Sustainable Bond Framework.
Note: Numbers may not add due to rounding.
Source: Ontario Financing Authority.
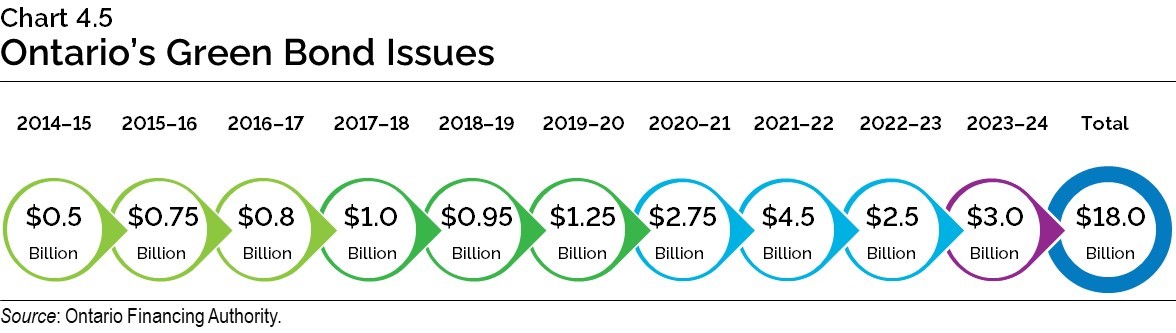
Chart 4.5: Ontario’s Green Bond Issues
Since 2014, Ontario has issued Green Bonds totalling $18.0 billion.
| Year | 2014–15 | 2015–16 | 2016–17 | 2017–18 | 2018–19 | 2019–20 | 2020–21 | 2021–22 | 2022–23 | 2023–24 |
|---|---|---|---|---|---|---|---|---|---|---|
| Green Bond Issues ($) | $0.5 billion |
$0.75 billion |
$0.8 billion |
$1.0 billion |
$0.95 billion |
$1.25 |
$2.75 billion |
$4.5 billion |
$2.5 billion |
$3.0 billion |
Source: Ontario Financing Authority.
Chart 4.6: Effective Interest Rate (Weighted Average) on Total Debt
As of March 31, 2024, the effective interest rate (calculated as a weighted average) for fiscal year-end is forecast to be 3.4 per cent on Ontario’s total debt.
| Year | Effective Interest Rate (%) |
|---|---|
| 1990–91 | 10.9 |
| 1991–92 | 10.7 |
| 1992–93 | 10.1 |
| 1993–94 | 9.5 |
| 1994–95 | 9.8 |
| 1995–96 | 9.4 |
| 1996–97 | 9.0 |
| 1997–98 | 9.0 |
| 1998–99 | 8.6 |
| 1999–00 | 8.4 |
| 2000–01 | 8.2 |
| 2001–02 | 7.6 |
| 2002–03 | 7.2 |
| 2003–04 | 6.7 |
| 2004–05 | 6.4 |
| 2005–06 | 6.1 |
| 2006–07 | 6.0 |
| 2007–08 | 5.8 |
| 2008–09 | 5.2 |
| 2009–10 | 4.6 |
| 2010–11 | 4.5 |
| 2011–12 | 4.4 |
| 2012–13 | 4.1 |
| 2013–14 | 3.9 |
| 2014–15 | 3.7 |
| 2015–16 | 3.6 |
| 2016–17 | 3.5 |
| 2017–18 | 3.6 |
| 2018–19 | 3.6 |
| 2019–20 | 3.4 |
| 2020–21 | 3.0 |
| 2021–22 | 3.0 |
| 2022–23 | 3.2 |
| 2023–24 | 3.4 |
Sources: Public Accounts of Ontario (1990–1991 to 2022–2023) and Ontario Financing Authority.
Chart 4.7: Comparison of Average Annual Ontario Borrowing Rate Forecast
| Year | 2024 Budget (%) | 2023 Budget (%) |
|---|---|---|
| 2023–24 | 4.20 | 4.60 |
| 2024–25 | 4.00 | 4.60 |
| 2025–26 | 4.00 | 4.65 |
| 2026–27 | 4.00 | – |
Source: Ontario Financing Authority.
Chart 4.8: Comparison of Interest on Debt Expense Forecast
| Year | 2024 Budget ($ Billions) | 2023 Budget ($ Billions) |
|---|---|---|
| 2023–24 | 12.8 | 14.1 |
| 2024–25 | 13.9 | 14.4 |
| 2025–26 | 14.7 | 15.1 |
| 2026–27 | 15.2 | – |
Source: Ontario Financing Authority.
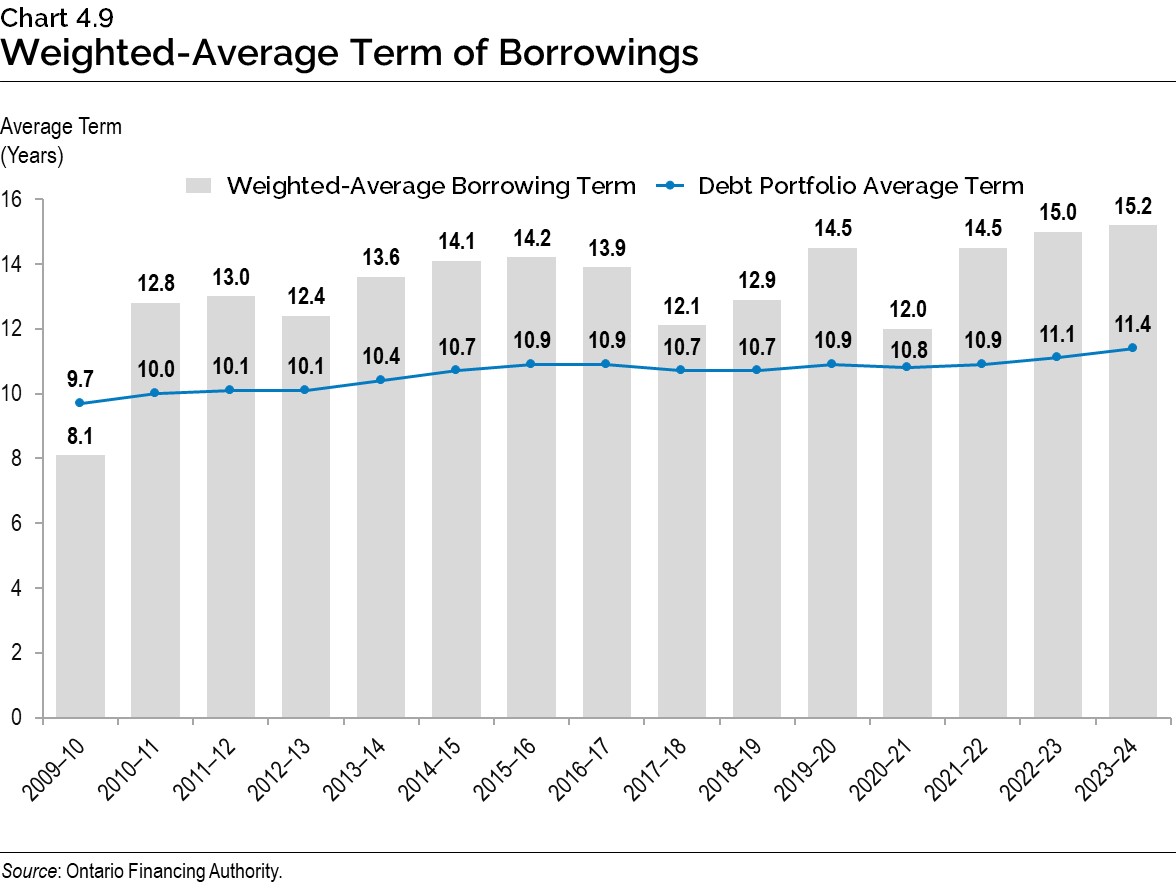
Chart 4.9: Weighted-Average Term of Borrowings
The average term of Ontario’s debt portfolio has been extended from 9.7 years in 2009–10 to 11.4 years in 2023–24. The weighted-average borrowing term for 2023–24 was 15.2 years as of February 29, 2024.
| Year | 2009–10 | 2010–11 | 2011–12 | 2012–13 | 2013–14 | 2014–15 | 2015–16 | 2016–17 | 2017–18 | 2018–19 | 2019–20 | 2020–21 | 2021–22 | 2022–23 | 2023–24 |
|---|---|---|---|---|---|---|---|---|---|---|---|---|---|---|---|
| Weighted-Average Borrowing Term (Years) | 8.1 | 12.8 | 13.0 | 12.4 | 13.6 | 14.1 | 14.2 | 13.9 | 12.1 | 12.9 | 14.5 | 12.0 | 14.5 | 15.0 | 15.2 |
| Debt Portfolio Average Term (Years) | 9.7 | 10.0 | 10.1 | 10.1 | 10.4 | 10.7 | 10.9 | 10.9 | 10.7 | 10.7 | 10.9 | 10.8 | 10.9 | 11.1 | 11.4 |
Source: Ontario Financing Authority.
Chart 4.10: Average Unrestricted Liquid Reserve Levels
Average unrestricted liquid reserve levels are forecast to be $46.9 billion as of March 31, 2024.
| Year | Average Unrestricted Liquid Reserve Levels ($ Billions) |
|---|---|
| 2009–10 | 14.4 |
| 2010–11 | 19.4 |
| 2011–12 | 20.2 |
| 2012–13 | 23.3 |
| 2013–14 | 24.9 |
| 2014–15 | 23.6 |
| 2015–16 | 21.7 |
| 2016–17 | 21.1 |
| 2017–18 | 30.1 |
| 2018–19 | 32.7 |
| 2019–20 | 32.3 |
| 2020–21 | 46.2 |
| 2021–22 | 47.2 |
| 2022–23 | 36.2 |
| 2023–24 | 46.9 |
Source: Ontario Financing Authority.
Making Progress on the Debt Burden Reduction Strategy:
The targets, which remain unchanged from the 2023 Budget, are:
- Net debt-to-GDP to stay below 40.0 per cent.
- Net debt-to-revenue to be below 200 per cent.
- IOD-to-revenue to stay below 7.5 per cent.
Chart 4.11: Net Debt-to-GDP
Ontario’s net debt-to-GDP ratio is forecast at 38.0 per cent in 2023–24.
| Year | Planning Projection (%) | Faster Growth Scenario (%) | Slower Growth Scenario (%) |
|---|---|---|---|
| 1990–91 | 13.4 | – | – |
| 1991–92 | 17.1 | – | – |
| 1992–93 | 21.1 | – | – |
| 1993–94 | 26.6 | – | – |
| 1994–95 | 28.3 | – | – |
| 1995–96 | 30.1 | – | – |
| 1996–97 | 31.2 | – | – |
| 1997–98 | 30.5 | – | – |
| 1998–99 | 29.4 | – | – |
| 1999–00 | 32.1 | – | – |
| 2000–01 | 29.3 | – | – |
| 2001–02 | 28.2 | – | – |
| 2002–03 | 26.8 | – | – |
| 2003–04 | 27.5 | – | – |
| 2004–05 | 26.8 | – | – |
| 2005–06 | 27.8 | – | – |
| 2006–07 | 27.1 | – | – |
| 2007–08 | 26.6 | – | – |
| 2008–09 | 27.8 | – | – |
| 2009–10 | 32.3 | – | – |
| 2010–11 | 34.5 | – | – |
| 2011–12 | 36.6 | – | – |
| 2012–13 | 38.2 | – | – |
| 2013–14 | 39.7 | – | – |
| 2014–15 | 40.5 | – | – |
| 2015–16 | 40.3 | – | – |
| 2016–17 | 39.7 | – | – |
| 2017–18 | 39.2 | – | – |
| 2018–19 | 39.3 | – | – |
| 2019–20 | 39.5 | – | – |
| 2020–21 | 42.6 | – | – |
| 2021–22 | 39.9 | – | – |
| 2022–23 | 38.2 | – | – |
| 2023–24 | 38.0 | – | – |
| 2024–25 | 39.2 | 38.2 | 40.1 |
| 2025–26 | 39.5 | 37.6 | 41.1 |
| 2026–27 | 39.1 | 36.3 | 41.5 |
Note: See Chapter 3: Continuing to Invest in the Plan to Build: Ontario’s Fiscal Plan and Outlook for details on the Faster Growth and Slower Growth scenarios.
Sources: Statistics Canada and Ontario Ministry of Finance.
Chart 4.12: Net Debt-to-Revenue
Ontario’s net debt-to-revenue ratio is forecast to be 203 per cent in 2023–24.
| Year | Planning Projection (%) | Faster Growth Scenario (%) | Slower Growth Scenario (%) |
|---|---|---|---|
| 1990–91 | 78 | – | – |
| 1991–92 | 104 | – | – |
| 1992–93 | 126 | – | – |
| 1993–94 | 157 | – | – |
| 1994–95 | 168 | – | – |
| 1995–96 | 176 | – | – |
| 1996–97 | 187 | – | – |
| 1997–98 | 184 | – | – |
| 1998–99 | 182 | – | – |
| 1999–00 | 189 | – | – |
| 2000–01 | 183 | – | – |
| 2001–02 | 183 | – | – |
| 2002–03 | 177 | – | – |
| 2003–04 | 188 | – | – |
| 2004–05 | 170 | – | – |
| 2005–06 | 162 | – | – |
| 2006–07 | 153 | – | – |
| 2007–08 | 146 | – | – |
| 2008–09 | 164 | – | – |
| 2009–10 | 189 | – | – |
| 2010–11 | 192 | – | – |
| 2011–12 | 208 | – | – |
| 2012–13 | 216 | – | – |
| 2013–14 | 225 | – | – |
| 2014–15 | 234 | – | – |
| 2015–16 | 225 | – | – |
| 2016–17 | 223 | – | – |
| 2017–18 | 214 | – | – |
| 2018–19 | 220 | – | – |
| 2019–20 | 226 | – | – |
| 2020–21 | 226 | – | – |
| 2021–22 | 207 | – | – |
| 2022–23 | 208 | – | – |
| 2023–24 | 203 | – | – |
| 2024–25 | 214 | 208 | 219 |
| 2025–26 | 211 | 201 | 221 |
| 2026–27 | 209 | 193 | 224 |
Note: See Chapter 3: Continuing to Invest in the Plan to Build: Ontario’s Fiscal Plan and Outlook for details on the Faster Growth and Slower Growth scenarios.
Sources: Public Accounts of Ontario (1990–1991 to 2022–2023) and Ontario Financing Authority.
Chart 4.13: Interest on Debt-to-Revenue
Ontario’s interest on debt-to-revenue ratio is forecast to be 6.3 per cent in 2023–24.
| Year | Planning Projection (%) | Faster Growth Scenario (%) | Slower Growth Scenario (%) |
|---|---|---|---|
| 1990–91 | 7.7 | – | – |
| 1991–92 | 8.8 | – | – |
| 1992–93 | 10.8 | – | – |
| 1993–94 | 13.9 | – | – |
| 1994–95 | 14.5 | – | – |
| 1995–96 | 14.6 | – | – |
| 1996–97 | 14.8 | – | – |
| 1997–98 | 14.2 | – | – |
| 1998–99 | 14.3 | – | – |
| 1999–00 | 15.5 | – | – |
| 2000–01 | 15.0 | – | – |
| 2001–02 | 14.2 | – | – |
| 2002–03 | 12.9 | – | – |
| 2003–04 | 12.9 | – | – |
| 2004–05 | 11.1 | – | – |
| 2005–06 | 9.7 | – | – |
| 2006–07 | 8.9 | – | – |
| 2007–08 | 8.4 | – | – |
| 2008–09 | 8.7 | – | – |
| 2009–10 | 8.9 | – | – |
| 2010–11 | 8.8 | – | – |
| 2011–12 | 9.1 | – | – |
| 2012–13 | 9.0 | – | – |
| 2013–14 | 9.1 | – | – |
| 2014–15 | 8.9 | – | – |
| 2015–16 | 8.5 | – | – |
| 2016–17 | 8.3 | – | – |
| 2017–18 | 7.9 | – | – |
| 2018–19 | 8.1 | – | – |
| 2019–20 | 8.0 | – | – |
| 2020–21 | 7.5 | – | – |
| 2021–22 | 6.8 | – | – |
| 2022–23 | 6.4 | – | – |
| 2023–24 | 6.3 | – | – |
| 2024–25 | 6.8 | 6.6 | 6.9 |
| 2025–26 | 6.8 | 6.4 | 7.1 |
| 2026–27 | 6.7 | 6.2 | 7.2 |
Note: See Chapter 3: Continuing to Invest in the Plan to Build: Ontario’s Fiscal Plan and Outlook for details on the Faster Growth and Slower Growth scenarios.
Sources: Public Accounts of Ontario (1990–1991 to 2022–2023) and Ontario Financing Authority.