Ontario’s Economic and Fiscal Outlook in Brief
The COVID‑19 pandemic is having unprecedented impacts on economies around the world, including in Ontario. While the Ontario Spirit — hard work, innovation and responsible behaviour — helped the province through the first wave, Ontario is now clearly in the middle of the second.
By making early progress in restoring fiscal sustainability, this government was able to respond to the COVID‑19 outbreak from a position of strength. Released in the early stages of the pandemic, Ontario’s Action Plan: Responding to COVID‑19 outlined the government’s initial response to the first wave of the global pandemic. Through the 2020–21 First Quarter Finances, the government updated Ontario’s Action Plan: Responding to COVID‑19, bringing the Province’s total COVID‑19 response to a projected $30 billion.
The government is now introducing the next phase of Ontario’s Action Plan: Protect, Support, Recover. This Budget is a prudent plan that will maintain stability, get the province through future waves, and begin building the foundation for a strong economic recovery fuelled by growth.
For 2020–21, the government is projecting a deficit of $38.5 billion, unchanged from the deficit forecast at the time of the 2020–21 First Quarter Finances. Over the medium term, the government is forecasting deficits of $33.1 billion in 2021–22 and $28.2 billion in 2022–23. While Ontario’s current levels of spending are critical to get through the pandemic, the government recognizes that this is unsustainable over the long term, thus the focus on building a foundation for recovery fuelled by economic growth. Acknowledging the continued uncertainty of the global pandemic, the government plans to table a path to balance in the 2021 Budget.
As with any forecast, there are numerous risks that are taken into consideration when determining the Province’s fiscal framework. The 2020 Budget is being released when global economic conditions are highly uncertain, and there are a variety of factors beyond the Province’s control, which may impact the fiscal outlook. Given the heightened uncertainty, the government is presenting two plausible alternative scenarios to be transparent regarding the risks in the current environment.
As of October 13, 2020, the Province had completed $34.7 billion of the forecast 2020–21 total long-term public borrowing program of $52.3 billion. Ontario’s 2020–21 net debt-to-GDP ratio is now forecast to be 47.0 per cent, compared to 47.1 per cent at the time of the 2020–21 First Quarter Finances. Ontario is projected to pay $12.5 billion in interest costs in 2020–21, unchanged from the forecast in the 2020–21 First Quarter Finances.
A key element of the government’s plan is investment in infrastructure, including strategic investments in transit, highways, schools, hospitals and broadband. Planned investments over the next 10 years total $142.9 billion, including $13.6 billion in 2020–21. These investments are fundamental to the government’s made-in-Ontario plan for growth, renewal and long-term recovery.
Consistent with the legislated requirements for a budget and mid-year review in the Fiscal Sustainability, Transparency and Accountability Act, 2019 (FSTAA), the 2020–21 current outlook represents the plan year of the Budget as well as the current fiscal year of the mid-year review in the 2020 Budget. The FSTAA sets out the requirement for the Ontario Minister of Finance to release a budget and a mid-year review for each fiscal year. The fall 2020 Budget represents, in compliance with FSTAA as proposed to be amended, the government’s Budget and mid-year review for 2020–21. Furthermore, this first section of the 2020 Budget provides, with clarity and transparency, a description of the financial state of the province. This is in keeping with the government’s commitment to provide regular updates on Ontario’s finances, even amidst this uncertain economic period.
Ontario’s Economic Outlook
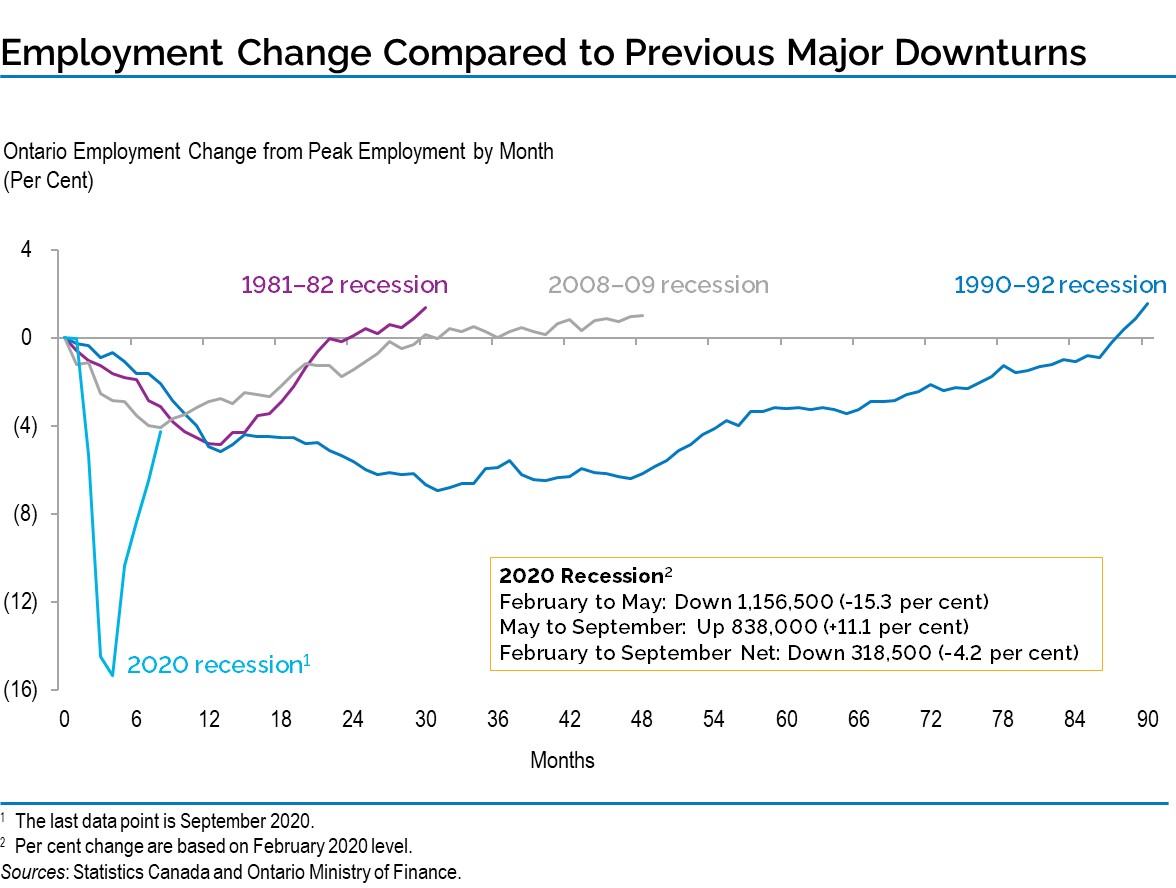
The COVID‑19 pandemic has significantly impacted Ontario’s economy. Ontario’s employment decreased by 15.3 per cent between February and May 2020, a far sharper decline than past major recessions. Thanks to the responsible behaviour of people, as well as prudent and timely measures by all levels of government, key economic indicators have improved significantly following historic declines earlier in the year.
Ontario’s real GDP is projected to decline by 6.5 per cent in 2020 and rise by 4.9 per cent in 2021. Ontario’s economic growth is expected to continue after 2021, with real GDP projected to rise 3.5 per cent in 2022 before moderating to 2.0 per cent in 2023. For the purposes of prudent fiscal planning, these projections are slightly below the average of private-sector forecasts available at the time the planning projections were finalized.
| 2019 | 2020p | 2021p | 2022p | 2023p | |
|---|---|---|---|---|---|
| Real GDP Growth | 1.7 | (6.5) | 4.9 | 3.5 | 2.0 |
| Nominal GDP Growth | 3.9 | (5.0) | 6.6 | 5.7 | 4.2 |
| Employment Growth | 2.9 | (5.4) | 5.0 | 2.5 | 1.9 |
| CPI Inflation | 1.9 | 0.5 | 1.7 | 2.0 | 1.9 |
Table footnotes:
p = Ontario Ministry of Finance planning projection based on information up to October 2, 2020.
Sources: Statistics Canada and Ontario Ministry of Finance.
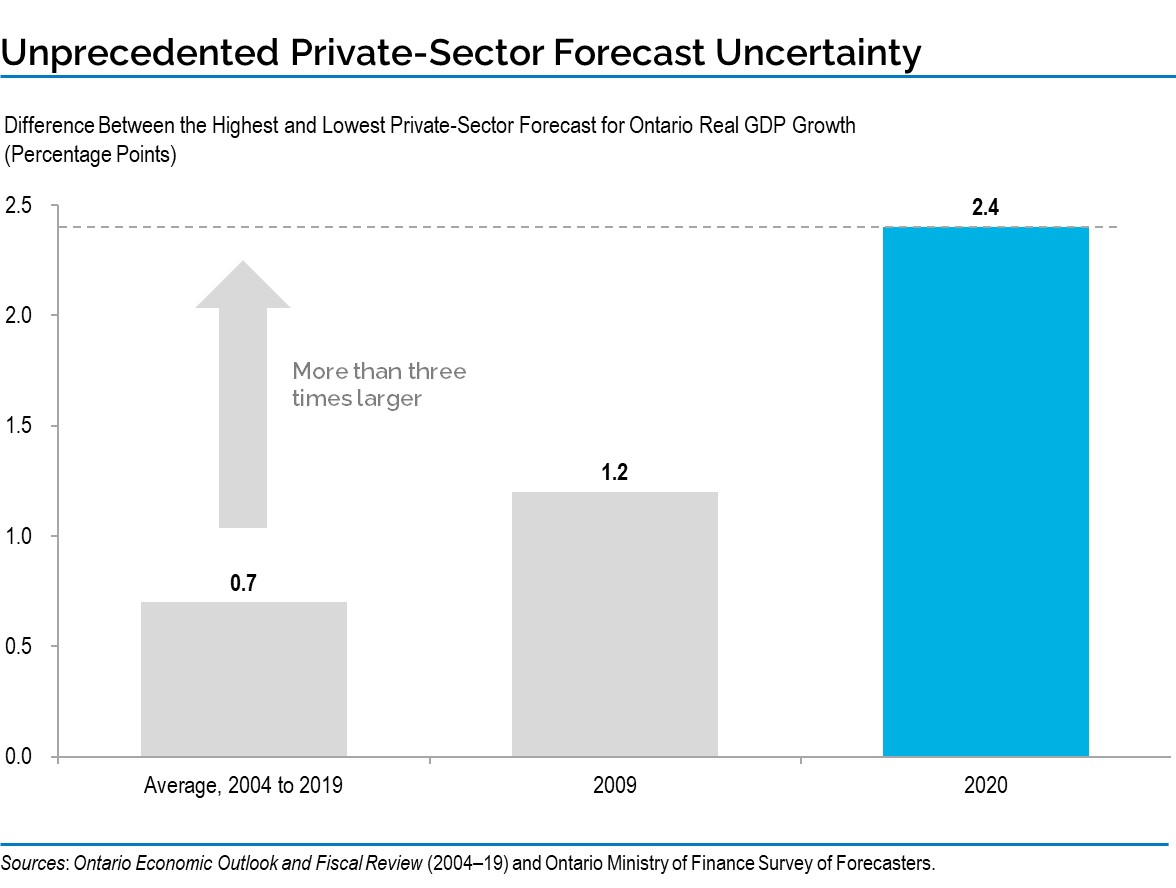
The COVID‑19 pandemic has created an unprecedented level of economic uncertainty globally and in Canada1. This is reflected by an extraordinarily wide range in projections among private-sector forecasters for Ontario’s economy. Between 2004 and 2019, the average difference between the lowest and highest private-sector forecast for in-year Ontario real GDP growth, at this point in the fiscal year, was 0.7 percentage points. In 2009, a period of heightened uncertainty, the range was 1.2 percentage points. Currently, uncertainty regarding the state of the economy has contributed to the largest range in private-sector forecasts in recent history of 2.4 percentage points between the lowest and highest real GDP growth forecast for 2020.
An extraordinary degree of uncertainty prevails regarding the economic outlook as it will be heavily influenced by the evolution of the COVID‑19 pandemic and its impacts on Ontario, Canada and the world. In keeping with the government’s commitment to providing maximum transparency and accountability, the 2020 Budget outlines alternative economic scenarios that illustrate potential implications for the province’s finances.
Enhancing Transparency: Alternative Economic Scenarios
The global economic disruptions caused by the COVID‑19 pandemic have led to unprecedented uncertainty surrounding the economic forecast. Transparency is central to this government’s approach, which is why the Ministry of Finance has developed two plausible alternative paths that the economy could take over the next several years.
These alternative scenarios should not be considered the best case or the worst case. Rather, they represent possible outcomes in this historic period of uncertainty and are provided in an effort to be as transparent as possible.
| 2021p | 2022p | 2023p | |
|---|---|---|---|
| Faster Growth Scenario | 7.5 | 3.1 | 2.3 |
| Planning Projection | 4.9 | 3.5 | 2.0 |
| Slower Growth Scenario | 3.3 | 1.0 | 1.4 |
Table footnotes:
p = Ontario Ministry of Finance planning projection and alternative scenarios.
Source: Ontario Ministry of Finance.
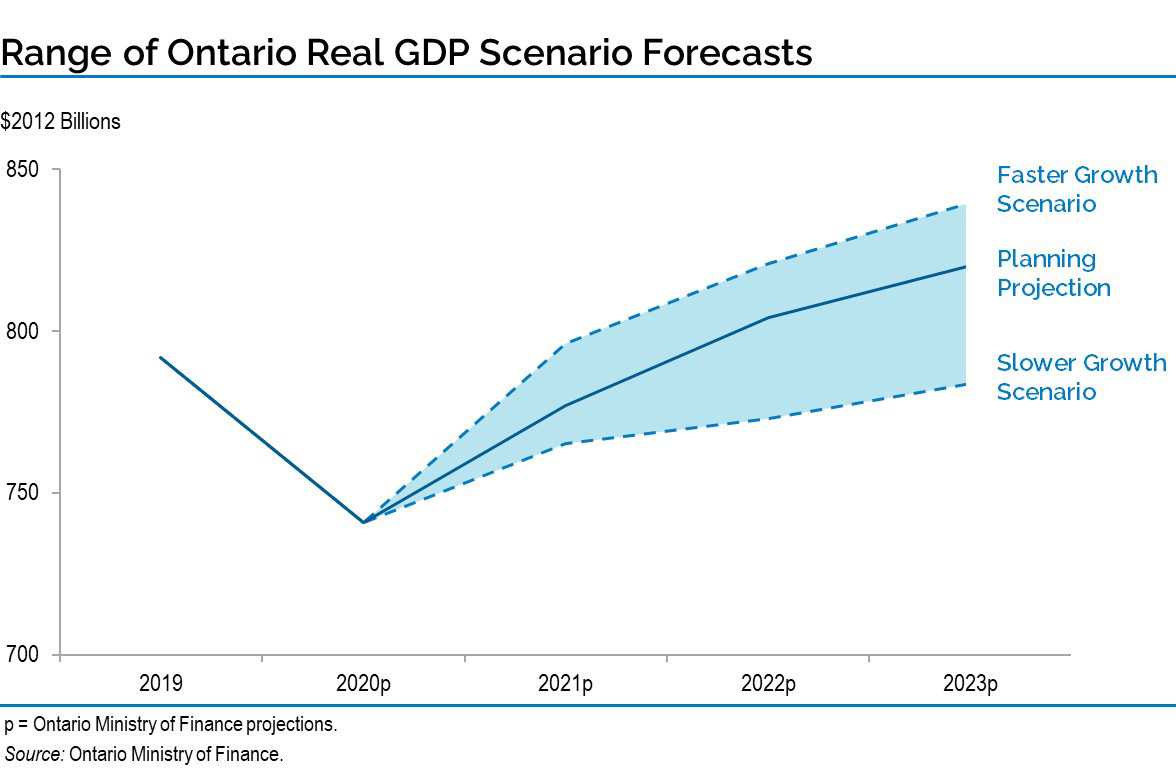
These scenarios indicate the broad range of risk related to future economic growth. In the Faster Growth scenario, the level of real GDP in 2023 is 2.4 per cent higher than the planning projection, while in the Slower Growth scenario the level of real GDP in 2023 is 4.5 per cent lower.
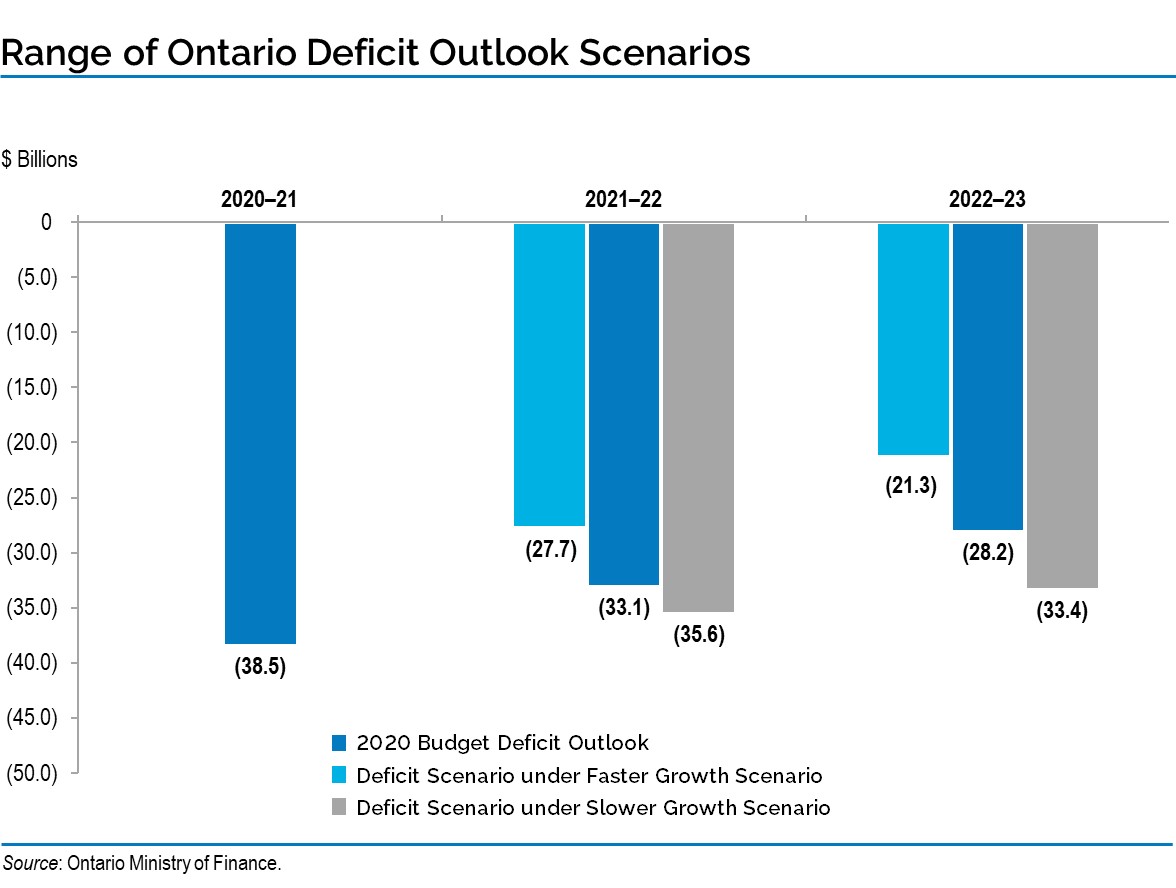
In the event that the alternative economic scenarios materialize as opposed to the planning projection, the Province’s deficit outlook in the next two years will also change as a result, assuming that program spending plans remain the same.
Under the Faster Growth scenario, the deficit outlook may improve to $27.7 billion in 2021–22 and $21.3 billion in 2022–23. However, if the Slower Growth scenario takes place instead, the deficit outlook may deteriorate to $35.6 billion and $33.4 billion in the next two years.
Managing Ontario’s Finances Responsibly
The government is providing the people of Ontario a transparent look into the province’s finances and its plan to respond to the COVID‑19 pandemic over the medium term. This prudent approach to fiscal planning provides the necessary resources to deal with COVID‑19 but also recognizes that the future is still very uncertain, and changes can happen rapidly.
| Release Date | Horizon of Fiscal Projections | |
|---|---|---|
| Ontario – March 2020 Economic and Fiscal Update | March 25, 2020 | 2020–21 |
| Ontario – 2020–21 First Quarter Finances | August 12, 2020 | 2020–21 |
| Ontario – 2020 Budget | November 5, 2020 | 2022–23 |
| New Brunswick – Fiscal and Economic Update | May 21, 2020 | 2020–21 |
| Saskatchewan – 2020 Budget | June 15, 2020 | 2020–21 |
| Saskatchewan – First Quarter Budget Update and Medium-Term Outlook | August 27, 2020 | 2024–25 |
| Prince Edward Island – 2020 Budget | June 17, 2020 | 2022–23 |
| Prince Edward Island – Fall Fiscal Update | September 30, 2020 | 2020–21 |
| Quebec – Economic and Financial Situation | June 19, 2020 | 2020–21 |
| Federal Government – Economic and Fiscal Snapshot | July 8, 2020 | 2020–21 |
| British Columbia – Economic and Fiscal Update | July 14, 2020 | 2020–21 |
| British Columbia – First Quarterly Report | September 10, 2020 | 2020–21 |
| Newfoundland and Labrador – Fiscal Update | July 24, 2020 | 2020–21 |
| Newfoundland and Labrador – 2020 Budget | September 30, 2020 | 2020–21 |
| Nova Scotia – Forecast Update | July 29, 2020 | 2020–21 |
| Alberta – First Quarter Fiscal Update and Economic Statement | August 27, 2020 | 2020–21 |
Table footnotes:
Note: Manitoba released a budget on March 19, but this was not informed by COVID‑19. Manitoba also released a fiscal update on June 30, but this update included scenarios only. Alberta released an update on March 20 that reflected an additional $500 million in 2020–21 to the Ministry of Health for the provincial response to the COVID‑19. Saskatchewan released its 2020–21 Estimates on March 18, but this excluded revenue projections.
Sources: Federal and provincial budgets and fiscal updates for 2020–21 released since the World Health Organization declared COVID‑19 a pandemic on March 11, 2020.
The government’s plan is consistent with the Fiscal Sustainability, Transparency and Accountability Act, 2019 (FSTAA) governing principles that guide Ontario’s fiscal policy:
- Transparent: Even as governments around the world delayed their financial updates, Ontario demonstrated leadership by being the first jurisdiction in Canada to release a fiscal plan that reflected the potential impacts of COVID‑19.
- Responsible: The government has developed a measured and responsible approach to managing Ontario’s finances that does not rely on tax increases, while at the same time strengthening critical programs and services. As outlined in this Budget, the government continues to invest in the fight against COVID‑19 as well as key initiatives to support people and jobs, and the ongoing economic recovery of the province.
- Flexible: The government’s plan has built in appropriate levels of prudence in the form of contingency funds and a reserve to ensure it has the fiscal flexibility to respond to changing circumstances.
- Equitable: The government’s plan strengthens critical public services, such as health care and education, for the people of today and ensures they are maintained for the benefit of future generations. Ontario’s updated debt burden reduction strategy will be provided in the 2021 Budget and will be aimed at ensuring sustainable levels of public debt over time.
- Sustainable: Since the outset of the pandemic, the Ontario government has promised to do what is necessary to respond to COVID‑19, while balancing these needs with the long-term sustainability of Ontario’s finances. This is reflected in the government’s prudent decision to establish dedicated contingency funds to provide targeted, time-limited support for critical services and address the extraordinary needs of the people of Ontario throughout the pandemic. This flexible approach also ensures funding is available for critical services and programs, such as health care and education, to appropriately respond to rapidly changing circumstances as efficiently as possible.
Ontario’s Fiscal Plan
In 2020–21 the government is projecting a deficit of $38.5 billion, unchanged from the deficit forecast at the time of the 2020–21 First Quarter Finances. Over the medium term, the government is forecasting deficits of $33.1 billion in 2021–22 and $28.2 billion in 2022–23.
| Actual 2019–20 |
Current Outlook1 2020–21 |
Medium-Term Outlook 2021–22 |
Medium-Term Outlook 2022–23 |
|
|---|---|---|---|---|
| Revenue — Personal Income Tax | 37.7 | 36.9 | 36.0 | 38.1 |
| Revenue — Sales Tax | 28.6 | 24.9 | 27.1 | 29.1 |
| Revenue — Corporations Tax | 15.4 | 9.9 | 13.0 | 14.0 |
| Revenue — Ontario Health Premium | 4.1 | 4.0 | 4.1 | 4.3 |
| Revenue — Education Property Tax | 6.2 | 6.1 | 5.8 | 5.7 |
| Revenue — All Other Taxes | 16.3 | 15.7 | 16.5 | 17.2 |
| Total Taxation Revenue | 108.3 | 97.5 | 102.5 | 108.5 |
| Government of Canada | 25.4 | 33.4 | 27.1 | 27.6 |
| Income from Government Business Enterprises | 5.9 | 3.6 | 4.9 | 6.0 |
| Other Non-Tax Revenue | 16.5 | 16.7 | 17.9 | 18.1 |
| Total Revenue | 156.1 | 151.1 | 152.3 | 160.2 |
| Programs — Health Sector2 | 63.7 | 64.6 | 67.0 | 68.5 |
| Programs — Education Sector3 | 30.2 | 31.0 | 31.1 | 31.3 |
| Programs — Postsecondary Education Sector | 10.5 | 10.7 | 10.9 | 11.2 |
| Programs — Children’s and Social Services Sector | 17.1 | 17.9 | 17.8 | 17.9 |
| Programs — Justice Sector | 4.7 | 4.6 | 4.6 | 4.6 |
| Programs — Other Programs4 | 26.0 | 45.7 | 38.8 | 38.9 |
| Total Programs | 152.3 | 174.6 | 170.2 | 172.4 |
| Interest on Debt | 12.5 | 12.5 | 13.2 | 13.9 |
| Total Expense | 164.8 | 187.0 | 183.4 | 186.3 |
| Surplus/(Deficit) Before Reserve | (8.7) | (36.0) | (31.1) | (26.2) |
| Reserve | – | 2.5 | 2.0 | 2.0 |
| Surplus/(Deficit) | (8.7) | (38.5) | (33.1) | (28.2) |
| Net Debt as a Per Cent of GDP | 39.7% | 47.0% | 48.5% | 49.6% |
| Net Debt as a Per Cent of Revenue | 226.4% | 263.4% | 287.4% | 295.3% |
| Interest on Debt as Per Cent of Revenue | 8.0% | 8.2% | 8.7% | 8.7% |
Table footnotes:
[1] For the purposes of the legislated requirements for a budget and mid-year review in the Fiscal Sustainability, Transparency, and Accountability Act, 2019, the 2020–21 current outlook represents the plan year of the Budget as well as the current fiscal year of the mid-year review.
[2], [4] For presentation purposes in the 2020 Budget, all one-time COVID‑19 related spending has been included within the Other Programs sector instead of the Health Sector. This funding includes one-time COVID‑19 Health Sector expense of $3.1 billion and COVID‑19 Health Contingency Fund of $5.3 billion in 2020–21, as well as a Pandemic Fund of $4.0 billion in 2021–22 and $2.0 billion in 2022–23. The change in presentation does not impact ministry allocations, which reflect ministry structure(s) presented in the 2020–21 Expenditure Estimates. For details on time-limited funding and contingencies, see Extraordinary Contingencies and Time-Limited Pandemic Response in the Program Expense Details section.
[3] Excludes Teachers’ Pension Plan. Teachers’ Pension Plan expense is included in Other Programs.
Note: Numbers may not add due to rounding.
Sources: Ontario Treasury Board Secretariat and Ministry of Finance.
Program Expense Details
Program expense is expected to grow by an annual average growth rate of 4.2 per cent between 2019–20 and 2022–23, primarily due to the temporary expenses associated with COVID‑19. This additional funding will primarily be used to support critical services including health care, education and contingencies to continue to respond to the COVID‑19 pandemic as it unfolds.
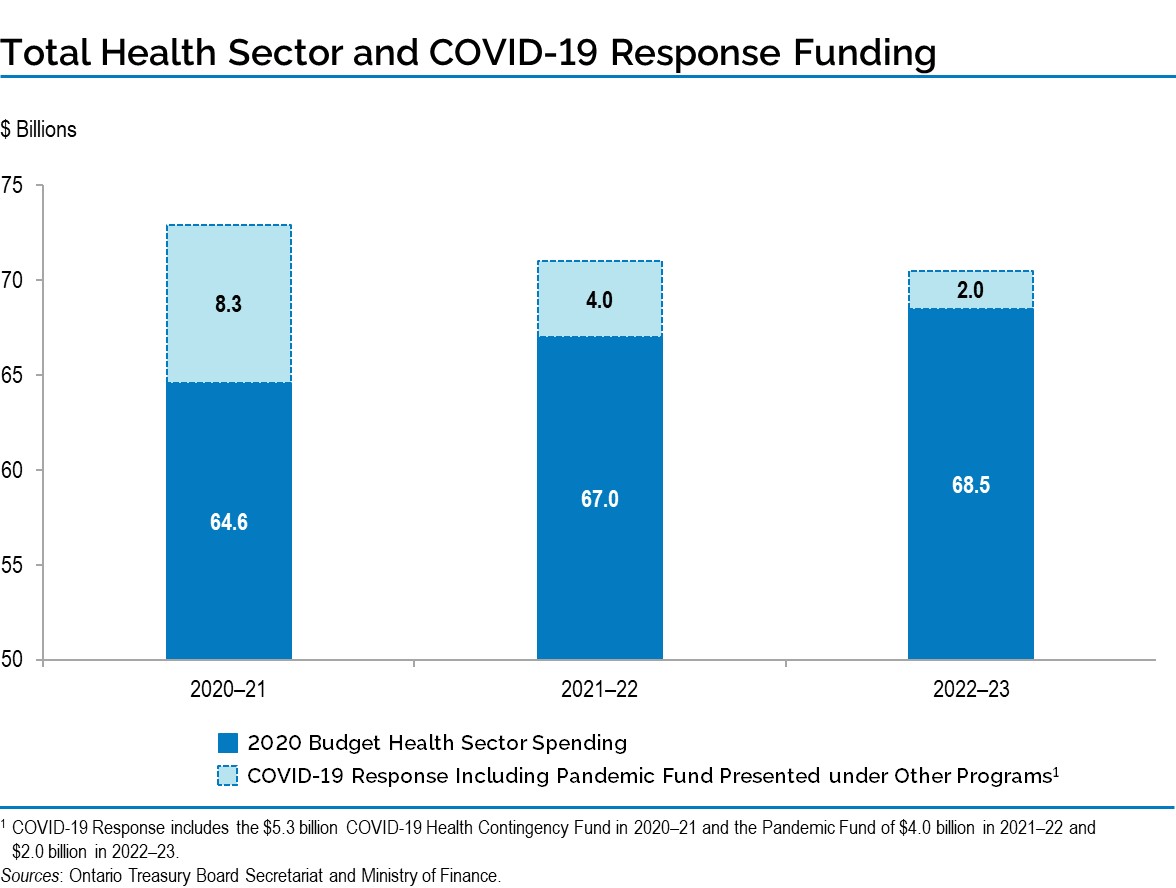
The Province continues to ensure that the necessary resources are available to protect people’s health and support the health care system. As a result, it has made substantial time-limited funding available for the Province’s health sector response that is dedicated to support the fight against the pandemic. In 2020–21 this dedicated support is projected to be $8.3 billion, with an additional $4 billion set aside in 2021–22, and a further $2 billion in 2022–23.
In order to support Ontario families, businesses and the health care heroes on the front lines of the pandemic, the Province has made available time-limited funding and extraordinary contingencies of $13.3 billion in 2020–21, $5 billion in 2021–22 and $2.8 billion in 2022–23. This funding is tracked under the categories of COVID‑19 health sector response, a Pandemic Fund and the Support for People and Jobs Fund, and is reflected in the Other Programs sector of the expense outlook. The balances remaining in these funds enable the government to continue to respond to COVID‑19 and support the recovery for the province.
| Current Outlook1 2020–21 |
Medium-Term Outlook 2021–22 |
Medium-Term Outlook 2022–23 |
|
|---|---|---|---|
| Time-limited Funding and Contingencies — One-time COVID‑19 Health Sector Expense | 3,052 | – | – |
| Time-limited Funding and Contingencies — COVID‑19 Health Contingency Fund | 5,294 | – | – |
| Time-limited Funding and Contingencies — Pandemic Fund | – | 4,000 | 2,000 |
| Time-limited Funding and Contingencies — Subtotal: COVID‑19 Response Including Pandemic Fund | 8,346 | 4,000 | 2,000 |
| Time-limited Funding and Contingencies — Support for People and Jobs Fund | 4,966 | 1,000 | 800 |
| Total Time-limited Funding and Contingencies | 13,312 | 5,000 | 2,800 |
| Remaining Balances2 -— COVID‑19 Health Contingency Fund Net of New Projected Drawdowns in the 2020 Budget3 | 598 | – | – |
| Remaining Balances4 — Pandemic Fund | – | 4,000 | 2,000 |
| Remaining Balances5 — Subtotal: COVID‑19 Response Including Pandemic Fund | 598 | 4,000 | 2,000 |
| Remaining Balances6 — Support for People and Jobs Fund | 2,050 | 1,000 | 800 |
| Total Remaining Balances | 2,648 | 5,000 | 2,800 |
Table footnotes:
[1] For the purposes of the legislated requirements for a budget and mid-year review in the Fiscal Sustainability, Transparency, and Accountability Act, 2019, the 2020–21 current outlook represents the plan year of the Budget as well as the current fiscal year of the mid-year review.
[2], [4], [5], [6] As at October 13, 2020
[3] The COVID‑19 Health Contingency Fund remaining balance is net of projected new spending drawn from the fund since 2020–21 First Quarter Finances. See Table 3.4 for details.
Note: Numbers may not add due to rounding.
Sources: Ontario Treasury Board Secretariat and Ministry of Finance.
See Chapter 3: Ontario’s Fiscal Plan and Outlook for further details on the program expense outlook over the medium term.
Revenue Details
The Province’s revenue plan is anchored by an economic projection based on private-sector forecasts and the best available information at the time. Details of the revenue outlook are outlined later in this document. See Chapter 3: Ontario’s Fiscal Plan and Outlook for more details.
Key inputs included in the revenue forecast are:
- A prudent economic outlook;
- Existing federal–provincial agreements and funding formulas; and
- The business plans of government ministries, business enterprises and service organizations.
Other Fiscal Plan Assumptions
The reserve is set at $2.5 billion in 2020–21 and $2.0 billion each year over the medium term.
Net Debt-to-GDP for 2020–21 is projected to be 47.0 per cent, higher than the 40.7 per cent projected in the 2019 Budget. Over the medium term, the net debt-to-GDP ratio is forecast to be 48.5 per cent and 49.6 per cent in 2021–22 and 2022–23, respectively.
Borrowing and Debt Management
Total 2020–21 long-term public borrowing is now forecast to be $52.3 billion. This is $0.2 billion higher than the 2020–21 First Quarter Finances forecast due to a planned increase in investments in capital infrastructure. As of October 13, 2020, the Province had completed $34.7 billion, or 66 per cent of its 2020–21 total long-term public borrowing program. Ontario’s 2020–21 net debt-to-GDP ratio is now forecast to be 47.0 per cent, compared to 47.1 per cent at the time of the 2020–21 First Quarter Finances. Ontario is forecast to pay $12.5 billion in interest costs in 2020–21, unchanged from the forecast in the 2020–21 First Quarter Finances.
Progress Report on Debt Burden Reduction Strategy
The government plans to update its debt burden reduction strategy in the 2021 Budget. Acknowledging the continued uncertainty of the global pandemic, the government plans to set a long-term target for the net debt-to-GDP ratio along with a path to balance in the 2021 Budget. This updated debt burden reduction strategy will set out a plan for managing the province’s debt load and restoring fiscal sustainability.
Prior to COVID‑19, the government was making progress on the commitment to keep the net debt-to-GDP ratio, through to 2022–23, to less than the Independent Financial Commission of Inquiry’s 2018–19 forecast of 40.8 per cent. The 2019–20 net debt-to-GDP ratio was 39.7 per cent, a full percentage point lower than the 2019 Budget forecast of 40.7 per cent. These gains created fiscal flexibility that allowed the Province to respond swiftly to the pandemic.
Ontario’s Action Plan: Responding to COVID‑19 made available a projected $30 billion to support health care, people and businesses, and built in significant flexibility to ensure the Province can continue to respond to the unfolding crisis. These necessary actions have resulted in a change to the downward trajectory of the net debt-to-GDP ratio, as it has for governments elsewhere in Canada and around the world.
Net Debt-to-GDP
The net debt-to-GDP ratio in 2020–21 is now projected to be 47.0 per cent, or 0.1 percentage point lower than the 47.1 per cent forecast in the 2020–21 First Quarter Finances.
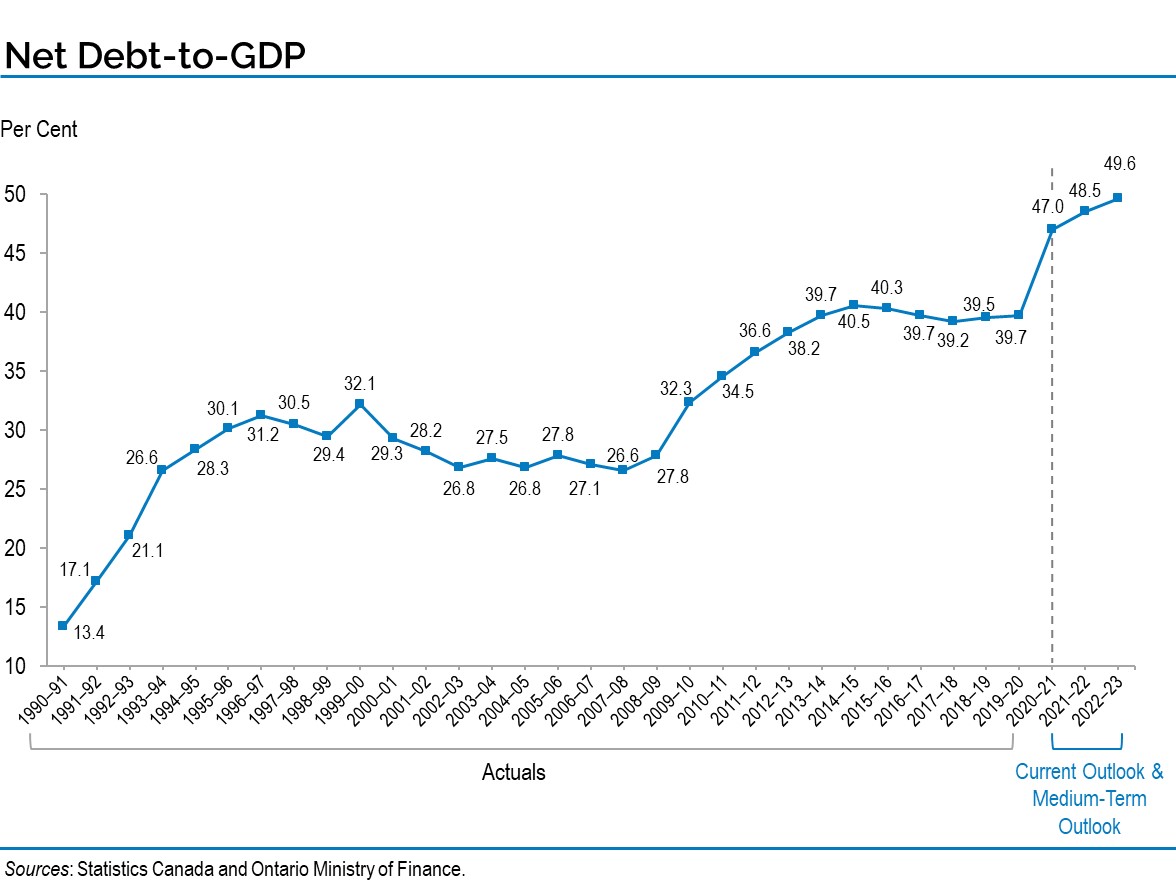
The net debt-to-GDP ratio for the current outlook and medium-term plan period is forecast to be higher than the forecasts contained in the 2019 Budget due to the COVID‑19 pandemic, which has led to necessarily higher deficits combined with lower GDP forecasts.
After the pandemic, the government’s objective will be to slow the rate of increase in the net debt-to-GDP ratio, supported by GDP growth from the economic recovery.
The interest rates the Province must pay on new or refinanced debt issued remain near historic lows. Despite a $38.5 billion forecast deficit and $44.6 billion projected increase in net debt in this fiscal year, interest on debt expense remains unchanged from 2019–20 to 2020–21.
A one percentage point change in interest rates from the current forecast, either up or down, would have a corresponding change in Ontario’s interest costs by over $800 million in the first full year.
| 2019–20 | 2020–21 March 2020 Update |
2020–21 First Quarter Finances |
2020–21 Change from First Quarter Finances |
2020–21 Current Outlook1 |
Medium-Term Outlook 2021–22 |
Medium-Term Outlook 2022–23 |
|
|---|---|---|---|---|---|---|---|
| Deficit/(Surplus) | 8.7 | 20.5 | 38.5 | – | 38.5 | 33.1 | 28.2 |
| Investment in Capital Assets | 9.7 | 10.4 | 10.4 | 0.2 | 10.6 | 11.5 | 12.0 |
| Non-Cash Adjustments | (6.0) | (9.2) | (9.2) | – | (9.2) | (8.8) | (8.9) |
| Loans to Infrastructure Ontario | 0.2 | 0.3 | – | – | – | 0.1 | (0.4) |
| Other Net Loans/Investments | 0.3 | 1.2 | 0.5 | 0.1 | 0.6 | (0.5) | (0.3) |
| Debt Maturities/Redemptions | 27.4 | 26.6 | 26.6 | 0.1 | 26.7 | 25.1 | 30.6 |
| Total Funding Requirement | 40.3 | 49.7 | 66.7 | 0.4 | 67.0 | 60.6 | 61.3 |
| Decrease/(Increase) in Short-Term Borrowing | (3.0) | (2.0) | (7.0) | 1.3 | (5.7) | (2.0) | (2.0) |
| Increase/(Decrease) in Cash and Cash Equivalents | (5.4) | – | – | (1.4) | (1.4) | – | – |
| Pre-borrowing in 2019–20 | 7.6 | (4.1) | (7.6) | – | (7.6) | – | – |
| Total Long-Term Public Borrowing | 39.5 | 43.6 | 52.1 | 0.2 | 52.3 | 58.6 | 59.3 |
Table footnotes:
[1] For the purposes of the legislated requirements for a budget and mid-year review in the Fiscal Sustainability, Transparency, and Accountability Act, 2019, the 2020–21 current outlook represents the plan year of the Budget as well as the current fiscal year of the mid-year review.
Note: Numbers may not add due to rounding.
Source: Ontario Financing Authority.
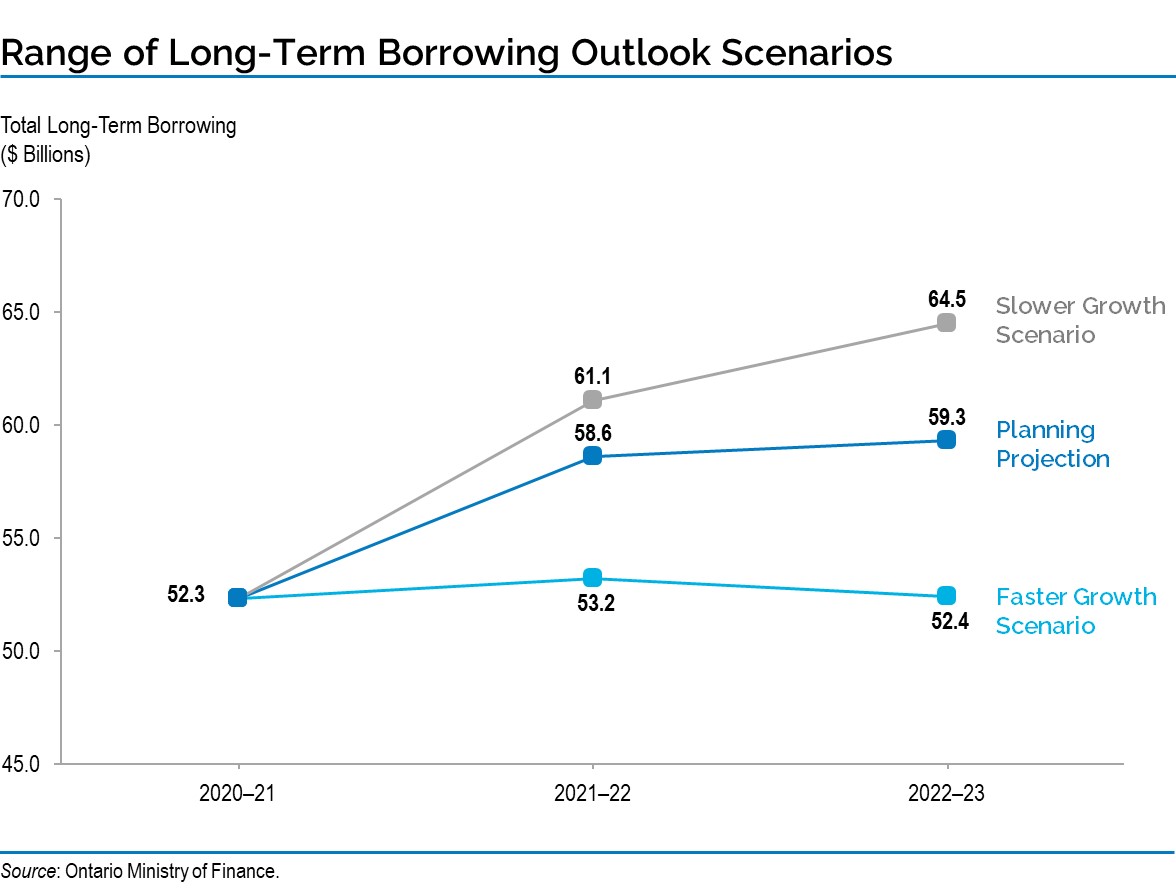
As described earlier in the Enhancing Transparency: Alternative Economic Scenarios section, in the event alternative economic scenarios materialize, the Province’s deficit outlook in the next two years would also change as a result. Under the Faster Growth scenario, the long-term borrowing of the Province would decrease by a total of $12.3 billion over the medium-term outlook, while under the Slower Growth scenario, long-term borrowing would increase by $7.7 billion over the same period.
Ontario’s Capital Plan
A key element of the government’s plan is investment in infrastructure, including strategic investments in transit, highways, schools, hospitals and broadband. Planned investments over the next 10 years total $142.9 billion, including $13.6 billion in 2020–21. These investments are fundamental to the government’s plan to support people and employers during COVID‑19 and build the foundation for a strong economic recovery.
Key highlights in the capital plan include:
- New funding of over $680 million over the next four years, including an additional $150 million for the Improving Connectivity for Ontario (ICON) program, bringing Ontario’s investment in broadband to nearly $1 billion over six years beginning in 2019–20. These investments will expand broadband and cellular infrastructure across Ontario to enable economic recovery and growth, support productivity, education, health care and agriculture to create direct and indirect jobs, improve connectivity and enable Ontario’s firms to remain competitive in the global economy.
- Funding for the Investing in Canada Infrastructure Program (ICIP), including over $1 billion in federal and provincial funding under the newly established COVID‑19 Resilience stream to support health and safety through the accelerated delivery of priority municipal infrastructure projects as well as investments to retrofit schools and long-term care homes.
- $62.7 billion over 10 years for public transit projects, including:
- The largest subway expansion in Canadian history, including the Ontario Line, the three-stop Scarborough Subway Extension, the Yonge North Subway Extension and the predominantly underground Eglinton Crosstown West Extension, which will expand the subway system by 50 per cent;
- Major transit projects currently underway, including, for example, the Hurontario Light Rail Transit Project; and
- The GO Rail Expansion program, which will transform the GO Transit rail network into a comprehensive all-day rapid transit network. It will provide two-way, all-day service every 15 minutes over core segments of the network, and nearly double annual ridership by 2055.
- The Highway Program, including expansion and rehabilitation projects across the province. The Province has allocated more than $22 billion in funding over 10 years to expand and repair Ontario’s highways and bridges, including expansion projects on stretches of Highway 3 from Essex to Leamington, Highway 17 from the Ontario/Manitoba border to Rush Bay Road and from Arnprior to Renfrew, Highway 401 between Tilbury and London and between Milton and Mississauga, and Highway 401 from Hespeler Road to Townline Road in Cambridge and from Hurontario Street to the Credit River Bridge in Mississauga. In July 2020, the Province amended the Public Transportation and Highway Improvement Act to accelerate key provincial highway construction projects by removing potential bottlenecks, allowing construction to start earlier and finish sooner. In October 2020, the Province introduced proposed legislative amendments to the Building Transit Faster Act, 2020, the Transit-Oriented Communities Act, 2020 and the Public Service Works on Highways Act that would expand authorities to further accelerate the delivery of provincial highway and transit projects, as well as transit-oriented communities including affordable housing.
- Major hospital projects currently under construction or in various stages of planning, including the Weeneebayko Area Health Authority New Replacement Hospital, Unity Health — St. Joseph’s Health Centre Redevelopment project, the Cortellucci Vaughan Hospital and the South Bruce Grey Health Centre — Kincardine Site Phase 1 Redevelopment project.
- Expanding and renovating schools, and creating more child care spaces across the province, including a recently approved French public elementary school in Kanata and the Tarentorus Public School addition in Sault Ste. Marie.
- Fast-tracking the development of four new long-term care homes in Mississauga, Ajax and Toronto to create 1,280 long-term care beds by the end of 2021, as part of the Accelerated Build Pilot Program, which supports the government’s plan to create new long-term care beds across the province.
| Sector | Current Outlook2 2020–21 |
Medium-Term Outlook 2021–22 |
Medium-Term Outlook 2022–23 |
10-Year Total3 |
|---|---|---|---|---|
| Transportation — Transit | 4,799 | 5,457 | 5,844 | 62,708 |
| Transportation — Provincial Highways | 2,587 | 2,561 | 2,764 | 22,017 |
| Transportation — Other Transportation, Property and Planning | 247 | 156 | 178 | 1,571 |
| Health — Hospitals | 2,064 | 2,573 | 2,557 | 27,229 |
| Health — Other Health | 243 | 287 | 299 | 3,038 |
| Education | 2,392 | 2,567 | 2,388 | 20,073 |
| Postsecondary Education — Colleges and Other | 534 | 530 | 361 | 2,988 |
| Postsecondary Education — Universities | 100 | 99 | 125 | 1,237 |
| Social | 168 | 232 | 192 | 2,351 |
| Justice | 615 | 822 | 850 | 4,348 |
| Other Sectors4 | 2,017 | 2,287 | 2,449 | 15,118 |
| Total Infrastructure Expenditures | 15,767 | 17,571 | 18,007 | 162,679 |
| Less: Other Partner Funding5 | 2,136 | 2,199 | 1,994 | 19,827 |
| Total6 | 13,631 | 15,372 | 16,013 | 142,852 |
Table footnotes:
[1] Includes interest capitalized during construction; third-party investments in hospitals, colleges and schools; federal and municipal contributions to provincially owned infrastructure investments; and transfers to municipalities, universities and non-consolidated agencies.
[2] For the purposes of the legislated requirements for a budget and mid-year review in the Fiscal Sustainability, Transparency, and Accountability Act, 2019, the 2020–21 current outlook represents the plan year of the Budget as well as the current fiscal year of the mid-year review.
[3] Total reflects the planned infrastructure expenditures for years 2020–21 through 2029–30.
[4] Includes broadband infrastructure, government administration, natural resources, and culture and tourism industries.
[5] Other Partner Funding refers to third-party investments primarily in hospitals, colleges and schools.
[6] Includes federal–municipal contributions to provincial infrastructure investments.
Note: Numbers may not add due to rounding.
Source: Ontario Treasury Board Secretariat.
Footnotes
[1] For example, “Measuring Economic Policy Uncertainty” by Scott Baker, Nicholas Bloom and Steven J. Davis at www.PolicyUncertainty.com finds that “current levels of economic policy uncertainty are at extremely elevated levels compared to recent history.”
[2] Office of the Auditor General of Ontario, Annual Report 2019, page 590; https://www.auditor.on.ca/en/content/annualreports/arreports/en19/2019AR_v1_en_web.pdf
Chart Descriptions
Chart: Employment Change Compared to Previous Major Downturns
The line chart shows the Ontario employment change from peak employment by month for the last three recessions (1981–82, 1990–92, 2008–09) and in 2020. During the 1981–82 recession, employment hit its low point in (post-peak) month 13 at −4.8 per cent and returned to peak employment in month 24. During the 1990–92 recession, employment hit its low point in month 31 at −6.9 per cent and returned to peak employment in month 88. During the 2008–09 recession, employment hit its low point in month eight at −4.1 per cent and returned to peak employment in month 30. In the 2020 recession, employment hit its low point of −15.3 per cent in May.
There is a box labelled 2020 Recession with details of the employment change since February 2020. From February to May, employment was down 1,156,500 net jobs or 15.3 per cent and from May to September, employment was up 838,000 net jobs or 11.1 per cent. Overall employment from February to September was down 318,500 net jobs or 4.2 per cent.
Sources: Statistics Canada and Ontario Ministry of Finance.
Chart: Unprecedented Private-Sector Forecast Uncertainty
The bar chart shows the difference between the highest and lowest private-sector forecast for Ontario real GDP growth. The average difference from 2004 to 2019 was 0.7 percentage point. In 2009, the difference was 1.2 percentage points. In 2020, the difference is 2.4 percentage points.
Sources: Ontario Economic Outlook and Fiscal Review (2004–19) and Ontario Ministry of Finance Survey of Forecasters.
Chart: Range of Ontario Real GDP Scenario Forecasts
This chart shows the projected levels of Ontario real GDP in billions of 2012 dollars under three scenarios: the planning projection, the Faster Growth scenario and the Slower Growth scenario. Ontario real GDP was $792 billion in 2019 and projected to be $741 billion in 2020 for all three scenarios. Under the planning projection, Ontario real GDP is projected to be $777 billion in 2021, $804 billion in 2022, and $820 billion in 2023. Under the Slower Growth scenario, Ontario real GDP is projected to be $765 billion in 2021, $773 billion in 2022, and $784 billion in 2023. Under the Faster Growth scenario, Ontario real GDP is projected to be $796 billion in 2021, $821 billion in 2022, and $840 billion in 2023.
Source: Ontario Ministry of Finance.
Chart: Range of Ontario Deficit Outlook Scenarios
The bar chart illustrates the range of Ontario deficit outlooks based on the two alternative economic scenarios presented in Chapter 2. The 2020 Budget Deficit Outlook scenario estimates the deficit to be $38.5 billion in 2020–21, $33.1 billion in 2021–22 and $28.2 billion in 2022–23. The Deficit scenario under Faster Growth scenario estimates the deficit to be $27.7 billion in 2021–22 and $21.3 billion in 2022–23. The Deficit scenario under Slower Growth scenario estimates the deficit to be $35.6 billion in 2021–22 and $33.4 billion in 2022–23.
Chart: Total Health Sector and COVID‑19 Response Funding
This stacked bar chart illustrates the total health sector spending and the COVID‑19 Response including Pandemic Fund1 spending for 2020–21 to 2022–23. In 2020–21 total health sector spending is forecast to be $64.6 billion and the COVID‑19 Response including Pandemic Fund spending is forecast to be $8.3 billion. In 2021–22 total health sector spending is forecast to be $67.0 billion and the COVID‑19 Response including Pandemic Fund spending is forecast to be $4.0 billion. In 2022–23 total health sector spending is forecast to be $68.5 billion and the COVID‑19 Response including Pandemic Fund spending is forecast to be $2.0 billion.
COVID‑19 Response includes the $5.3 billion COVID‑19 Health Contingency Fund in 2020–21 and the Pandemic Fund of $4.0 billion in 2021–22 and $2.0 billion in 2022–23.
Sources: Ontario Treasury Board Secretariat and Ministry of Finance.
Chart: Net Debt-to-GDP
Ontario’s net debt-to-GDP ratio is forecast at 47.0 per cent in 2020–21.
| Year | Net Debt-to-GDP (%) |
|---|---|
| 1990–91 | 13.4 |
| 1991–92 | 17.1 |
| 1992–93 | 21.1 |
| 1993–94 | 26.6 |
| 1994–95 | 28.3 |
| 1995–96 | 30.1 |
| 1996–97 | 31.2 |
| 1997–98 | 30.5 |
| 1998–99 | 29.4 |
| 1999–00 | 32.1 |
| 2000–01 | 29.3 |
| 2001–02 | 28.2 |
| 2002–03 | 26.8 |
| 2003–04 | 27.5 |
| 2004–05 | 26.8 |
| 2005–06 | 27.8 |
| 2006–07 | 27.1 |
| 2007–08 | 26.6 |
| 2008–09 | 27.8 |
| 2009–10 | 32.3 |
| 2010–11 | 34.5 |
| 2011–12 | 36.6 |
| 2012–13 | 38.2 |
| 2013–14 | 39.7 |
| 2014–15 | 40.5 |
| 2015–16 | 40.3 |
| 2016–17 | 39.7 |
| 2017–18 | 39.2 |
| 2018–19 | 39.5 |
| 2019–20 | 39.7 |
| 2020–21 | 47.0 |
| 2021–22 | 48.5 |
| 2022–23 | 49.6 |
Sources: Statistics Canada and Ontario Ministry of Finance.
Chart: Range of Long-Term Borrowing Outlook Scenarios
| Year | 2020–21 | 2021–22 | 2022–23 |
|---|---|---|---|
| Planning Projection | $52.3 billion | $58.6 billion | $59.3 billion |
| Slower Growth Scenario | $52.3 billion | $61.1 billion | $64.5 billion |
| Faster Growth Scenario | $52.3 billion | $53.2 billion | $52.4 billion |
Source: Ontario Ministry of Finance