Introduction
The second wave of COVID‑19 had a significant impact on the provincial economy. Employment declined by 153,500 net jobs in January 2021. Private-sector forecasts for real gross domestic product (GDP) growth in 2021 have, on average, been reduced since the 2020 Budget. Ontario recognizes the significant impacts and is continuing to support people, employers and jobs during this challenging period as outlined in Chapter 1: Ontario’s Action Plan: Protecting People’s Health and Our Economy.
Following two consecutive quarterly declines of 1.8 per cent and 12.2 per cent in the first half of 2020, Ontario’s real GDP increased 9.4 per cent in the third quarter, but it remained below the level of the fourth quarter in 2019. Ontario’s real GDP is estimated to have declined by 5.7 per cent in 2020. Between May 2020 and February 2021, Ontario employment has risen by 829,400 net jobs but remained 305,300 (-4.1 per cent) below its pre-pandemic level.
Ontario’s real GDP is projected to rise 4.0 per cent in 2021, 4.3 per cent in 2022, 2.5 per cent in 2023 and 2.0 per cent in 2024. For the purposes of prudent fiscal planning, these projections were set slightly below the average of private-sector forecasts.
| 2019 | 2020 | 2021p | 2022p | 2023p | 2024p | |
|---|---|---|---|---|---|---|
| Real GDP Growth | 2.1 | (5.7e) | 4 | 4.3 | 2.5 | 2.0 |
| Nominal GDP Growth | 3.8 | (4.8e) | 6.2 | 6.4 | 4.5 | 4.0 |
| Employment Growth | 2.8 | (4.8) | 4.2 | 3.0 | 2.2 | 1.6 |
| CPI Inflation | 1.9 | 0.7 | 1.7 | 2.0 | 2.0 | 2.0 |
Table 2.1 footnotes:
p = Ontario Ministry of Finance planning projection based on external sources.
e = estimate.
Sources: Statistics Canada and Ontario Ministry of Finance.
Recent Economic Performance
The COVID‑19 pandemic resulted in a significant contraction in economic activity around the world in the first half of 2020. Global real GDP is estimated to have declined by 3.5 per cent in 2020, the largest annual decrease on record since 1980. Canadian real GDP declined by 5.4 per cent in 2020.
In the second half of 2020, economies around the world began to rebound, with all G7 countries experiencing growth in the third quarter and many countries continuing to show gains in the fourth quarter. Despite this growth, every G7 country remained below their pre-pandemic level of real GDP, reflecting the severity of the recession earlier in the year.
Ontario’s real GDP increased by 9.4 per cent in the third quarter of 2020, following declines of 1.8 per cent and 12.2 per cent, respectively, in the first two quarters of 2020. Real GDP is projected to have continued growing during the fourth quarter of 2020. On an annual basis, Ontario real GDP is estimated to have declined 5.7 per cent in 2020.
The Pandemic had Significant Employment Impacts
The global pandemic had a significant impact on jobs in the province. Between February and May of 2020, employment declined by 1,134,700 (-15.1 per cent), while the unemployment rate increased to 13.5 per cent. Between May 2020 and February 2021, employment increased by 829,400 net jobs. Overall employment remains 305,300 (-4.1 per cent) below the February 2020 level. As of February 2021, the unemployment rate was 9.2 per cent, down from a high of 13.5 per cent in May 2020.
Despite the relatively strong initial rebound in employment compared to past recessions, recovery has been partial and uneven. Some industries, such as manufacturing, are above pre‑pandemic levels, while others such as accommodation and food services are well below
pre-COVID‑19 levels of employment.
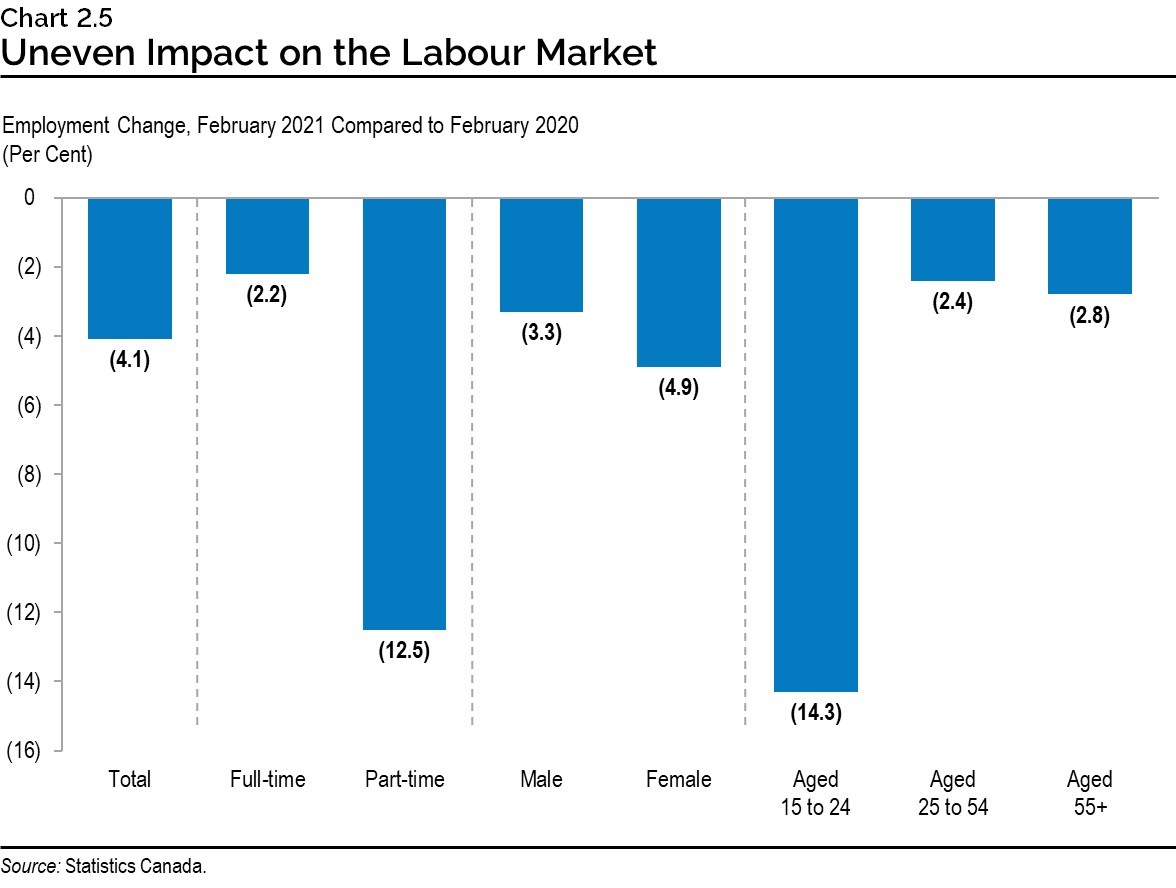
The pandemic’s employment impacts have also been uneven across age groups, type of work and gender. Between February 2020 and 2021, part-time (-12.5 per cent), female (-4.9 per cent) and youth aged 15 to 24 (-14.3 per cent) employment all remained further below their pre‑pandemic levels relative to other groups.
Government Support Helped Families
As outlined in Chapter 1: Ontario’s Action Plan: Protecting People’s Health and Our Economy, strong coordinated support from all levels of government has helped protect people and jobs, while positioning Ontario’s economy for recovery.
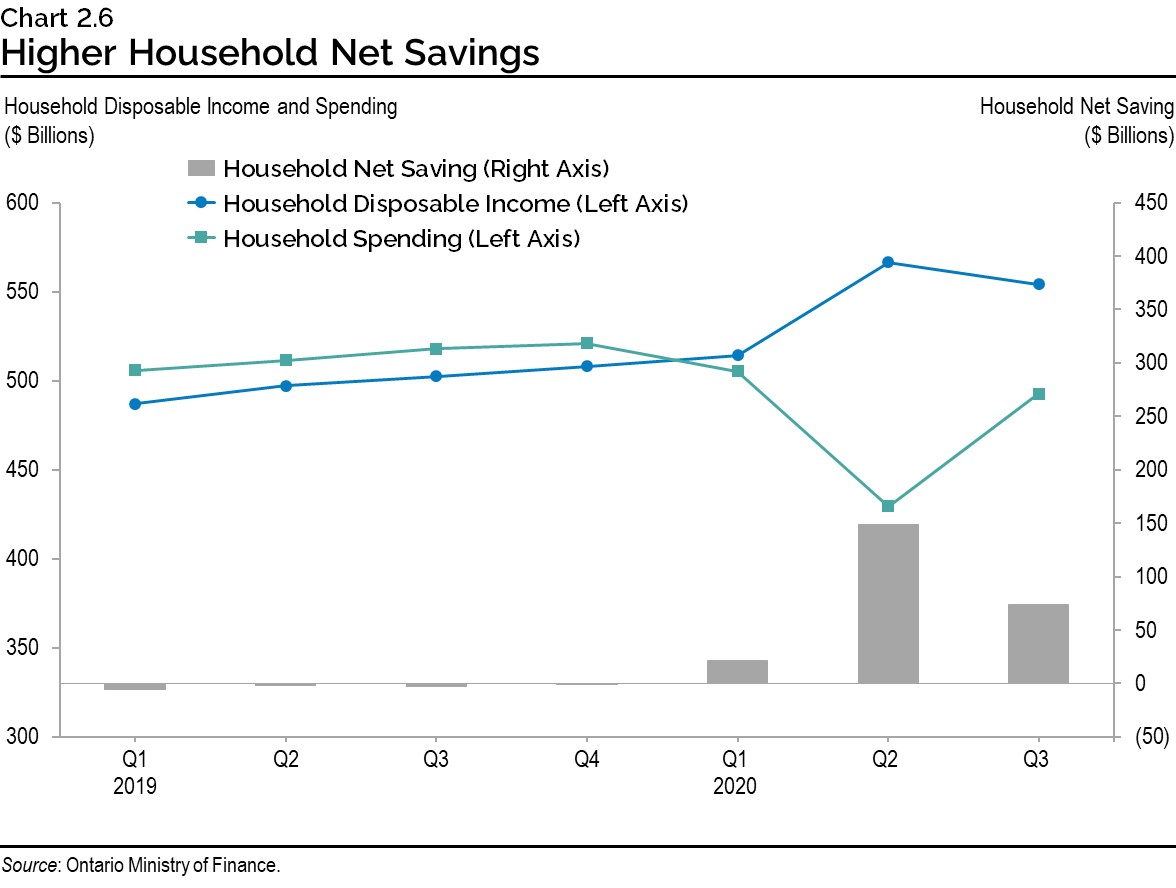
These policy actions included a broad range of income supports for families and individuals. Higher overall household disposable income and lower spending in the second quarter of 2020 led to a significant increase in household savings, which reached a record $148 billion before easing to $74 billion in the third quarter.
Many Economic Indicators Have Rebounded
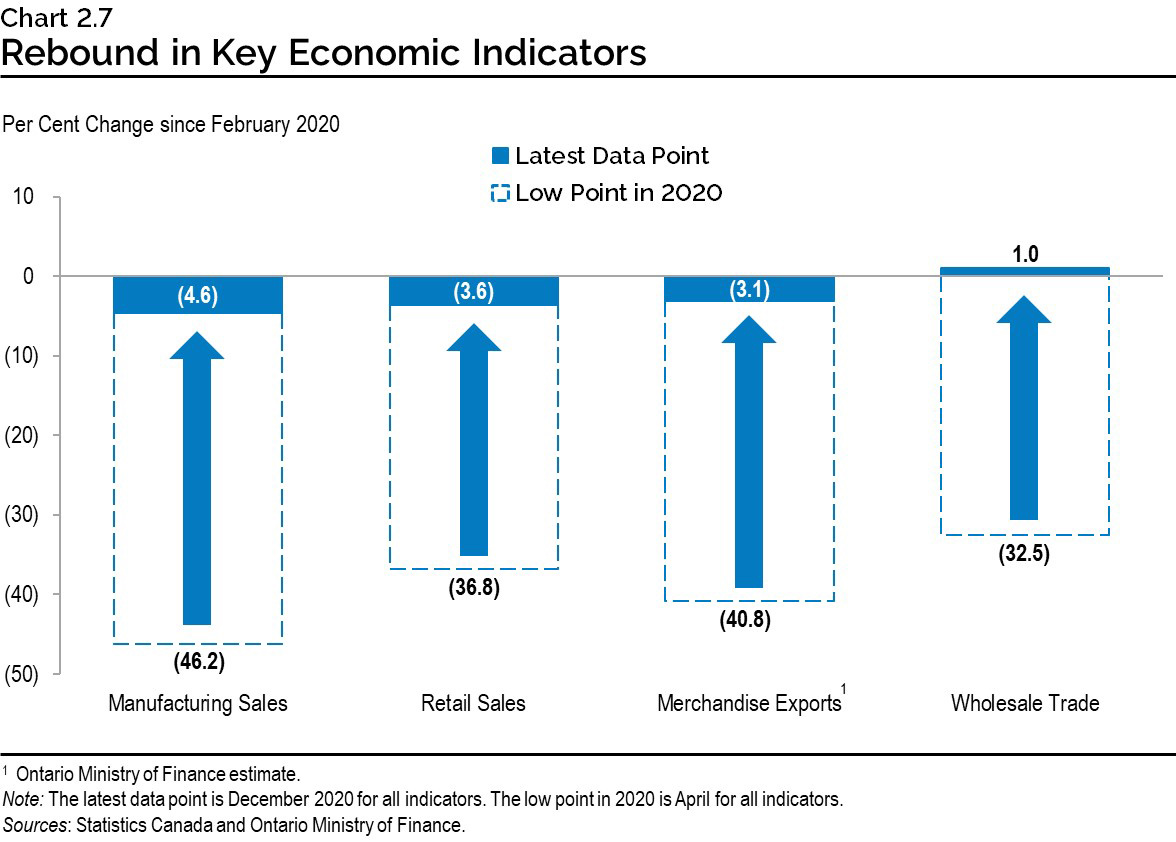
Key economic indicators have rebounded since their lows in the first half of 2020. Wholesale trade is now above its pre-pandemic level, while other indicators such as manufacturing sales, retail sales and merchandise exports are close to their pre-pandemic levels.
Ontario businesses have been significantly impacted by COVID‑19. Government programs have provided substantial financial support for businesses over the last year. See Chapter 1: Ontario’s Action Plan: Protecting People’s Health and Our Economy for more details. There were positive signs in the second half of 2020, but key metrics on business performance remained below pre-pandemic levels, including business investment in machinery and equipment and the net operating surplus of corporations, a measure of profitability.
Economic Outlook
The Ontario Ministry of Finance regularly consults with private-sector economists and tracks their forecasts to inform the government’s planning assumptions. Private-sector economists are forecasting that Ontario’s economy will grow over the next four years. On average, forecasters are projecting real GDP to grow 4.4 per cent in both 2021 and 2022, 2.6 per cent in 2023, and 2.1 per cent in 2024. The Ontario Ministry of Finance’s real GDP projections are set below the average of private-sector forecasts in each year for prudent planning purposes. Three external economic experts reviewed the Ontario Ministry of Finance’s economic assumptions and found them to be reasonable.1
| 2021 | 2022 | 2023 | 2024 | |
|---|---|---|---|---|
| BMO Capital Markets (January) | 5.0 | 4.8 | – | – |
| Central 1 Credit Union(January) | 4.0 | 4.4 | 2.7 | – |
| CIBC Capital Markets (January) | 3.9 | 5.2 | – | – |
| The Conference Board of Canada (January) | 4.3 | 4.4 | 2.0 | 1.5 |
| Desjardins Group (January) | 3.7 | 5.1 | 2.2 | 2.0 |
| Laurentian Bank Securities (January) | 4.2 | 4.5 | – | – |
| National Bank of Canada (January) | 3.6 | 4.2 | – | – |
| Quantitative Economic Decisions, Inc. (February) | 4.7 | 3.4 | 3.3 | 2.7 |
| Royal Bank of Canada (December) | 5.5 | 5.0 | – | – |
| Scotiabank (January) | 4.7 | 4.4 | – | – |
| Stokes Economics (February) | 4.6 | 3.3 | 2.2 | 1.9 |
| TD Bank Group (December) | 5.6 | 4.1 | – | – |
| University of Toronto (February) | 3.9 | 4.8 | 3.2 | 2.5 |
| Private-Sector Survey Average | 4.4 | 4.4 | 2.6 | 2.1 |
| Ontario’s Planning Assumption | 4.0 | 4.3 | 2.5 | 2.0 |
Table 2.2 footnotes:
Source: Ontario Ministry of Finance Survey of Forecasters (February 3, 2021).
The current range of private-sector forecasts for Ontario over the medium term reflects the heightened uncertainty as a result of the global pandemic, with real GDP growth forecasts ranging from 3.6 per cent to 5.6 per cent in 2021 and 3.3 per cent to 5.2 per cent in 2022. The range in 2021 real GDP forecasts is double the average for the first year projected in Budgets from 2004 to 2019. The range around forecasts for 2022 is roughly one-and-a-half times the average for the second year projected in Budgets over the same period.

Global Economic Environment
Ongoing deployment of COVID‑19 vaccines has supported expectations for global economic growth in 2021. Global real GDP is expected to rise 5.5 per cent in 2021 and 4.2 per cent in 2022.
The strength of the global economic recovery is likely to vary across countries, depending on the effectiveness of public health measures, access to COVID‑19 vaccines and treatments, and fiscal and monetary policy support. After declining 3.5 per cent in 2020, U.S. real GDP is expected to advance 4.9 per cent in 2021 and by 3.8 per cent in 2022. The Euro area is expected to grow at a slightly slower rate of 4.2 per cent in 2021 and 3.6 per cent in 2022. China remains the only major economy in the world to have recorded real GDP growth in 2020 at a pace of 2.3 per cent and China’s real GDP is expected to rise 8.1 per cent in 2021 and 5.6 per cent in 2022.
| 2019 | 2020 | 2021p | 2022p | 2023p | 2024p | |
|---|---|---|---|---|---|---|
| World Real GDP Growth (Per Cent) | 2.8 | (3.5e) | 5.5 | 4.2 | 3.8 | 3.6 |
| U.S. Real GDP Growth (Per Cent) | 2.2 | (3.5) | 4.9 | 3.8 | 2.3 | 2.1 |
| West Texas Intermediate (WTI) Crude Oil ($US per Barrel) | 57 | 39 | 47 | 52 | 56 | 57 |
| Canadian Dollar (Cents US) | 75.4 | 74.6 | 78.5 | 78.5 | 79.2 | 80.2 |
| Three-Month Treasury Bill Rate1 (Per Cent) | 1.7 | 0.4 | 0.2 | 0.2 | 0.5 | 1.1 |
| 10-Year Government Bond Rate2 (Per Cent) | 1.6 | 0.7 | 1.0 | 1.4 | 1.8 | 2.4 |
Table 2.3 footnotes:
e = International Monetary Fund estimate.
p = Ontario Ministry of Finance planning projection based on external sources.
[1], [2] Government of Canada interest rates.
Sources: International Monetary Fund World Economic Outlook (January 2021 and October 2020); U.S. Bureau of Economic Analysis; U.S. Energy Information Administration; Bank of Canada; “Blue Chip Economic Indicators” (February 2021 and October 2020); and Ontario Ministry of Finance Survey of Forecasters.
After lowering their policy rates and initiating asset purchasing programs at the outbreak of the pandemic, major central banks have maintained accommodative monetary policy to support economic recovery.
The U.S. Federal Reserve has kept the target range for the federal funds rate at 0 to 0.25 per cent since March 2020. It has committed to maintaining this target range until labour market conditions have reached full employment, and inflation has risen to and exceeded the two per cent target for some time. In addition, the U.S. Federal Reserve has continued its asset purchasing programs to help support accommodative financial conditions.
The Bank of Canada has kept its policy interest rate target at 0.25 per cent and has significantly increased asset purchases since March 2020. The Bank has committed to keeping the policy interest rate unchanged until its two per cent inflation target is sustainably achieved. The Bank anticipates this will not occur until 2023. Consistent with this, the three-month Treasury Bill rates are expected to remain low through 2023. The 10-year bond rate is projected to rise over the projection period to 2.4 per cent in 2024.
Stronger economic growth has supported a recovery in oil prices since the sharp decline in early 2020. West Texas Intermediate (WTI) oil prices have risen strongly in recent months. WTI oil prices are projected to rise on an annual basis over the forecast period as global economic growth strengthens energy demand.
Having declined from 77 cents US to 69 cents US in early 2020, the Canadian dollar has risen recently and is projected to appreciate gradually over the next three years.
Details of Ontario’s Economic Outlook
The Ontario Ministry of Finance estimates that Ontario real GDP declined by 5.7 per cent in 2020. Real GDP is then projected to rise by 4.0 per cent in 2021 and 4.3 per cent in 2022 before moderating to 2.5 per cent in 2023 and 2.0 per cent in 2024.
Table 2.4 provides details of the Ontario Ministry of Finance’s economic outlook over the forecast period.
| 2019 | 2020 | 2021p | 2022p | 2023p | 2024p | |
|---|---|---|---|---|---|---|
| Real Gross Domestic Product | 2.1 | (5.7e) | 4.0 | 4.3 | 2.5 | 2.0 |
| Nominal Gross Domestic Product | 3.8 | (4.8e) | 6.2 | 6.4 | 4.5 | 4.0 |
| Compensation of Employees | 4.6 | (1.8e) | 4.2 | 5.0 | 4.8 | 4.1 |
| Net Operating Surplus — Corporations | 0.0 | (11.5e) | 8.0 | 7.4 | 4.4 | 4.2 |
| Nominal Household Consumption | 3.5 | (5.8e) | 5.9 | 7.2 | 4.9 | 4.2 |
| Other Economic Indicators — Employment | 2.8 | (4.8) | 4.2 | 3.0 | 2.2 | 1.6 |
| Other Economic Indicators — Job Creation (000s) | 204 | (355) | 298 | 222 | 168 | 124 |
| Other Economic Indicators — Unemployment Rate (Per Cent) | 5.6 | 9.6 | 8.2 | 6.9 | 6.5 | 6.3 |
| Other Economic Indicators — Consumer Price Index | 1.9 | 0.7 | 1.7 | 2.0 | 2.0 | 2.0 |
| Other Economic Indicators — Housing Starts (000s) | 69.0 | 81.3 | 80.2 | 79.3 | 80.2 | 81.2 |
| Other Economic Indicators — Home Resales | 9.0 | 8.7 | 5.5 | (6.7) | 1.3 | 0.8 |
| Other Economic Indicators — Home Resale Prices | 6.4 | 16.0 | 7.5 | 0.0 | 0.5 | 2.0 |
| Key External Variables — U.S. Real Gross Domestic Product | 2.2 | (3.5) | 4.9 | 3.8 | 2.3 | 2.1 |
| Key External Variables — WTI Crude Oil ($US per Barrel) | 57.0 | 39.0 | 47.0 | 52.0 | 56.0 | 57.0 |
| Key External Variables — Canadian Dollar (Cents US) | 75.4 | 74.6 | 78.5 | 78.5 | 79.2 | 80.2 |
| Key External Variables — Three-Month Treasury Bill Rate1 | 1.7 | 0.4 | 0.2 | 0.2 | 0.5 | 1.1 |
| Key External Variables — 10-Year Government Bond Rate2 | 1.6 | 0.7 | 1.0 | 1.4 | 1.8 | 2.4 |
Table 2.4 footnotes:
e = Ontario Ministry of Finance estimate.
p = Ontario Ministry of Finance planning projection.
[1], [2] Government of Canada interest rates (per cent).
Sources: Statistics Canada; Canada Mortgage and Housing Corporation; Canadian Real Estate Association; Bank of Canada; United States Bureau of Economic Analysis; “Blue Chip Economic Indicators” (October 2020 and February 2021); U.S. Energy Information Administration and Ontario Ministry of Finance.
Employment to Increase
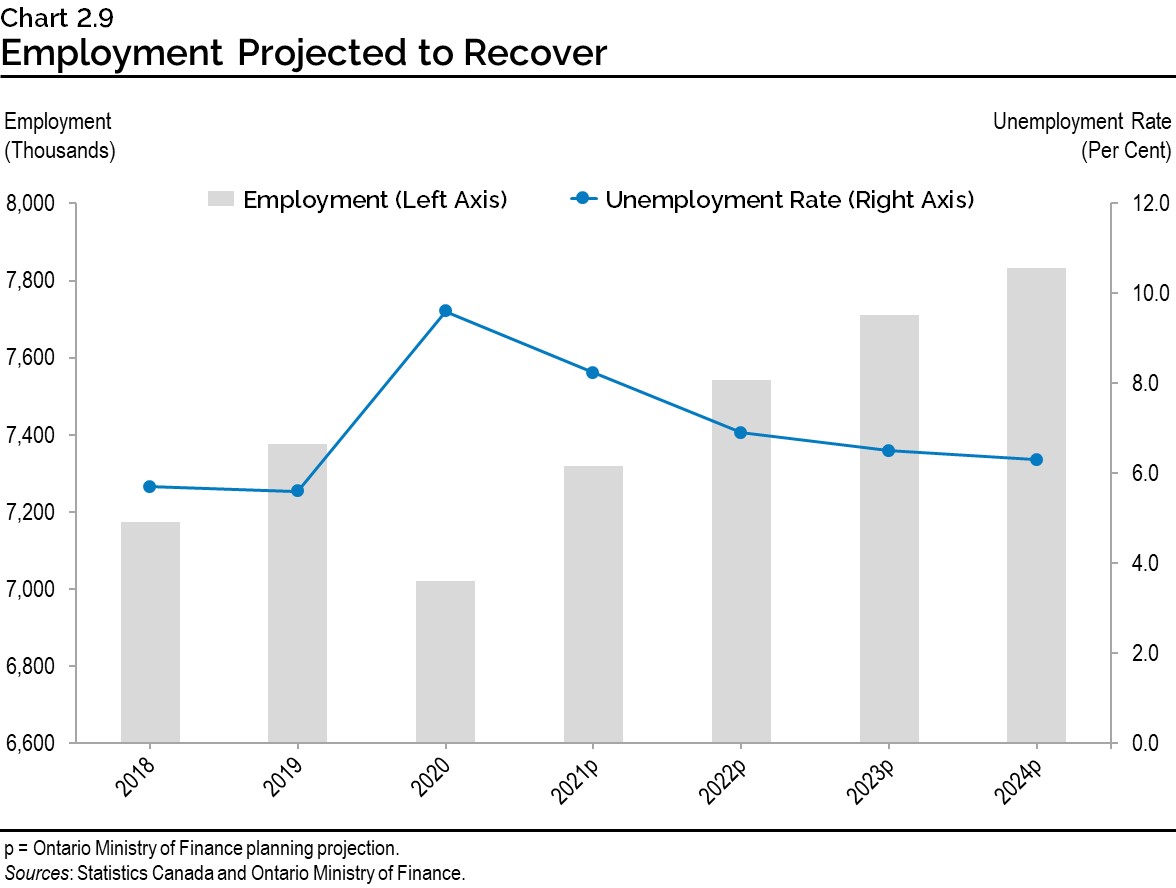
Rebounding economic activity is anticipated to support employment gains over the forecast period. Employment is projected to grow by 4.2 per cent, or close to 300,000 net new jobs, in 2021 and then by 3.0 per cent, or over 200,000 net new jobs, in 2022. Employment gains are projected to continue in 2023 and 2024, averaging growth of 1.9 per cent, or close to 150,000 net new jobs annually. The unemployment rate is projected to decline from 9.6 per cent in 2020 to 8.2 per cent in 2021 and steadily decline to 6.3 per cent in 2024.
As the economy recovers over the projection period, real GDP and employment are forecast to surpass their pre-pandemic levels in early 2022.
Household Spending to Boost Growth
Recovering employment and wages will support household spending, which is expected to be an important contributor to growth over the projection period. After declining in 2020, compensation of employees is projected to rise by 4.5 per cent on average, annually, over the 2021 to 2024 period.
Lower consumer spending, weaker price inflation and large government transfers resulted in heightened household savings in 2020. The additional savings and pent-up consumer demand are expected to support robust consumer spending in the near term. When pandemic risks ease and economic conditions begin to normalize, households are expected to boost spending on goods and services. This was the case in the third quarter of 2020, when real household spending rose by over 13.6 per cent and savings accumulation slowed.
Housing Activity Expected to Moderate
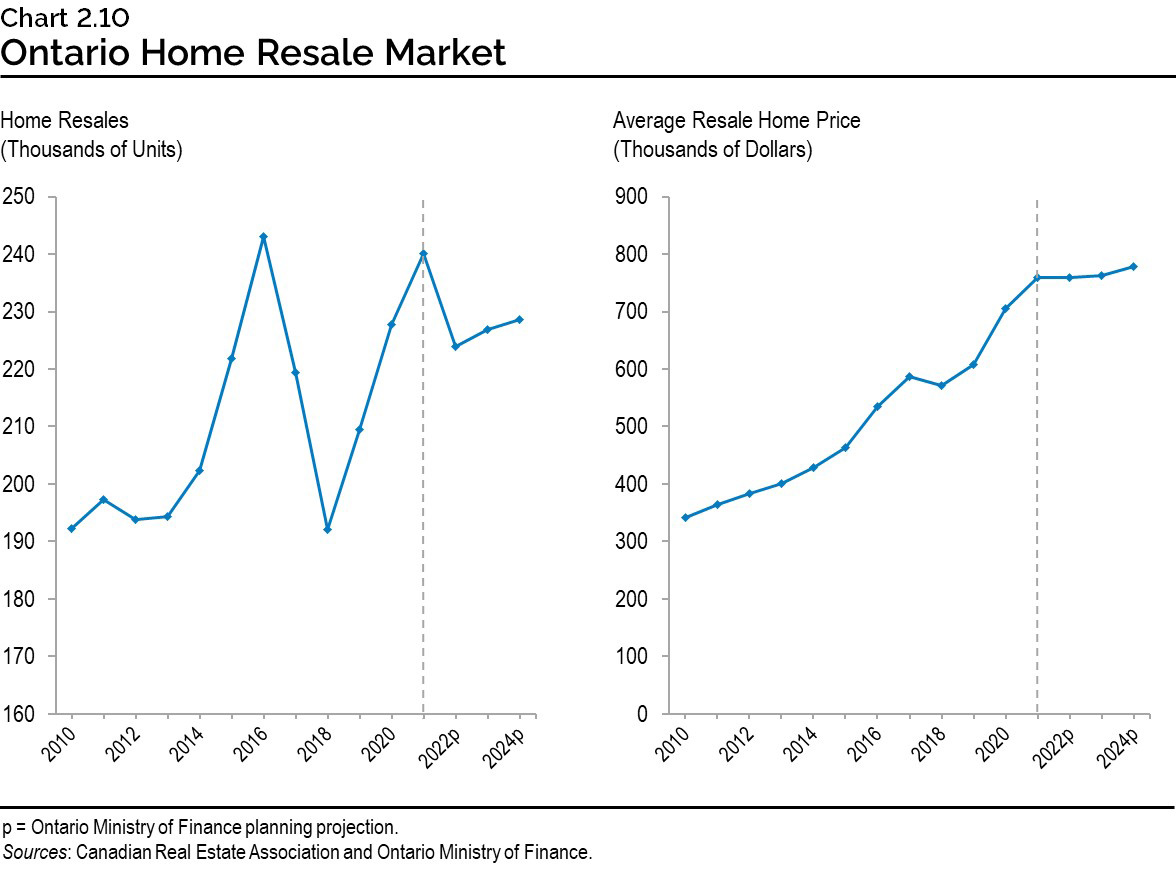
Demand for housing has been strong during the COVID‑19 pandemic, supported by low interest rates and higher overall disposable incomes. Strong home resale activity and price gains have been broad-based across many regions of Ontario. Home resales rose 8.7 per cent to almost 228,000 units in 2020, representing the second-highest volume of sales on record. The average Ontario resale home price rose 16.0 per cent to around $705,000.
The strong housing momentum is expected to continue, with home resales projected to rise 5.5 per cent in 2021 and the average home resale price to increase 7.5 per cent. Housing activity is expected to moderate between 2022 and 2024 to levels consistent with fundamental drivers of housing demand, such as population growth.
Risks to the Outlook
Uncertainty remains heightened for the global economy and international financial markets. The evolution of the COVID‑19 pandemic continues to represent the main risk for the Ontario economy.
Widespread vaccination presents an opportunity to lift business and consumer confidence and support a return to more normal economic activity. However, risks remain due to new variants of the virus and uncertainty related to the future path of the COVID‑19 pandemic.
The American Rescue Plan, which provides up to $1.9 trillion US in fiscal support, is an upside to the economy in the United States that could boost Ontario’s exports, leading to stronger economic growth.
Longer-term bond yields have risen more quickly than expected early in 2021, reflecting an improving economic outlook and rising inflation expectations. The Bank of Canada projects Consumer Price Index (CPI) inflation will temporarily exceed two per cent in the second quarter of 2021, driven by a rise in gasoline prices. If sustained faster CPI growth occurs, higher interest rates could dampen economic activity.
Housing prices and resales rebounded sharply in the second half of 2020, driven by low interest rates, shifting housing preferences and higher overall household savings. A larger-than-forecast moderation in housing market activity could adversely impact the economic outlook.
Major economic downturns in Ontario have historically been followed by a period of relatively strong and sustained growth. Historical experience suggests that average annual real GDP growth eventually resumes at or close to its pre-recession pace, as was the case following the recessions in Ontario in the early 1990s and 2008–09.
Table 2.5 displays current estimates of the impact of sustained changes in key external factors on Ontario’s real GDP, assuming other external factors are unchanged. The relatively wide range of estimated impacts reflects the uncertainty regarding how the economy could respond to these changes in external conditions.
| Change in Real GDP Growth First Year |
Change in Real GDP Growth Second Year |
|
|---|---|---|
| Canadian Dollar Depreciates by Five Cents US | +0.1 to +0.7 | +0.2 to +0.8 |
| Crude Oil Prices Decrease by $10 US per Barrel | +0.1 to +0.3 | +0.1 to +0.3 |
| U.S. Real GDP Growth Increases by One Percentage Point | +0.2 to +0.6 | +0.3 to +0.7 |
| Canadian Interest Rates Increase by One Percentage Point | (0.1) to (0.5) | (0.2) to (0.6) |
Table 2.5 footnotes:
Source: Ontario Ministry of Finance.
Revisions to the Outlook since the 2020 Budget
Ontario’s real GDP growth is estimated to have declined 5.7 per cent in 2020, a smaller decline than the 6.5 per cent decline projected at the time of the 2020 Budget. The outlook over the 2021 to 2024 period has been revised compared to the projections in the 2020 Budget. Key changes since the 2020 Budget include:
- Slower real and nominal GDP growth in 2021, followed by stronger growth in 2022 and 2023; and
- Stronger housing activity in 2021, followed by slower resale activity in 2022 and 2023.
| 2020 — 2020 Budget |
2020 — 2021 Budget |
2021p — 2020 Budget |
2021p — 2021 Budget |
2022p — 2020 Budget |
2022p — 2021 Budget |
2023p — 2020 Budget |
2023p — 2021 Budget |
|
|---|---|---|---|---|---|---|---|---|
| Real Gross Domestic Product | (6.5) | (5.7) | 4.9 | 4.0 | 3.5 | 4.3 | 2.0 | 2.5 |
| Nominal Gross Domestic Product | (5.0) | (4.8) | 6.6 | 6.2 | 5.7 | 6.4 | 4.2 | 4.5 |
| Compensation of Employees | (2.5) | (1.8) | 5.3 | 4.2 | 5.1 | 5.0 | 4.6 | 4.8 |
| Net Operating Surplus — Corporations | (16.0) | (11.5) | 10.0 | 8.0 | 10.3 | 7.4 | 2.7 | 4.4 |
| Nominal Household Consumption | (6.0) | (5.8) | 7.4 | 5.9 | 6.0 | 7.2 | 4.2 | 4.9 |
| Other Economic Indicators — Employment | (5.4) | (4.8) | 5.0 | 4.2 | 2.5 | 3.0 | 1.9 | 2.2 |
| Other Economic Indicators — Job Creation (000s) | (401) | (355) | 353 | 298 | 183 | 222 | 144 | 168 |
| Other Economic Indicators — Unemployment Rate (Per Cent) | 9.5 | 9.6 | 7.7 | 8.2 | 6.8 | 6.9 | 6.3 | 6.5 |
| Other Economic Indicators — Consumer Price Index | 0.5 | 0.7 | 1.7 | 1.7 | 2.0 | 2.0 | 1.9 | 2.0 |
| Other Economic Indicators — Housing Starts (000s) | 75.0 | 81.3 | 73.0 | 80.2 | 75.0 | 79.3 | 77.0 | 80.2 |
| Other Economic Indicators — Home Resales | 0.0 | 8.7 | 5.0 | 5.5 | 3.0 | (6.7) | 2.0 | 1.3 |
| Other Economic Indicators — Home Resale Prices | 12.0 | 16.0 | 0.0 | 7.5 | 2.0 | 0.0 | 4.0 | 0.5 |
| Key External Variables — U.S. Real Gross Domestic Product | (4.0) | (3.5) | 3.9 | 4.9 | 2.9 | 3.8 | 2.3 | 2.3 |
| Key External Variables — WTI Crude Oil ($US per Barrel) | 40 | 39 | 47 | 47 | 52 | 52 | 56 | 56 |
| Key External Variables — Canadian Dollar (Cents US) | 74.2 | 74.6 | 75.3 | 78.5 | 75.4 | 78.5 | 76.0 | 79.2 |
| Key External Variables — Three-Month Treasury Bill Rate1 | 0.4 | 0.4 | 0.2 | 0.2 | 0.2 | 0.2 | 0.4 | 0.5 |
| Key External Variables — 10-Year Government Bond Rate2 | 0.7 | 0.7 | 0.8 | 1.0 | 1.3 | 1.4 | 1.7 | 1.8 |
Table 2.6 footnotes:
p = Ontario Ministry of Finance planning projection.
[1], [2] Government of Canada interest rates (per cent).
Sources: Statistics Canada; Canada Mortgage and Housing Corporation; Canadian Real Estate Association; Bank of Canada; United States Bureau of Economic Analysis; “Blue Chip Economic Indicators” (February 2021 and October 2020); U.S. Energy Information Administration; and Ontario Ministry of Finance.
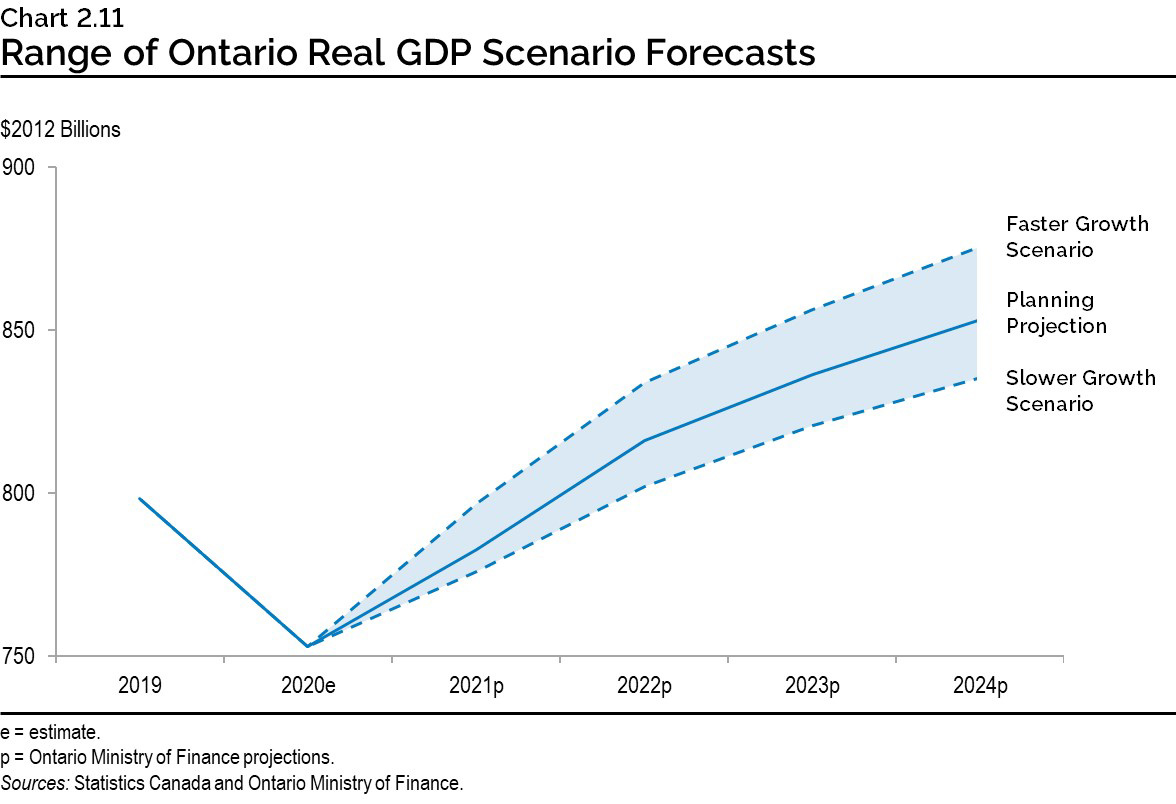
Economic Outlook Scenarios
Disruptions caused by the COVID‑19 pandemic and risks related to its future impact have led to a high degree of uncertainty surrounding the economic forecast for Ontario. While the planning assumptions for economic growth are reasonable and prudent based on available private-sector forecasts, there are a broad range of factors that could result in economic growth being relatively stronger or weaker.
In order to illustrate the high degree of economic uncertainty, the Ontario Ministry of Finance has developed Faster Growth and Slower Growth scenarios that the economy could take over the next several years. In the 2020 Budget, Ontario was one of the first governments in the country to provide economic scenarios in response to the uncertainty as a result of the COVID‑19 pandemic. These alternative scenarios should not be considered the best case or the worst case. Rather, they represent possible outcomes in this period of heightened uncertainty.
| 2021p | 2022p | 2023p | 2024p | |
|---|---|---|---|---|
| Faster Growth Scenario | 5.9 | 4.7 | 2.7 | 2.2 |
| Planning Projection | 4.0 | 4.3 | 2.5 | 2.0 |
| Slower Growth Scenario | 3.1 | 3.4 | 2.3 | 1.8 |
Table 2.7 footnotes:
p = Ontario Ministry of Finance planning projection and alternative scenarios.
Source: Ontario Ministry of Finance.
These economic scenarios indicate the broad range of risk related to future economic growth. In the planning projection, the level of real GDP surpasses its pre-pandemic level of the fourth quarter of 2019 by the first quarter of 2022. In the Faster Growth scenario, the pre-pandemic level of real GDP is reached by the third quarter of 2021, while in the Slower Growth scenario it is not reached until the third quarter of 2022. By the year 2024, the level of real GDP in the Faster Growth scenario is 2.6 per cent higher than the planning projection, while in the Slower Growth scenario the level of real GDP is 2.1 per cent lower.
Transparent Reporting on the Economy
The Fiscal Sustainability, Transparency and Accountability Act, 2019 (FSTAA) states that the quarterly Ontario Economic Accounts (OEA) shall be released within 45 days after the Statistics Canada release of the National Income and Expenditure Accounts. This deadline is included in the Premier and Minister’s Accountability Guarantee.
The OEA provides a comprehensive overall assessment of the performance of Ontario’s economy. Private-sector economists use this to assess the current state of the province’s economy and as a basis for updating their forecasts. The OEA informs the government’s economic and revenue forecasts, providing a key foundation for Ontario’s fiscal plan.
In compliance with the legislation, the quarterly OEA will be released according to the schedule outlined in Table 2.8.
| Reference Period | Expected Statistics Canada Release of National Income and Expenditure Accounts |
Corresponding Deadline for Release of Ontario Economic Accounts (Within 45 days of Statistics Canada Release) |
|---|---|---|
| Fourth Quarter (October-December) 2020 |
March 2, 2021 | By April 16, 2021 |
| First Quarter (January-March) 2021 |
June 1, 2021 | By July 16, 2021 |
| Second Quarter (April-June) 2021 |
August 31, 2021 | By October 15, 2021 |
| Third Quarter (July-September) 2021 |
November 30, 2021 | By January 14, 2022 |
| Fourth Quarter (October-December) 2021 |
March 1, 2022 | By April 14, 2022 |
Table 2.8 footnotes:
Sources: Statistics Canada and Ontario Ministry of Finance.
Footnotes
[1] The three experts are from the Policy and Economic Analysis Program at the University of Toronto; Quantitative Economic Decisions, Inc.; and Stokes Economic Consulting, Inc.
Chart Descriptions
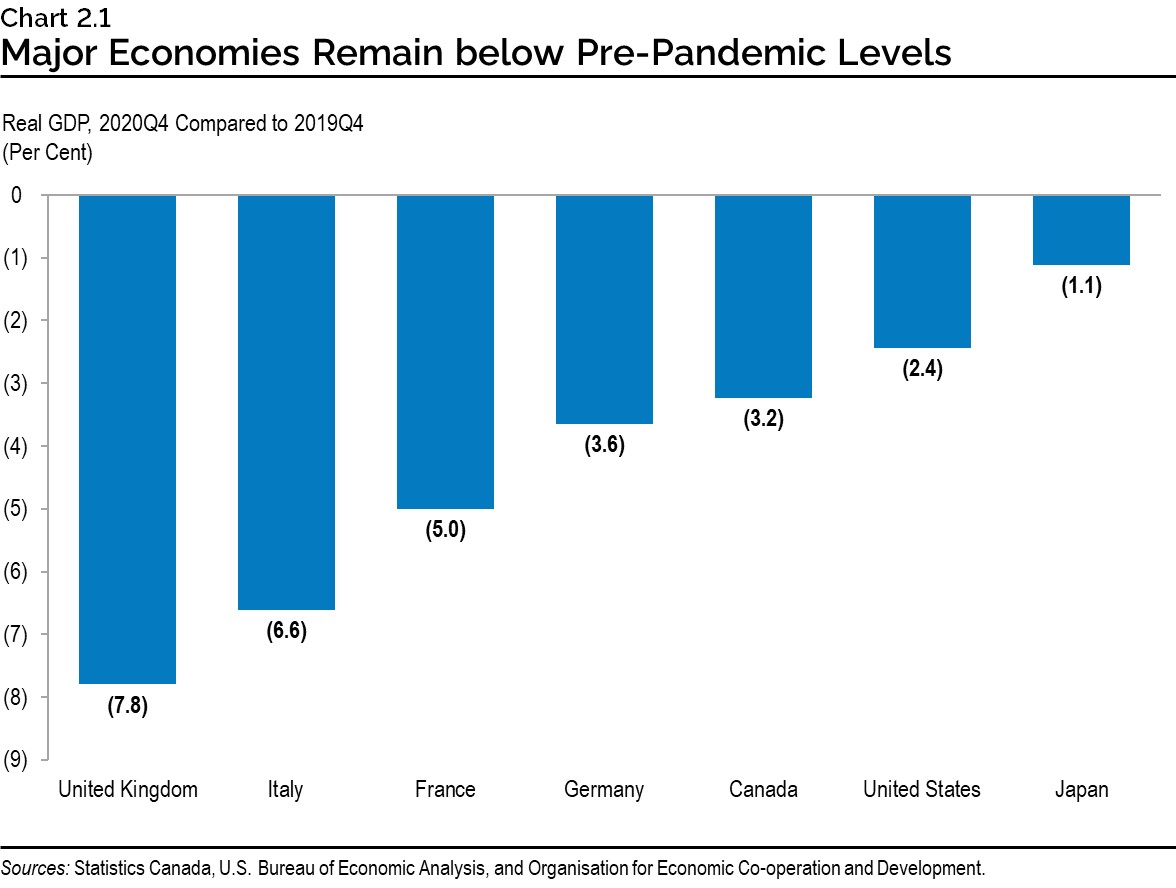
Chart 2.1: Major Economies Remain below Pre-Pandemic Levels
This bar chart illustrates the per cent change in real gross domestic product between the fourth quarter of 2019 and the fourth quarter of 2020 for select global jurisdictions. Real gross domestic product declines in the period are as follows: -7.8 per cent in the United Kingdom; -6.6 per cent in Italy; -5.0 per cent in France; -3.6 per cent in Germany; -3.2 per cent in Canada; -2.4 per cent in the United States and -1.1 per cent in Japan.
Sources: Statistics Canada; U.S. Bureau of Economic Analysis; Organisation for Economic Co-operation and Development.
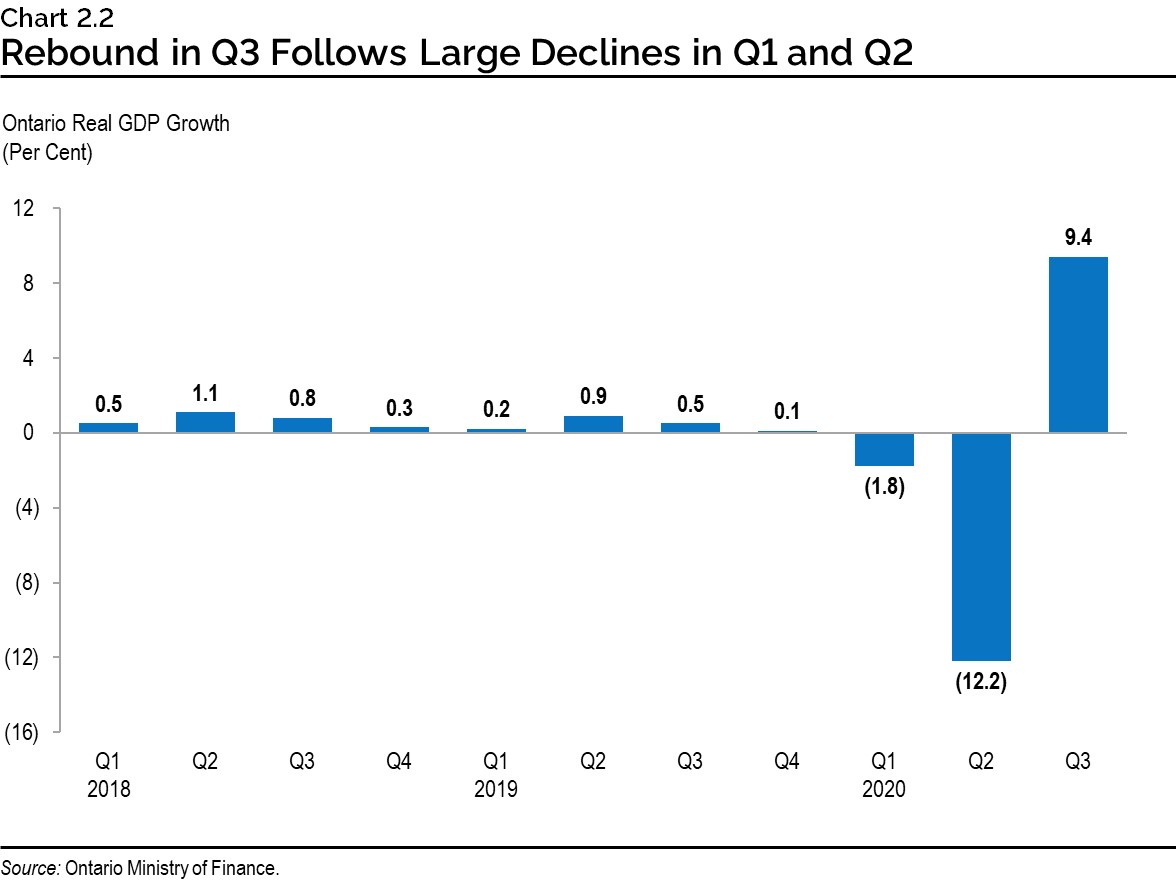
Chart 2.2: Rebound in Q3 Follows Large Declines in Q1 and Q2
This bar chart illustrates the quarterly real gross domestic product growth in Ontario from the first quarter of 2018 to the third quarter of 2020. Real gross domestic product growth is as follows: 0.5 per cent in 2018Q1; 1.1 per cent in 2018Q2; 0.8 per cent in 2018Q3; 0.3 per cent in 2018Q4; 0.2 per cent in 2019Q1; 0.9 per cent in 2019Q2; 0.5 per cent in 2019Q3; 0.1 per cent in 2019Q4; -1.8 per cent in 2020Q1; -12.2 per cent in 2020Q2; 9.4 per cent in 2020Q3.
Source: Ontario Ministry of Finance.
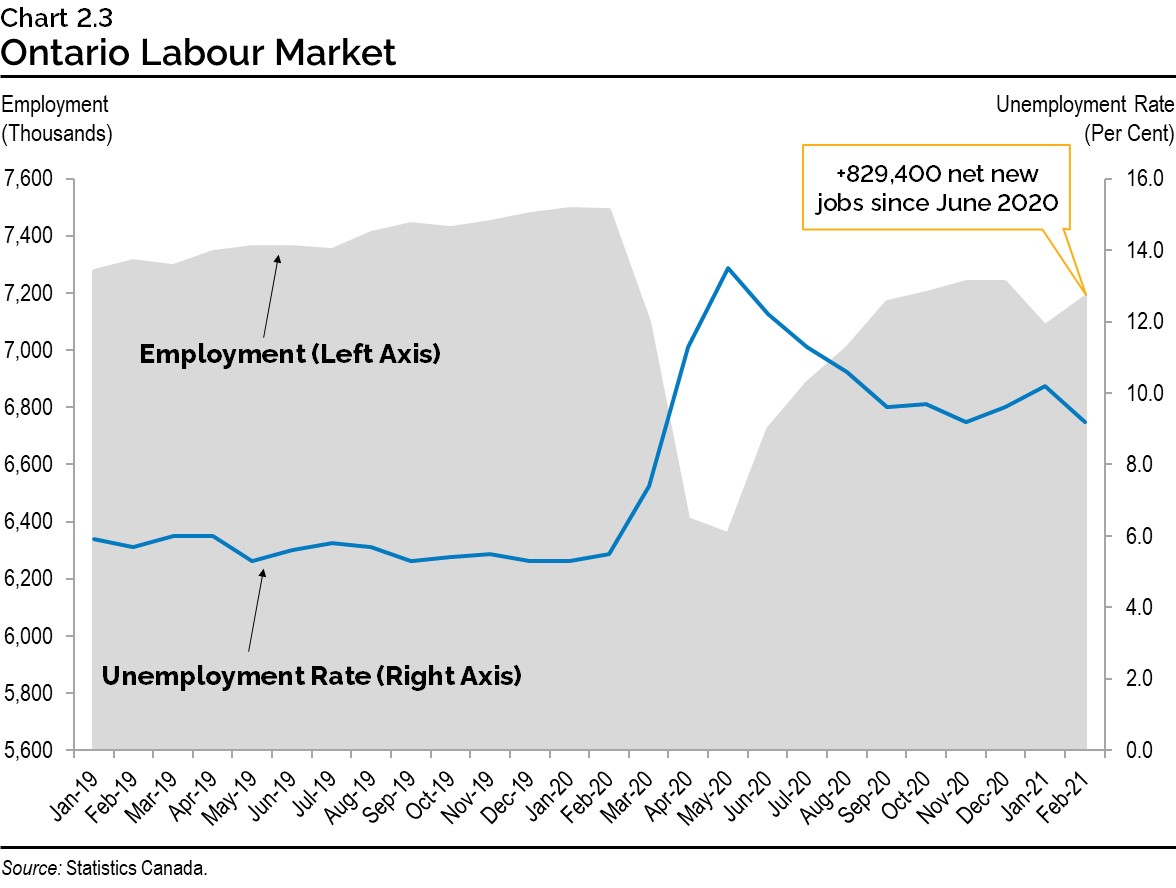
Chart 2.3: Ontario Labour Market
The chart shows Ontario’s monthly employment level as a shaded area and unemployment rate as a line from January 2019 to February 2021. The unemployment rate trended down from 5.9 per cent in early 2019 to 5.5 per cent in February 2020. It increased to 13.5 per cent in May 2020 and has since trended down to 9.2 per cent in November 2020, before increasing to 10.2 per cent in January 2021 and declining to 9.2 per cent in February 2021. Employment has increased steadily over the period, from about 7.3 million in January 2019 to about 7.5 million in February 2020; it then declined to 6.4 million in May 2020. In December 2020, employment increased to 7.2 million before declining to 7.1 million in January 2021 and increasing to 7.2 million in February 2021. There is a call out box that states +829,400 net new jobs since June 2020.
Source: Statistics Canada.
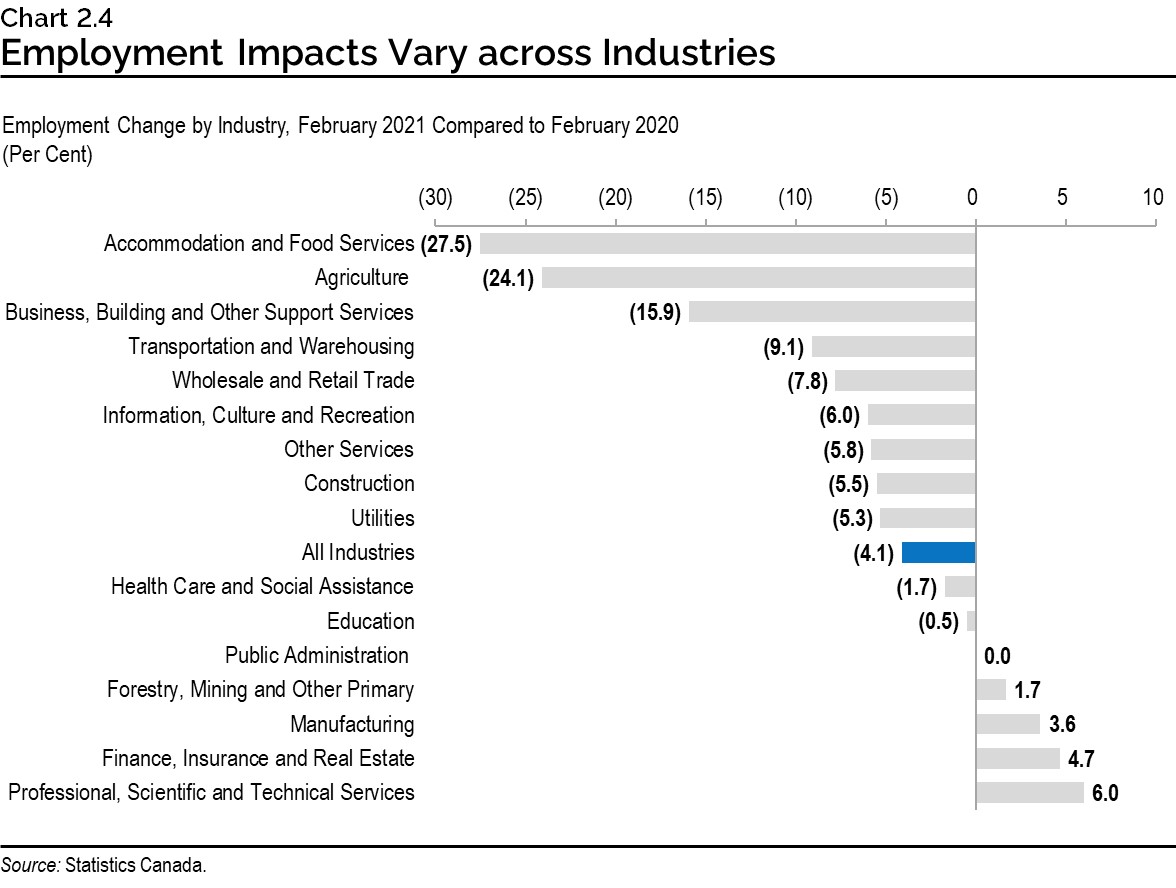
Chart 2.4: Employment Impacts Vary across Industries
This horizontal bar chart shows the per cent change in employment by industry between February 2020 and February 2021. The change in employment by industry during the period is as follows: -27.5 per cent in accommodation and food services; -24.1 per cent in agriculture; -15.9 per cent in business, building and other support services; -9.1 per cent in transportation and warehousing; -7.8 per cent in wholesale and retail trade; -6.0 per cent in information, culture and recreation; -5.8 per cent in other services; -5.5 per cent in construction; -5.3 per cent in utilities; -4.1 per cent in all industries; -1.7 per cent in health care and social assistance; -0.5 per cent in education; 0.0 per cent in public administration; +1.7 per cent in forestry, mining and other primary industries; +3.6 per cent in manufacturing; +4.7 per cent in finance, insurance and real estate and +6.0 per cent in professional, scientific and technical services.
Source: Statistics Canada.
Chart 2.5: Uneven Impact on the Labour Market
The bar chart illustrates the breakdown in the per cent change in employment between February 2020 and February 2021. Changes during the period were as follows: total employment, a decline of 4.1 per cent; full-time, a decline of 2.2 per cent; part-time, a decline of 12.5 per cent; male, a decline of 3.3 per cent; female, a decline of 4.9 per cent; individuals aged 15 to 24, a decline of 14.3 per cent; individuals aged 25 to 54, a decline of 2.4 per cent and individuals aged 55 and over, a decline of 2.8 per cent.
Source: Statistics Canada.
Chart 2.6: Higher Household Net Savings
This chart shows Ontario’s household disposable income and household spending as lines and household net savings as bars from the first quarter of 2019 to the third quarter of 2020 in billions of dollars. Household spending increased from the first quarter of 2019 to the fourth quarter of 2019 before declining in the following two quarters of 2020 and rebounding in the third quarter. Household disposable income increased steadily between the first quarter of 2019 and the first quarter of 2020, before experiencing a sharp increase in the second quarter of 2020 and declining in the third quarter of 2020. Household net savings increased between the first and fourth quarter of 2019 and remained negative before experiencing a sharp increase in the first and second quarter of 2020 to a positive net savings, before declining in the third quarter, but remaining positive.
Source: Ontario Ministry of Finance.
Chart 2.7: Rebound in Key Economic Indicators
This chart illustrates the per cent change in key economic indicators between the latest data point and February 2020 as bars and the decline to the 2020 low as markers. Changes from February 2020 are as follows: manufacturing sales 2020 low -46.2 per cent in April 2020 and latest is -4.6 per cent in December 2020; retail sales 2020 low -36.8 per cent in April 2020 and latest is -3.6 per cent in December 2020; merchandise exports (Ontario Ministry of Finance Estimates) 2020 low -40.8 per cent in April 2020 and latest is -3.1 per cent in December 2020; wholesale trade 2020 low -32.5 per cent in April 2020 and latest is +1.0 per cent in December 2020.
Note: The latest data point is December 2020 for all these indicators. The low point in 2020 was April for all these indicators.
Sources: Statistics Canada and Ontario Ministry of Finance.
Chart 2.8: High Range of Private-Sector Forecast Uncertainty
This bar chart shows the difference between the highest and lowest private-sector forecast for Ontario real GDP growth. The first-year forecast difference for the 2004 to 2019 Budget average is 1.0 percentage point compared to 2.0 percentage points for the 2021 Budget. The second-year forecast difference for the 2004 to 2019 Budget average is 1.3 percentage points compared to 1.9 percentage points for the 2021 Budget.
Sources: Ontario Budgets and Ontario Ministry of Finance Survey of Forecasters.
Chart 2.9: Employment Projected to Recover
This chart shows the employment represented by the bars and the unemployment rate represented by the line from 2018 to 2020 and projections from 2021 to 2024. Employment in Ontario was 7.173 million in 2018 and increased to 7.377 million in 2019 before decreasing to 7.022 million in 2020. In the 2021 Budget, the employment in Ontario is projected to be 7.319 million in 2021, 7.541 million in 2022, 7.710 million in 2023 and 7.833 million in 2024.
The unemployment rate in Ontario was 5.7 per cent in 2018 and 5.6 per cent in 2019 and increased to 9.6 per cent in 2020. In the 2021 Budget, the unemployment rate is projected to be 8.2 per cent in 2021, 6.9 per cent in 2022, 6.5 per cent in 2023 and 6.3 per cent in 2024.
Sources: Statistics Canada and Ontario Ministry of Finance.
Chart 2.10: Ontario Home Resale Market
The first line chart on the left shows home resales units in Ontario from 2010 to 2020 and projections from 2021 to 2024. In 2010, Ontario home resales were 192,000 units and trended upward, peaking in 2016 at 243,000 units. Home resales then declined to 192,000 in 2018 before rising to 228,000 units in 2020. In the 2021 Budget, home resales are projected to be 240,000 units in 2021, 224,000 units in 2022, 227,000 units in 2023 and 229,000 units in 2024.
The second line chart on the right shows the average resale home price in Ontario from 2010 to 2020 and projected price from 2021 to 2024. In 2010 the average resale home price was $341,000 and trended upwards, reaching $705,000 in 2020. In the 2021 Budget, the average home resale prices are projected to be $759,000 in 2021, $758,000 in 2022, $762,000 in 2023 and $778,000 in 2024.
Sources: Canadian Real Estate Association and Ontario Ministry of Finance.
Chart 2.11: Range of Ontario Real GDP Scenario Forecasts
The line chart shows the levels of real GDP in billions of 2012 dollars consistent with the Planning Projection, as well as the Faster Growth and Slower Growth scenarios for 2019, as well as an estimate for 2020 and projections for 2021 through 2024.
The 2019 value of $798.2 billion and 2020 estimate of $752.8 billion are the same for all three scenarios. The real GDP values in billions for the Slower Growth, Planning Projection and Faster Growth scenarios in order are: for 2021, 775.8, 782.8 and 796.9; for 2022, 802.1, 816.3 and 834.0; for 2023, 820.8, 836.5 and 856.5; and, for 2024, 835.5, 853.4 and 875.6.
Sources: Statistics Canada and Ontario Ministry of Finance.