Introduction
The Province conducts its borrowing program responsibly and prudently to manage interest on debt (IOD) costs.
Ontario’s forecast total borrowing requirement in 2021–22 has decreased by $16.7 billion compared with the forecast from the 2021 Budget due to lower funding requirements as a result of lower-than-projected deficits. The long-term and short-term borrowing program forecasts have been reduced by $12.7 billion and $4.0 billion, respectively, despite the plan to pre-borrow $6.0 billion for 2022–23. To date, $28.8 billion, or 69 per cent, of this year’s $42.0 billion current long-term borrowing requirement has been completed.
Ontario’s net debt-to-GDP ratio is now forecast to be 43.4 per cent in 2021–22, compared with the forecast of 48.8 per cent in the 2021 Budget.
The Province is forecast to pay $13.0 billion in interest costs in 2021–22, down from the 2021 Budget forecast of $13.1 billion.
Ontario’s 2021–22 interest on debt-to-revenue is forecasted to be 7.7 per cent, a decrease of 0.8 percentage points from the 2021 Budget forecast of 8.5 per cent, demonstrating the continued relative affordability of Ontario’s debt.
Borrowing Program
Ontario’s long-term borrowing requirement for 2021–22 is forecast to be $42.0 billion, $12.7 billion less than the 2021 Budget forecast. This is primarily due to a lower deficit forecast for 2021–22, combined with higher cash levels this fiscal year from the lower-than-planned deficit in 2020–21.
As a result of the deficit reported in the Public Accounts of Ontario 2020–2021, the government was left with cash reserves that were $10.1 billion higher compared to the projection in the 2021 Budget. This, combined with $0.8 billion in borrowing completed between the release of the 2021 Budget and the end of the fiscal year, increased the reported pre-borrowing in 2020–21 noted in Table 4.1 by $10.9 billion, and reduced 2021–22 borrowing requirements by an equivalent amount.
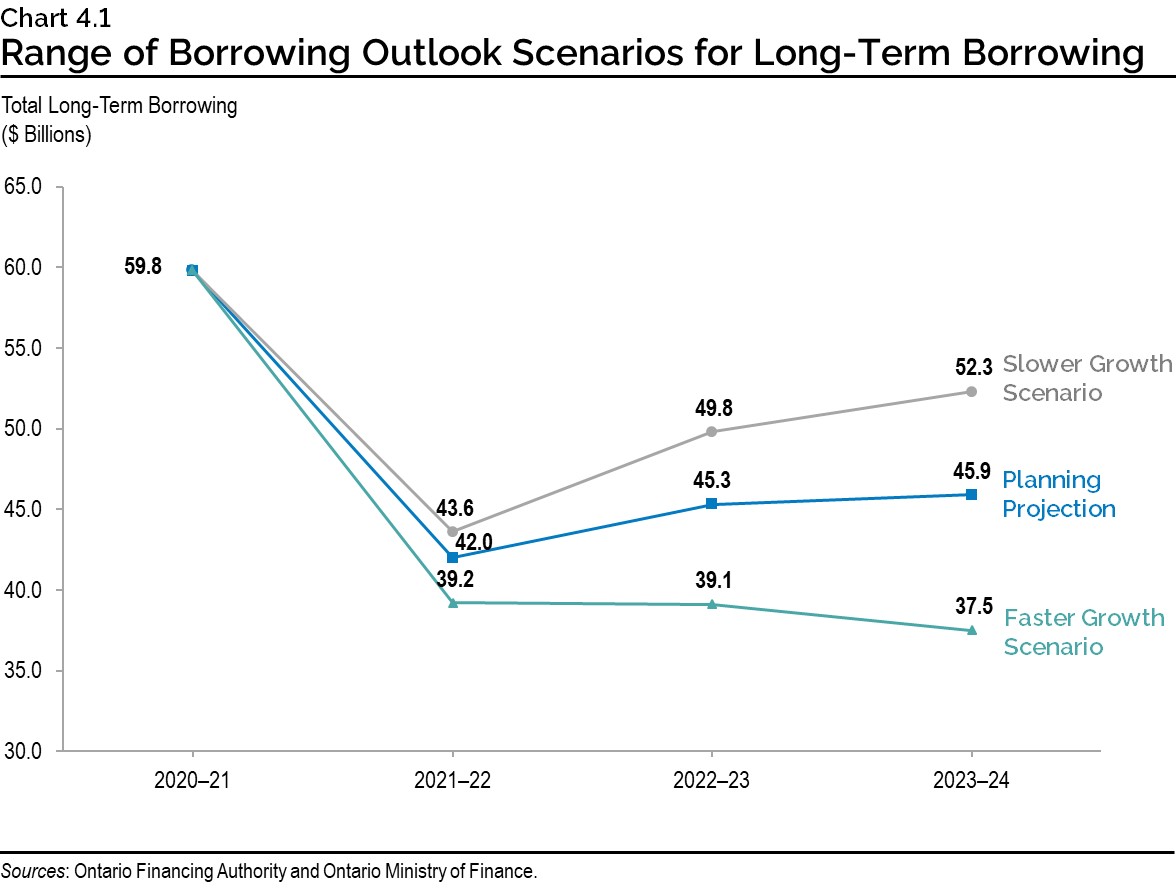
The total long-term borrowing requirements for 2022–23 and 2023–24 are forecast to be $45.3 billion and $45.9 billion, respectively, lower by $13.8 billion and $9.3 billion compared to the 2021 Budget forecast for those fiscal years.
Over the three-year outlook period, total long-term borrowing is now forecast to be $35.8 billion lower than forecast in the 2021 Budget. Furthermore, the short-term borrowing program is forecast to be $4.0 billion lower in 2021–22, reducing the Province’s overall borrowing needs by $39.8 billion over the outlook period compared to the 2021 Budget forecast.
| 2021 Budget | In-Year Change | Current Outlook 2021–22 |
Medium-Term Outlook 2022–23 |
Medium-Term Outlook 2023–24 |
|
|---|---|---|---|---|---|
| Deficit/(Surplus) | 33.1 | (11.6) | 21.5 | 19.6 | 12.9 |
| Investment in Capital Assets | 11.8 | 0.1 | 11.9 | 12.7 | 12.2 |
| Non-Cash Adjustments | (9.5) | – | (9.5) | (9.5) | (9.5) |
| Loans to Infrastructure Ontario | 0.2 | (0.0) | 0.2 | (0.1) | (0.0) |
| Other Net Loans/Investments | 1.3 | (0.3) | 1.0 | 0.3 | (1.0) |
| Debt Maturities/Redemptions | 25.0 | (0.0) | 25.0 | 30.5 | 31.2 |
| Total Funding Requirement | 61.9 | (11.8) | 50.1 | 53.3 | 45.9 |
| Decrease/(Increase) in Short-Term Borrowing | (6.0) | 4.0 | (2.0) | (2.0) | – |
| Increase/(Decrease) in Cash and Cash Equivalents | 4.0 | – | 4.0 | – | – |
| Pre-borrowing in 2020–21 for 2021–22 | (5.2) | (10.9) | (16.2) | – | – |
| Pre-borrowing for 2022–23 | – | 6.0 | 6.0 | (6.0) | – |
| Total Long-Term Public Borrowing | 54.7 | (12.7) | 42.0 | 45.3 | 45.9 |
Table 4.1 footnotes:
Note: Numbers may not add due to rounding.
Source: Ontario Financing Authority.
As of October 19, 2021, $28.8 billion, or 69 per cent, of this year’s long-term public borrowing was completed. The Province expects to complete its 2021–22 long-term public borrowing program before the end of the fiscal year, and subject to favourable market conditions, currently plans to pre-borrow $6.0 billion for 2022–23.
In the event that alternative economic scenarios materialize, the Province’s borrowing requirements in the next three years would also change. See Ontario’s Economic and Fiscal Outlook in Brief for more details and a description of the resulting alternative medium-term outlook scenarios. Under the Faster Growth scenario, long-term borrowing would decrease by a total of $17.4 billion over the three-year outlook period, while under the Slower Growth scenario, long-term borrowing would increase by $12.5 billion over the same period.
Approximately 76 per cent of 2021–22 borrowing has been completed in Canadian dollars through 25 syndicated issues and a Green Bond. Ontario’s target range for domestic borrowing remains unchanged at 65 to 80 per cent of borrowing completed for the 2021–22 fiscal year. This range will be further adjusted, if necessary, in response to evolving investor demand in the Canadian dollar and foreign currency debt markets.
Foreign currency borrowing helps reduce Ontario’s overall borrowing costs by continuing to diversify Ontario’s investor base. This diversification ensures the government will continue to have access to capital even if domestic market conditions become challenging. Approximately $6.9 billion, or 24 per cent of this year’s long-term borrowing to date, has been completed in foreign currencies, primarily in U.S. dollars and euros.
Green Bond Program
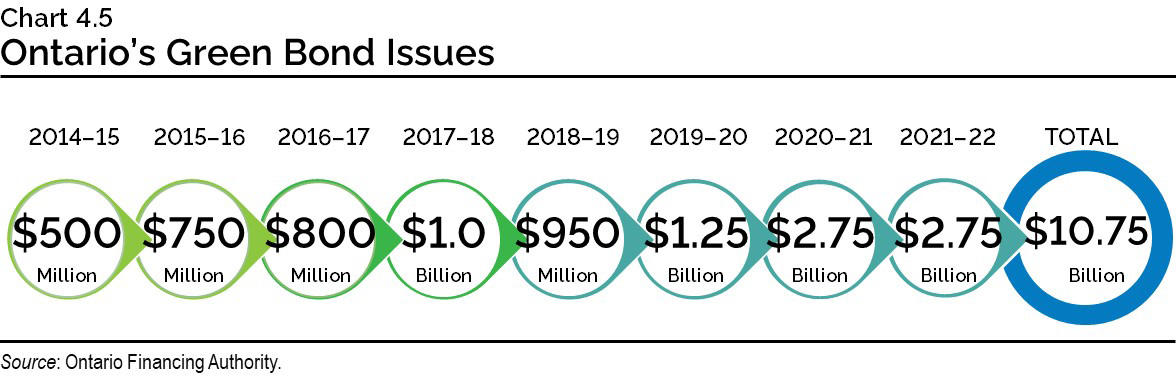
Green Bonds remain a core component of Ontario’s borrowing program and are an important tool to help finance public transit initiatives, extreme weather-resistant infrastructure, as well as energy efficiency and conservation projects. Ontario remains the largest issuer of Canadian dollar Green Bonds, totalling $10.75 billion issued since 2014–15, with $10.25 billion outstanding.
In July 2021, Ontario launched its first Green Bond of fiscal 2021–22, and tenth Green Bond overall. This was a $2.75 billion issue and the largest Canadian dollar Green Bond issue ever launched. Eight projects were selected as eligible to receive funding from Ontario’s latest Green Bond, across the spectrum of clean transportation, energy efficiency and conservation, and climate adaptation and resilience framework categories. Subject to market conditions, Ontario plans to continue to issue multiple Green Bonds each fiscal year, including in 2021–22.
Cost of Debt
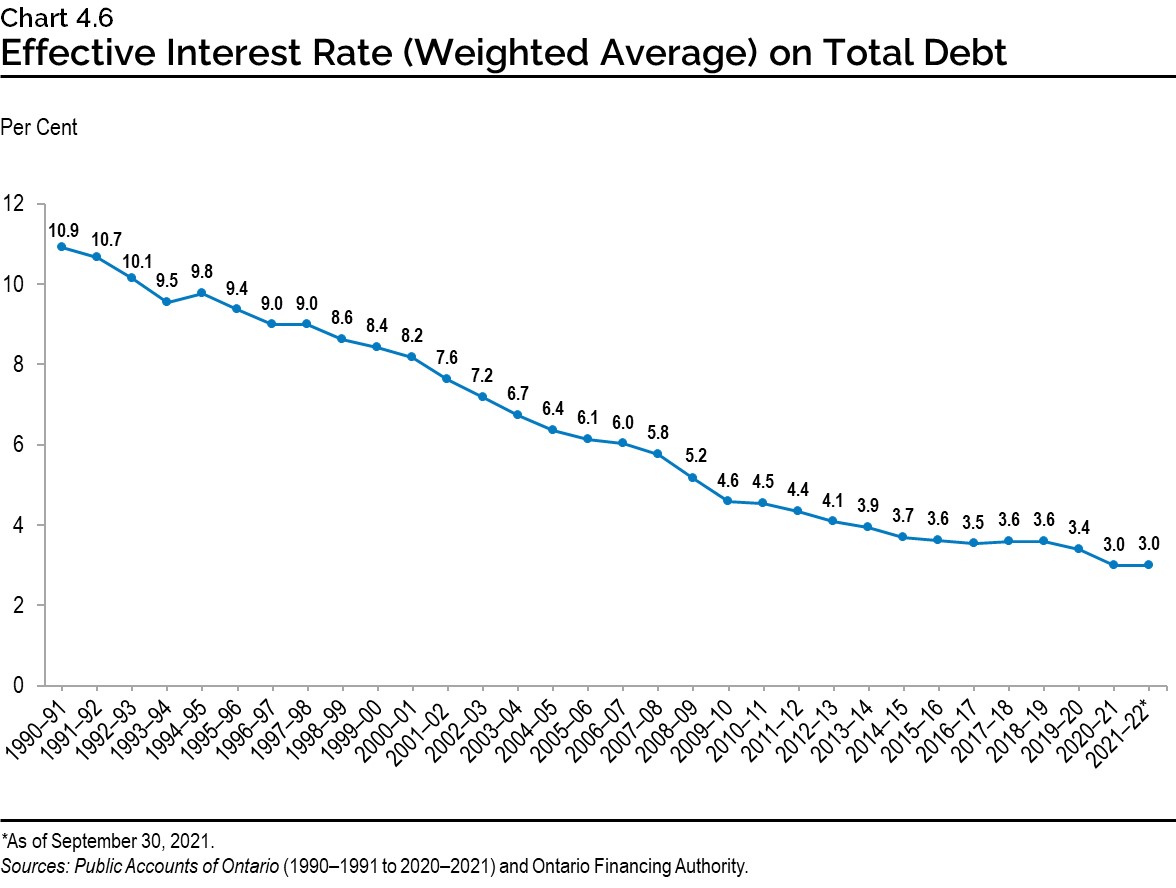
The three-decade decline in interest rates has meant interest on debt (IOD) has not risen as quickly as Ontario’s debt. Chart 4.6 shows the declining effective interest rate Ontario is paying on its total debt portfolio.
Ontario’s average cost of borrowing in 2021–22 is forecast to be 1.90 per cent, unchanged from the forecast in the 2021 Budget. A one percentage point change in interest rates either up or down from the current forecast is estimated to have a corresponding change in Ontario’s interest costs by approximately $0.7 billion in the first full year.
Chart 4.7 shows historic borrowing rates on debt issued and the forecast used to estimate the future cost of borrowing or IOD expense.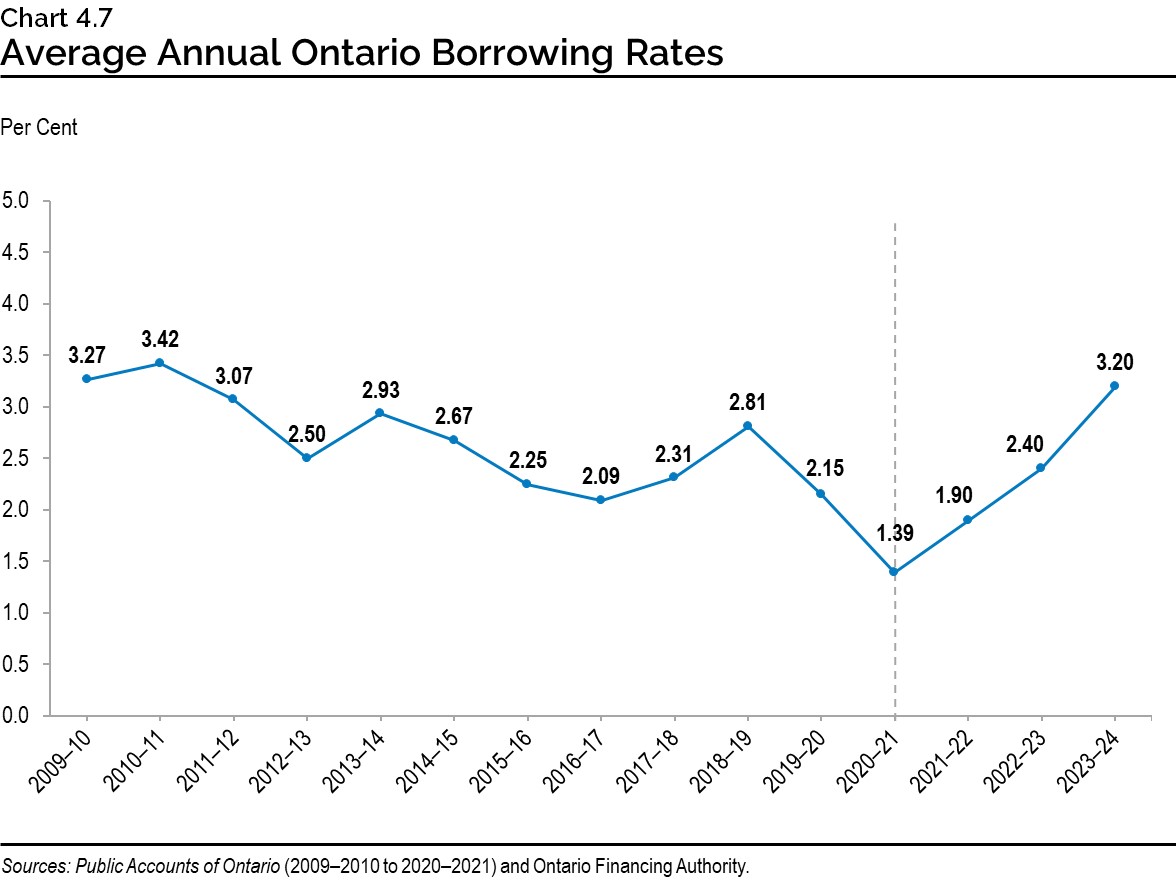
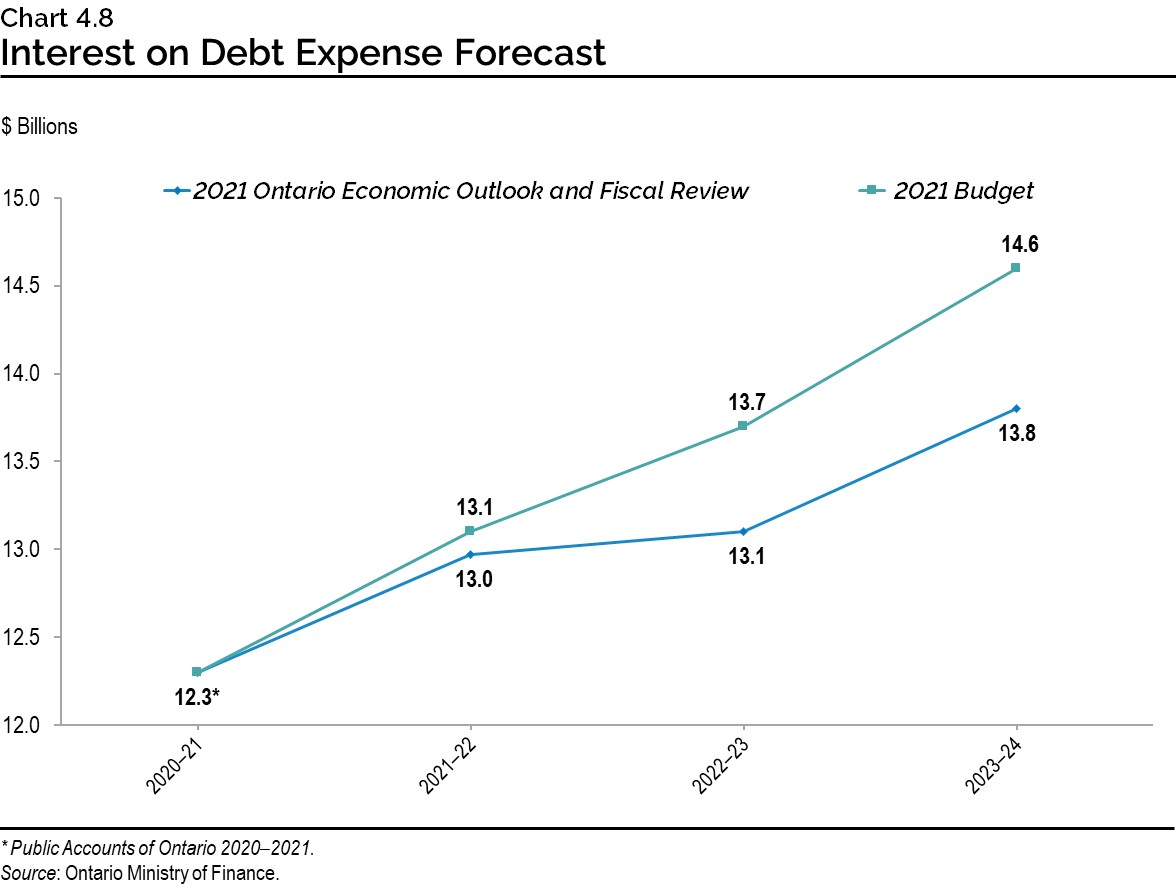
Lower than forecast deficits and borrowing requirements have reduced Ontario’s interest costs. The IOD forecast for 2021–22 is $13.0 billion, down from the 2021 Budget forecast of $13.1 billion. IOD in 2022–23 and 2023–24 is forecast to be $13.1 billion and $13.8 billion, respectively, lower than the forecast in the 2021 Budget by $0.5 billion and $0.8 billion. However, IOD remains Ontario’s fourth-largest expense after health care, education and social services.
Term of Debt
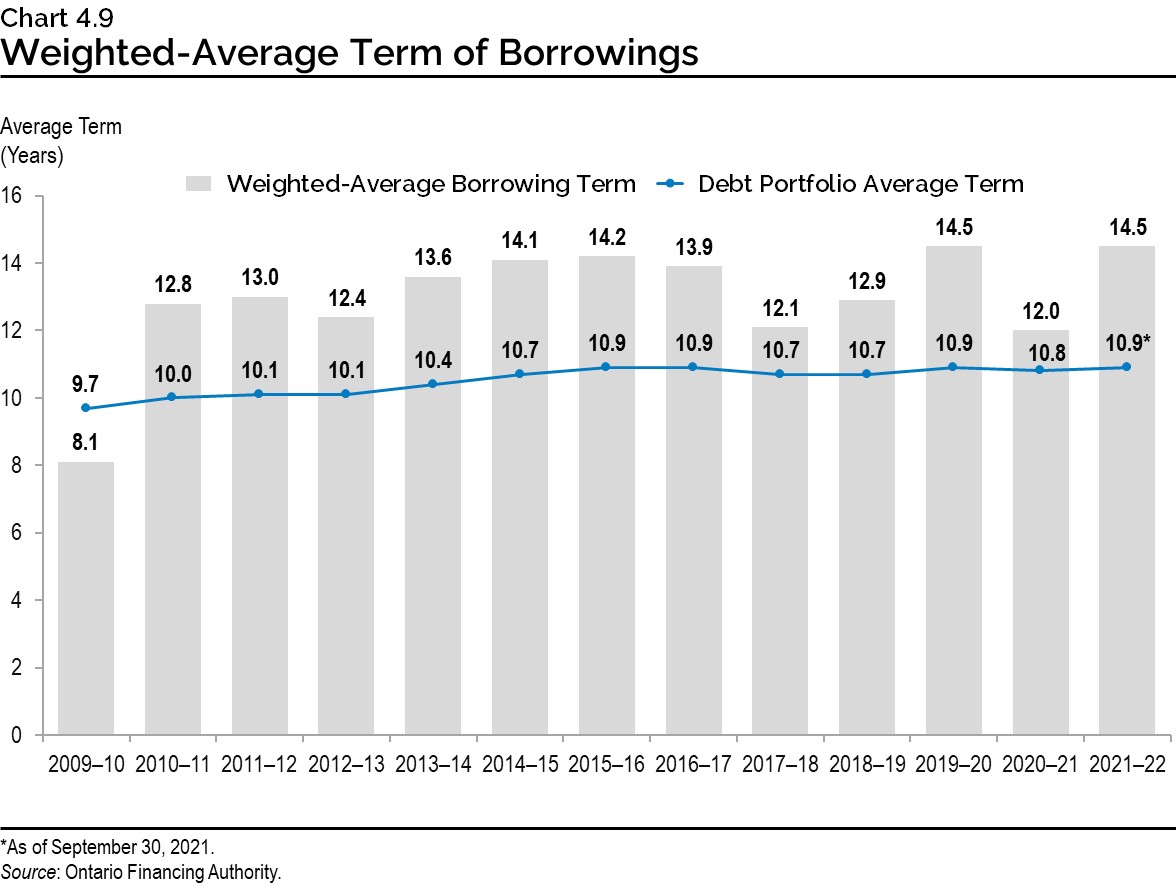
Ontario continues to extend the term of its debt, when investor demand allows, to reduce refinancing risk on maturing debt and capitalize on historically low interest rates. This also protects the IOD forecast, in the long term, against increases in interest rates from the current historically low levels. Ontario has issued $111.0 billion of bonds, or more than one-quarter of total debt, with maturities of 30 years or longer since 2010–11. This includes $7.5 billion so far in 2021–22.
As a result, the average term of Ontario’s debt portfolio, which now stands at 10.9 years, was extended by one year in 2014–15 from its 2009–10 level and has been held at that level since. With low interest rates and a large borrowing program, the current plan is to maintain the term of Ontario’s debt at these levels.
Ensuring Adequate Liquidity Levels
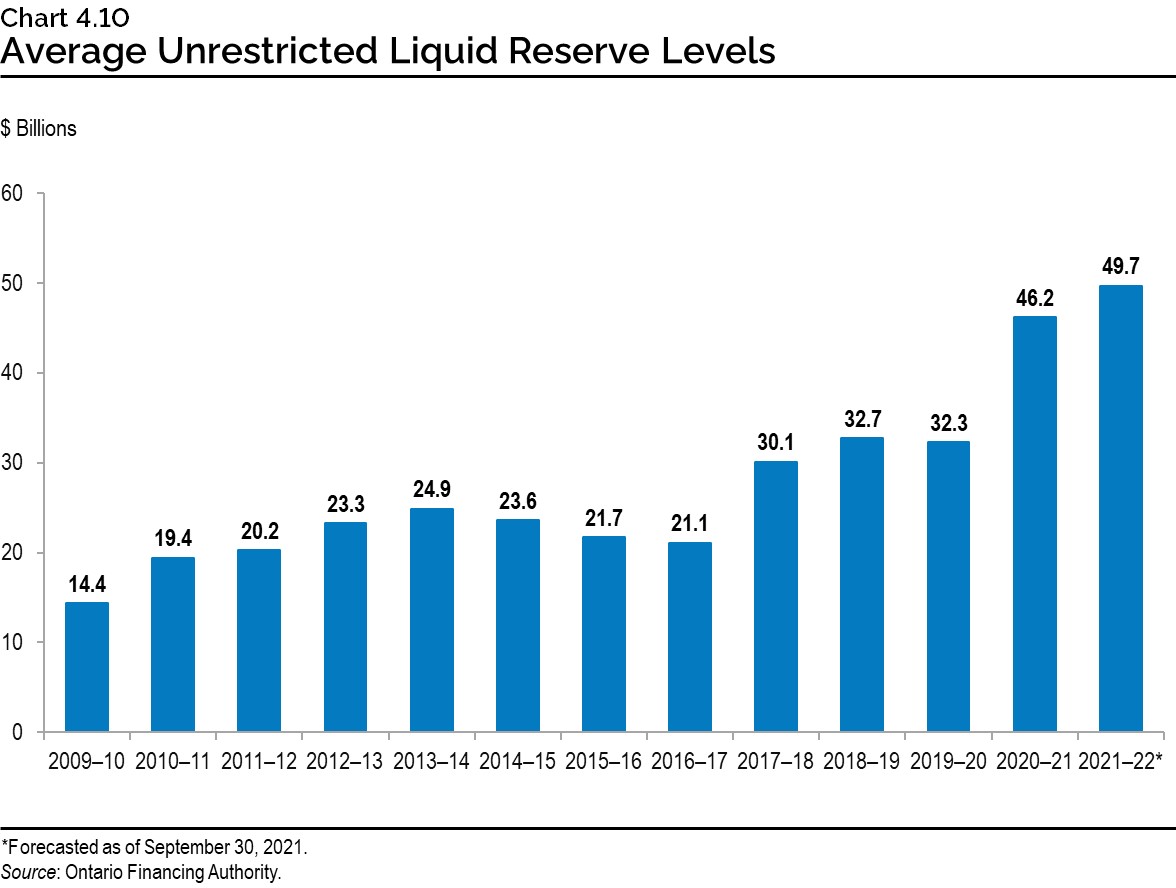
Ontario has built and retained cash reserves, as depicted in Chart 4.10. This liquidity is needed to meet requirements for large cash outflows on a single day, including when maturing benchmark bond issues in excess of $10 billion come due, and to allow the government to quickly respond to any unforeseen economic or public health circumstances.
Progress on the Debt Burden Reduction Strategy
In the 2021 Budget, the Province set out specific objectives for key ratios to measure debt sustainability, including a target for net debt-to-GDP over the medium-term outlook. The government remains committed to reducing the debt burden and putting Ontario’s finances back on a more sustainable path supported by GDP growth.
The specific objectives of Ontario’s debt burden reduction strategy reflected the high level of economic uncertainty as a result of the COVID‑19 pandemic at the time of the 2021 Budget. As continued uncertainty remains, the Province will evaluate these objectives and targets, making adjustments, if necessary, in the 2022 Budget.
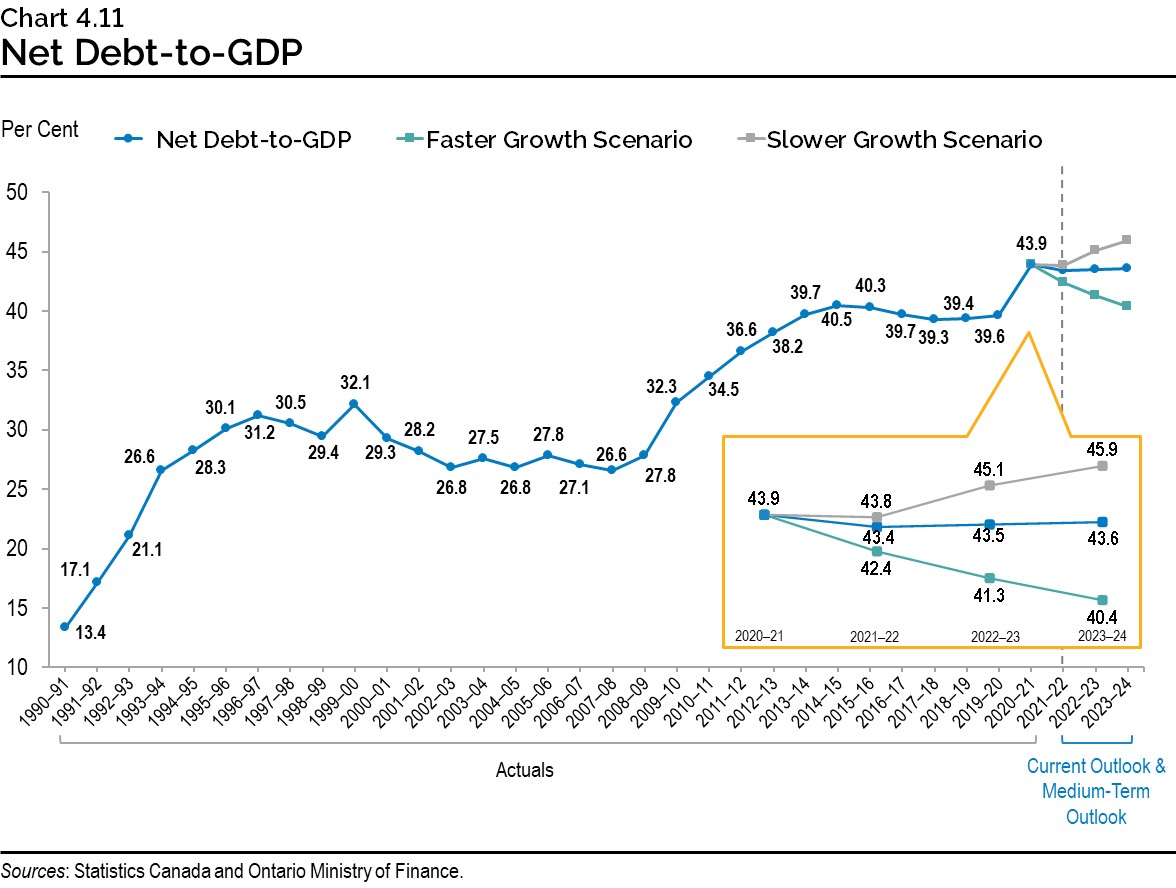
Ontario’s 2021–22 net debt-to-GDP ratio is now forecast to be 43.4 per cent, a decrease of 5.4 percentage points from the forecasted 48.8 per cent at the time of the 2021 Budget. This was due to lower than previously projected deficits and higher nominal GDP growth. Over the medium-term outlook, the net debt-to-GDP ratio is forecast to remain well below the 2021 Budget target of 50.5 per cent. Ontario’s net debt-to-GDP is now forecast to be 43.5 per cent in 2022–23, and 43.6 per cent in 2023–24, compared to the 2021 Budget forecasts of 49.6 per cent and 50.2 per cent, respectively.
As of the 2021 Budget, in addition to net debt-to-GDP, the government began reporting on net debt-to-revenue and interest on debt-to-revenue as part of the overall debt burden reduction strategy.
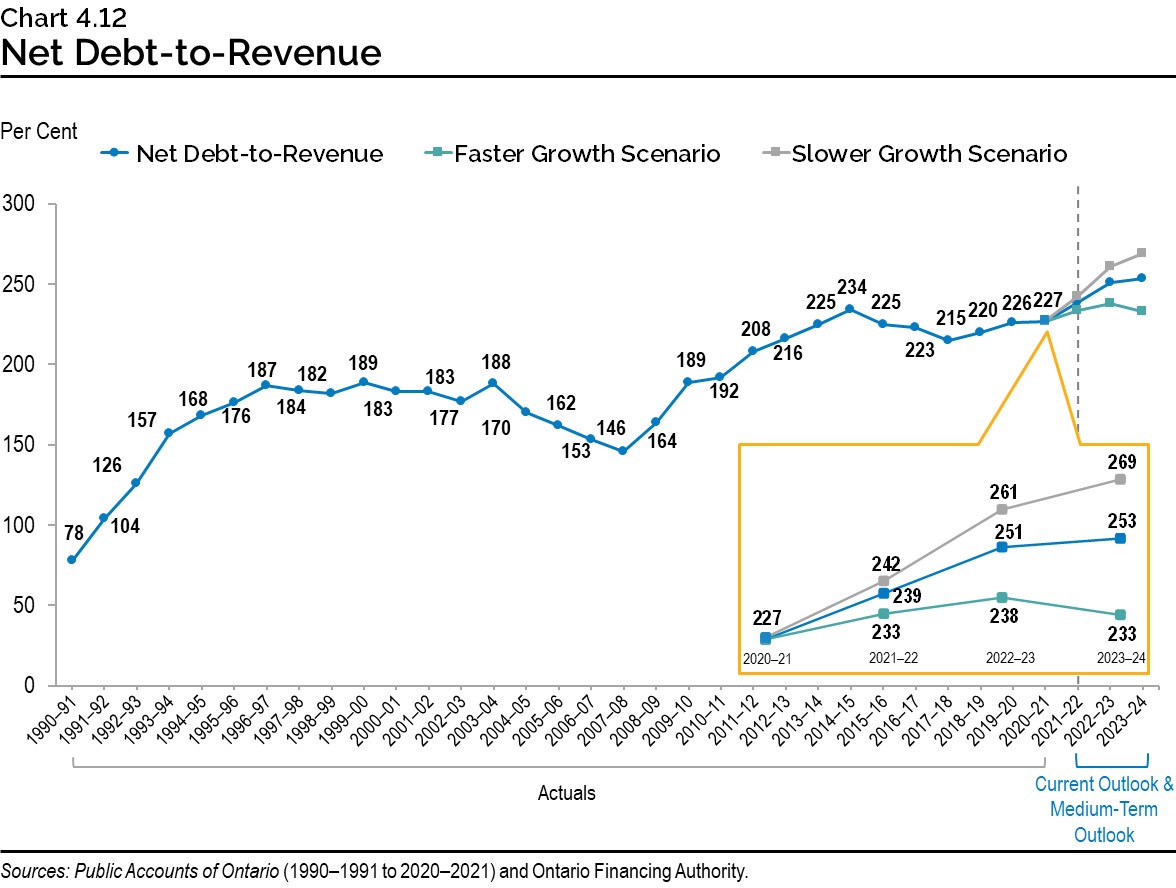
The net debt-to-revenue ratio is projected to be 239 per cent in 2021–22, 47 percentage points below the 286 per cent forecast in the 2021 Budget Over the medium-term outlook, this ratio is forecast to be 251 per cent in 2022–23 and 253 per cent in 2023–24, lower by 46 percentage points and 48 percentage points, respectively, compared to the forecast in the 2021 Budget.
The IOD-to-revenue ratio is forecast to be 7.7 per cent in 2021–22, 0.8 percentage points lower than the 2021 Budget forecast. Despite increases in deficits and borrowing requirements caused by the COVID‑19 pandemic, IOD-to-revenue over the medium term continues to remain lower than forecasted in the pre-pandemic 2019 Budget. It is also lower over the medium-term outlook when compared to the forecast in the 2021 Budget, demonstrating the continued relative affordability of Ontario’s debt. This ratio is forecast to remain below the peak reached following the global financial crisis in 2008–09 and lower than the levels in the early 1990s through to the mid-2000s.
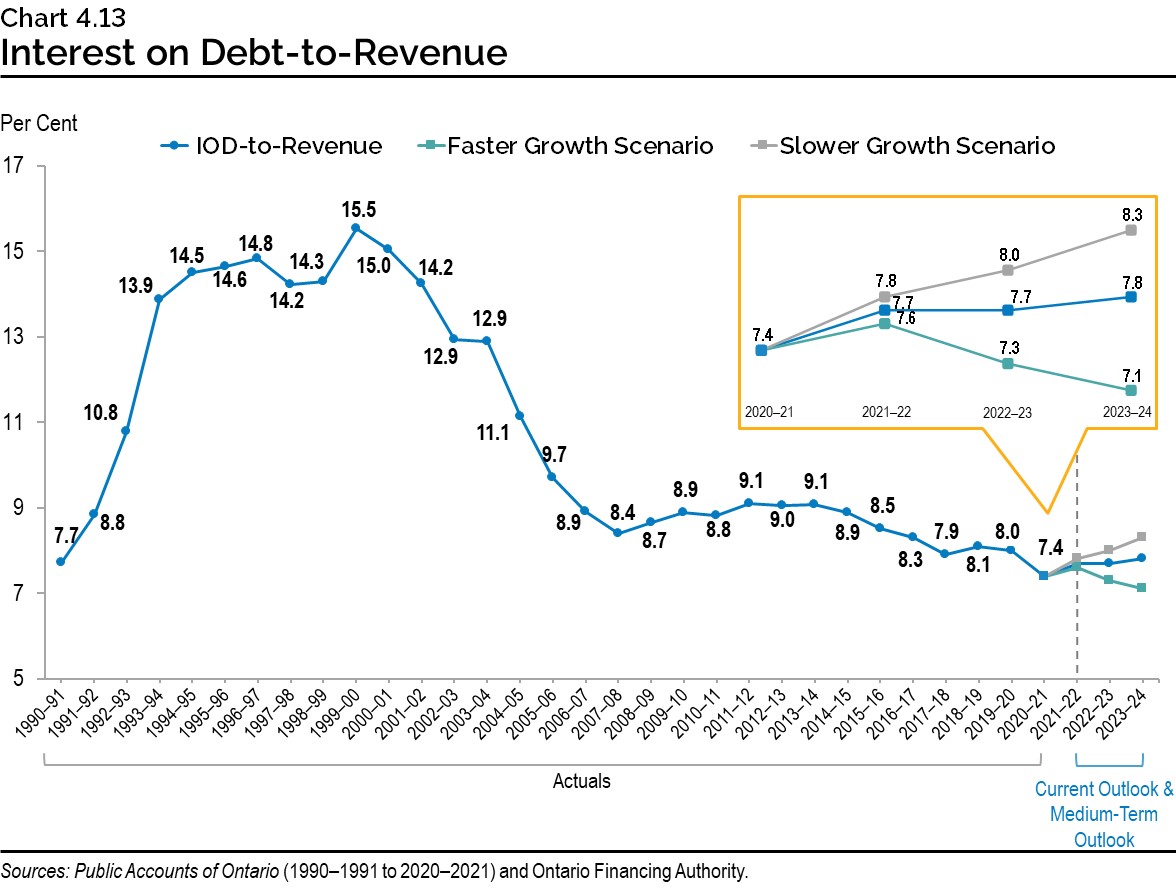
Chart Descriptions
Chart 4.1: Range of Borrowing Outlook Scenarios for Long-Term Borrowing
($ Billions)
| Year | 2020–21 | 2021–22 | 2022–23 | 2023–24 |
|---|---|---|---|---|
| Planning Projection | $59.8 | $42.0 | $45.3 | $45.9 |
| Slower Growth Scenario | $59.8 | $43.6 | $49.8 | $52.3 |
| Faster Growth Scenario | $59.8 | $39.2 | $39.1 | $37.5 |
Sources: Ontario Financing Authority and Ontario Ministry of Finance.
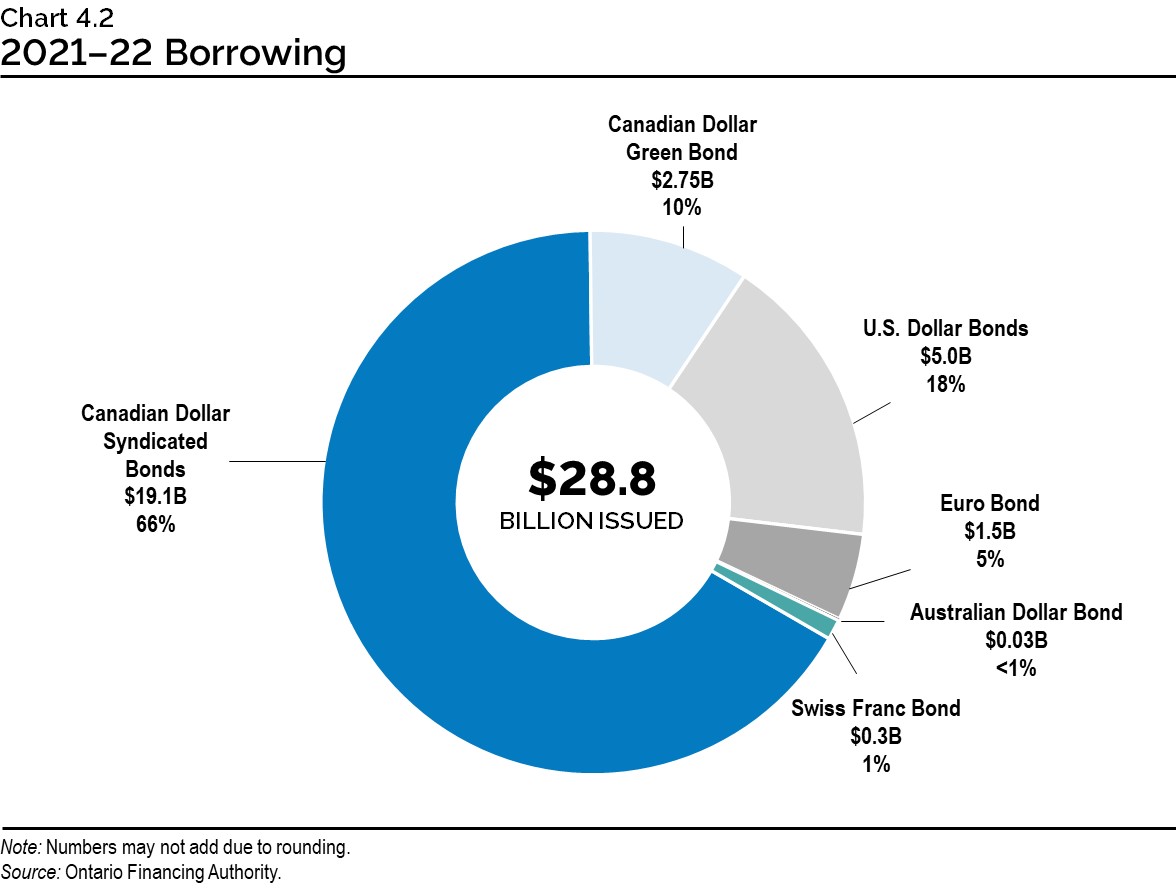
Chart 4.2: 2020–21 Borrowing
Long-term public borrowing of $28.8 billion has been completed for fiscal year 2021–22. This consisted of $19.1 billion (66 per cent) of Canadian dollar syndicated bonds, $2.75 billion (10 per cent) of Canadian dollar Green Bond, $5.0 billion (18 per cent) of U.S. dollar bonds, $1.5 billion (5 per cent) of euro bond, $0.3 billion (1 per cent) of Swiss franc bond, and $0.03 billion (<1 per cent) of Australian dollar bond.
Note: Numbers may not add due to rounding.
Source: Ontario Financing Authority.
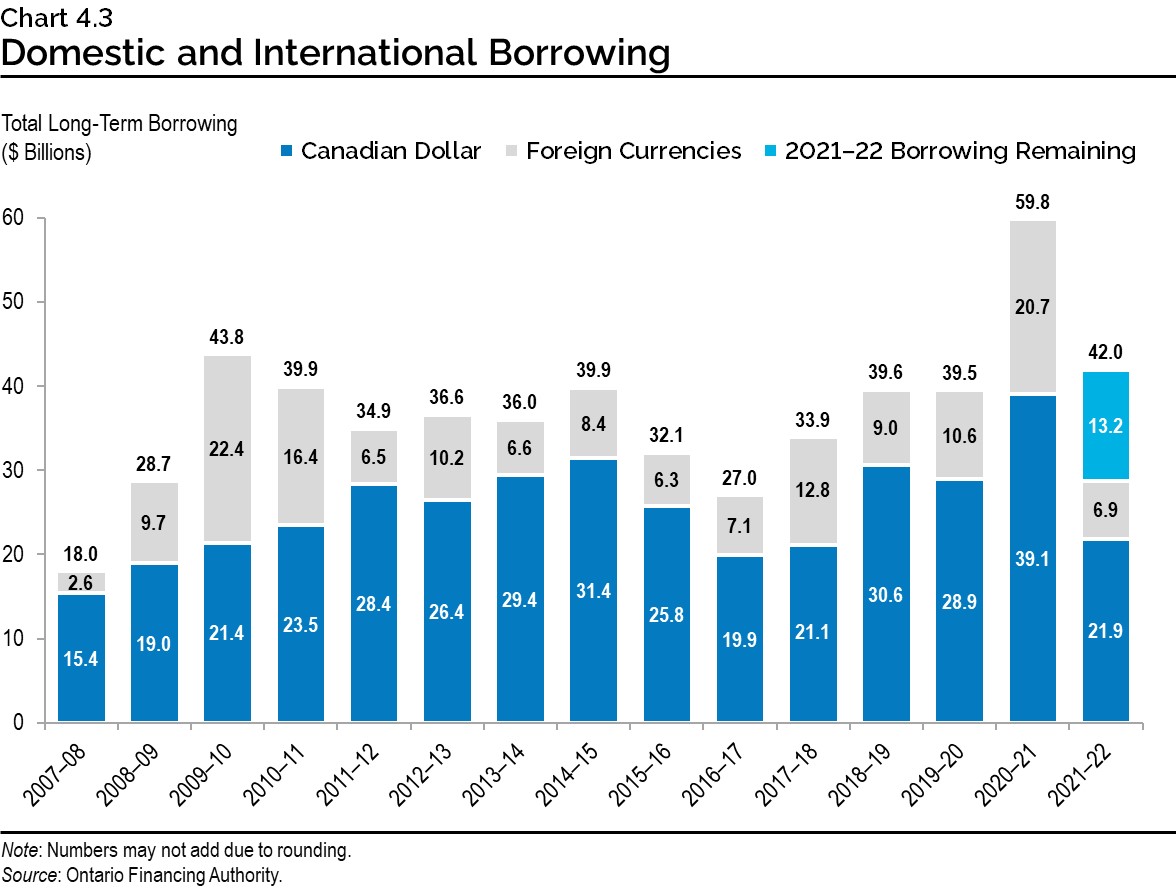
Chart 4.3: Domestic and International Borrowing
Ontario’s total long-term borrowing completed in 2021–22 is forecast to be $42.0 billion — $21.9 billion was borrowed in the Canadian dollar market and $6.9 billion was borrowed in foreign currencies, with $13.2 billion of borrowing remaining for 2021–22.
| Year | Canadian Dollar ($ Billions) | Foreign Currencies ($ Billions) | Total ($ Billions) |
|---|---|---|---|
| 2007–08 | 15.4 | 2.6 | 18.0 |
| 2008–09 | 19.0 | 9.7 | 28.7 |
| 2009–10 | 21.4 | 22.4 | 43.8 |
| 2010–11 | 23.5 | 16.4 | 39.9 |
| 2011–12 | 28.4 | 6.5 | 34.9 |
| 2012–13 | 26.4 | 10.2 | 36.6 |
| 2013–14 | 29.4 | 6.6 | 36.0 |
| 2014–15 | 31.4 | 8.4 | 39.9 |
| 2015–16 | 25.8 | 6.3 | 32.1 |
| 2016–17 | 19.9 | 7.1 | 27.0 |
| 2017–18 | 21.1 | 12.8 | 33.9 |
| 2018–19 | 30.6 | 9.0 | 39.6 |
| 2019–20 | 28.9 | 10.6 | 39.5 |
| 2020–21 | 39.1 | 20.7 | 59.8 |
| 2021–22 | 21.9 | 6.9 | 42.0 |
Note: Numbers may not add due to rounding.
Source: Ontario Financing Authority.
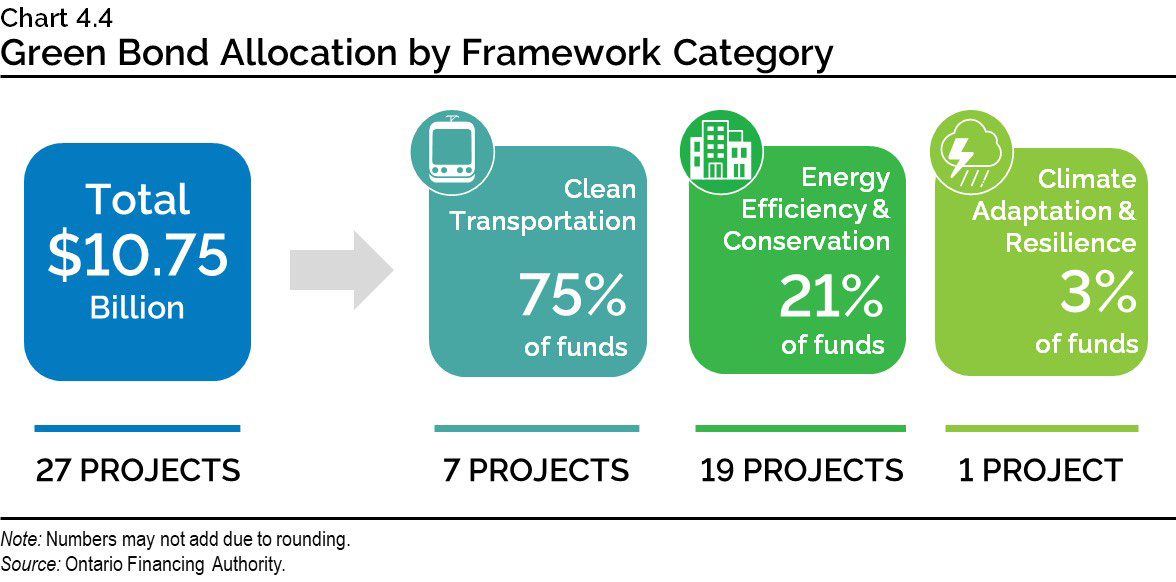
Chart 4.4: Green Bond Allocation by Framework Category
A total of $10.75 billion in Green Bond funding has provided funding for 27 projects. Seven of those projects are under the Clean Transportation framework category and have received 75 per cent of the funding. Nineteen projects are under the Energy Efficiency and Conservation category and have received 21 per cent of the funding. One project is under the Climate Adaptation and Resilience category and has received three per cent of the funding.
Note: Numbers may not add due to rounding.
Source: Ontario Financing Authority.
Chart 4.5: Ontario’s Green Bond Issues
Since 2014, Ontario has issued Green Bonds totalling $10.75 billion.
| Year | 2014–15 | 2015–16 | 2016–17 | 2017–18 | 2018–19 | 2019–20 | 2020–21 | 2021–22 |
|---|---|---|---|---|---|---|---|---|
| Green Bond Issues ($) | $500 million | $750 million | $800 million | $1.0 billion | $950 million | $1.25 billion | $2.75 billion | $2.75 billion |
Source: Ontario Financing Authority.
Chart 4.6: Effective Interest Rate (Weighted Average) on Total Debt
As of September 30, 2021, the effective interest rate (calculated as a weighted average) for fiscal year-end is forecast to be 3.0 per cent on the province’s total debt.
| Year | Effective Interest Rate (Per Cent) |
|---|---|
| 1990–91 | 10.9 |
| 1991–92 | 10.7 |
| 1992–93 | 10.1 |
| 1993–94 | 9.5 |
| 1994–95 | 9.8 |
| 1995–96 | 9.4 |
| 1996–97 | 9.0 |
| 1997–98 | 9.0 |
| 1998–99 | 8.6 |
| 1999–00 | 8.4 |
| 2000–01 | 8.2 |
| 2001–02 | 7.6 |
| 2002–03 | 7.2 |
| 2003–04 | 6.7 |
| 2004–05 | 6.4 |
| 2005–06 | 6.1 |
| 2006–07 | 6.0 |
| 2007–08 | 5.8 |
| 2008–09 | 5.2 |
| 2009–10 | 4.6 |
| 2010–11 | 4.5 |
| 2011–12 | 4.4 |
| 2012–13 | 4.1 |
| 2013–14 | 3.9 |
| 2014–15 | 3.7 |
| 2015–16 | 3.6 |
| 2016–17 | 3.5 |
| 2017–18 | 3.6 |
| 2018–19 | 3.6 |
| 2019–20 | 3.4 |
| 2020–21 | 3.0 |
| 2021–22* | 3.0 |
*As of September 30, 2021.
Sources: Public Accounts of Ontario (1990–1991 to 2020–2021) and Ontario Financing Authority.
Chart 4.7: Average Annual Ontario Borrowing Rates
| Year | Actuals (Per Cent) | 2021 Ontario Economic Outlook and Fiscal Review (Per Cent) |
|---|---|---|
| 2009–10 | 3.27 | – |
| 2010–11 | 3.42 | – |
| 2011–12 | 3.07 | – |
| 2012–13 | 2.50 | – |
| 2013–14 | 2.93 | – |
| 2014–15 | 2.67 | – |
| 2015–16 | 2.25 | – |
| 2016–17 | 2.09 | – |
| 2017–18 | 2.31 | – |
| 2018–19 | 2.81 | – |
| 2019–20 | 2.15 | – |
| 2020–21 | 1.39 | – |
| 2021–22 | – | 1.90 |
| 2022–23 | – | 2.40 |
| 2023–24 | – | 3.20 |
Sources: Public Accounts of Ontario (2009–2010 to 2020–2021)and Ontario Financing Authority.
Chart 4.8: Interest on Debt Expense Forecast
| Year | 2021 Ontario Economic Outlook and Fiscal Review ($ Billions) | 2021 Budget ($ Billions) |
|---|---|---|
| 2020–21 | 12.3* | 12.3* |
| 2021–22 | 13.0 | 13.1 |
| 2022–23 | 13.1 | 13.7 |
| 2023–24 | 13.8 | 14.6 |
* Public Accounts of Ontario 2020–2021.
Source: Ontario Ministry of Finance.
Chart 4.9: Weighted-Average Term of Borrowings
The average term of Ontario’s debt portfolio has been extended from 9.7 years in 2009–10 to 10.9 years in 2021–22. The weighted-average borrowing term for 2021–22 was 14.5 years as of October 19, 2021.
| Year | 2009–10 | 2010–11 | 2011–12 | 2012–13 | 2013–14 | 2014–15 | 2015–16 | 2016–17 | 2017–18 | 2018–19 | 2019–20 | 2020–21 | 2021–22 |
|---|---|---|---|---|---|---|---|---|---|---|---|---|---|
| Weighted-Average Borrowing Term (Years) | 8.1 | 12.8 | 13.0 | 12.4 | 13.6 | 14.1 | 14.2 | 13.9 | 12.1 | 12.9 | 14.5 | 11.7 | 14.5 |
| Debt Portfolio Average Term (Years) | 9.7 | 10.0 | 10.1 | 10.1 | 10.4 | 10.7 | 10.9 | 10.9 | 10.7 | 10.7 | 10.9 | 10.8 | 10.9* |
*As of September 30, 2021.
Source: Ontario Financing Authority.
Chart 4.10: Average Unrestricted Liquid Reserve Levels
Average unrestricted liquid reserve levels are forecast to be $49.7 billion as of September 30, 2021.
| Year | Average Unrestricted Liquid Reserve Levels ($ Billions) |
|---|---|
| 2009–10 | 14.4 |
| 2010–11 | 19.4 |
| 2011–12 | 20.2 |
| 2012–13 | 23.3 |
| 2013–14 | 24.9 |
| 2014–15 | 23.6 |
| 2015–16 | 21.7 |
| 2016–17 | 21.1 |
| 2017–18 | 30.1 |
| 2018–19 | 32.7 |
| 2019–20 | 32.3 |
| 2020–21 | 46.2 |
| 2021–22* | 49.7 |
* Forecasted as of September 30, 2021.
Source: Ontario Financing Authority.
Chart 4.11: Net Debt-to-GDP
Ontario’s net debt-to-GDP ratio is forecast at 43.4 per cent in 2021–22.
| Year | Net Debt-to-GDP (Per Cent) | Faster Growth Scenario (Per Cent) | Slower Growth Scenario (Per Cent) |
|---|---|---|---|
| 1990–91 | 13.4 | – | – |
| 1991–92 | 17.1 | – | – |
| 1992–93 | 21.1 | – | – |
| 1993–94 | 26.6 | – | – |
| 1994–95 | 28.3 | – | – |
| 1995–96 | 30.1 | – | – |
| 1996–97 | 31.2 | – | – |
| 1997–98 | 30.5 | – | – |
| 1998–99 | 29.4 | – | – |
| 1999–00 | 32.1 | – | – |
| 2000–01 | 29.3 | – | – |
| 2001–02 | 28.2 | – | – |
| 2002–03 | 26.8 | – | – |
| 2003–04 | 27.5 | – | – |
| 2004–05 | 26.8 | – | – |
| 2005–06 | 27.8 | – | – |
| 2006–07 | 27.1 | – | – |
| 2007–08 | 26.6 | – | – |
| 2008–09 | 27.8 | – | – |
| 2009–10 | 32.3 | – | – |
| 2010–11 | 34.5 | – | – |
| 2011–12 | 36.6 | – | – |
| 2012–13 | 38.2 | – | – |
| 2013–14 | 39.7 | – | – |
| 2014–15 | 40.5 | – | – |
| 2015–16 | 40.3 | – | – |
| 2016–17 | 39.7 | – | – |
| 2017–18 | 39.3 | – | – |
| 2018–19 | 39.4 | – | – |
| 2019–20 | 39.6 | – | – |
| 2020–21 | 43.9 | 43.9 | 43.9 |
| 2021–22 | 43.4 | 42.4 | 43.8 |
| 2022–23 | 43.5 | 41.3 | 45.1 |
| 2023–24 | 43.6 | 40.4 | 45.9 |
Sources: Statistics Canada and Ontario Ministry of Finance.
Chart 4.12: Net Debt-to-Revenue
Ontario’s net debt-to-revenue ratio is forecast to be 239 per cent in 2021–22.
| Year | Net Debt-to-Revenue Ratio (Per Cent) | Faster Growth Scenario (Per Cent) | Slower Growth Scenario (Per Cent) |
|---|---|---|---|
| 1990–91 | 78 | – | – |
| 1991–92 | 104 | – | – |
| 1992–93 | 126 | – | – |
| 1993–94 | 157 | – | – |
| 1994–95 | 168 | – | – |
| 1995–96 | 176 | – | – |
| 1996–97 | 187 | – | – |
| 1997–98 | 184 | – | – |
| 1998–99 | 182 | – | – |
| 1999–00 | 189 | – | – |
| 2000–01 | 183 | – | – |
| 2001–02 | 183 | – | – |
| 2002–03 | 177 | – | – |
| 2003–04 | 188 | – | – |
| 2004–05 | 170 | – | – |
| 2005–06 | 162 | – | – |
| 2006–07 | 153 | – | – |
| 2007–08 | 146 | – | – |
| 2008–09 | 164 | – | – |
| 2009–10 | 189 | – | – |
| 2010–11 | 192 | – | – |
| 2011–12 | 208 | – | – |
| 2012–13 | 216 | – | – |
| 2013–14 | 225 | – | – |
| 2014–15 | 234 | – | – |
| 2015–16 | 225 | – | – |
| 2016–17 | 223 | – | – |
| 2017–18 | 215 | – | – |
| 2018–19 | 220 | – | – |
| 2019–20 | 226 | – | – |
| 2020–21 | 227 | 227 | 227 |
| 2021–22 | 239 | 233 | 242 |
| 2022–23 | 251 | 238 | 261 |
| 2023–24 | 253 | 233 | 269 |
Sources: Public Accounts of Ontario (1990–1991 to 2020–2021) and Ontario Financing Authority.
Chart 4.13: Interest on Debt-to-Revenue
Ontario’s interest on debt-to-revenue ratio is forecast to be 7.7 per cent in 2021–22.
| Year | Interest on Debt-to-Revenue Ratio (Per Cent) | Faster Growth Scenario (Per Cent) | Slower Growth Scenario (Per Cent) |
|---|---|---|---|
| 1990–91 | 7.7 | – | – |
| 1991–92 | 8.8 | – | – |
| 1992–93 | 10.8 | – | – |
| 1993–94 | 13.9 | – | – |
| 1994–95 | 14.5 | – | – |
| 1995–96 | 14.6 | – | – |
| 1996–97 | 14.8 | – | – |
| 1997–98 | 14.2 | – | – |
| 1998–99 | 14.3 | – | – |
| 1999–00 | 15.5 | – | – |
| 2000–01 | 15.0 | – | – |
| 2001–02 | 14.2 | – | – |
| 2002–03 | 12.9 | – | – |
| 2003–04 | 12.9 | – | – |
| 2004–05 | 11.1 | – | – |
| 2005–06 | 9.7 | – | – |
| 2006–07 | 8.9 | – | – |
| 2007–08 | 8.4 | – | – |
| 2008–09 | 8.7 | – | – |
| 2009–10 | 8.9 | – | – |
| 2010–11 | 8.8 | – | – |
| 2011–12 | 9.1 | – | – |
| 2012–13 | 9.0 | – | – |
| 2013–14 | 9.1 | – | – |
| 2014–15 | 8.9 | – | – |
| 2015–16 | 8.5 | – | – |
| 2016–17 | 8.3 | – | – |
| 2017–18 | 7.9 | – | – |
| 2018–19 | 8.1 | – | – |
| 2019–20 | 8.0 | – | – |
| 2020–21 | 7.4 | 7.4 | 7.4 |
| 2021–22 | 7.7 | 7.6 | 7.8 |
| 2022–23 | 7.7 | 7.3 | 8.0 |
| 2023–24 | 7.8 | 7.1 | 8.3 |
Sources: Public Accounts of Ontario (1990–1991 to 2020–2021) and Ontario Financing Authority.